Ultrasound-Assisted Extraction of Total Flavonoids from Pteris cretica L.: Process Optimization, HPLC Analysis, and Evaluation of Antioxidant Activity

Abstract
:1. Introduction
2. Materials and Methods
2.1. Chemicals and Reagents
2.2. Plant Material
2.3. Optimization of UAE of TF from P. cretica
2.3.1. Single-Factor Experiments
2.3.2. RSM Design
2.4. Conventional Heat Reflux Extraction (HRE)
2.5. Measurement of Total Flavonoids Content (TFC)
2.6. HPLC Analysis
2.7. Method Validation
2.8. Evaluation of Antioxidant Activity
2.8.1. Assay of DPPH• Radical Scavenging Activity
2.8.2. Assay of ABTS+• Radical Scavenging Activity
2.8.3. Assay of NO• Radical Scavenging Activity
2.8.4. Assay of Fe2+ Chelating Activity
2.9. Statistical Analysis
3. Results
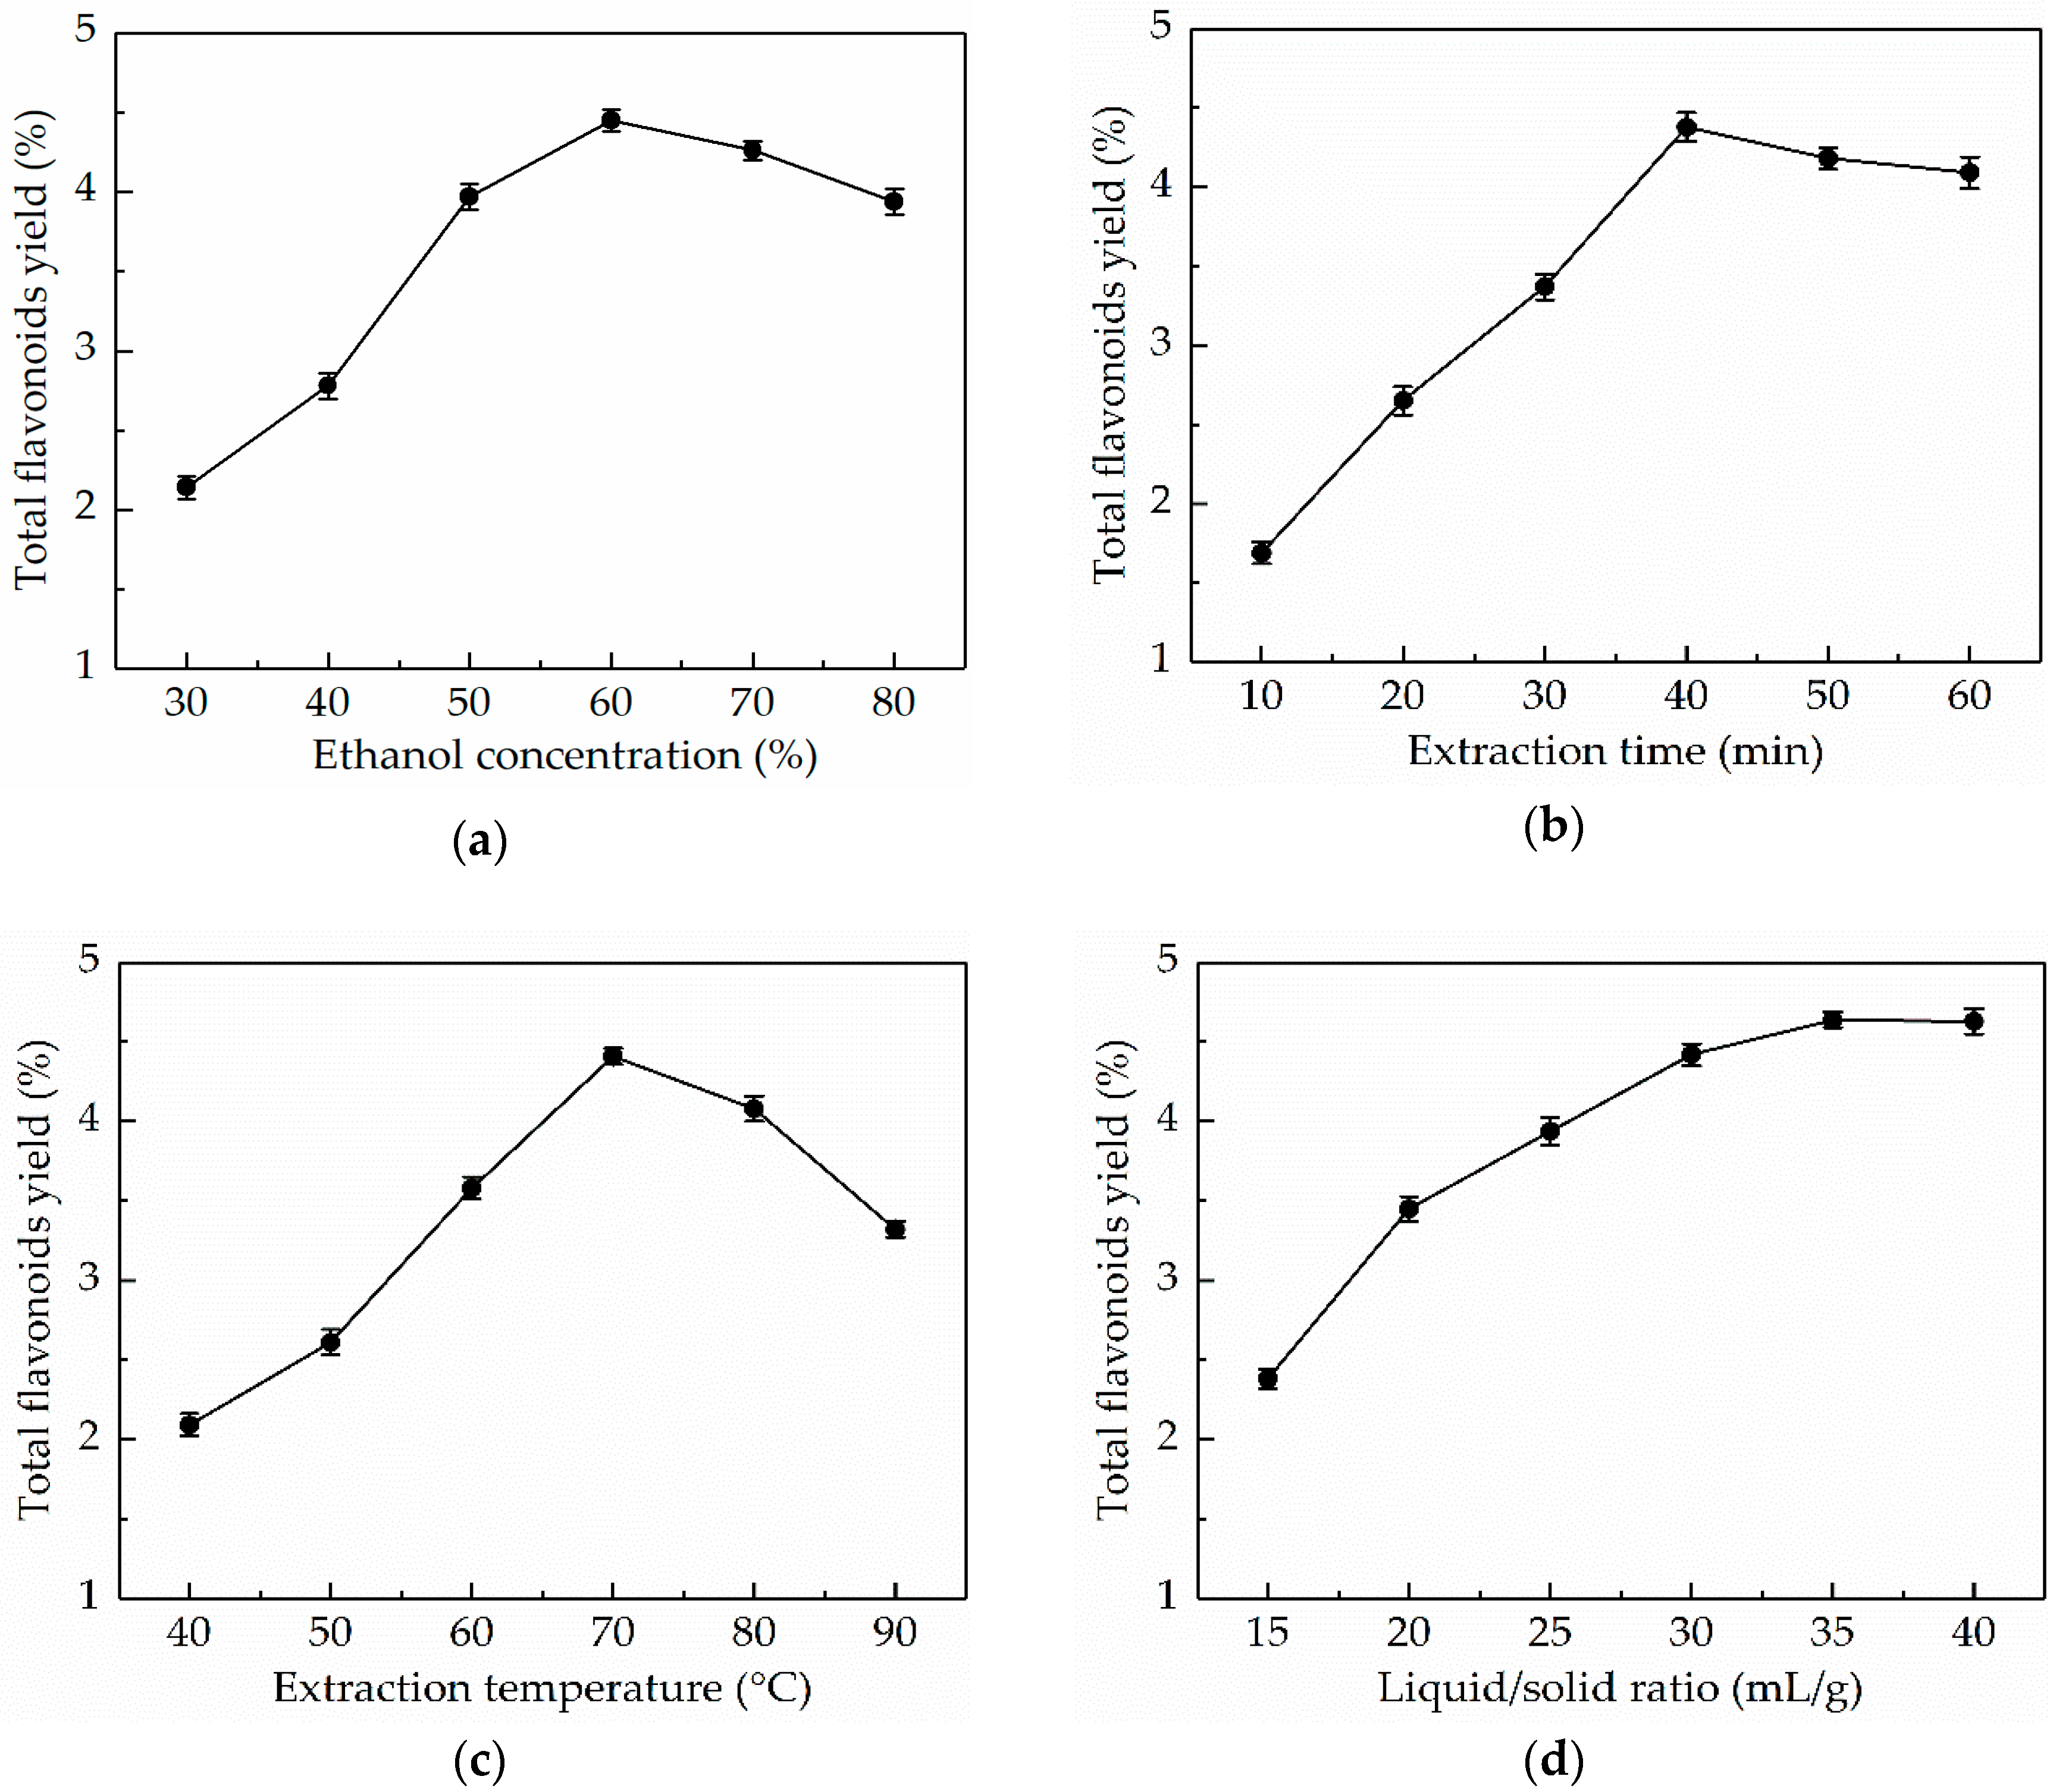
3.1. Single-Factor Experiments
3.1.1. Effect of Ethanol Concentration on the TFY
3.1.2. Effect of Extraction Time on the TFY
3.1.3. Effect of Extraction Temperature on the TFY
3.1.4. Effect of Liquid/Solid Ratio on the TFY
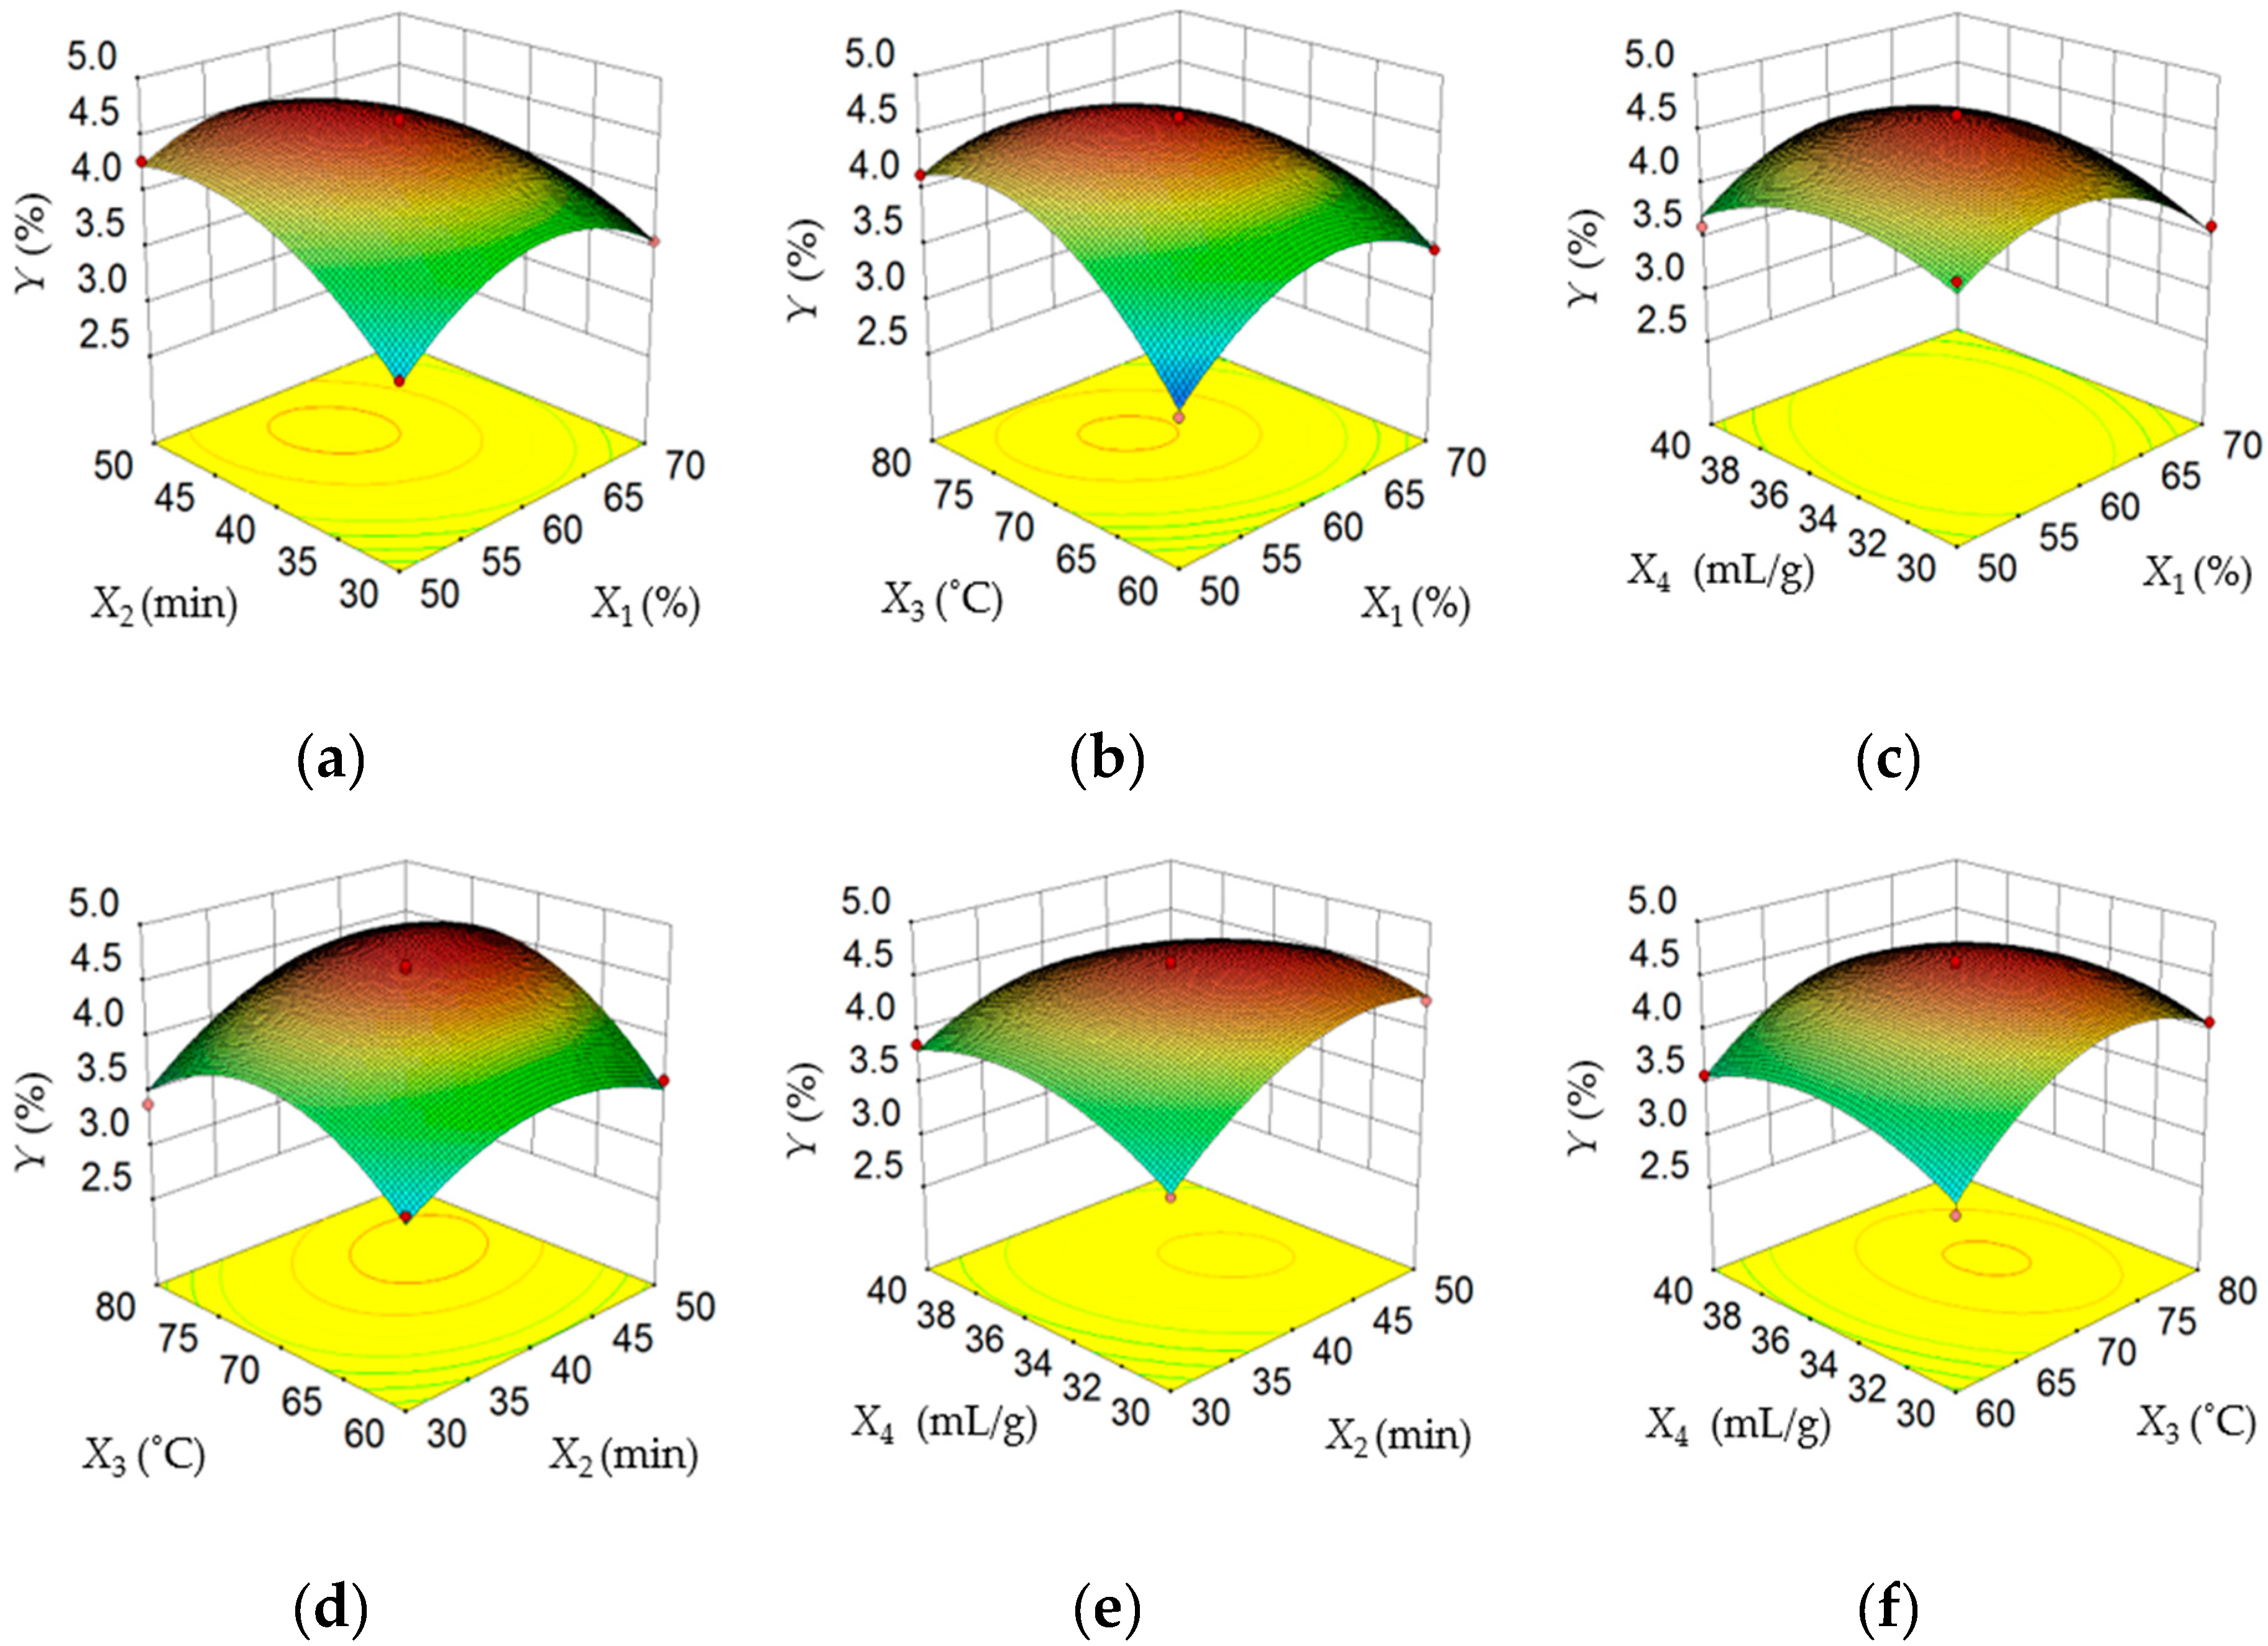
3.2. Optimization of UAE Process by RSM
3.2.1. Model Fitting and Statistical Analysis
3.2.2. Response Surface Analysis
3.2.3. Validation of the Optimized Model
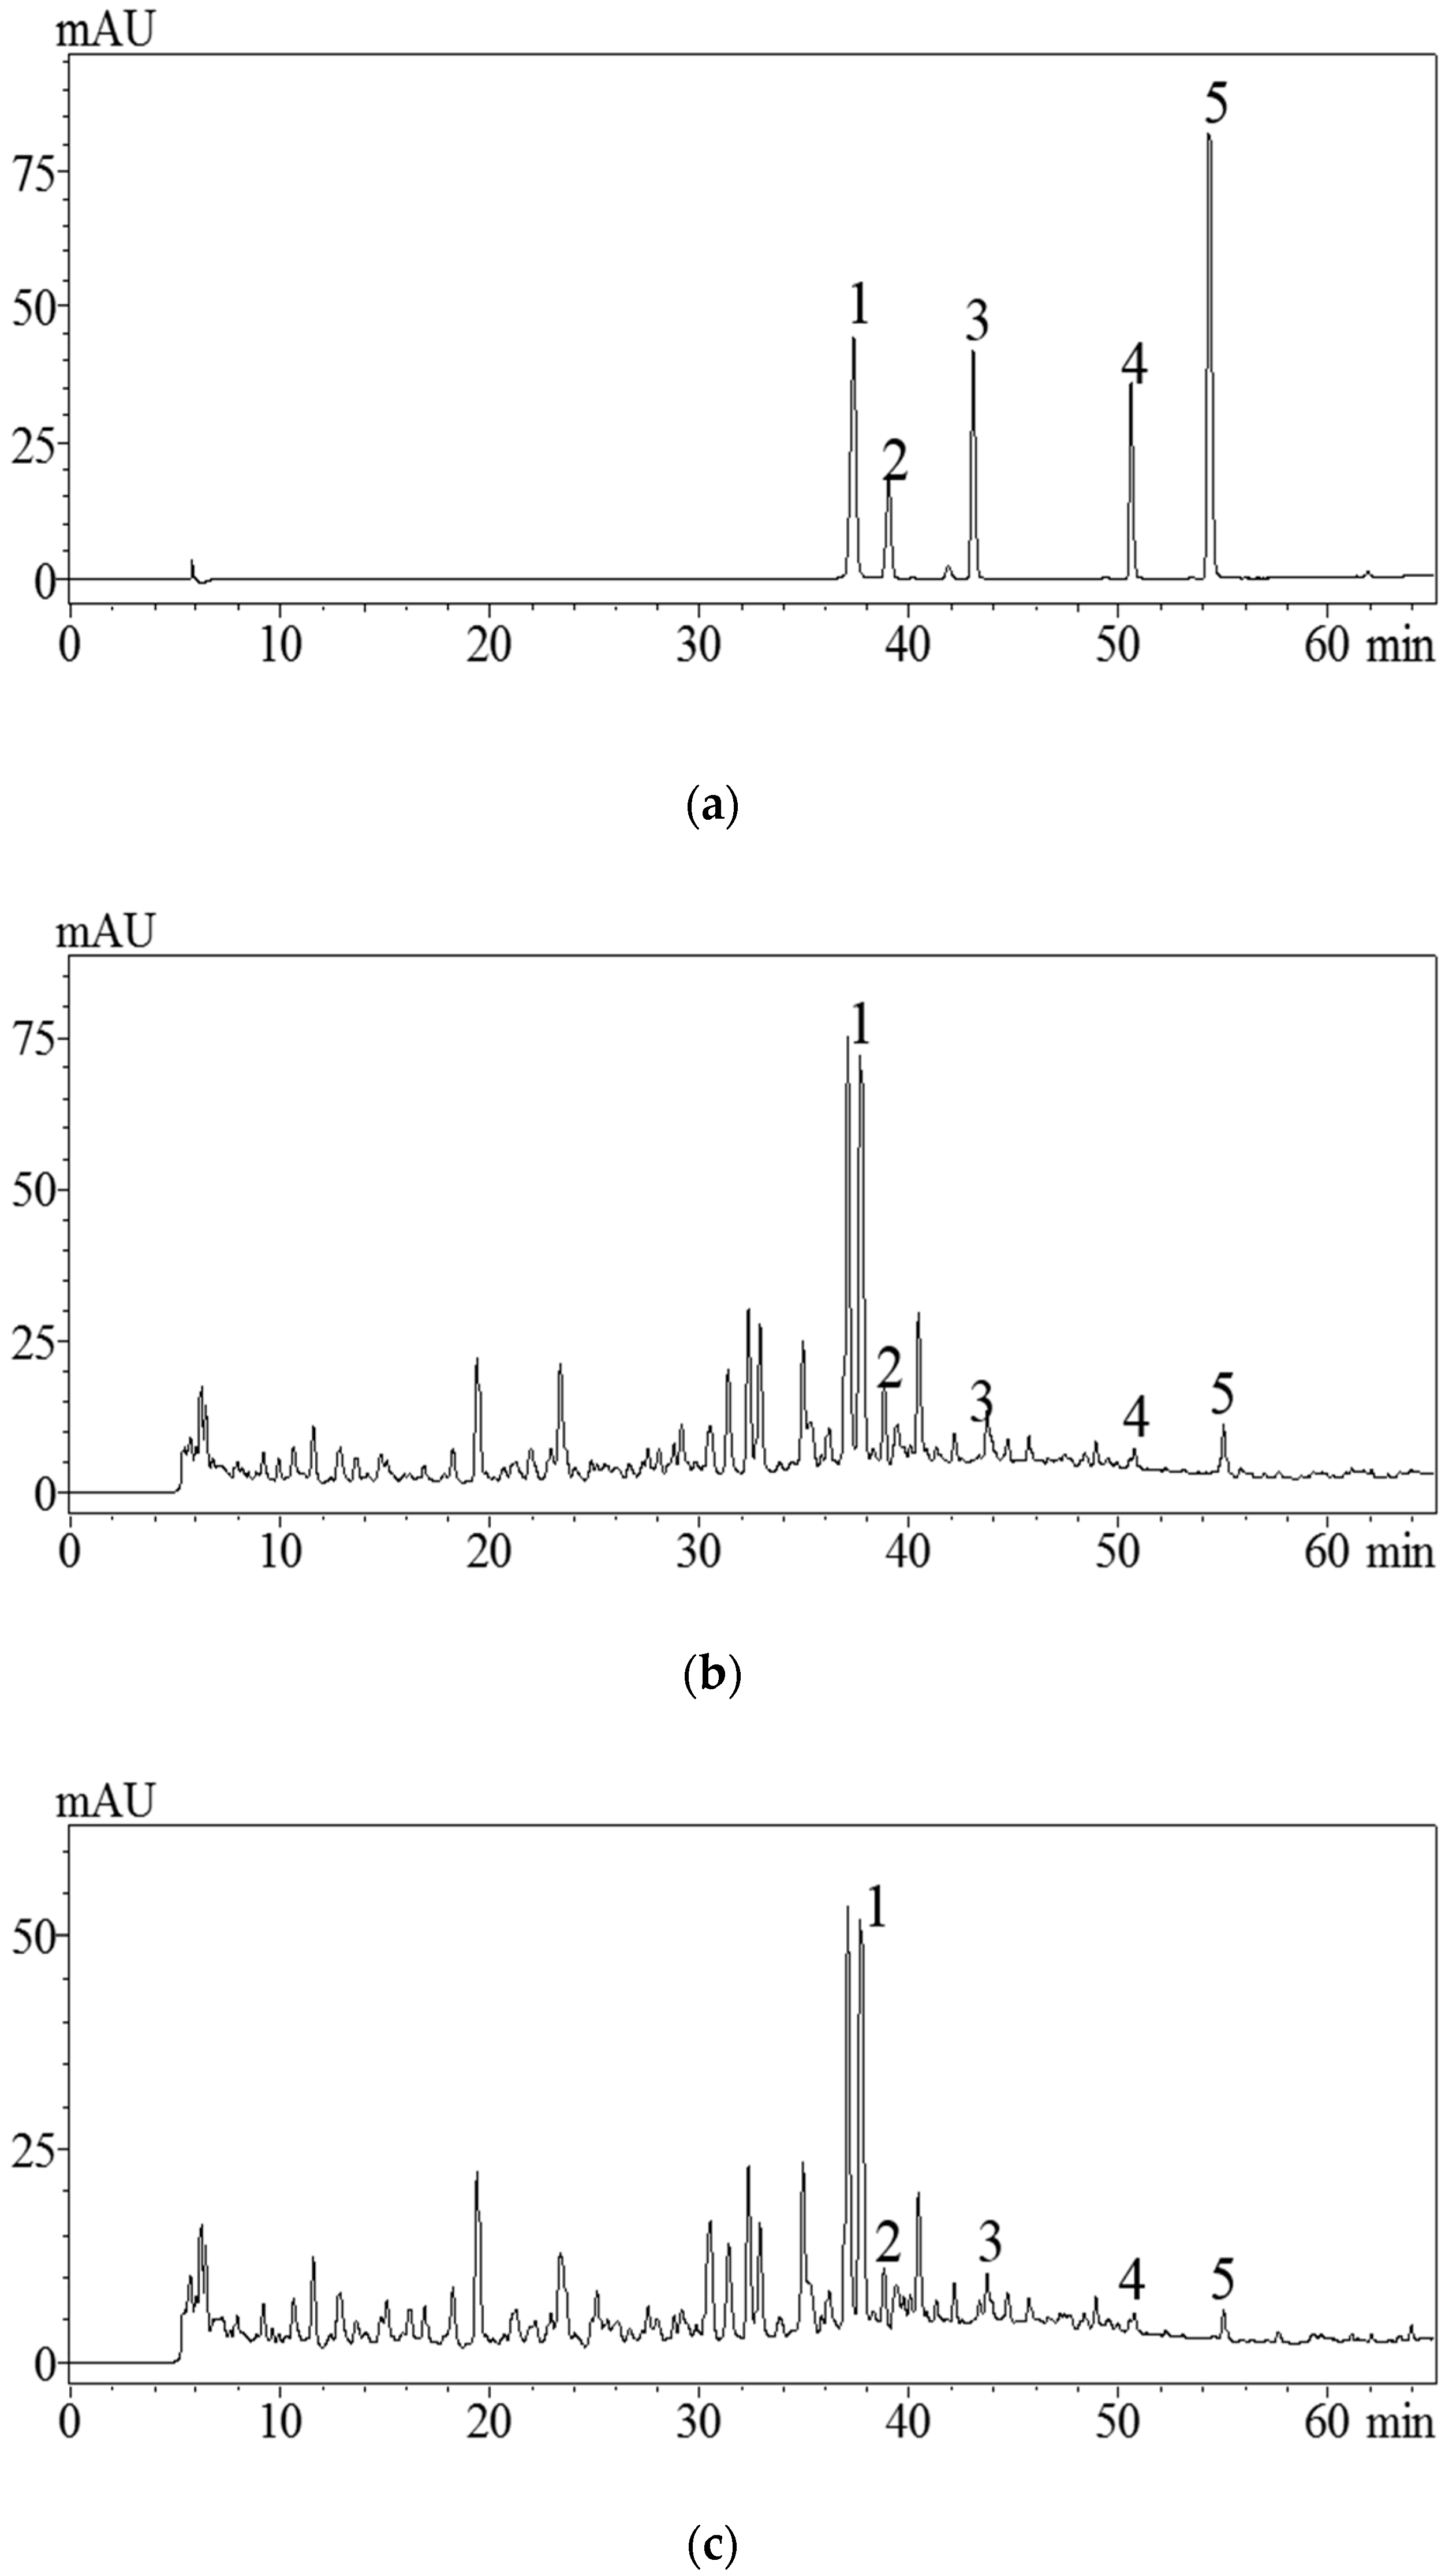
3.3. Method Validation for Quantitative Analysis of Five Flavonoids
3.4. Analysis of Flavonoids in the Extracts by HPLC
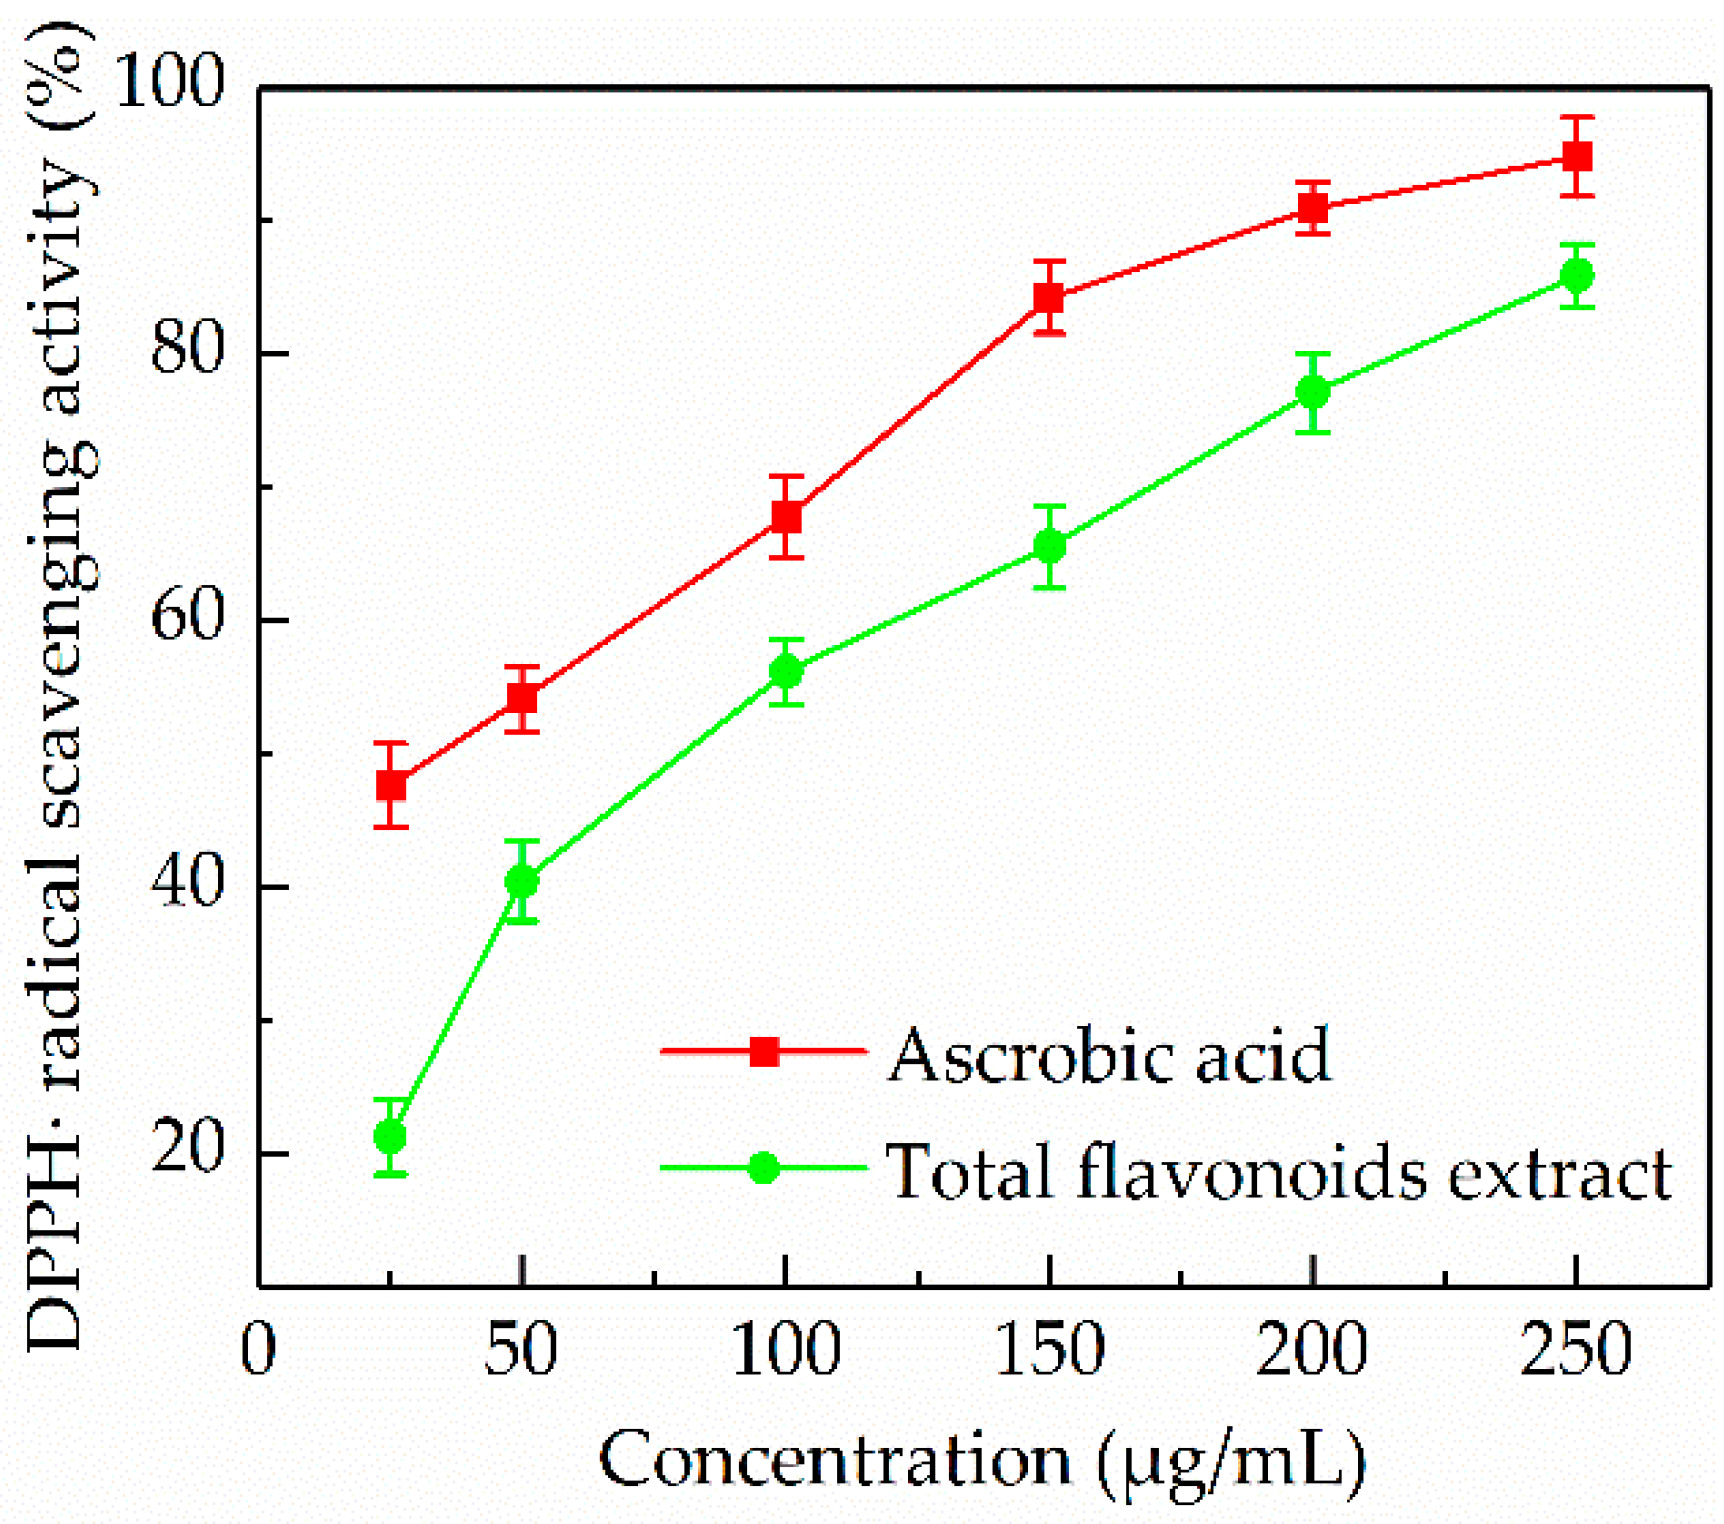
3.5. Antioxidant Activity
3.5.1. DPPH• Radical Scavenging Activity
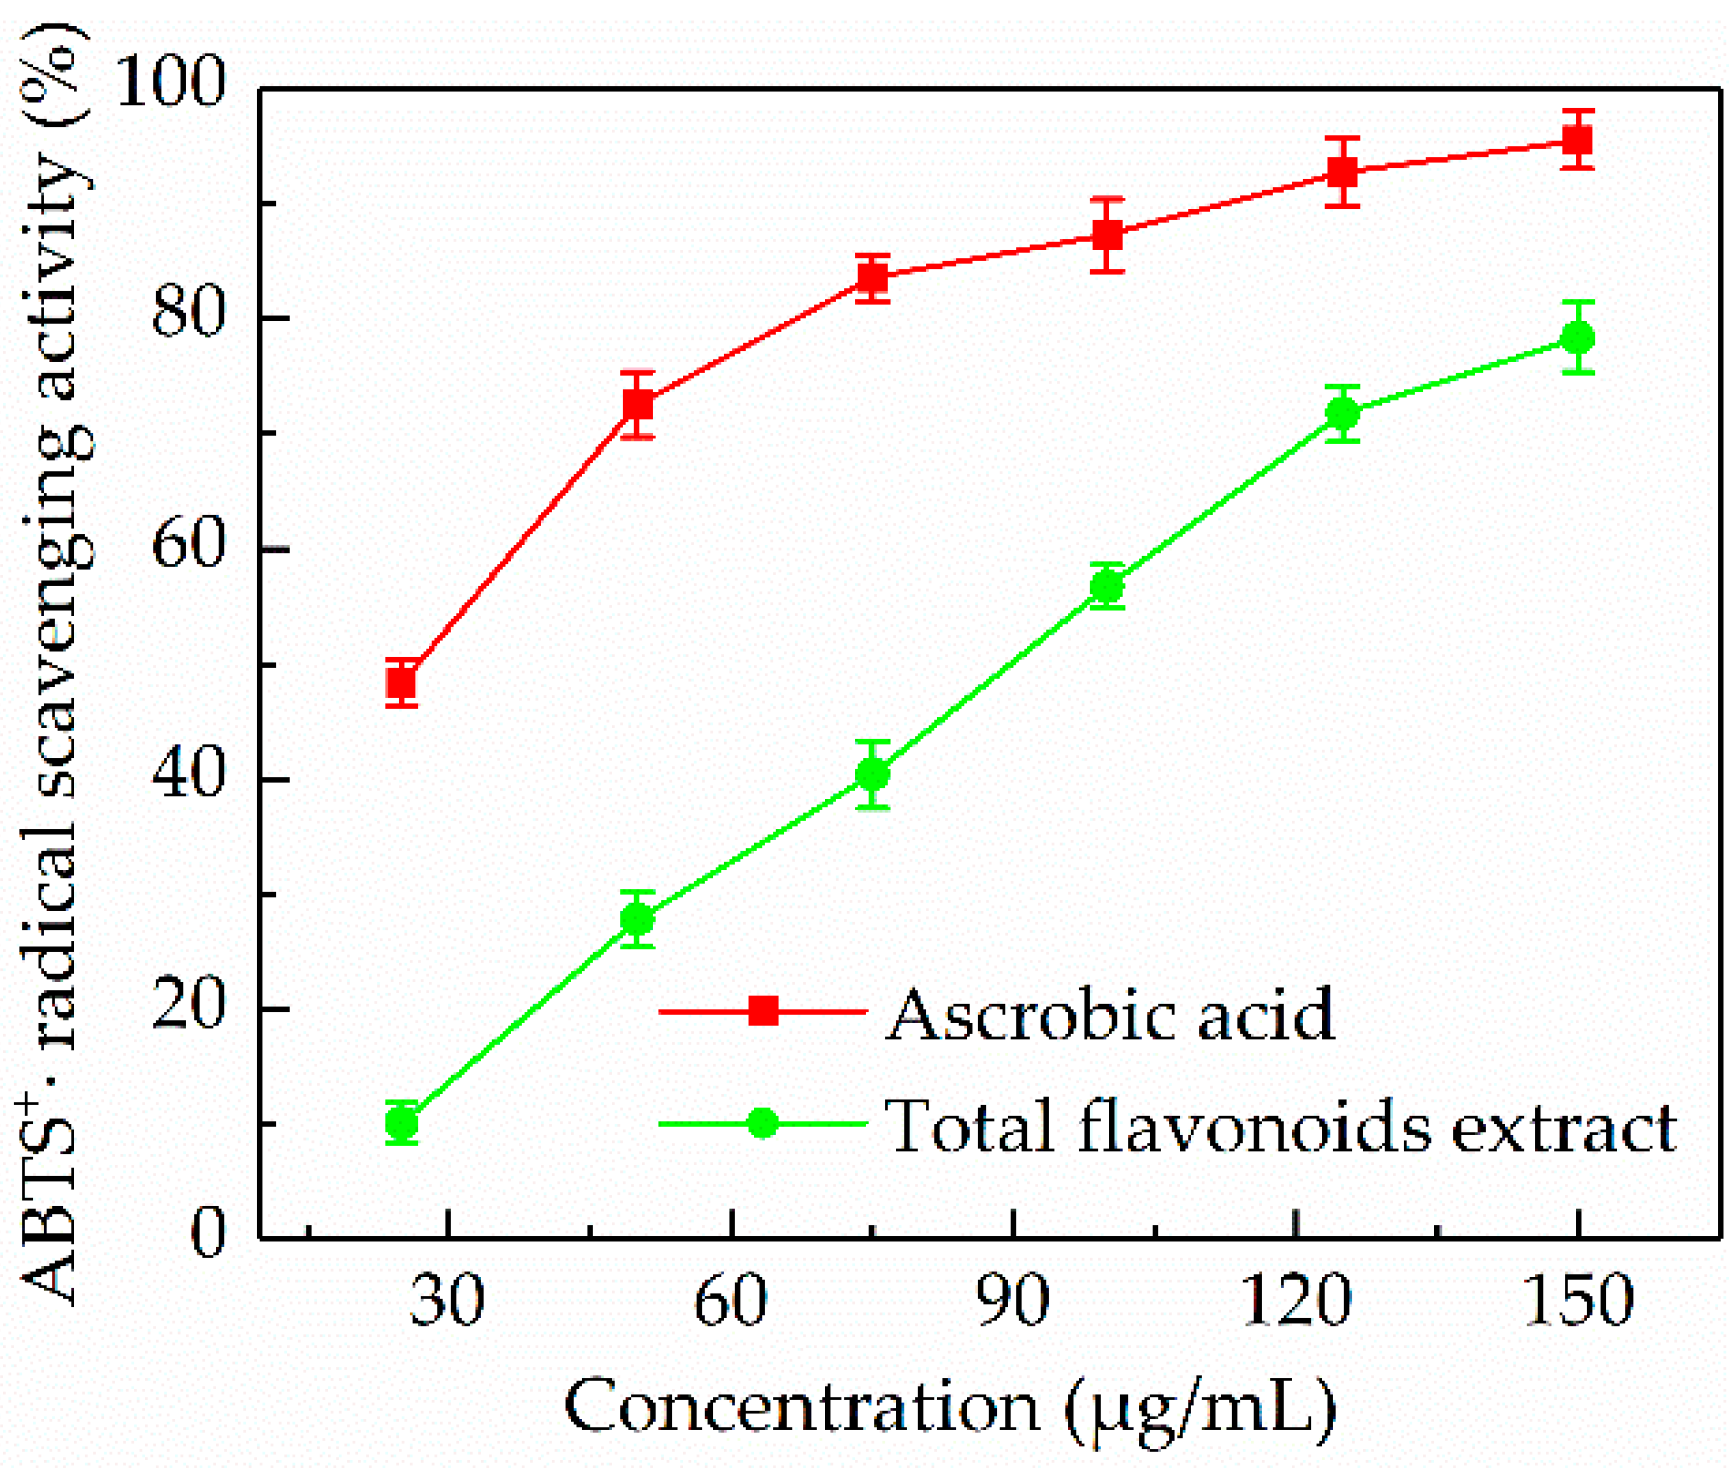
3.5.2. ABTS+• Radical Scavenging Activity
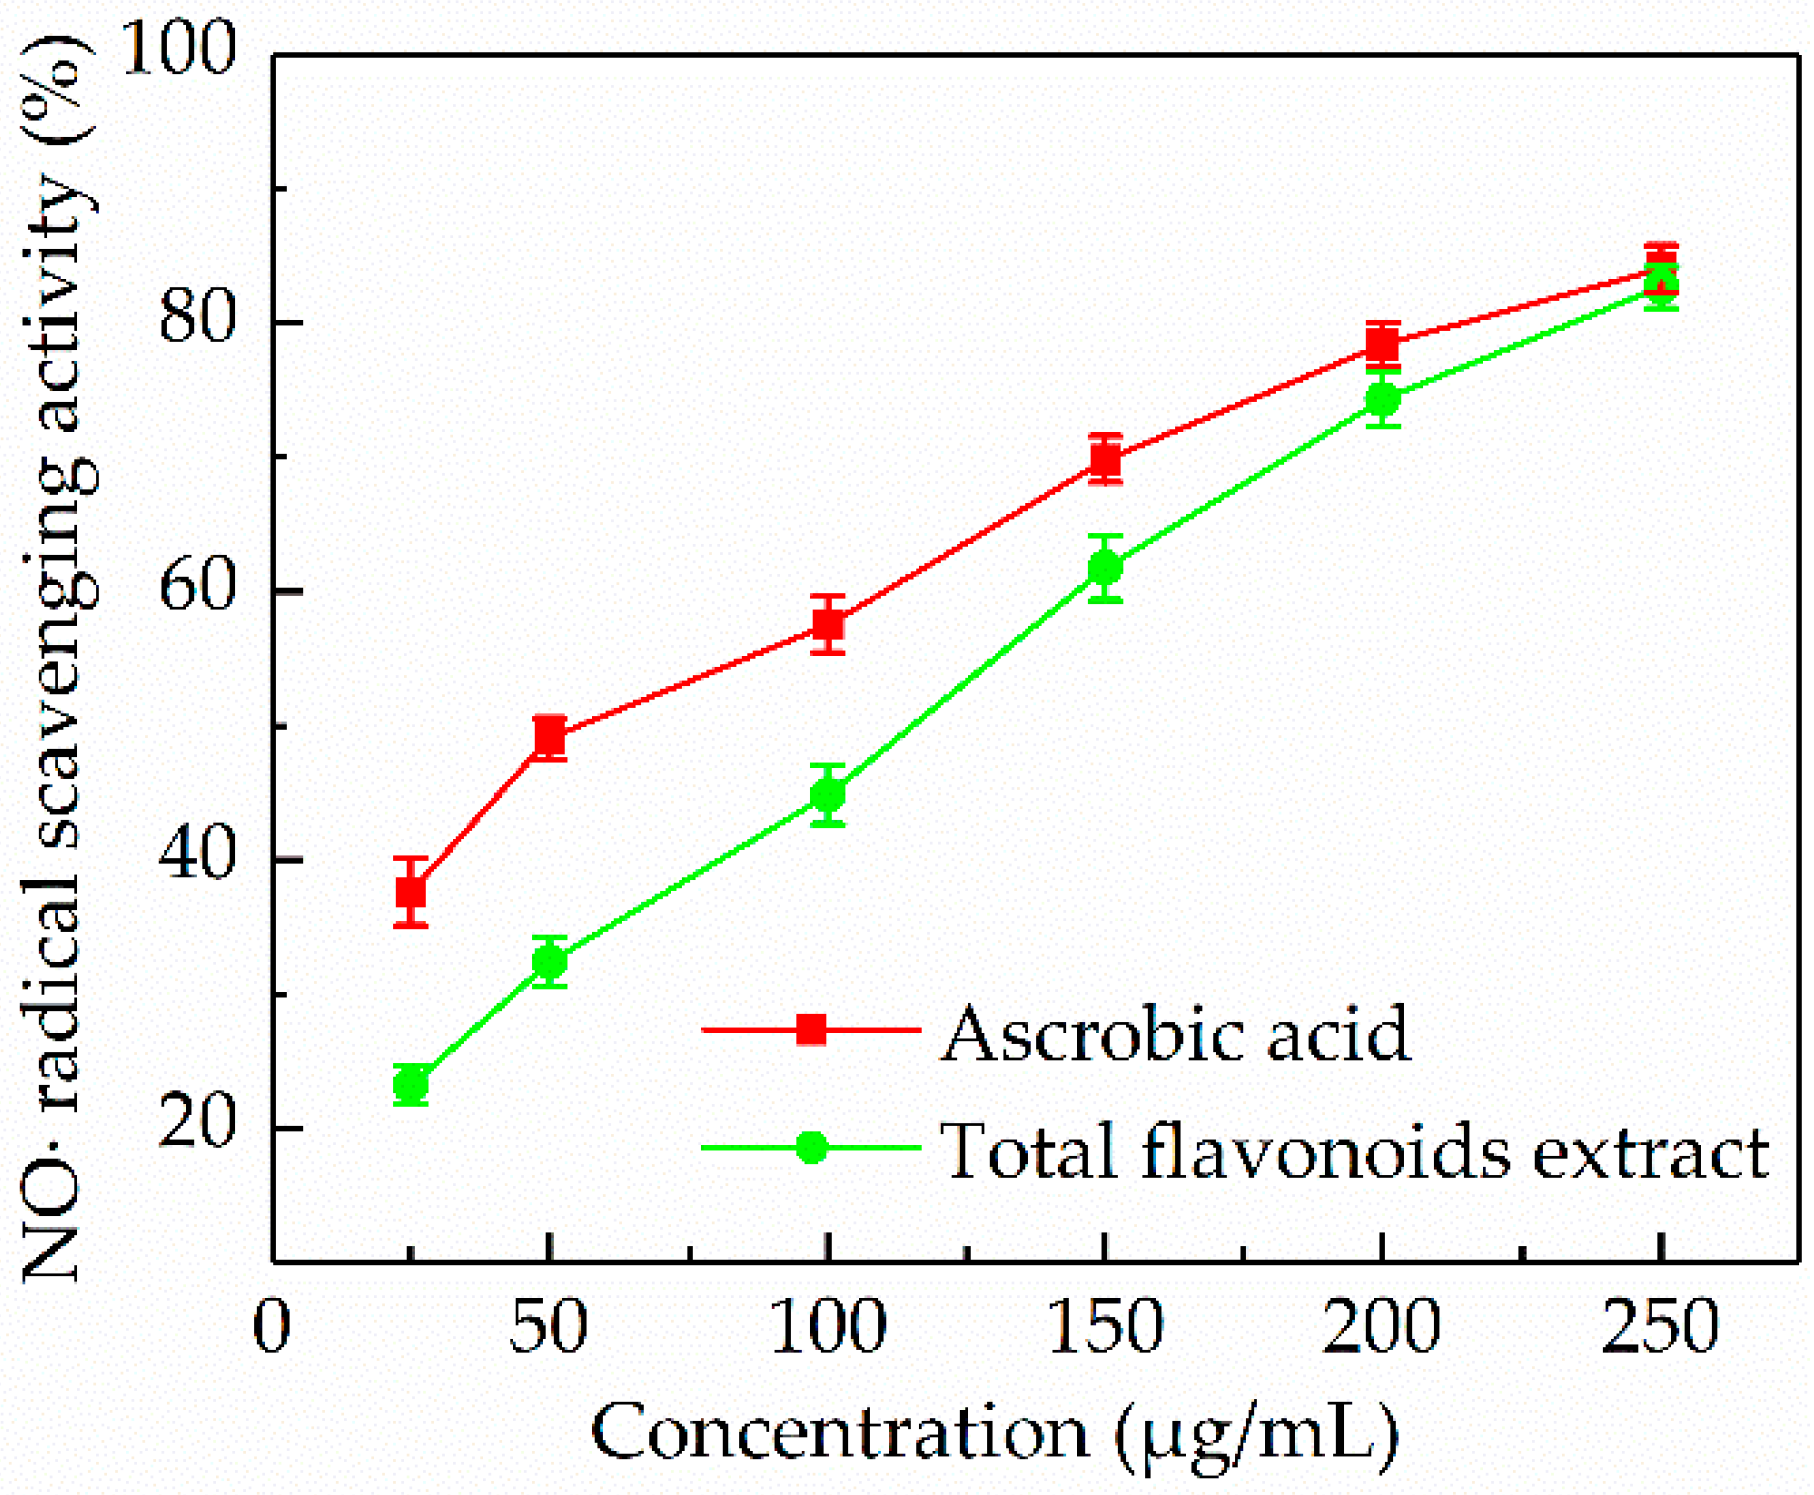
3.5.3. NO• Radical Scavenging Activity
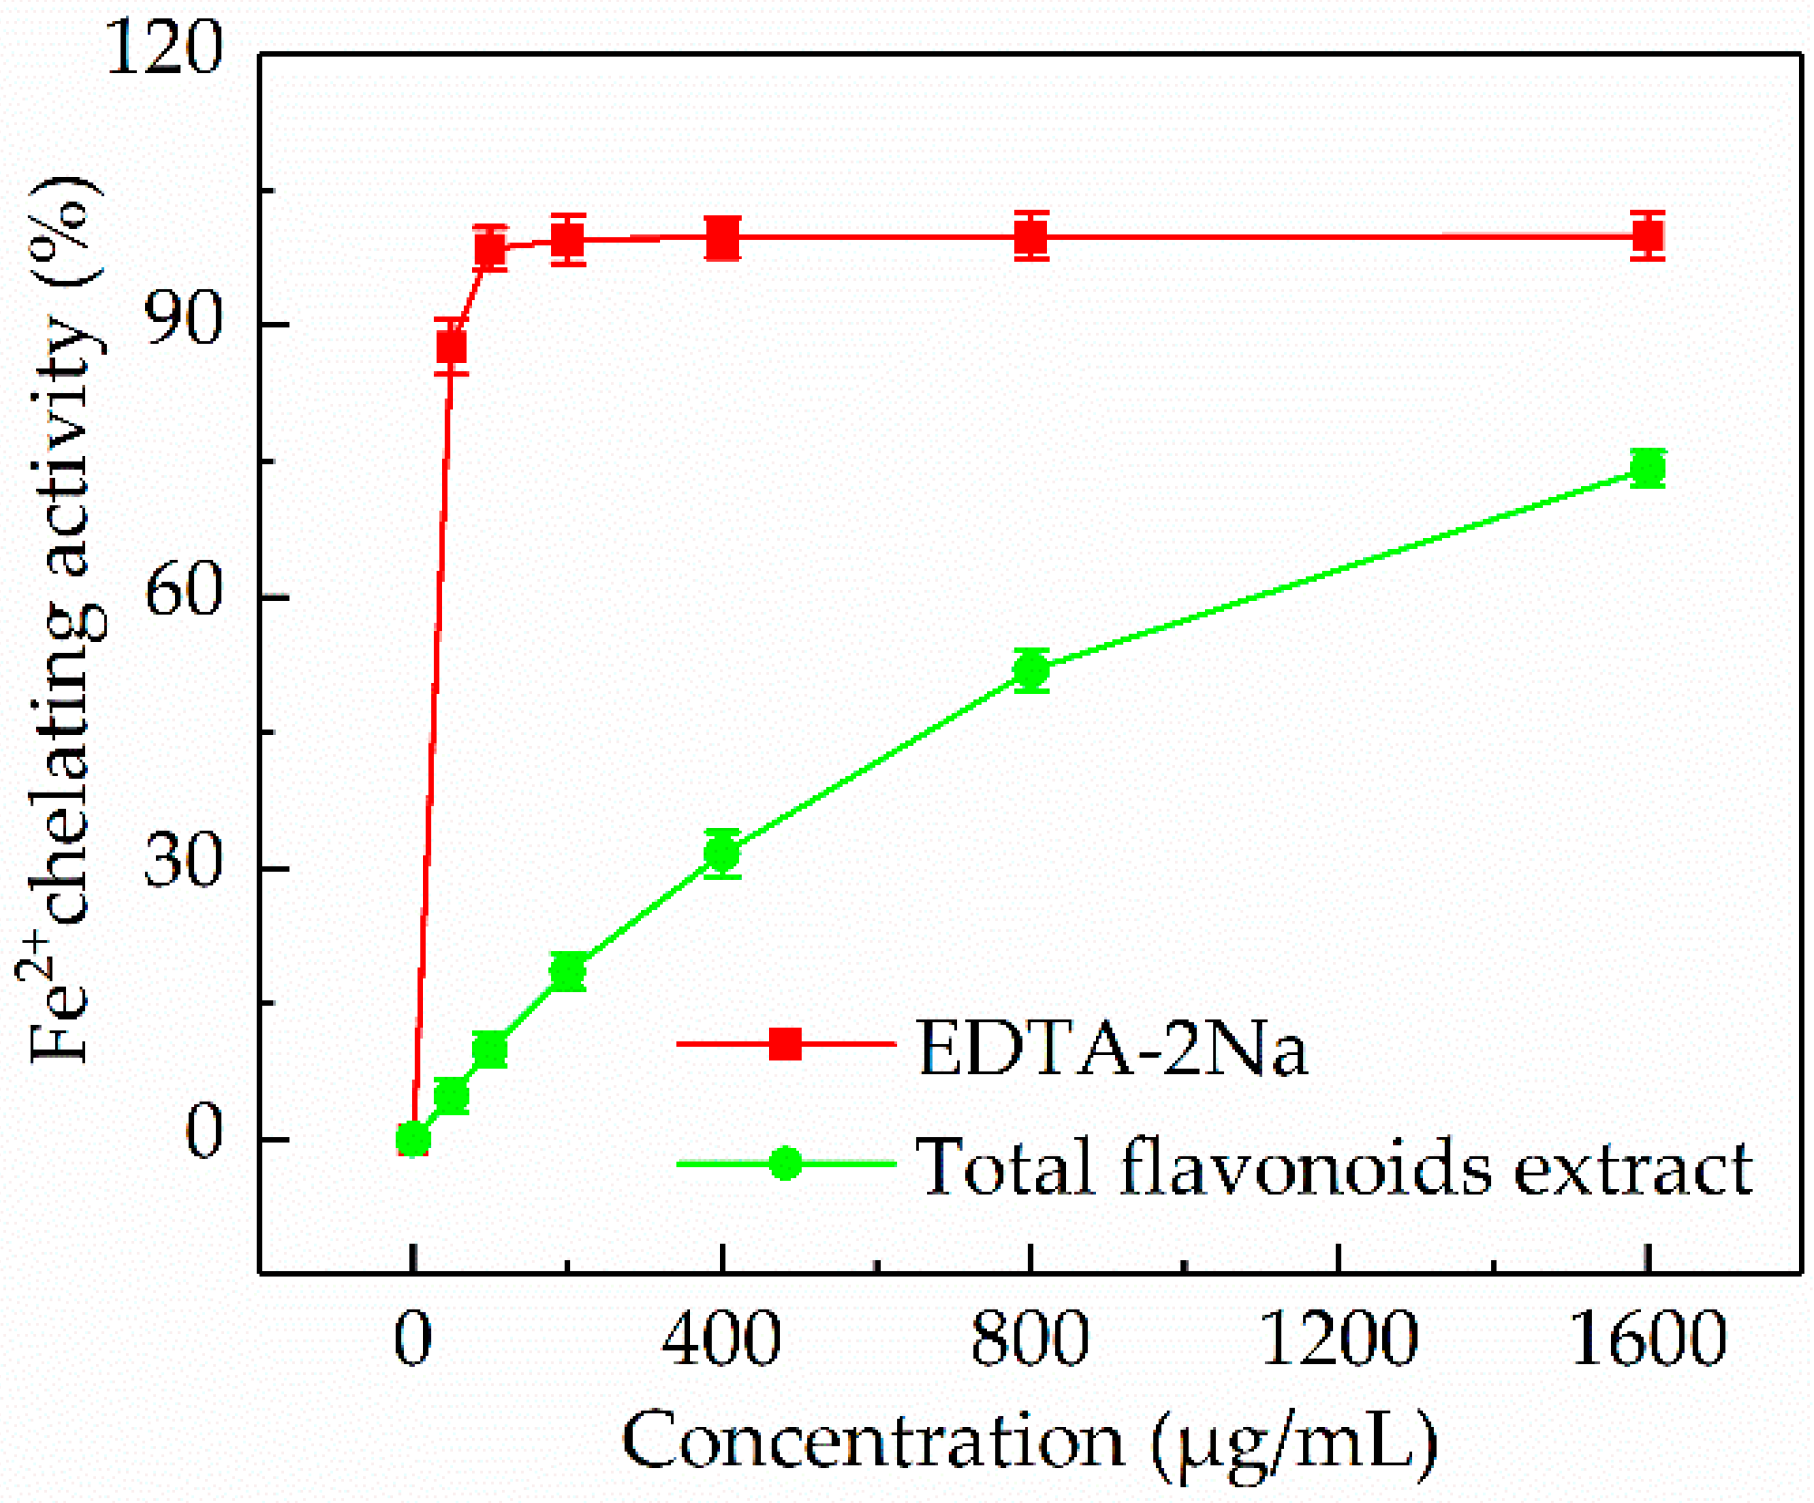
3.5.4. Fe2+ Chelating Activity
4. Conclusions
Author Contributions
Funding
Conflicts of Interest
References
- Chao, Y.S.; Rouhan, G.; Amoroso, V.B.; Chiou, W.L. Molecular phylogeny and biogeography of the fern genus Pteris (Pteridaceae). Ann. Bot. 2014, 114, 109–124. [Google Scholar] [CrossRef] [PubMed]
- Testo, W.L.; Watkins, J.E.; Pittermann, J.; Momin, R. Pteris × caridadiae (Pteridaceae), a new hybrid fern from Costa Rica. Brittonia 2015, 67, 138–143. [Google Scholar] [CrossRef]
- Harinantenaina, L.; Matsunami, K.; Otsuka, H. Chemical constituents of Pteris cretica Linn. (Pteridaceae). Biochem. Syst. Ecol. 2009, 37, 133–137. [Google Scholar] [CrossRef]
- Qiu, M.; Yang, B.; Cao, D.; Zhu, J.; Jin, J.; Chen, Y.; Zhou, L.; Luo, X.; Zhao, Z. Two new hydroxylated ent-kauranoic acids from Pteris semipinnata. Phytochem. Lett. 2016, 16, 156–162. [Google Scholar] [CrossRef]
- Harinantenaina, L.; Matsunami, K.; Otsuka, H. Chemical and biologically active constituents of Pteris multifida. J. Nat. Med. 2008, 62, 452–455. [Google Scholar] [CrossRef] [PubMed]
- Wang, H.B.; Wong, M.H.; Lan, C.Y.; Qin, Y.R.; Shu, W.S.; Qiu, R.L.; Ye, Z.H. Effect of arsenic on flavonoid contents in Pteris species. Biochem. Syst. Ecol. 2010, 38, 529–537. [Google Scholar] [CrossRef]
- Imperato, F.; Nazzaro, R. Luteolin 7-O-sophoroside from Pteris cretica. Phytochemistry 1996, 41, 337–338. [Google Scholar] [CrossRef]
- Luo, X.; Li, C.; Luo, P.; Lin, X.; Ma, H.; Seeram, N.P.; Song, C.; Xu, J.; Gu, Q. Pterosin sesquiterpenoids from Pteris cretica as hypolipidemic agents via activating liver X receptors. J. Nat. Prod. 2016, 79, 3014–3021. [Google Scholar] [CrossRef]
- Ge, X.; Ye, G.; Li, P.; Tang, W.J.; Gao, J.L.; Zhao, W.M. Cytotoxic diterpenoids and sesquiterpenoids from Pteris multifida. J. Nat. Prod. 2008, 71, 227–231. [Google Scholar] [CrossRef]
- Shi, Y.S.; Zhang, Y.; Hu, W.Z.; Zhang, X.F.; Fu, X.; Lv, X. Dihydrochalcones and diterpenoids from Pteris ensiformis and their bioactivities. Molecules 2017, 22, 1413. [Google Scholar] [CrossRef]
- Kim, J.W.; Seo, J.Y.; Oh, W.K.; Sung, S.H. Anti-neuroinflammatory ent-kaurane diterpenoids from Pteris multifida roots. Molecules 2017, 22, 27. [Google Scholar] [CrossRef] [PubMed]
- Singh, M.; Govindarajan, R.; Rawat, A.K.S.; Khare, P.B. Antimicrobial flavonoid rutin from Pteris vittata L. against pathogenic gastrointestinal microflora. Am. Fern J. 2008, 98, 98–104. [Google Scholar] [CrossRef]
- Chen, Y.H.; Chang, F.R.; Lin, Y.J.; Wang, L.; Chen, J.F.; Wu, Y.C.; Wu, M.J. Identification of phenolic antioxidants from Sword Brake fern (Pteris ensiformis Burm.). Food Chem. 2007, 105, 48–56. [Google Scholar] [CrossRef]
- Dai, G.C.; Hu, B.; Zhang, W.F.; Peng, F.; Wang, R.; Liu, Z.Y.; Xue, B.X.; Liu, J.Y.; Shan, Y.X. Chemical characterization, anti-benign prostatic hyperplasia effect and subchronic toxicity study of total flavonoid extract of Pteris multifida. Food Chem. Toxicol. 2017, 108, 524–531. [Google Scholar] [CrossRef] [PubMed]
- Yang, R.F.; Geng, L.L.; Lu, H.Q.; Fan, X.D. Ultrasound-synergized electrostatic field extraction of total flavonoids from Hemerocallis citrina baroni. Ultrason. Sonochem. 2017, 34, 571–579. [Google Scholar] [CrossRef] [PubMed]
- Delgado-Povedano, M.M.; de Castro, M.D.L. A review on enzyme and ultrasound: A controversial but fruitful relationship. Anal. Chim. Acta 2015, 889, 1–21. [Google Scholar] [CrossRef] [PubMed]
- Wen, C.; Zhang, J.; Zhang, H.; Dzah, C.S.; Zandile, M.; Duan, Y.; Ma, H.; Luo, X. Advances in ultrasound assisted extraction of bioactive compounds from cash crops—A review. Ultrason. Sonochem. 2018, 48, 538–549. [Google Scholar] [CrossRef]
- Jing, C.L.; Dong, X.F.; Tong, J.M. Optimization of ultrasonic-assisted extraction of flavonoid compounds and antioxidants from alfalfa using response surface method. Molecules 2015, 20, 15550–15571. [Google Scholar] [CrossRef]
- Zhang, H.; Xie, G.; Tian, M.; Pu, Q.; Qin, M. Optimization of the ultrasonic-assisted extraction of bioactive flavonoids from Ampelopsis grossedentata and subsequent separation and purification of two flavonoid aglycones by high-speed counter-current chromatography. Molecules 2016, 21, 1096. [Google Scholar] [CrossRef]
- Wang, B.; Qu, J.; Luo, S.; Feng, S.; Li, T.; Yuan, M.; Huang, Y.; Liao, J.; Yang, R.; Ding, C. Optimization of ultrasound-assisted extraction of flavonoids from olive (Olea europaea) leaves, and evaluation of their antioxidant and anticancer activities. Molecules 2018, 23, 2513. [Google Scholar] [CrossRef]
- Majd, M.H.; Rajaei, A.; Bashi, D.S.; Mortazavi, S.A.; Bolourian, S. Optimization of ultrasonic-assisted extraction of phenolic compounds from bovine pennyroyal (Phlomidoschema parviflorum) leaves using response surface methodology. Ind. Crop. Prod. 2014, 57, 195–202. [Google Scholar] [CrossRef]
- Balavigneswaran, C.K.; Kumar, T.S.J.; Packiaraj, R.M.; Veeraraj, A.; Prakash, S. Anti-oxidant activity of polysaccharides extracted from Isocrysis galbana using RSM optimized conditions. Int. J. Biol. Macromol. 2013, 60, 100–108. [Google Scholar] [CrossRef] [PubMed]
- Sun, Y.; Li, T.; Yan, J.; Liu, J. Technology optimization for polysaccharides (POP) extraction from the fruiting bodies of Pleurotus ostreatus by Box–Behnken statistical design. Carbohydr. Polym. 2010, 80, 242–247. [Google Scholar] [CrossRef]
- Wang, W.; Li, Q.; Liu, Y.; Chen, B. Ionic liquid-aqueous solution ultrasonic-assisted extraction of three kinds of alkaloids from Phellodendron amurense Rupr and optimize conditions use response surface. Ultrason. Sonochem. 2015, 24, 13–18. [Google Scholar] [CrossRef] [PubMed]
- Choi, J.; An, X.; Lee, B.H.; Lee, J.S.; Heo, H.J.; Kim, T.; Ahn, J.W.; Kim, D.O. Protective effects of bioactive phenolics from jujube (Ziziphus jujuba) seeds against H2O2–induced oxidative stress in neuronal PC-12 cells. Food Sci. Biotechnol. 2015, 24, 2219–2227. [Google Scholar] [CrossRef]
- Bae, I.K.; Ham, H.M.; Jeong, M.H.; Kim, D.H.; Kim, H.J. Simultaneous determination of 15 phenolic compounds and caffeine in teas and mate using RP-HPLC/UV detection: Method development and optimization of extraction process. Food Chem. 2015, 172, 469–475. [Google Scholar] [CrossRef]
- Zhou, F.; Zhang, L.; Gu, L.; Zhang, Y.; Hou, C.; Bi, K.; Chen, X.; Zhang, H. Simultaneous quantification of 13 compounds in Guanxin Shutong Capsule by HPLC method. J. Chromatogr. Sci. 2016, 54, 971–976. [Google Scholar] [CrossRef]
- Shukla, S.; Mehta, A.; Bajpai, V.K.; Shukla, S. In vitro antioxidant activity and total phenolic content of ethanolic leaf extract of Stevia rebaudiana Bert. Food Chem. Toxicol. 2009, 47, 2338–2343. [Google Scholar] [CrossRef]
- Awe, F.B.; Fagbemi, T.N.; Ifesan, B.O.T.; Badejo, A.A. Antioxidant properties of cold and hot water extracts of cocoa, Hibiscus flower extract, and ginger beverage blends. Food Res. Int. 2013, 52, 490–495. [Google Scholar] [CrossRef]
- Tohma, H.S.; Gulçin, I. Antioxidant and radical scavenging activity of aerial parts and roots of Turkish liquorice (Glycyrrhiza glabra L.). Int. J. Food Prop. 2010, 13, 657–671. [Google Scholar] [CrossRef]
- Liu, J.; Mu, T.; Sun, H.; Fauconnier, M.L. Optimization of ultrasonic-microwave synergistic extraction of flavonoids from sweet potato leaves by response surface methodology. J. Food Process Preserv. 2019, 43, e13928. [Google Scholar] [CrossRef]
- Dahmoune, F.; Spigno, G.; Moussi, K.; Remin, H.; Cherbal, A.; Madani, K. Pistacia lentiscus leaves as a source of phenolic compounds: Microwave-assisted extraction optimized and compared with ultrasound-assisted and conventional solvent extraction. Ind. Crop. Prod. 2014, 61, 31–40. [Google Scholar] [CrossRef]
- Prommuak, C.; De-Eknamkul, W.; Shotipruk, A.; Shotipruk, A. Extraction of flavonoids and carotenoids from Thai silk waste and antioxidant activity of extracts. Sep. Purif. Technol. 2008, 62, 444–448. [Google Scholar] [CrossRef]
- Guo, X.; Zou, X.; Sun, M. Optimization of extraction process by response surface methodology and preliminary characterization of polysaccharides from Phellinus igniarius. Carbohydr. Polym. 2010, 80, 344–349. [Google Scholar] [CrossRef]
- Feng, S.; Luo, Z.; Tao, B.; Chen, C. Ultrasonic-assisted extraction and purification of phenolic compounds from sugarcane (Saccharum officinarum L.) rinds. LWT Food Sci. Technol. 2015, 60, 970–976. [Google Scholar] [CrossRef]
- Chemat, F.; Rombaut, N.; Sicaire, A.G.; Meullemiestre, A.; Fabiano-Tixier, A.S.; Abert-Vian, M. Ultrasound assisted extraction of food and natural products. Mechanisms, techniques, combinations, protocols and applications. A review. Ultrason. Sonochem. 2017, 34, 540–560. [Google Scholar] [CrossRef]
- Clarke, G.; Ting, K.; Wiart, C.; Fry, J. High correlation of 2, 2-diphenyl-1-picrylhydrazyl (DPPH) radical scavenging, ferric reducing activity potential and total phenolics content indicates redundancy in use of all three assays to screen for antioxidant activity of extracts of plants from the Malaysian rainforest. Antioxidants 2013, 2, 1–10. [Google Scholar]
- Madsen, H.L.; Andersen, C.M.; Jørgensen, L.V.; Skibsted, L.H. Radical scavenging by dietary flavonoids. A kinetic study of antioxidant efficiencies. Eur. Food Res. Technol. 2000, 211, 240–246. [Google Scholar] [CrossRef]
- Re, R.; Pellegrini, N.; Proteggente, A.; Pannala, A.; Yang, M.; Rice-Evans, C. Antioxidant activity applying an improved ABTS radical cation decolorization assay. Free Radic. Biol. Med. 1999, 26, 1231–1237. [Google Scholar] [CrossRef]
- Pacher, P.; Beckman, J.S.; Liaudet, L. Nitric oxide and peroxynitrite in health and disease. Physiol. Rev. 2007, 87, 315–424. [Google Scholar] [CrossRef]
- Vanacker, S.A.B.E.; Tromp, M.N.J.L.; Haenen, G.R.M.M.; Vandervijgh, W.J.F.; Bast, A. Flavonoids as scavengers of nitric oxide radical. Biochem. Biophys. Res. Commun. 1995, 214, 755–759. [Google Scholar] [CrossRef] [PubMed]
- Gülçin, İ. Antioxidant activity of caffeic acid (3, 4-dihydroxycinnamic acid). Toxicology 2006, 217, 213–220. [Google Scholar] [CrossRef] [PubMed]


| Run | X1 (%) | X2 (min) | X3 (°C) | X4 (mL/g) | Y (%) |
|---|---|---|---|---|---|
| 1 | 60 (0) | 40 (0) | 70 (0) | 35 (0) | 4.64 |
| 2 | 70 (1) | 30 (−1) | 70 (0) | 35 (0) | 3.56 |
| 3 | 60 (0) | 30 (−1) | 70 (0) | 40 (1) | 3.87 |
| 4 | 60 (0) | 30 (−1) | 80 (1) | 35 (0) | 3.39 |
| 5 | 60 (0) | 40 (0) | 80 (1) | 30 (−1) | 4.08 |
| 6 | 50 (−1) | 40 (0) | 70 (0) | 40 (1) | 3.60 |
| 7 | 50 (−1) | 40 (0) | 60 (−1) | 35 (0) | 2.95 |
| 8 | 60 (0) | 40 (0) | 70 (0) | 35 (0) | 4.61 |
| 9 | 50 (−1) | 50 (1) | 70 (0) | 35 (0) | 4.27 |
| 10 | 50 (−1) | 40 (0) | 70 (0) | 30 (−1) | 3.97 |
| 11 | 70 (1) | 40 (0) | 70 (0) | 40 (1) | 3.63 |
| 12 | 60 (0) | 40 (0) | 80 (1) | 40 (1) | 4.04 |
| 13 | 60 (0) | 40 (0) | 60 (−1) | 40 (1) | 3.58 |
| 14 | 60 (0) | 40 (0) | 70 (0) | 35 (0) | 4.61 |
| 15 | 60 (0) | 50 (1) | 80 (1) | 35 (0) | 4.23 |
| 16 | 60 (0) | 40 (0) | 70 (0) | 35 (0) | 4.62 |
| 17 | 60 (0) | 40 (0) | 60 (−1) | 30 (−1) | 3.23 |
| 18 | 60 (0) | 50 (1) | 60 (−1) | 35 (0) | 3.61 |
| 19 | 60 (0) | 30 (−1) | 70 (0) | 30 (−1) | 3.38 |
| 20 | 70 (1) | 40 (0) | 60 (−1) | 35 (0) | 3.46 |
| 21 | 60 (0) | 50 (1) | 70 (0) | 40 (1) | 4.01 |
| 22 | 70 (1) | 40 (0) | 80 (1) | 35 (0) | 3.48 |
| 23 | 60 (0) | 40 (0) | 70 (0) | 35 (0) | 4.48 |
| 24 | 70 (1) | 50 (1) | 70 (0) | 35 (0) | 3.64 |
| 25 | 50 (−1) | 40 (0) | 80 (1) | 35 (0) | 4.13 |
| 26 | 60 (0) | 50 (1) | 70 (0) | 30 (−1) | 4.28 |
| 27 | 70 (1) | 40 (0) | 70 (0) | 30 (−1) | 3.61 |
| 28 | 50 (−1) | 30 (−1) | 70 (0) | 35 (0) | 3.27 |
| 29 | 60 (0) | 30 (−1) | 60 (−1) | 35 (0) | 3.33 |
| Source | Sum of Squares | Df | Mean Square | F-Value | p-Value |
|---|---|---|---|---|---|
| Model | 6.28 | 14 | 0.45 | 41.92 | <0.0001 |
| X1 | 0.055 | 1 | 0.055 | 5.11 | 0.0403 |
| X2 | 0.87 | 1 | 0.87 | 81.73 | <0.0001 |
| X3 | 0.85 | 1 | 0.85 | 79.22 | <0.0001 |
| X4 | 0.0027 | 1 | 0.0027 | 0.25 | 0.6233 |
| X1X2 | 0.21 | 1 | 0.21 | 19.77 | 0.0006 |
| X1X3 | 0.34 | 1 | 0.34 | 31.43 | <0.0001 |
| X1X4 | 0.038 | 1 | 0.038 | 3.55 | 0.0804 |
| X2X3 | 0.078 | 1 | 0.078 | 7.32 | 0.0170 |
| X2X4 | 0.14 | 1 | 0.14 | 13.49 | 0.0025 |
| X3X4 | 0.038 | 1 | 0.038 | 3.55 | 0.0804 |
| X12 | 1.90 | 1 | 1.90 | 177.64 | <0.0001 |
| X22 | 0.95 | 1 | 0.95 | 88.74 | <0.0001 |
| X32 | 1.95 | 1 | 1.95 | 182.59 | <0.0001 |
| X42 | 0.70 | 1 | 0.70 | 65.06 | <0.0001 |
| Residual | 0.15 | 14 | 0.011 | ||
| Lack of fit | 0.13 | 10 | 0.013 | 3.28 | 0.1317 |
| Pure error | 0.016 | 4 | 0.004 | ||
| Cor total | 6.43 | 28 | |||
| R2 | 0.9767 | ||||
| Adjusted R2 | 0.9534 |
| Analytes | Linear Equation | R2 | Linear Range (µg/mL) | LOD (µg/mL) | LOQ (µg/mL) |
|---|---|---|---|---|---|
| luteolin-7-O-glucoside | 0.9995 | 5.00–100 | 0.051 | 0.67 | |
| Rutin | 0.9998 | 5.00–100 | 0.094 | 1.31 | |
| Quercitrin | 0.9997 | 2.50–100 | 0.042 | 0.44 | |
| Luteolin | 0.9998 | 1.00–100 | 0.014 | 0.16 | |
| Apigenin | 0.9999 | 1.00–100 | 0.026 | 0.34 |
| Analytes | Precision (RSD, %) | Stability (RSD, %) | Recovery | ||
|---|---|---|---|---|---|
| Intra-Day | Inter-Day | Mean Recovery (%) | RSD (%) | ||
| Luteolin-7-O-glucoside | 1.34 | 2.51 | 2.56 | 99.67 | 0.85 |
| Rutin | 2.11 | 1.87 | 2.48 | 100.4 | 1.48 |
| Quercitrin | 0.94 | 2.02 | 1.89 | 101.3 | 2.19 |
| Luteolin | 1.52 | 1.98 | 2.05 | 98.93 | 1.83 |
| Apigenin | 2.43 | 2.16 | 2.33 | 99.21 | 2.07 |
© 2019 by the authors. Licensee MDPI, Basel, Switzerland. This article is an open access article distributed under the terms and conditions of the Creative Commons Attribution (CC BY) license (http://creativecommons.org/licenses/by/4.0/).
Share and Cite
Hou, M.; Hu, W.; Wang, A.; Xiu, Z.; Shi, Y.; Hao, K.; Sun, X.; Cao, D.; Lu, R.; Sun, J. Ultrasound-Assisted Extraction of Total Flavonoids from Pteris cretica L.: Process Optimization, HPLC Analysis, and Evaluation of Antioxidant Activity. Antioxidants 2019, 8, 425. https://0-doi-org.brum.beds.ac.uk/10.3390/antiox8100425
Hou M, Hu W, Wang A, Xiu Z, Shi Y, Hao K, Sun X, Cao D, Lu R, Sun J. Ultrasound-Assisted Extraction of Total Flavonoids from Pteris cretica L.: Process Optimization, HPLC Analysis, and Evaluation of Antioxidant Activity. Antioxidants. 2019; 8(10):425. https://0-doi-org.brum.beds.ac.uk/10.3390/antiox8100425
Chicago/Turabian StyleHou, Mengyang, Wenzhong Hu, Aosheng Wang, Zhilong Xiu, Yusheng Shi, Kexin Hao, Xingsheng Sun, Duo Cao, Ruishan Lu, and Jiao Sun. 2019. "Ultrasound-Assisted Extraction of Total Flavonoids from Pteris cretica L.: Process Optimization, HPLC Analysis, and Evaluation of Antioxidant Activity" Antioxidants 8, no. 10: 425. https://0-doi-org.brum.beds.ac.uk/10.3390/antiox8100425