The Protective Effect of Alpha-Mangostin against Cisplatin-Induced Cell Death in LLC-PK1 Cells is Associated to Mitochondrial Function Preservation


Abstract
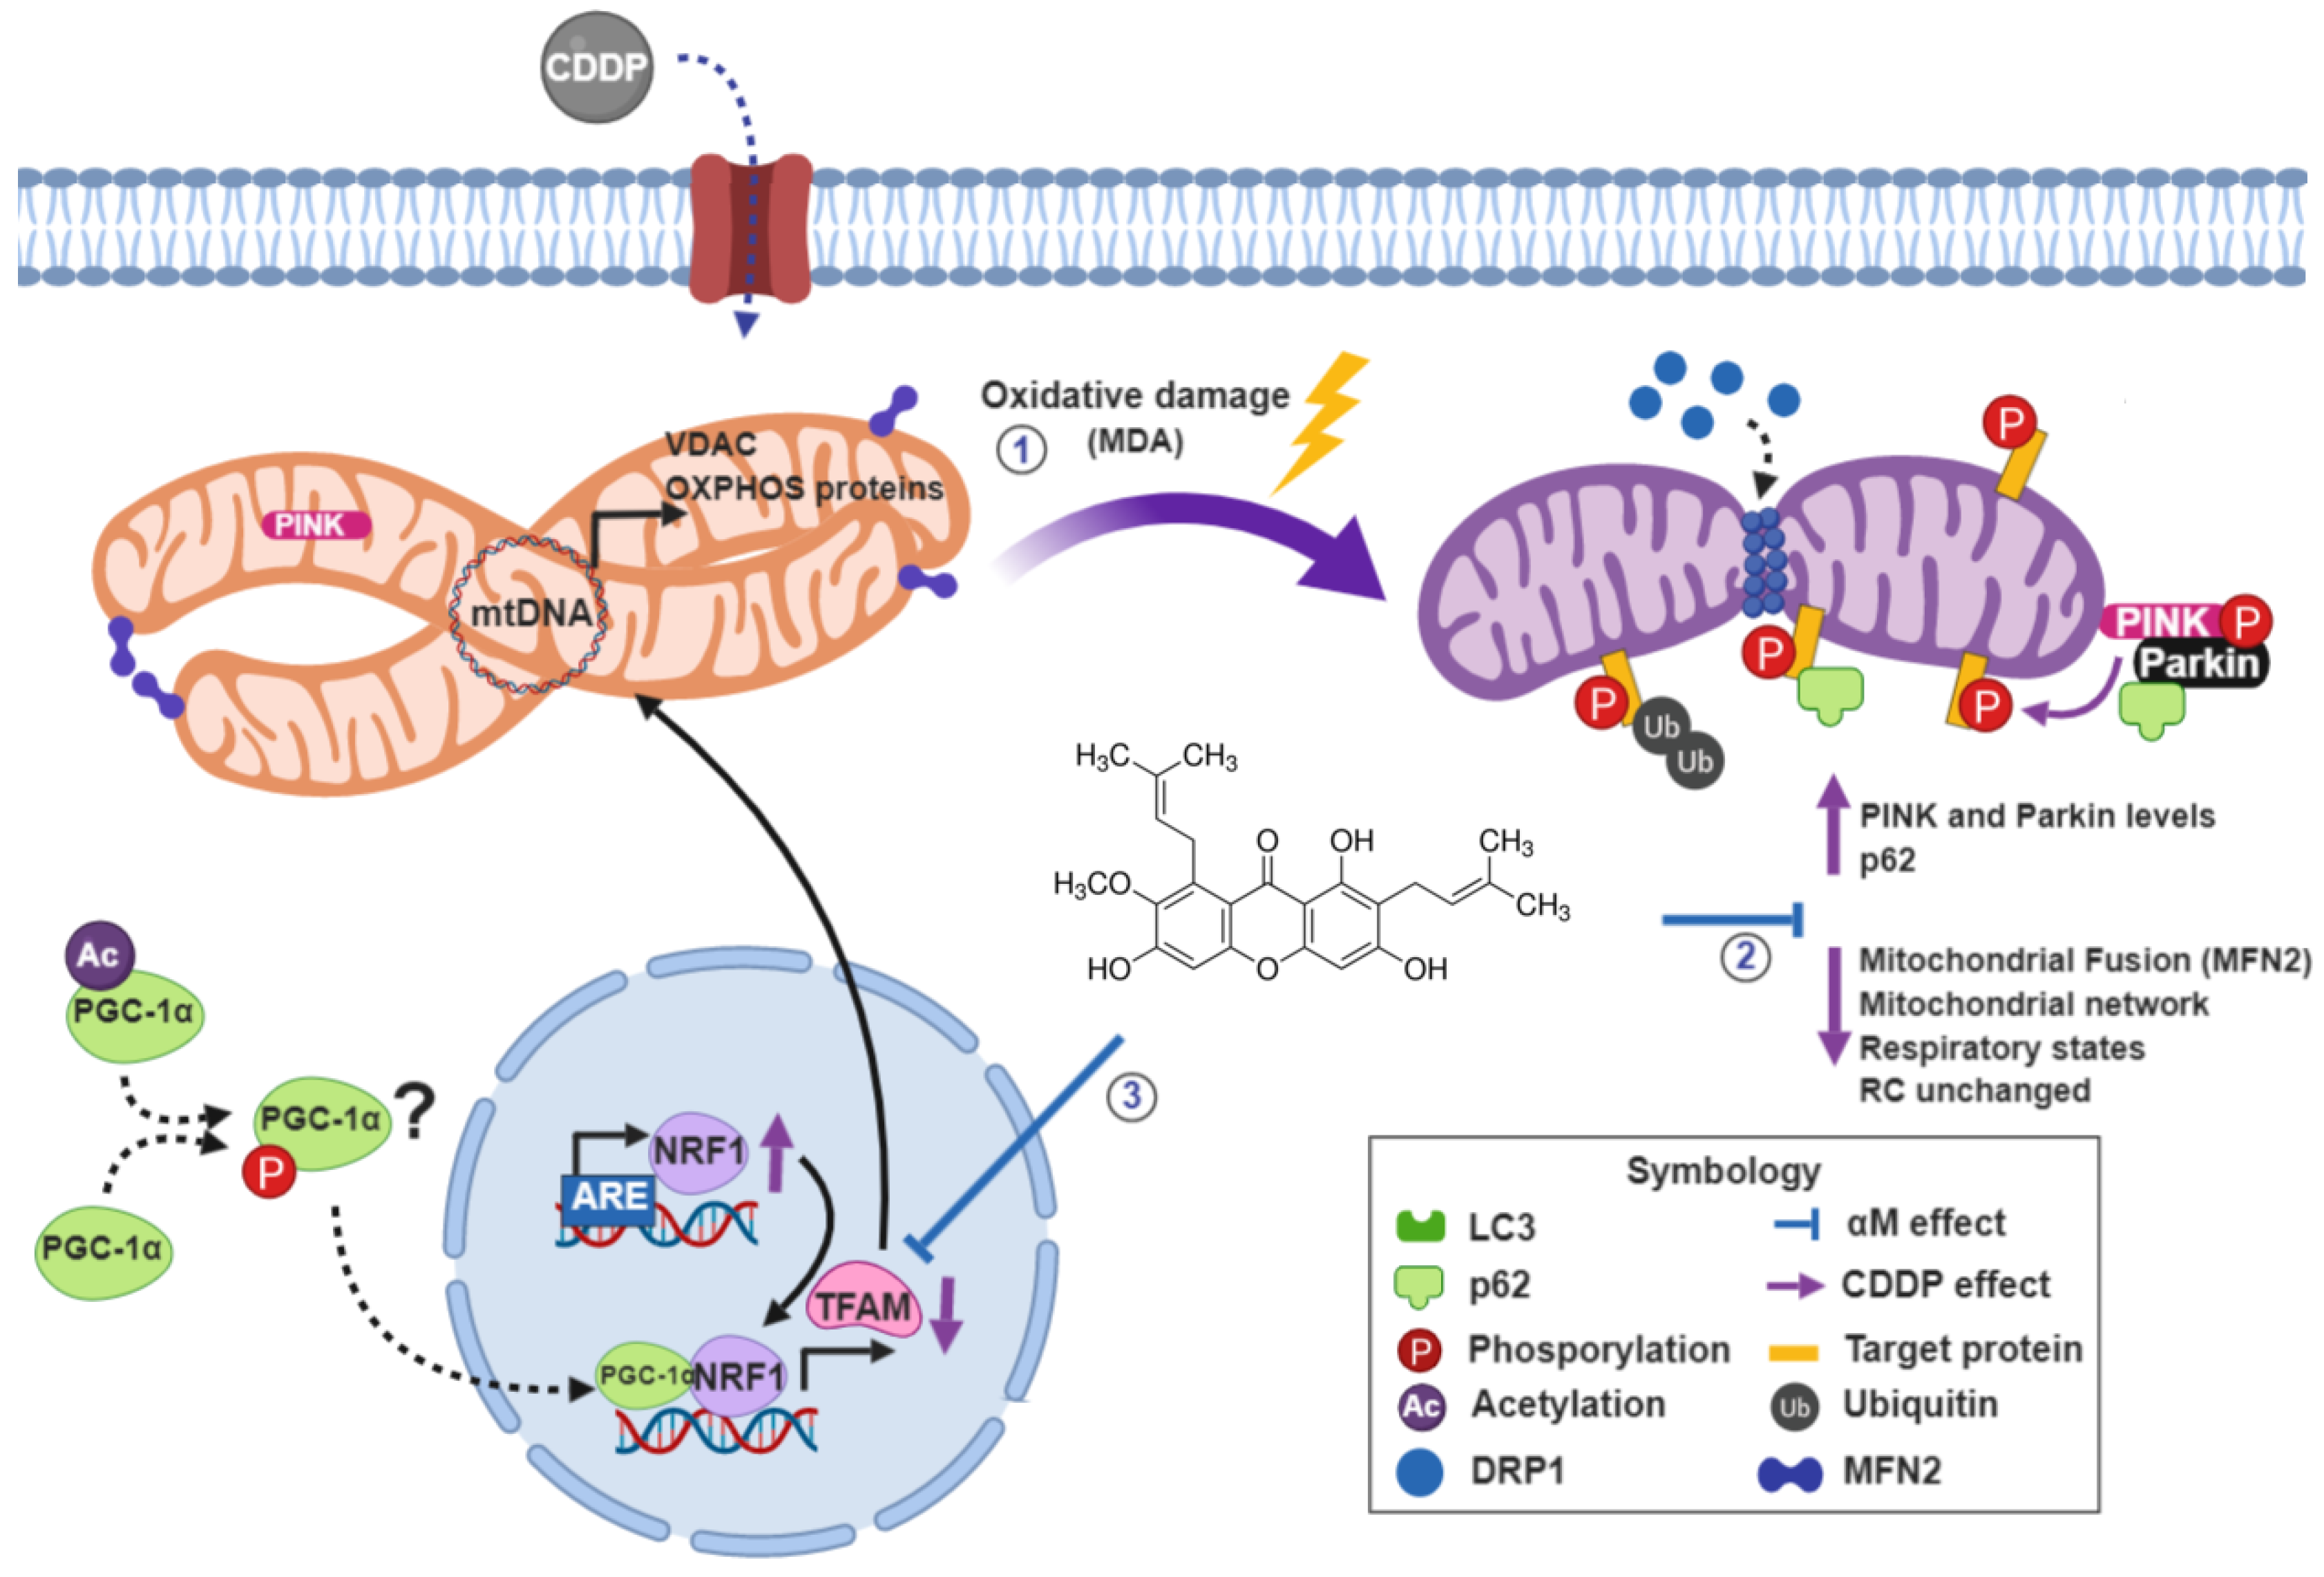
:
1. Introduction
2. Materials and Methods
2.1. Reagents
2.2. Cell Culture and Cell Viability
2.3. Cell Respirometry
2.4. Total Protein Extract and Western Blot
2.5. Mitochondrial Mass by MitoTracker Green
2.6. Statistical Analysis
3. Results
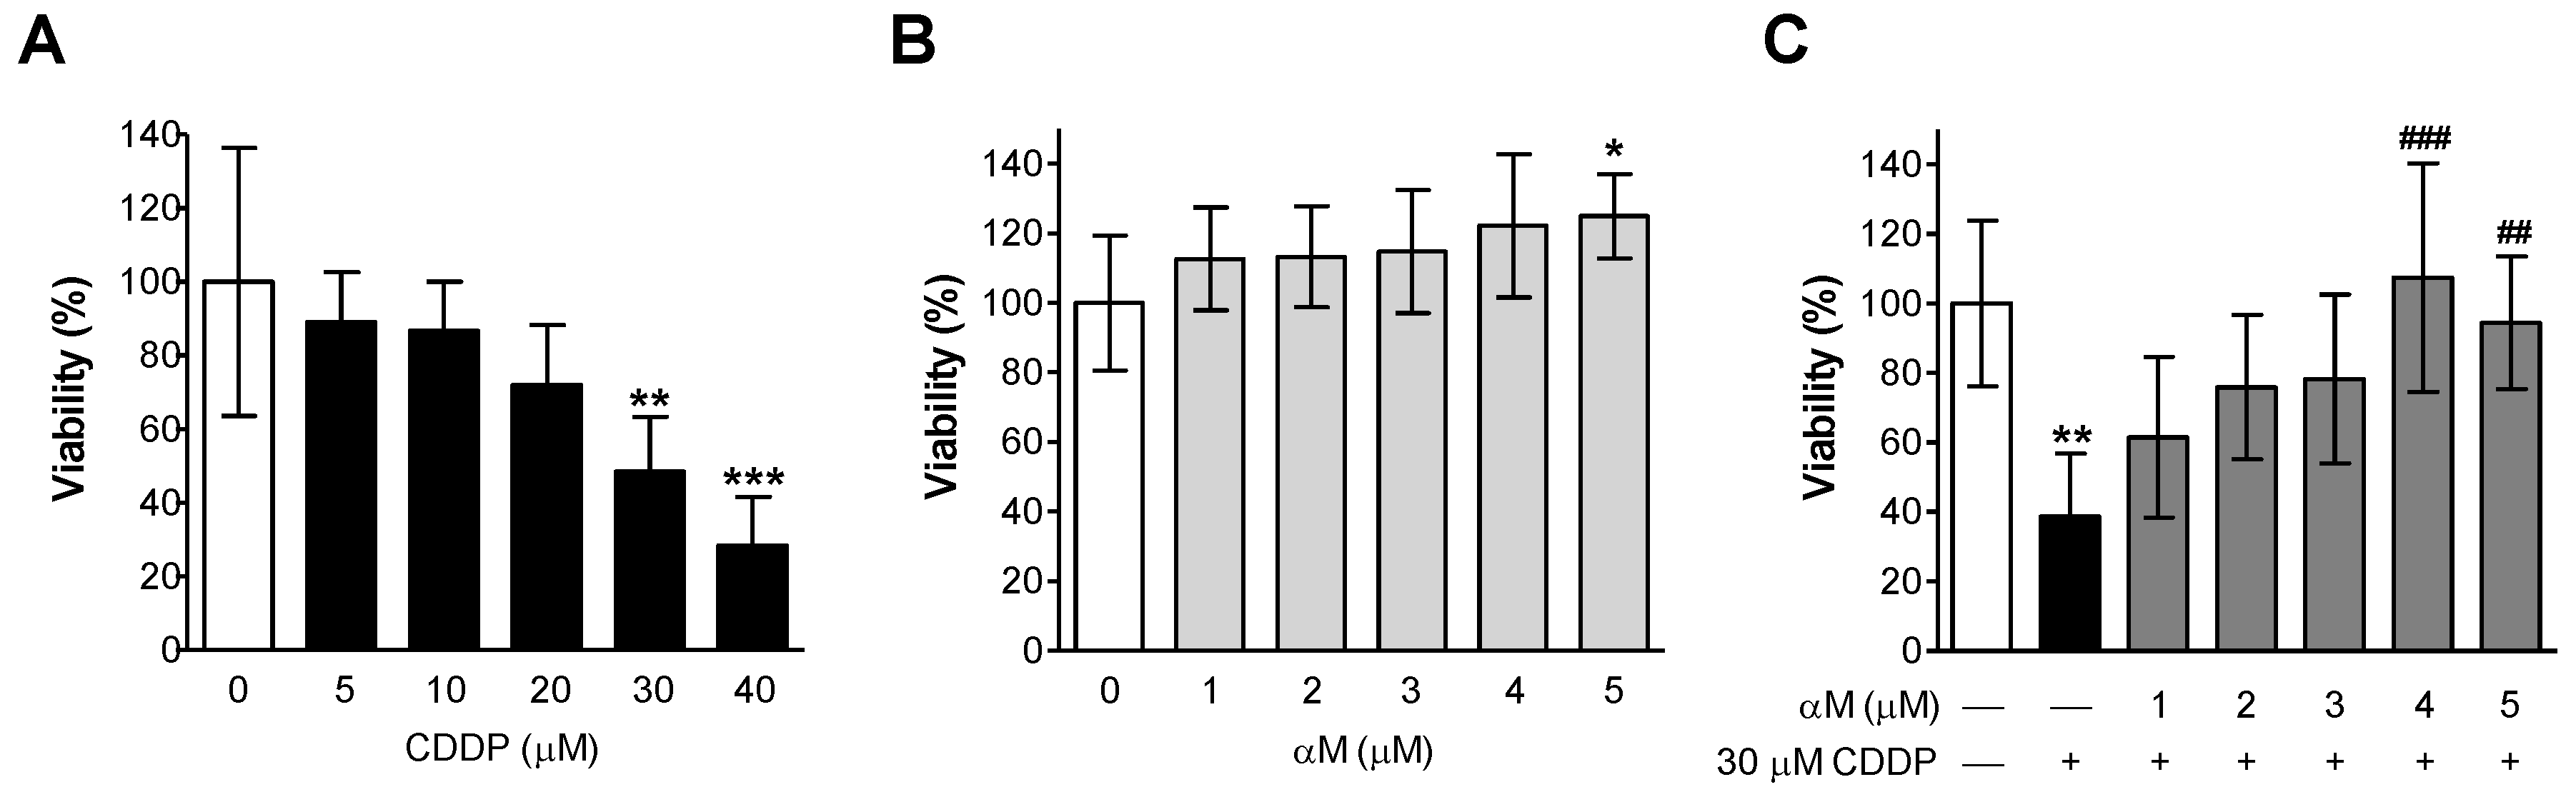
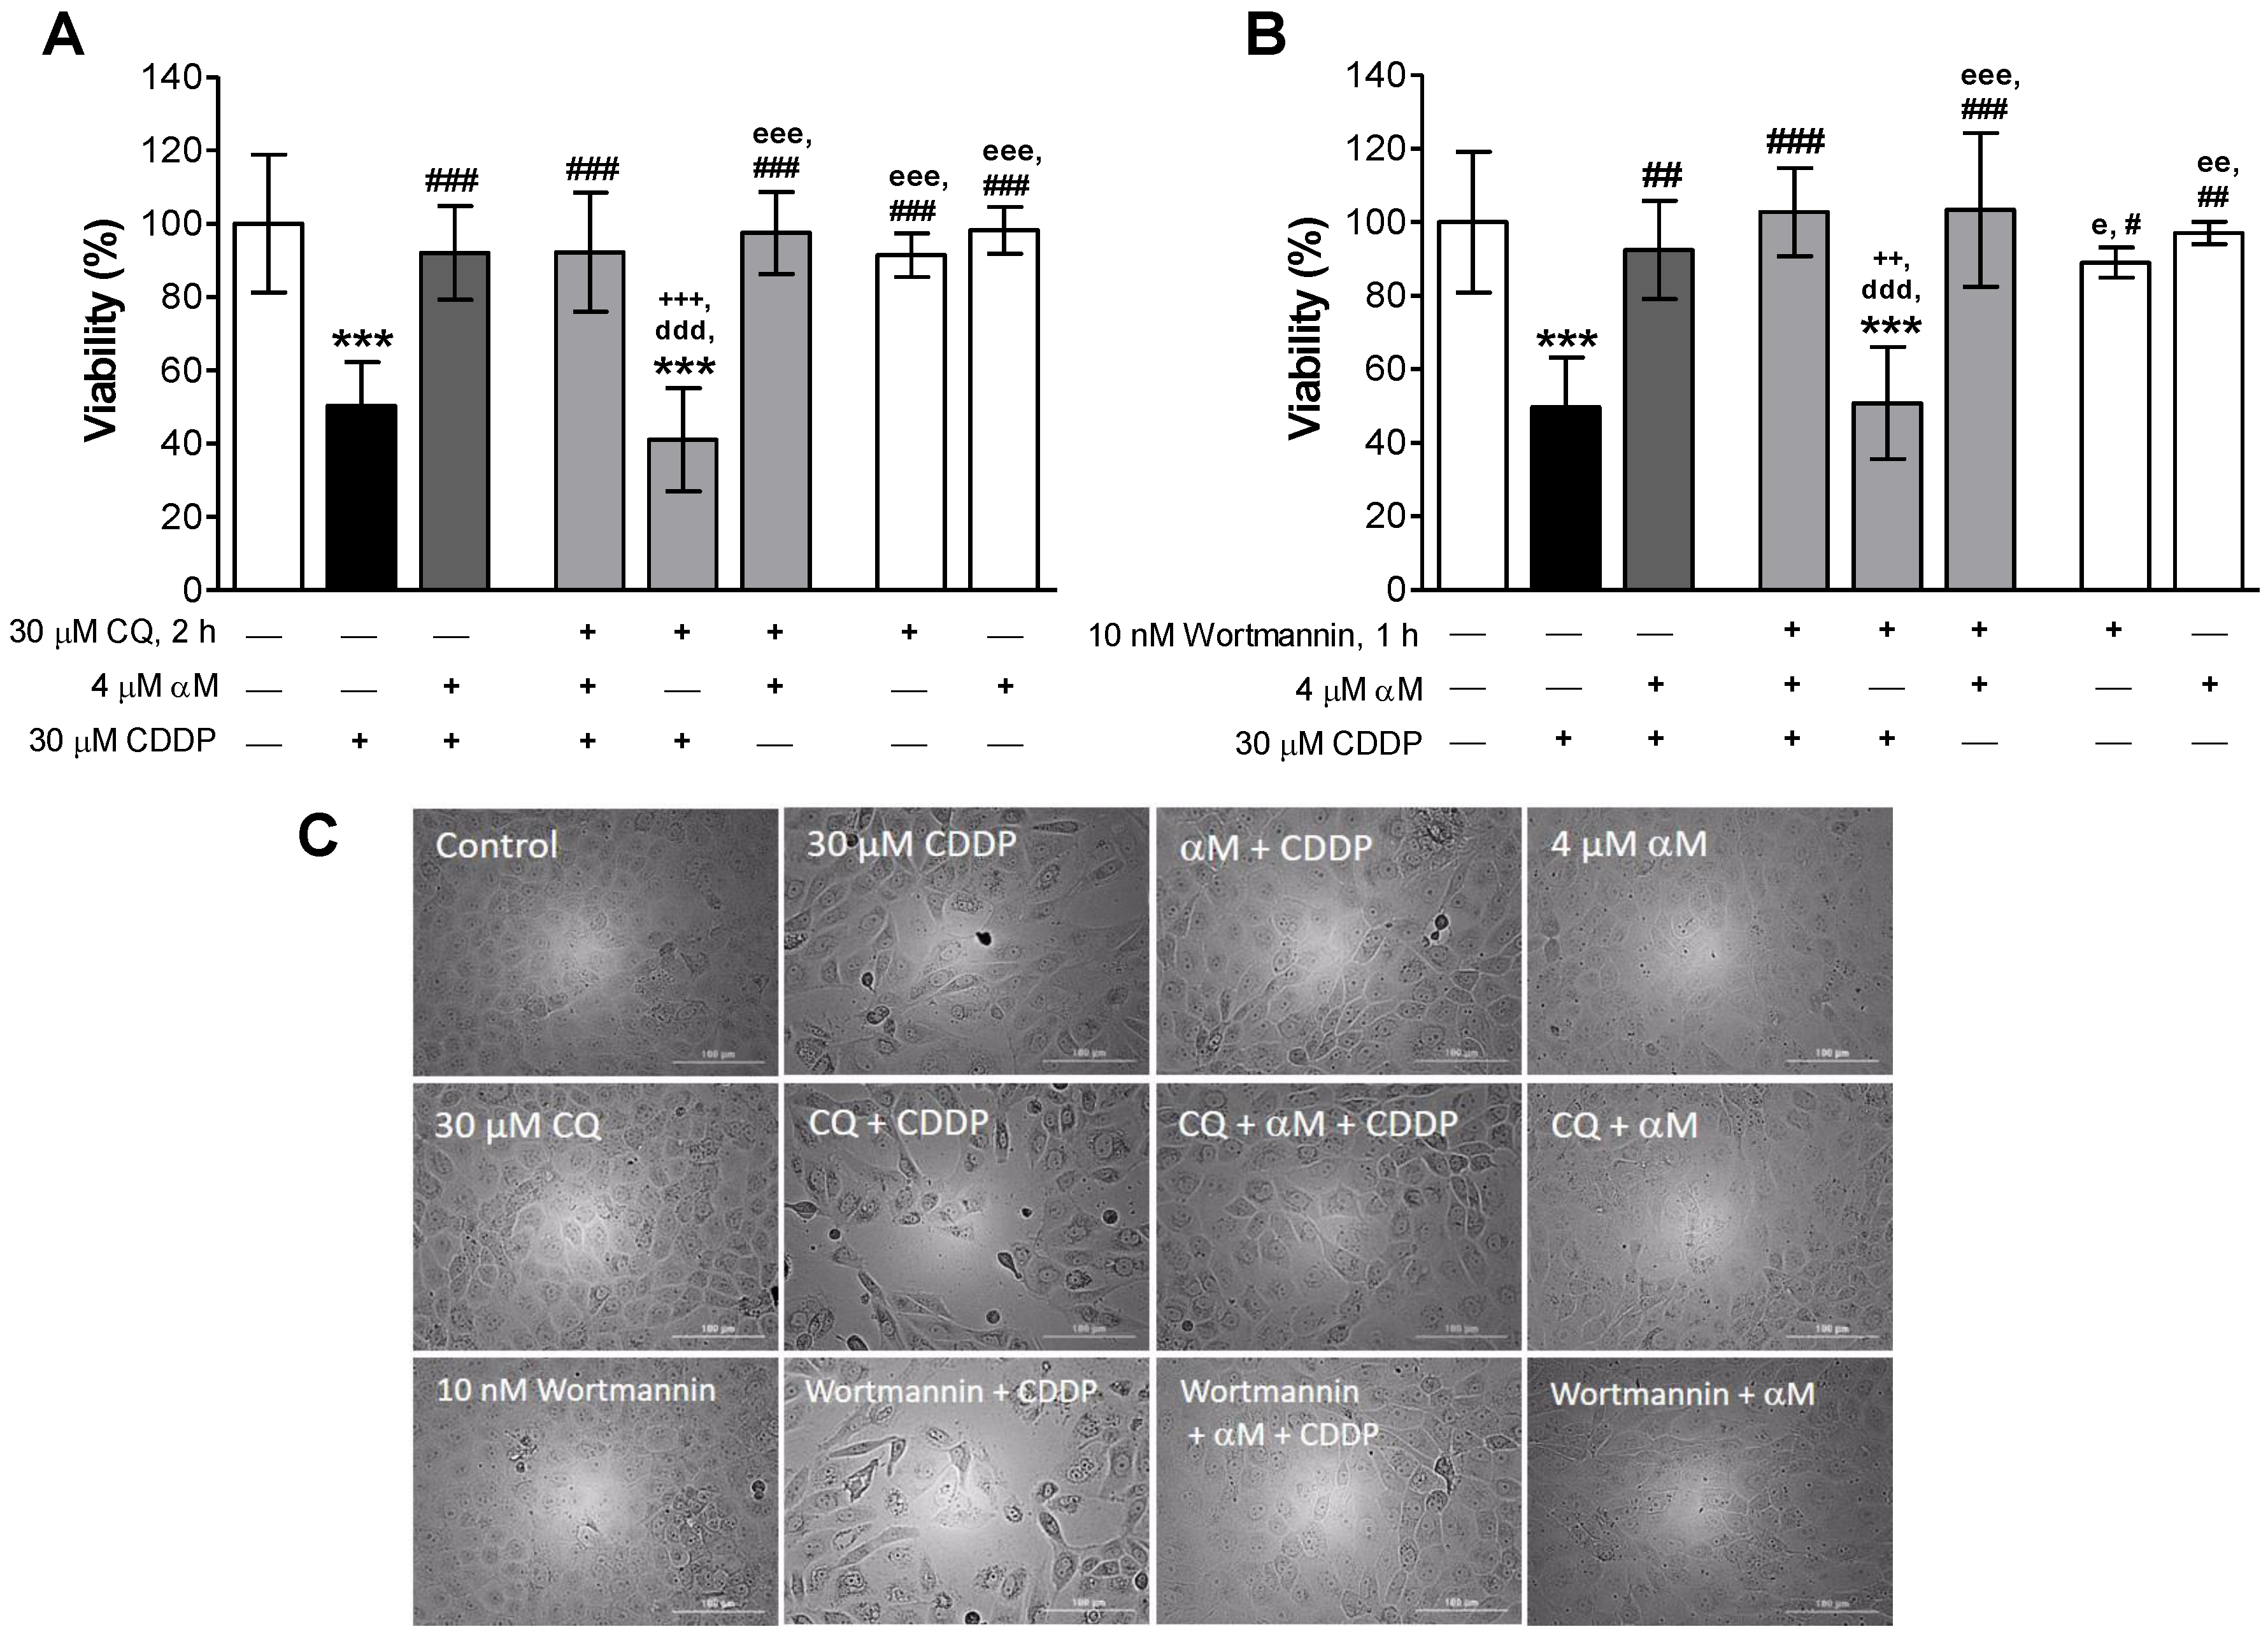
3.1. αM Prevented CDDP-Induced Cell Death
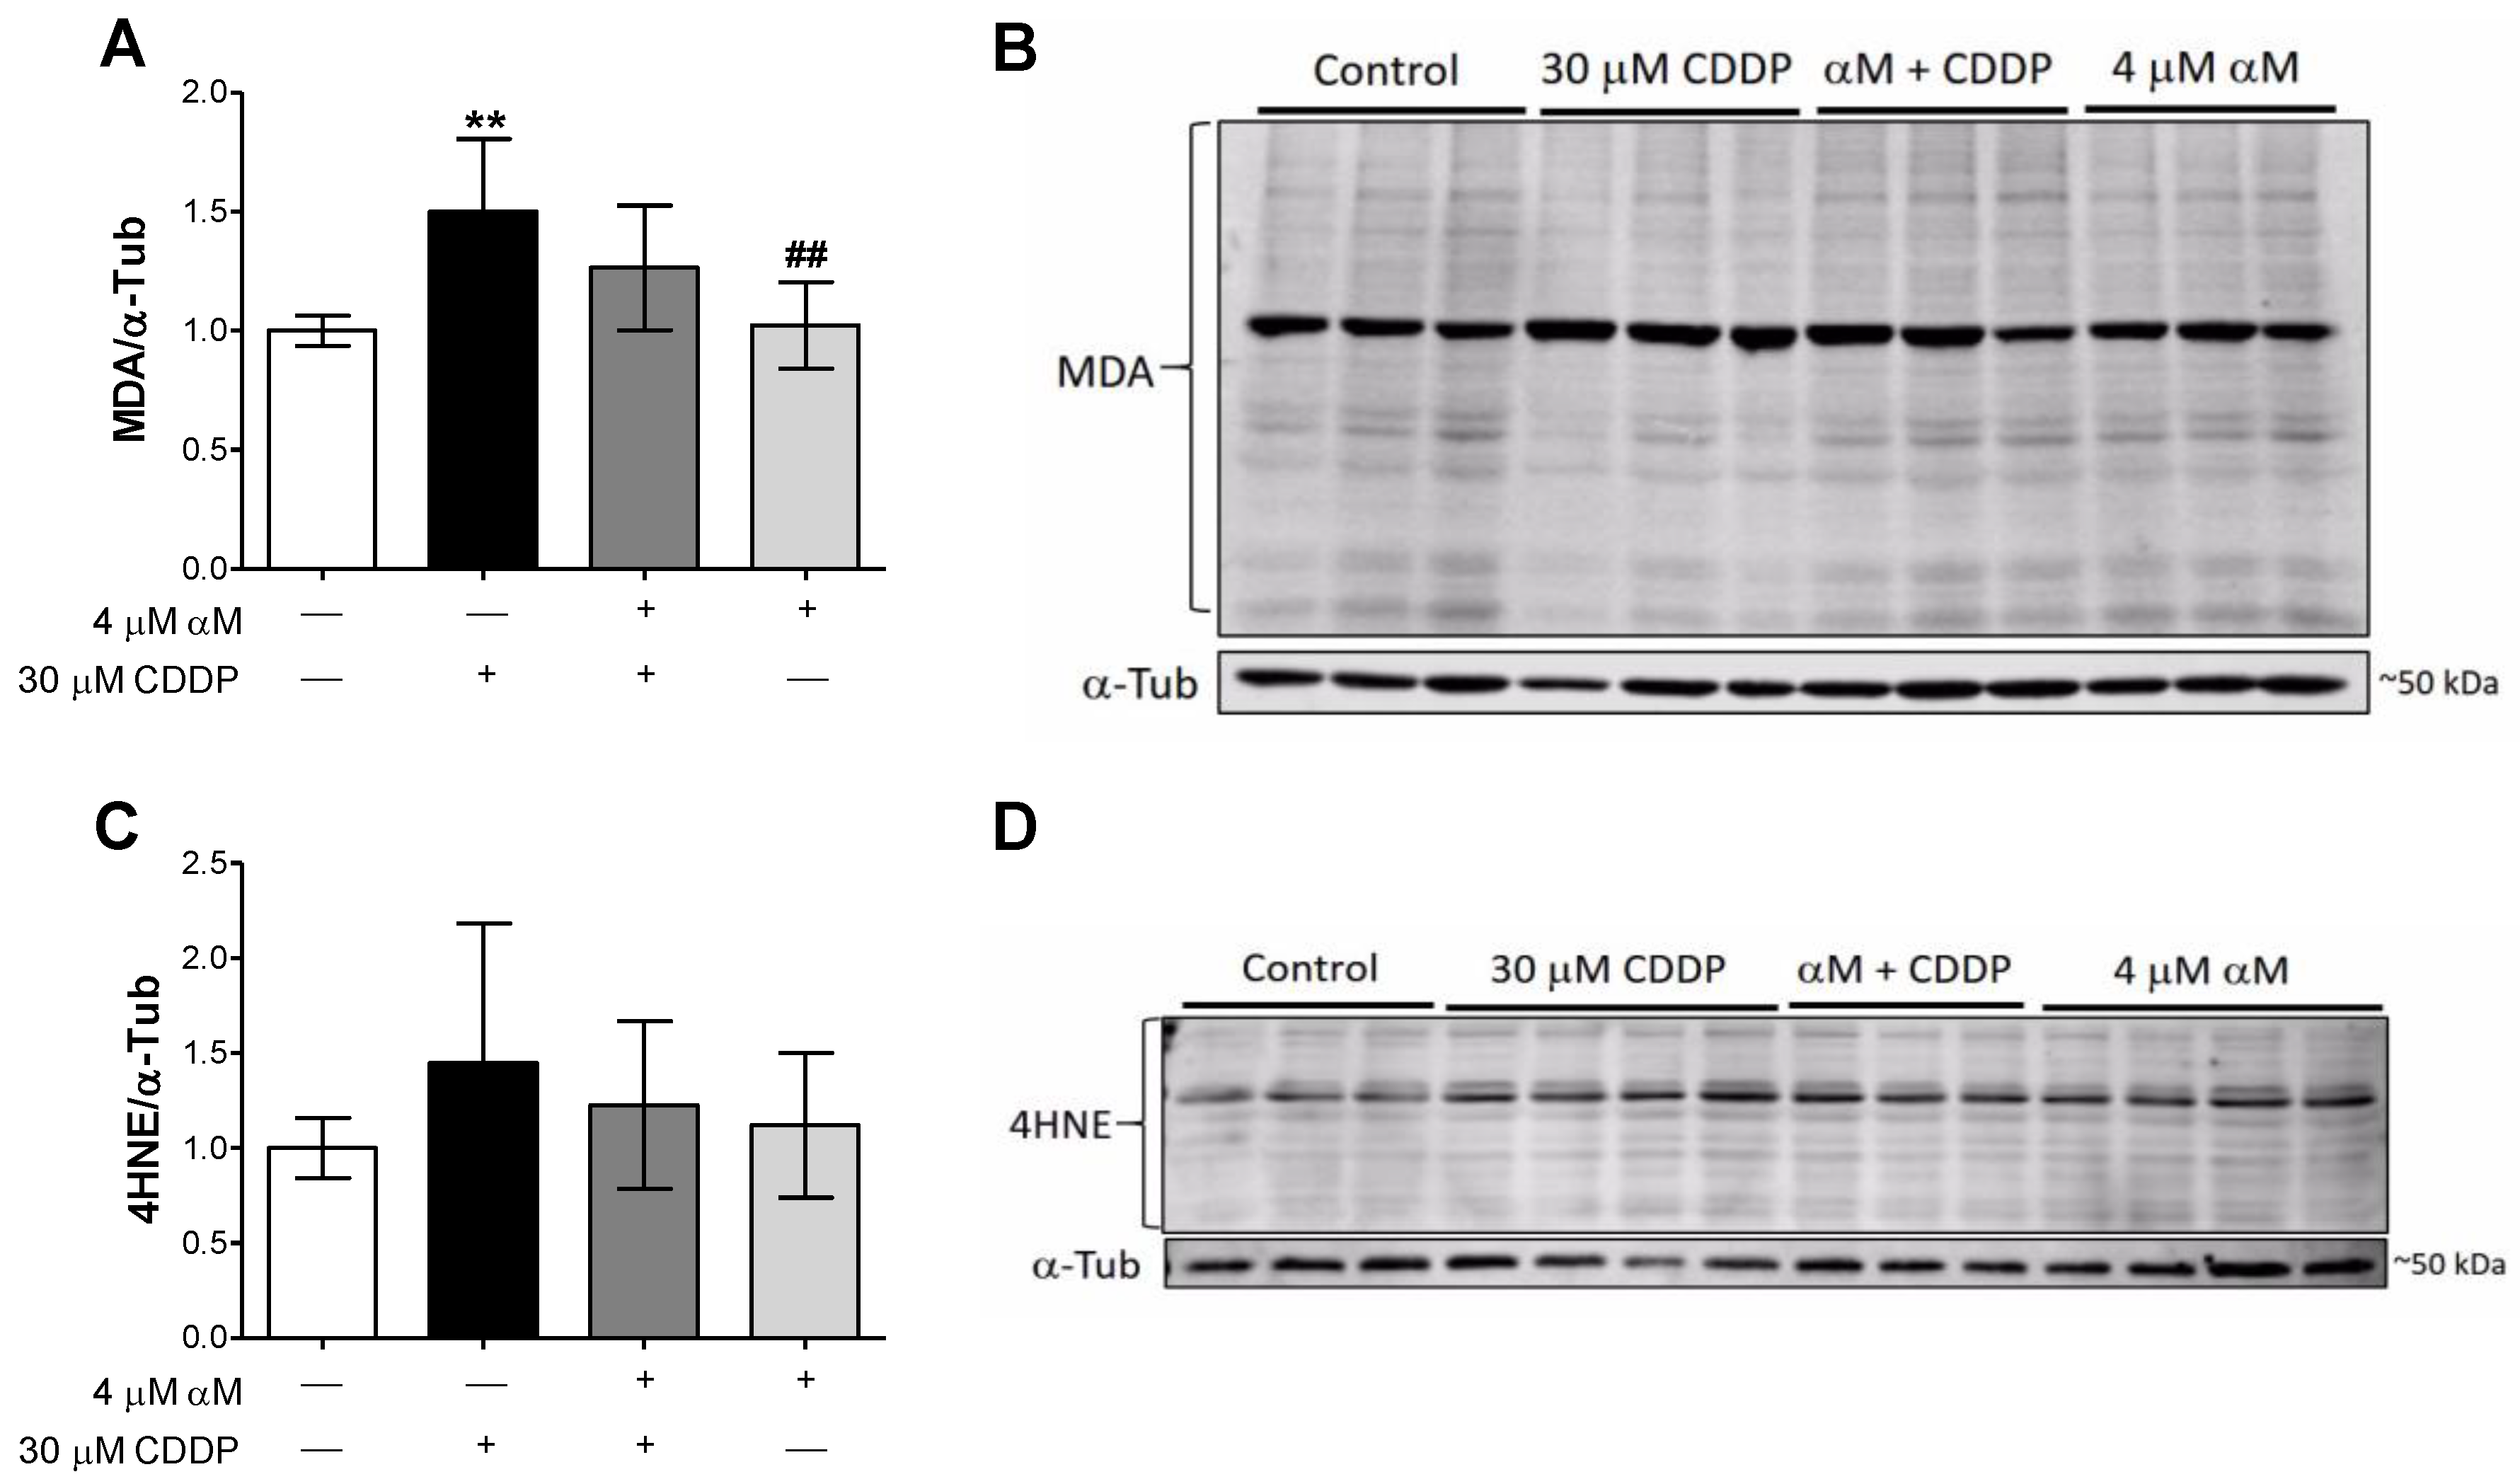
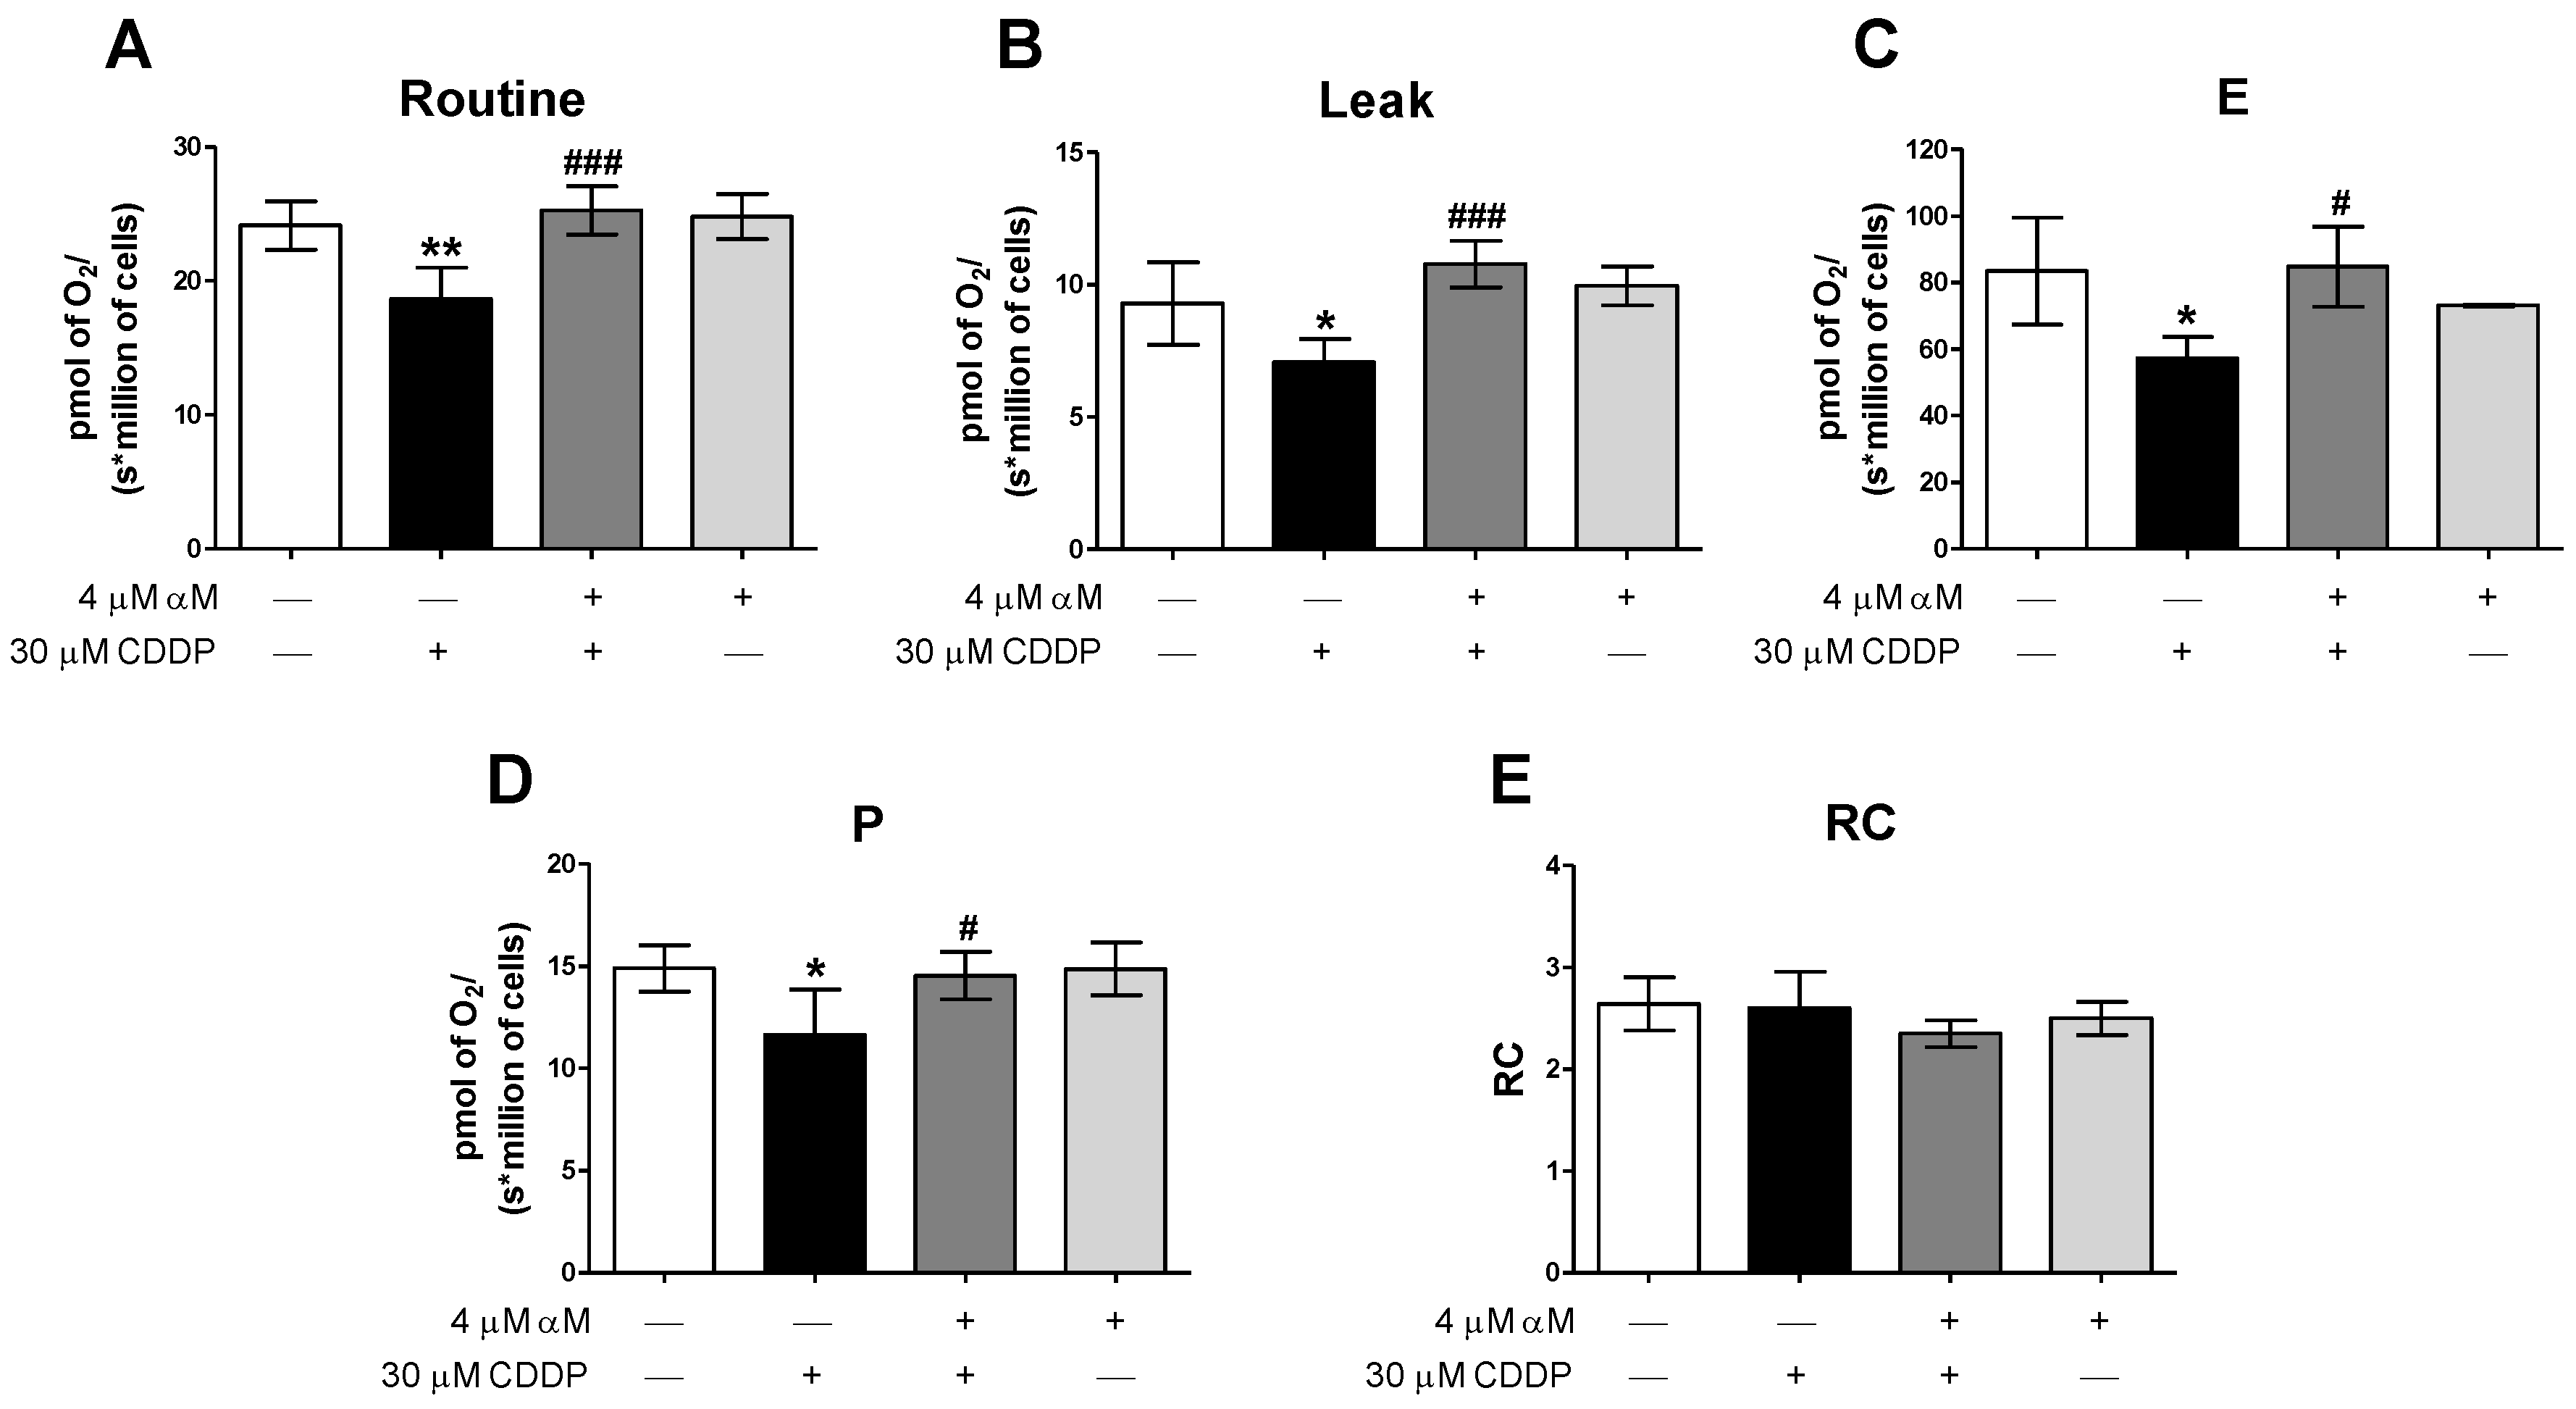
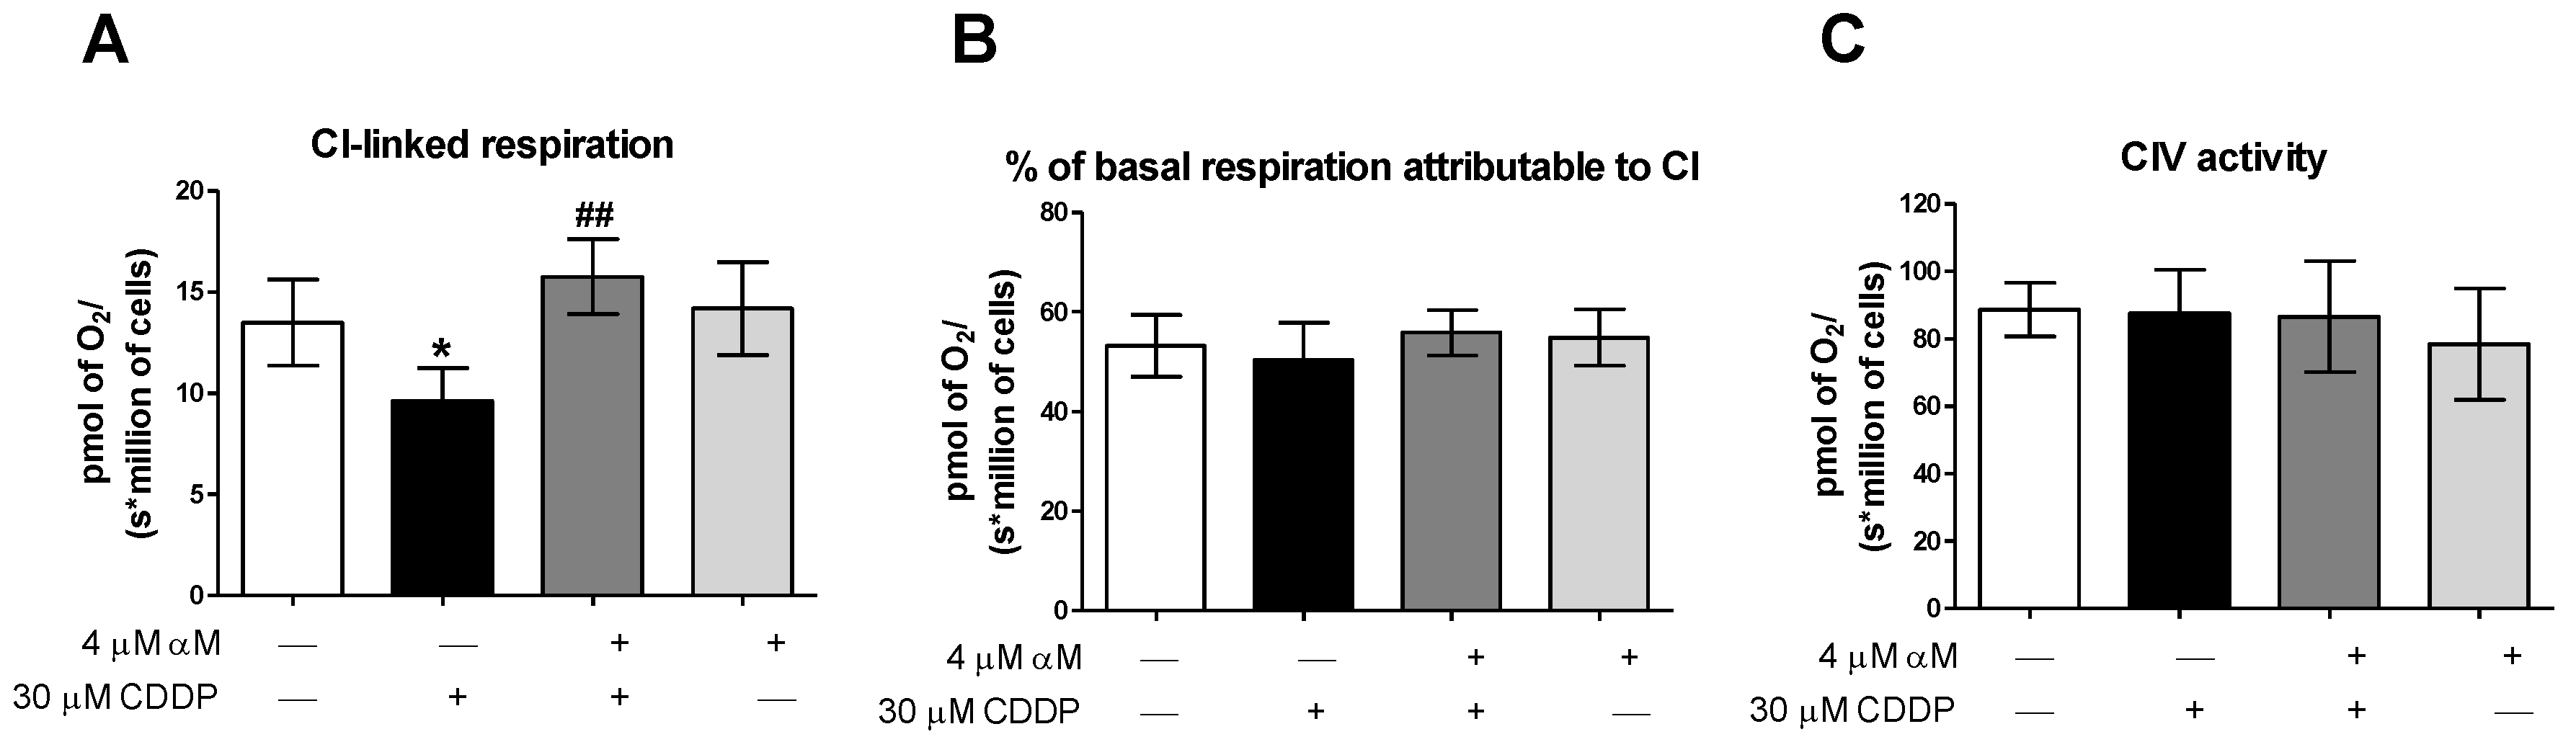
3.2. αM’s Protection is Associated to the Preservation of Mitochondrial Bioenergetics
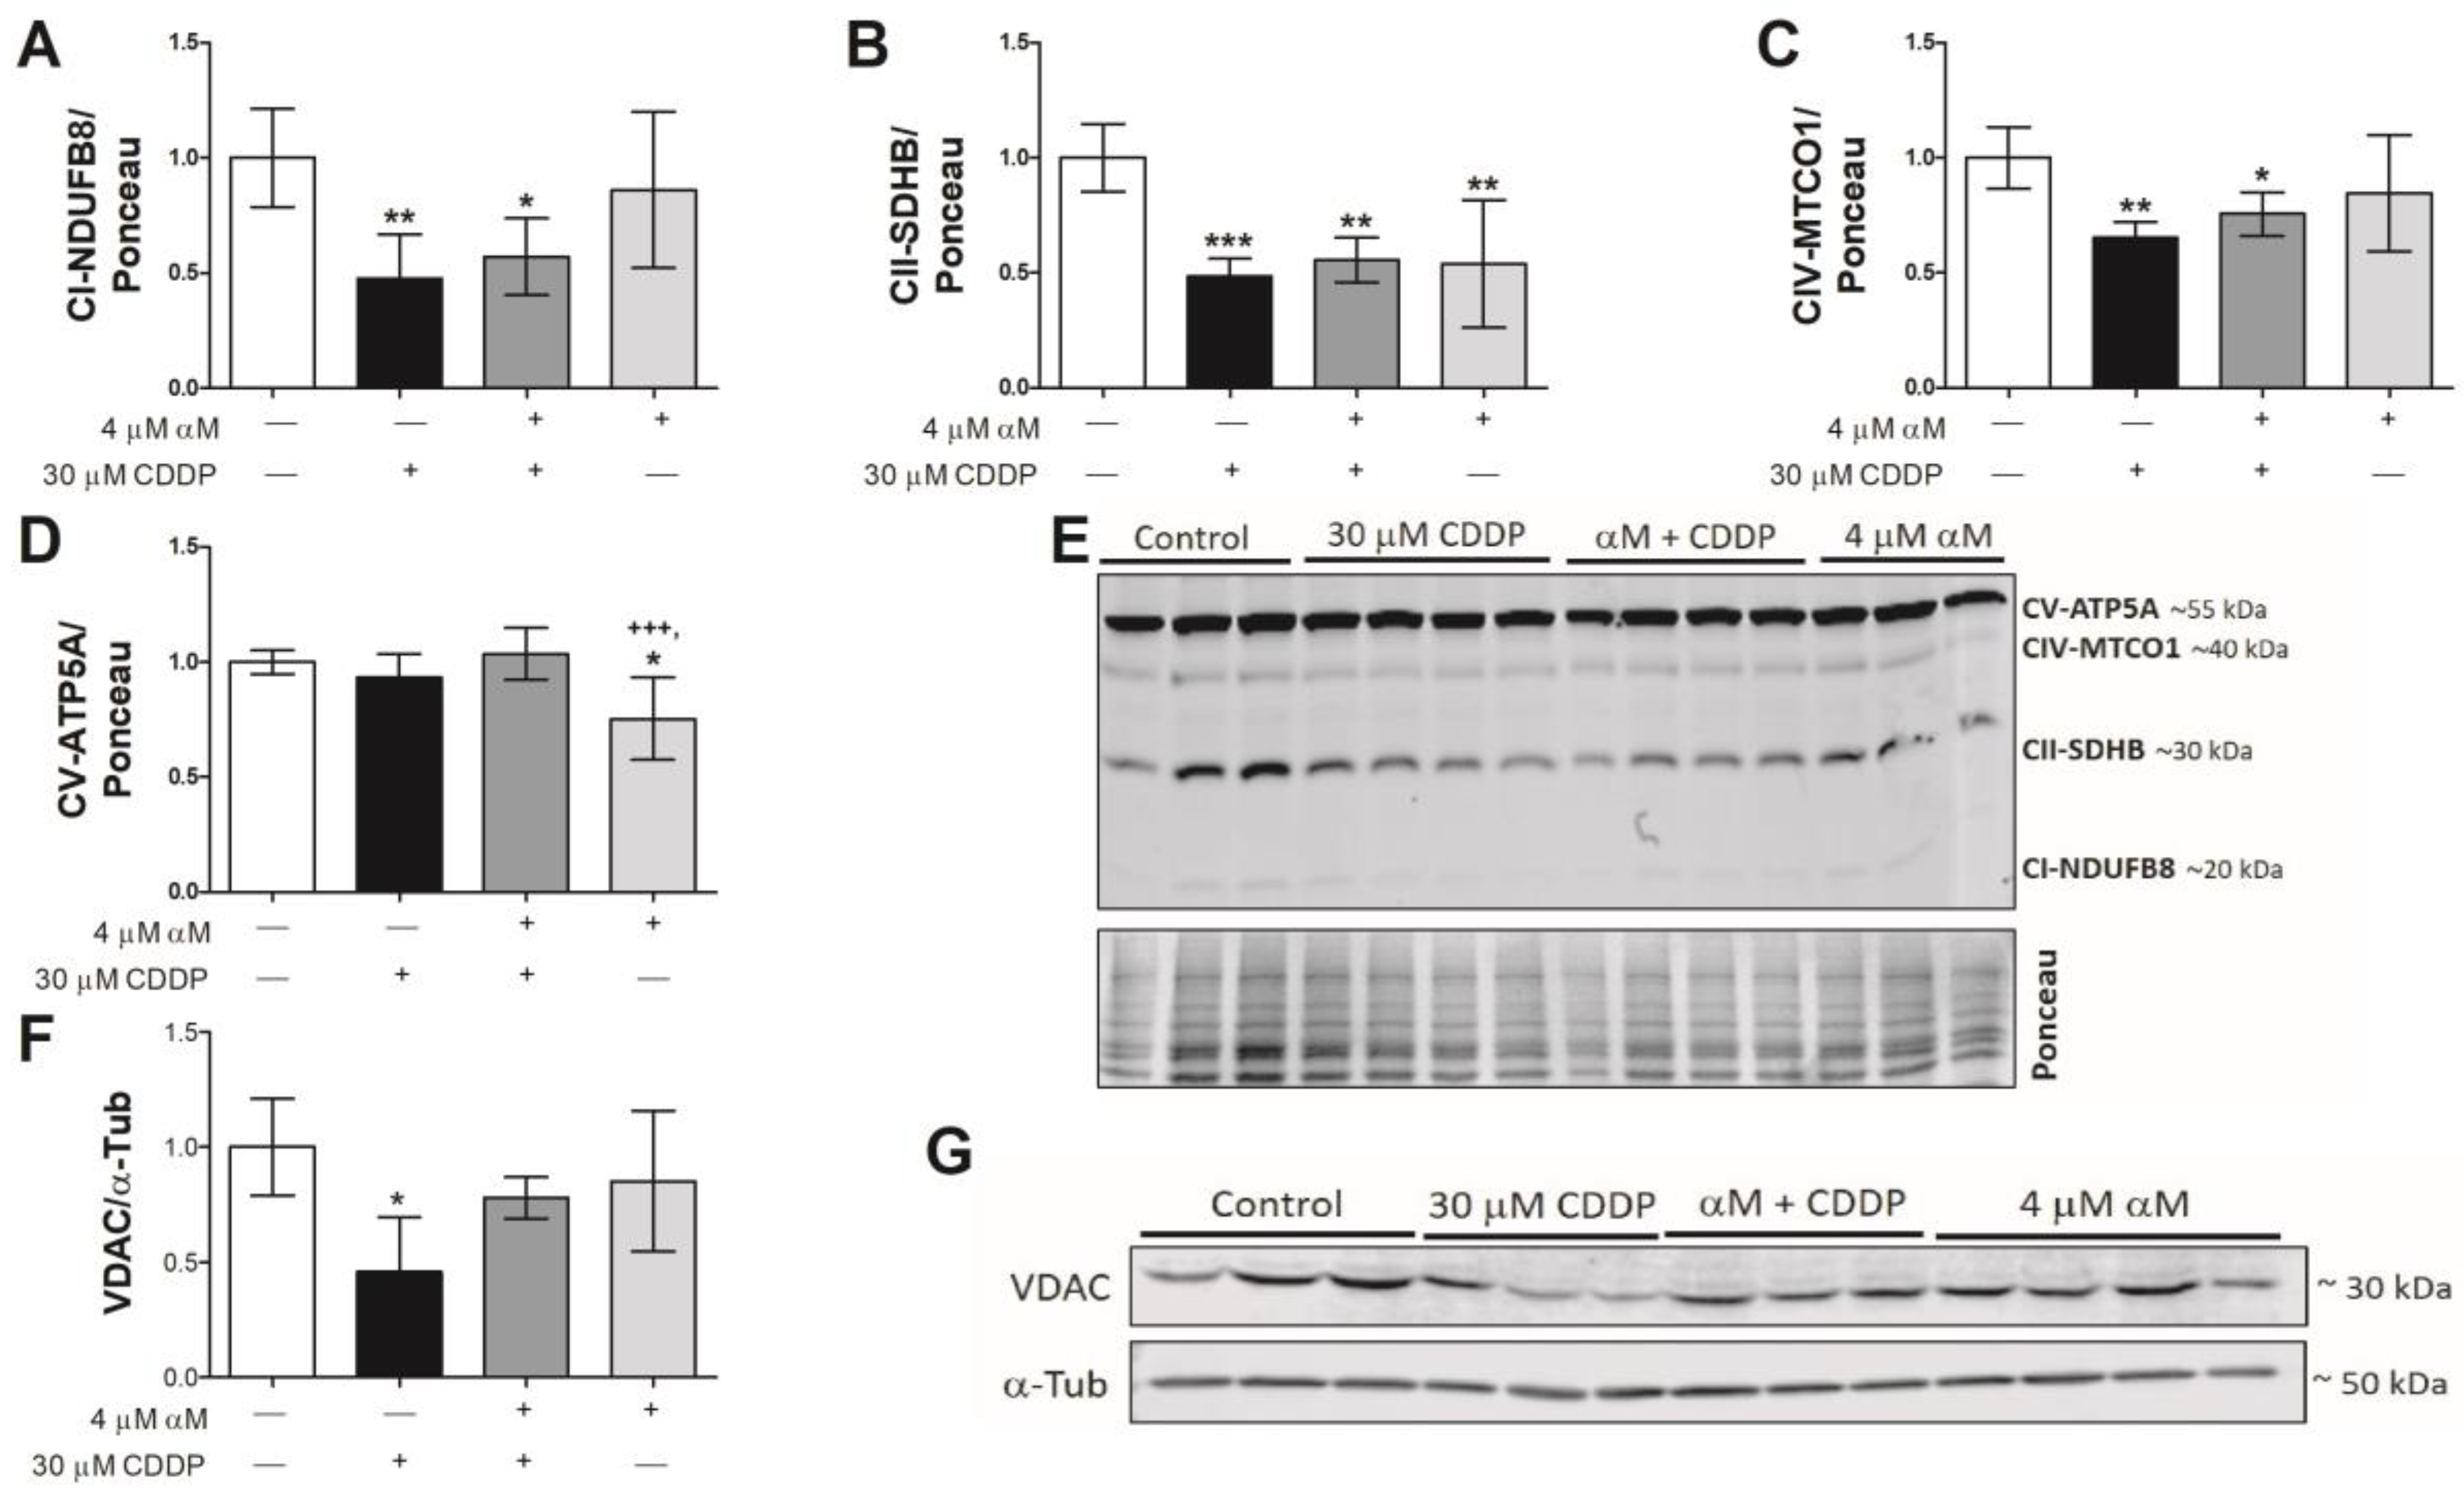
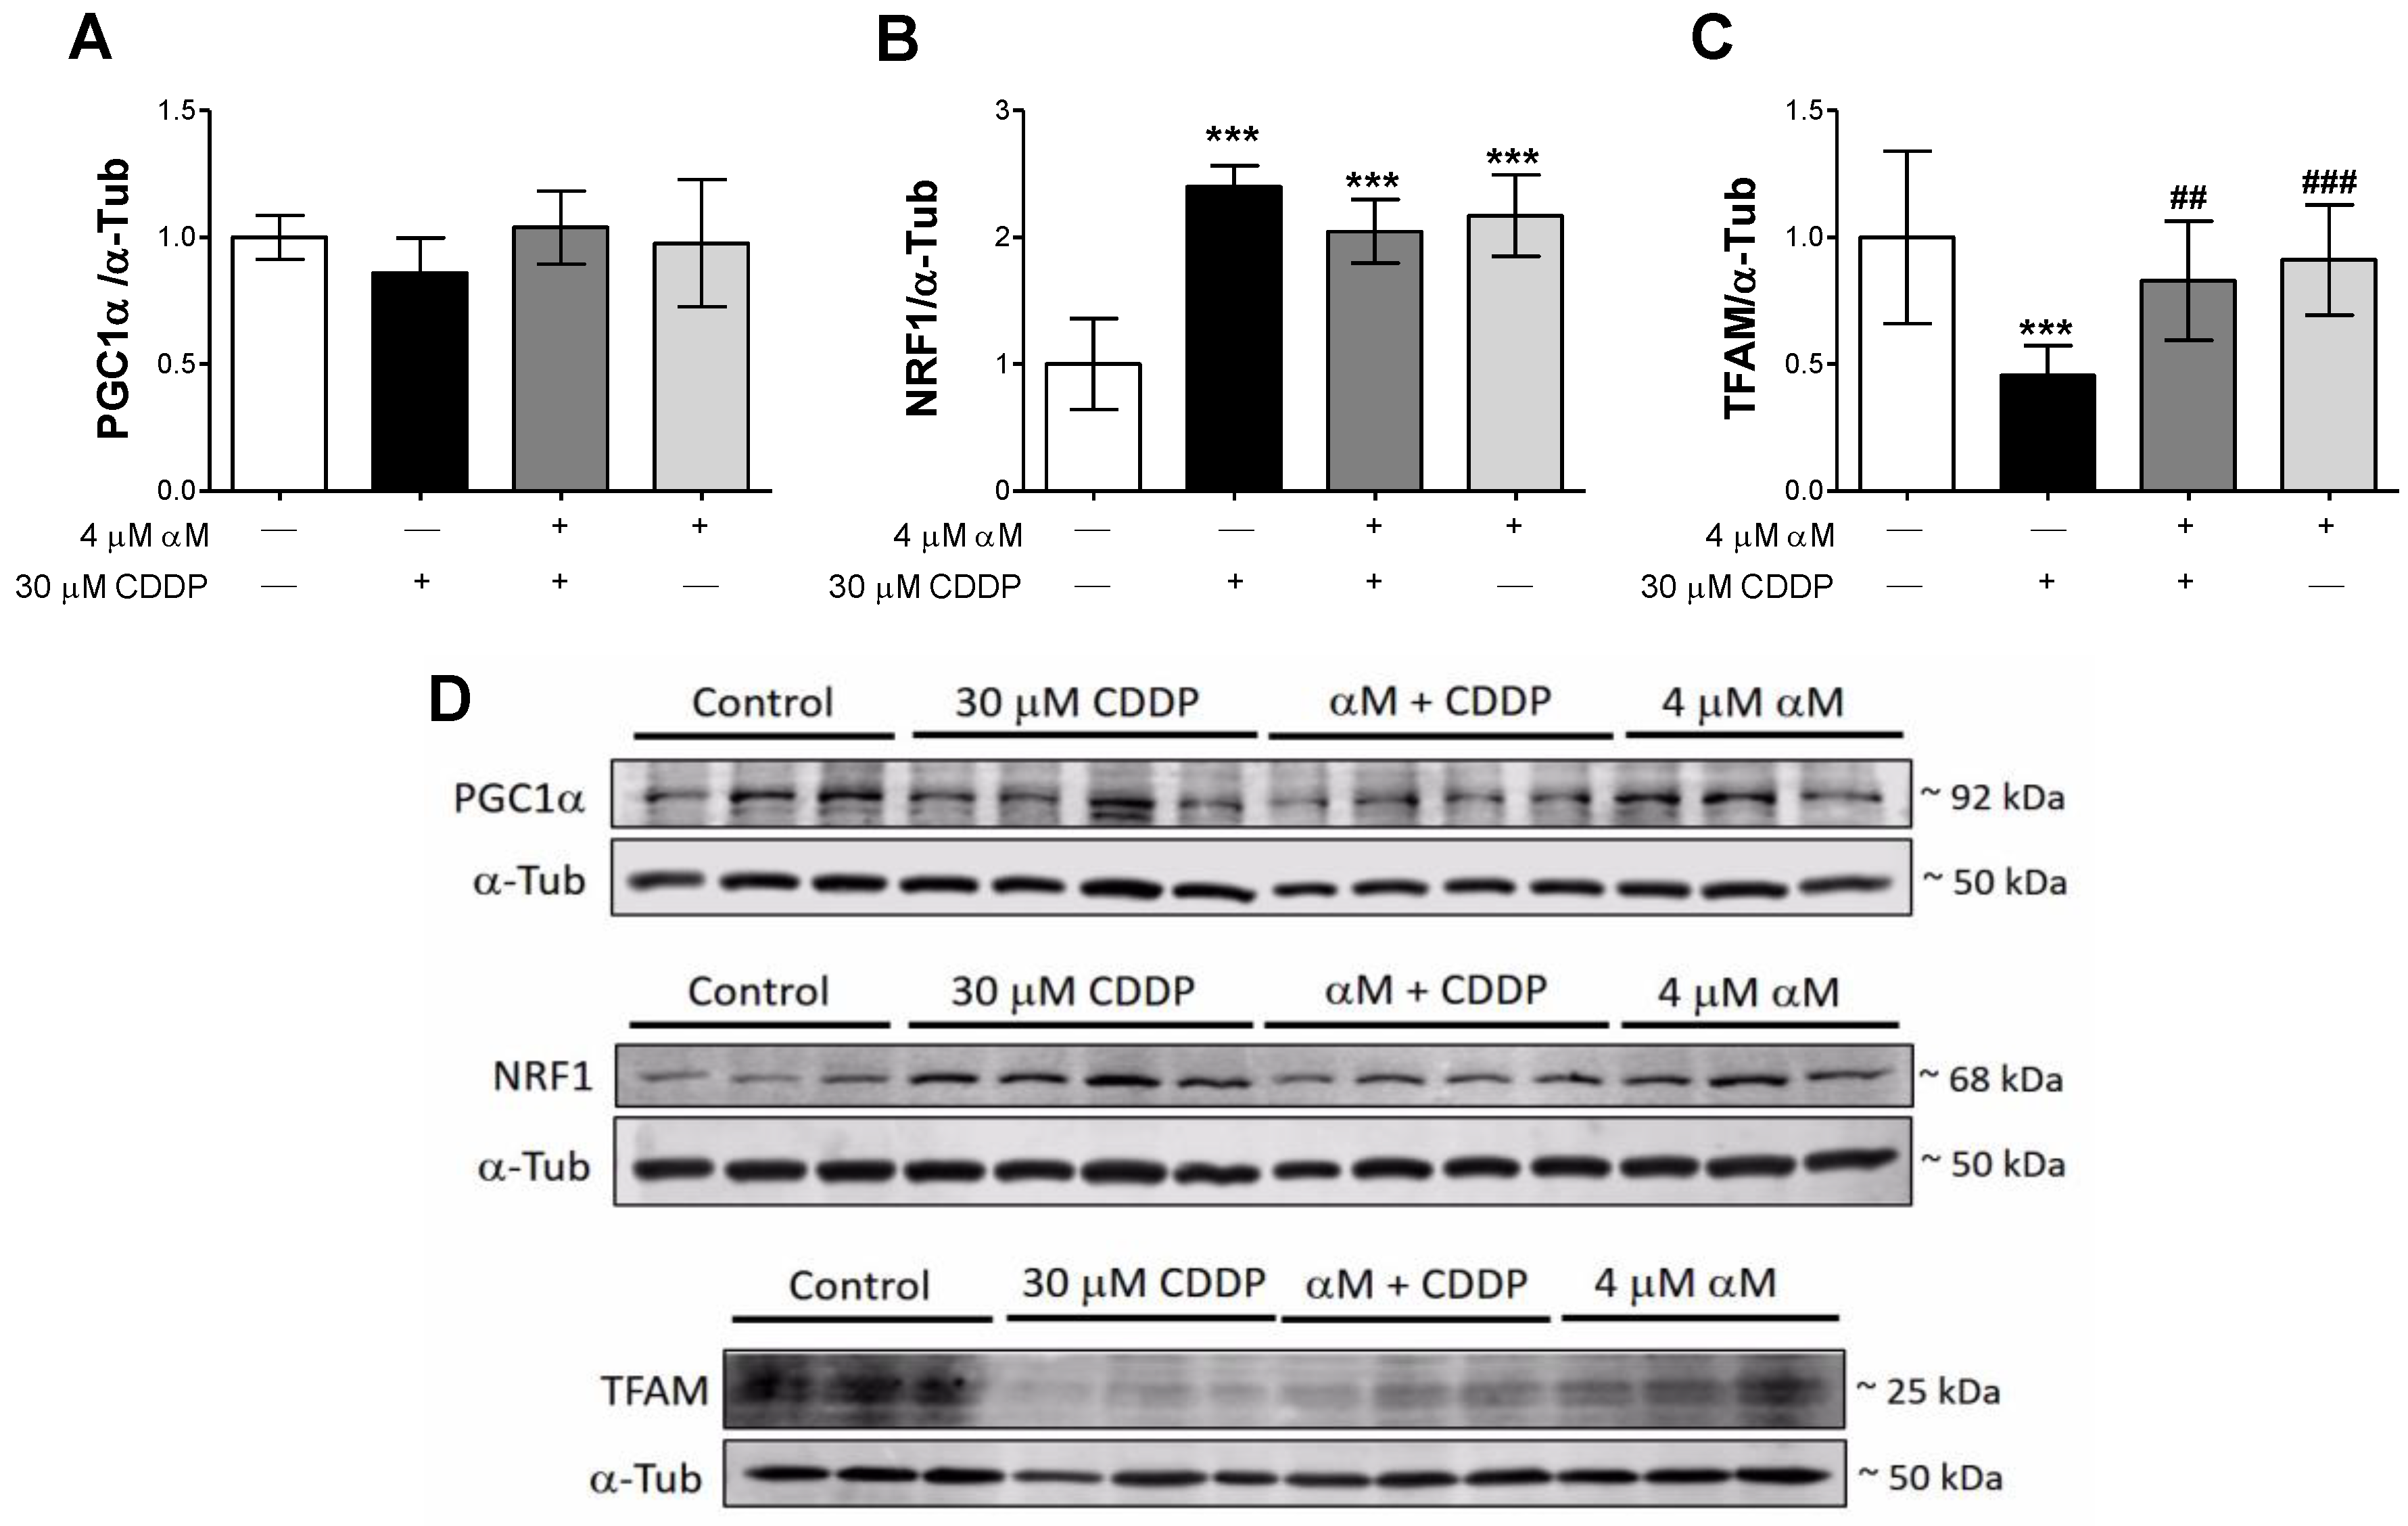
3.3. Mitochondrial Respirometry Alterations are Associated to Mitochondrial Mass Decrease Related to Mitochondrial Biogenesis Reduction
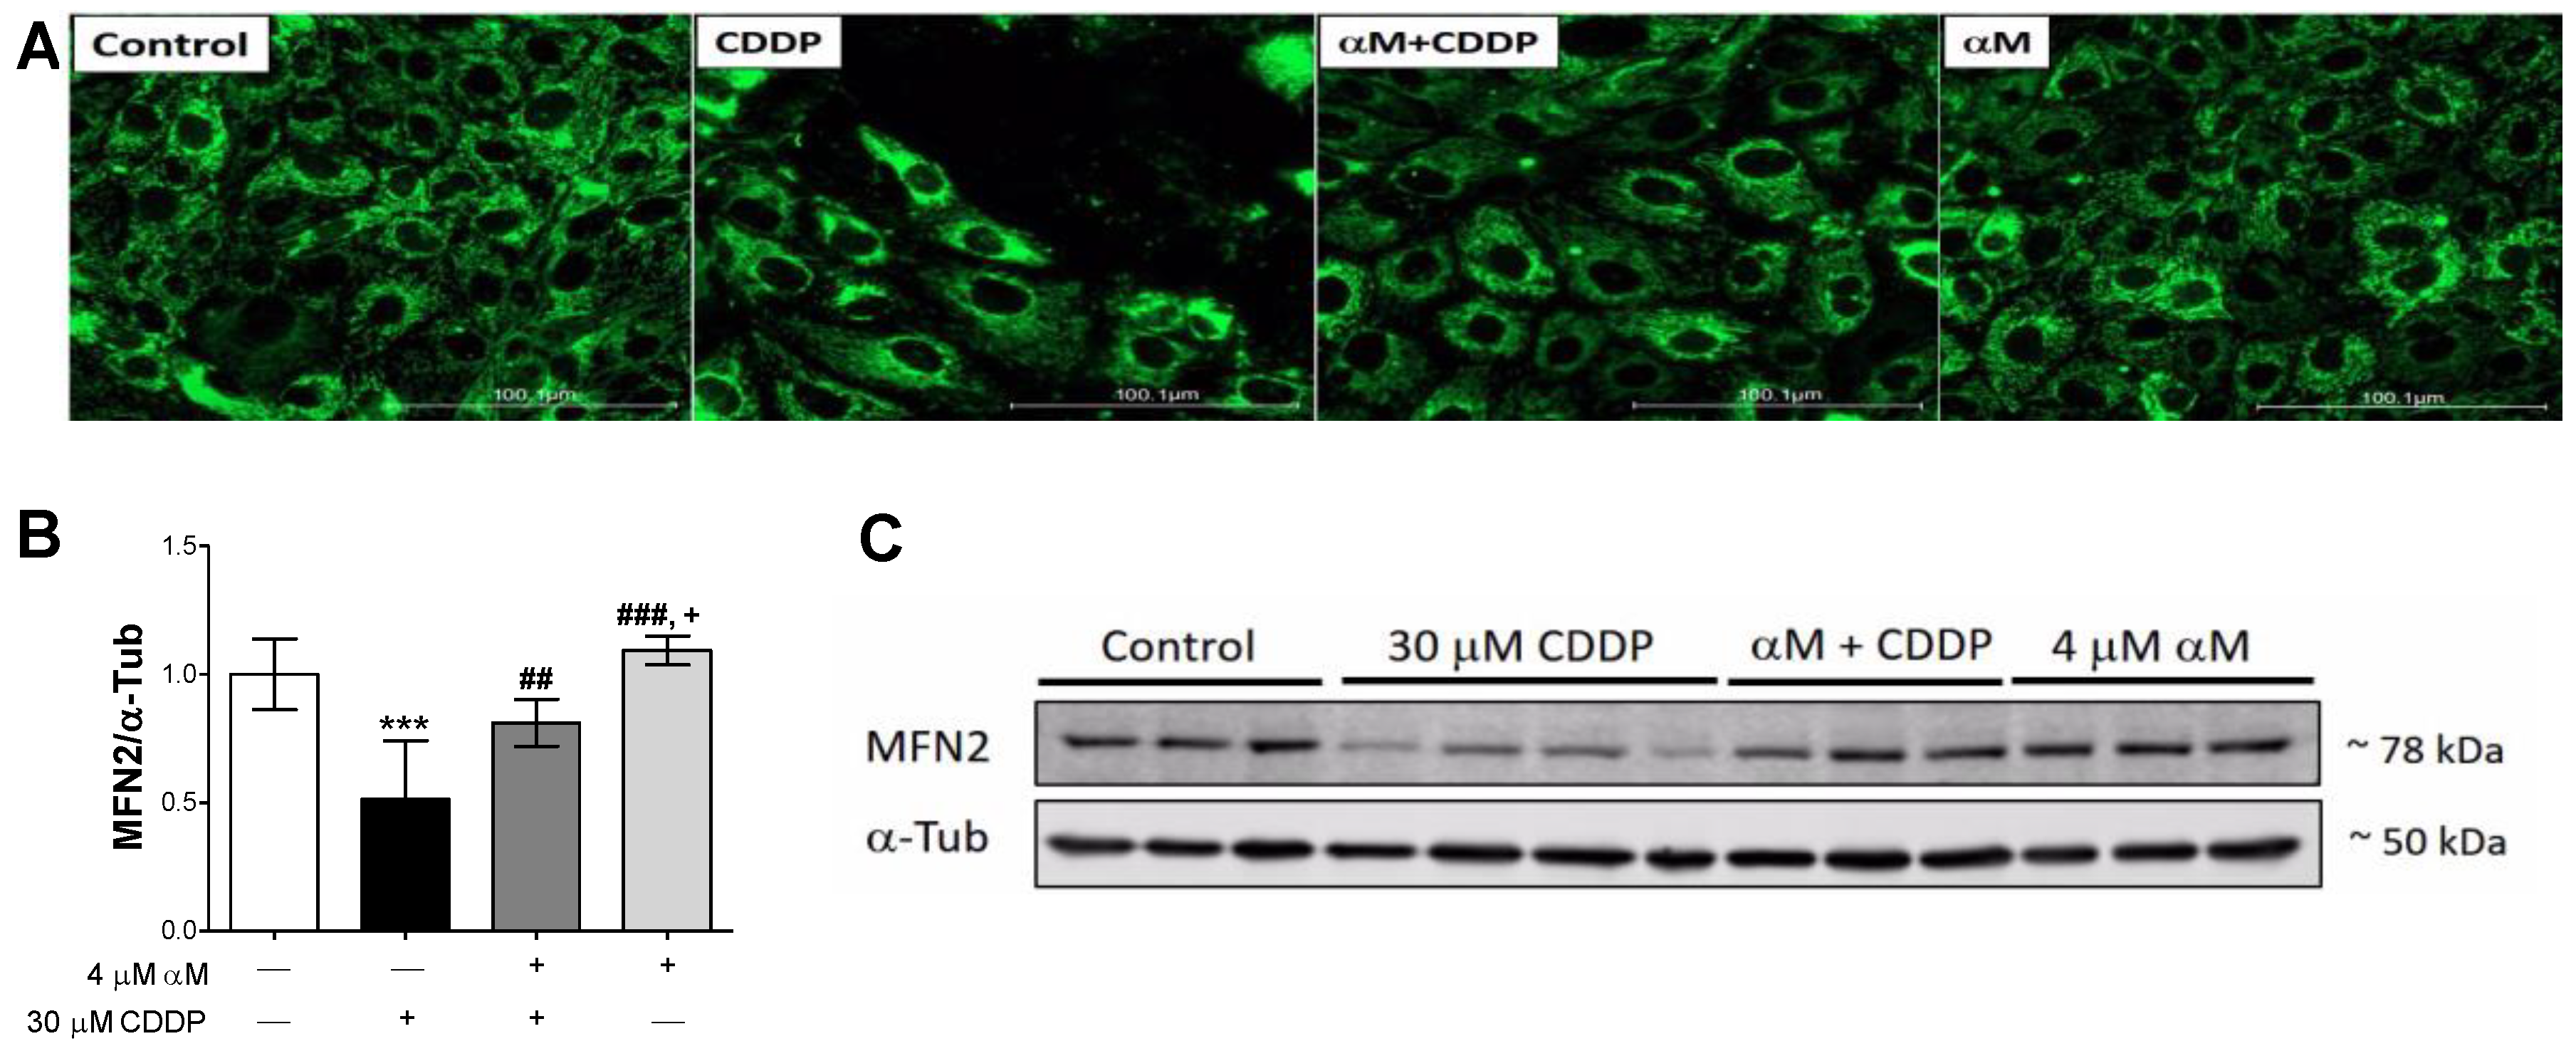
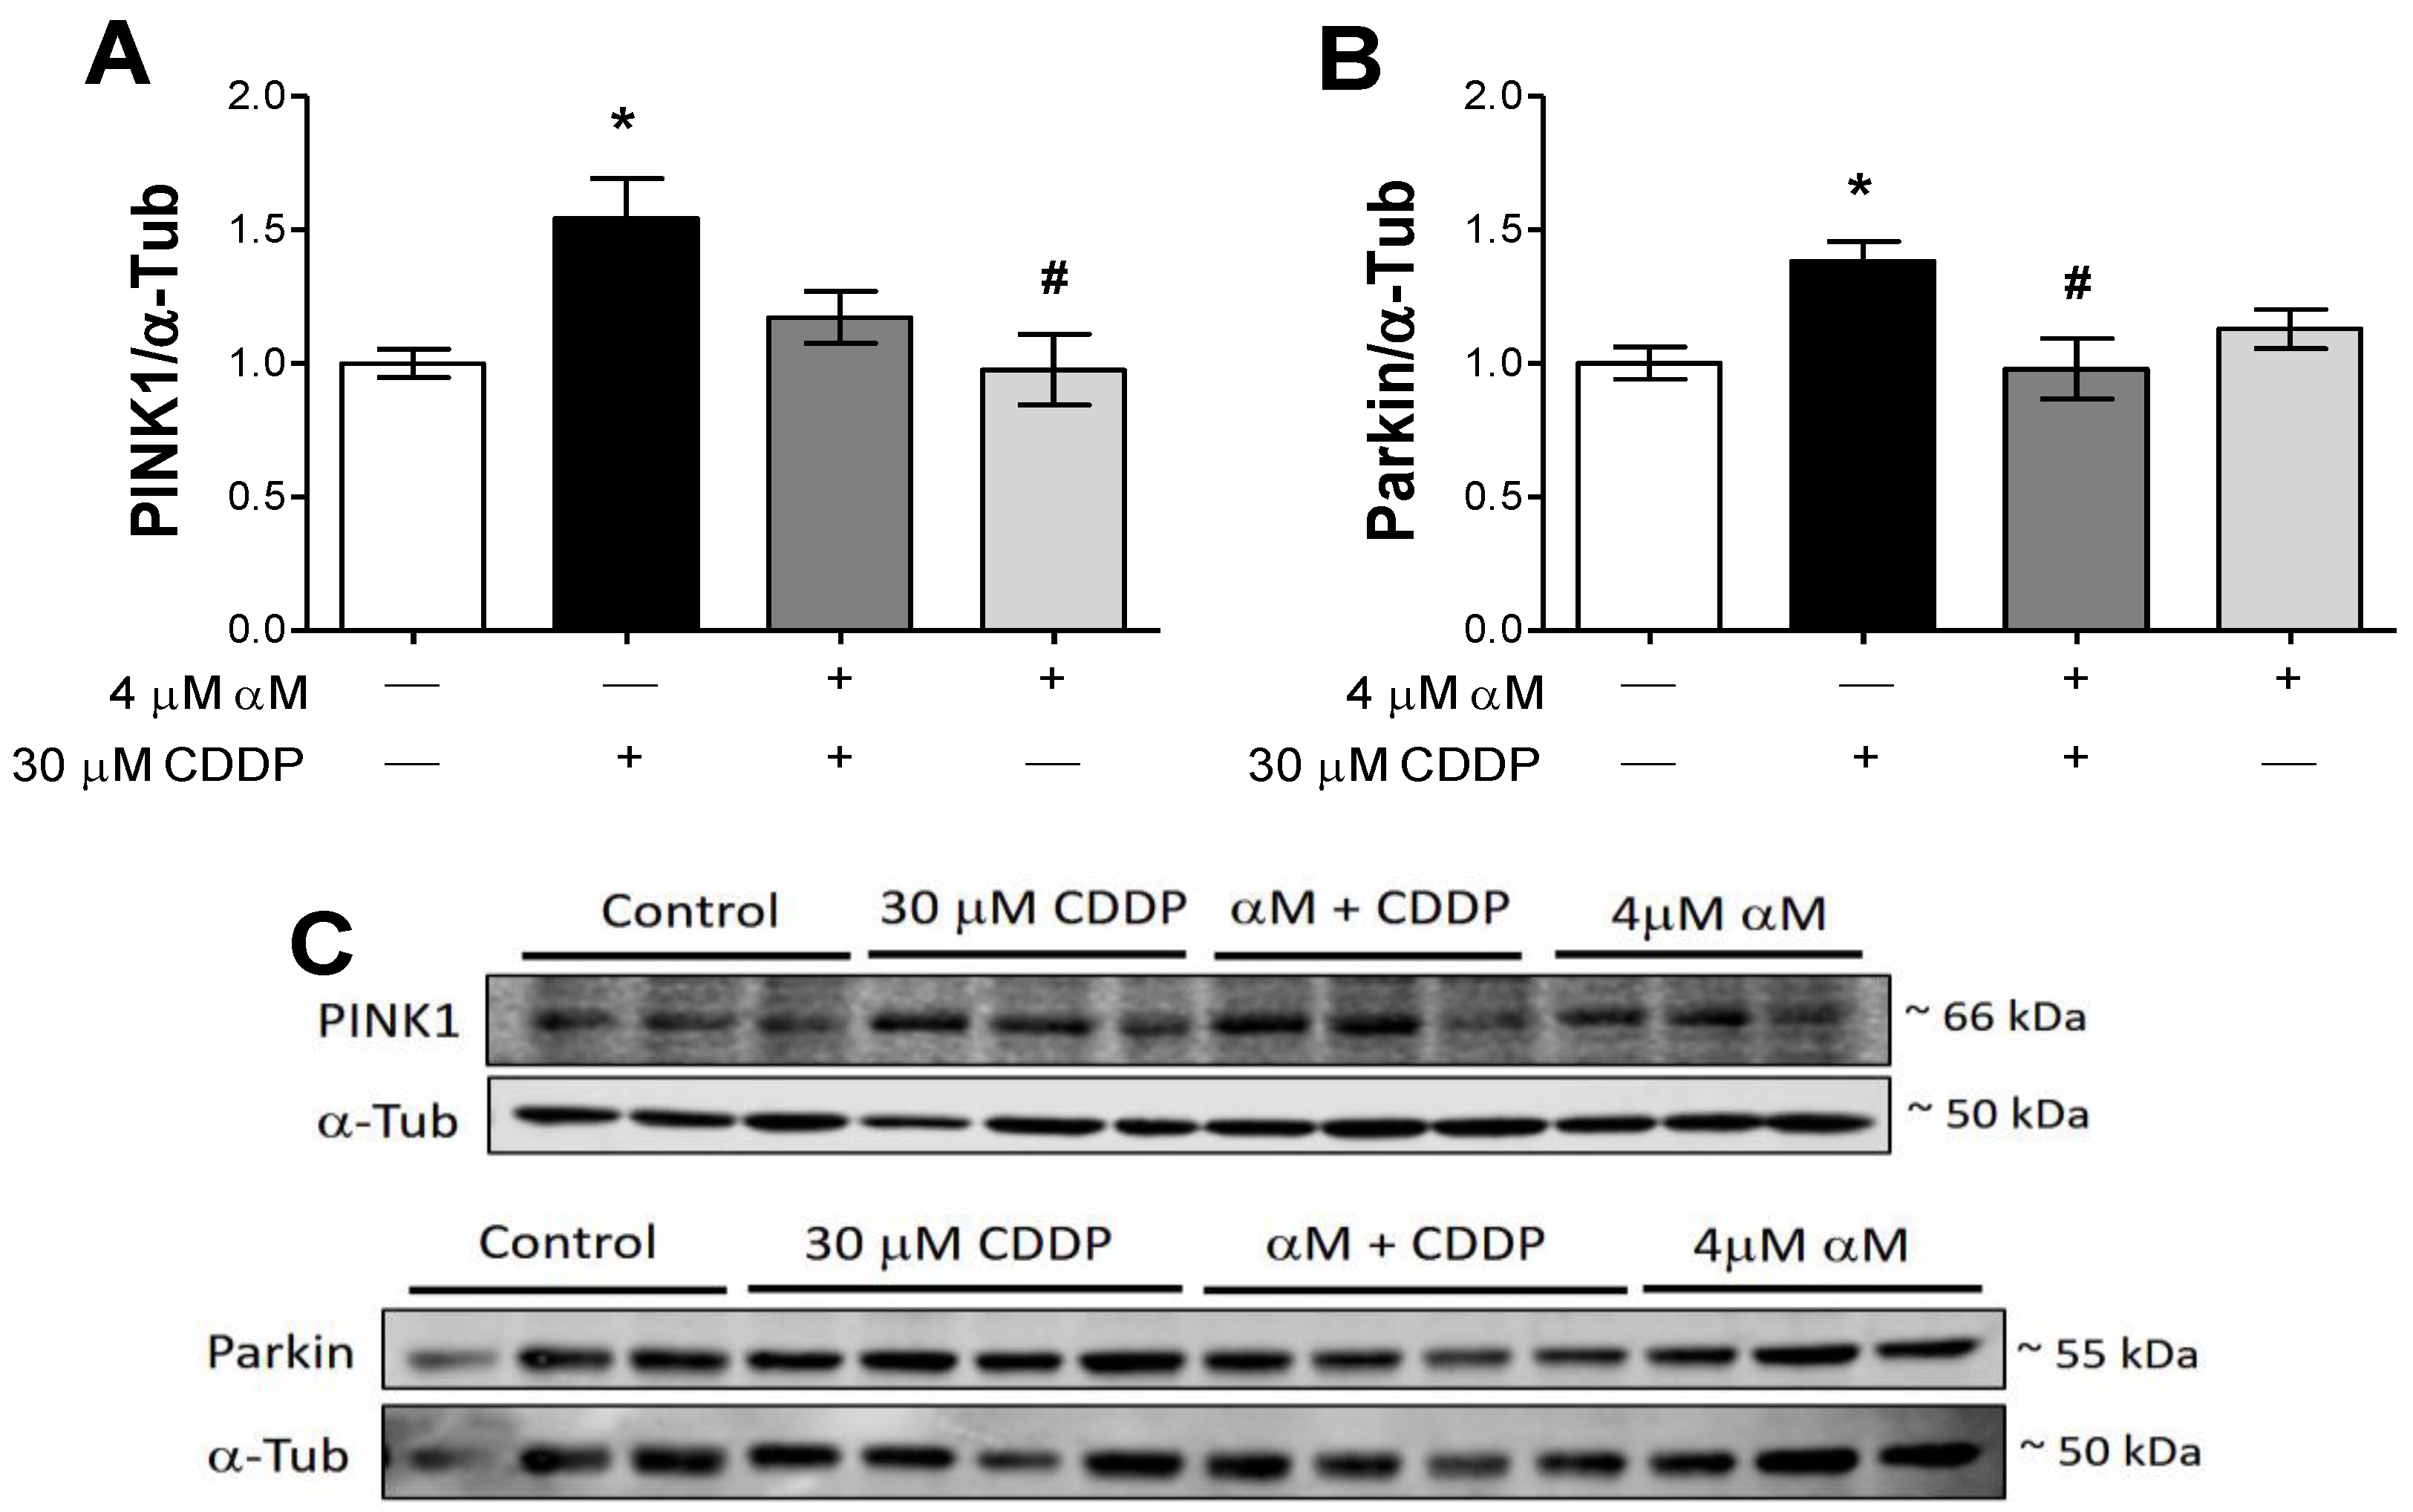
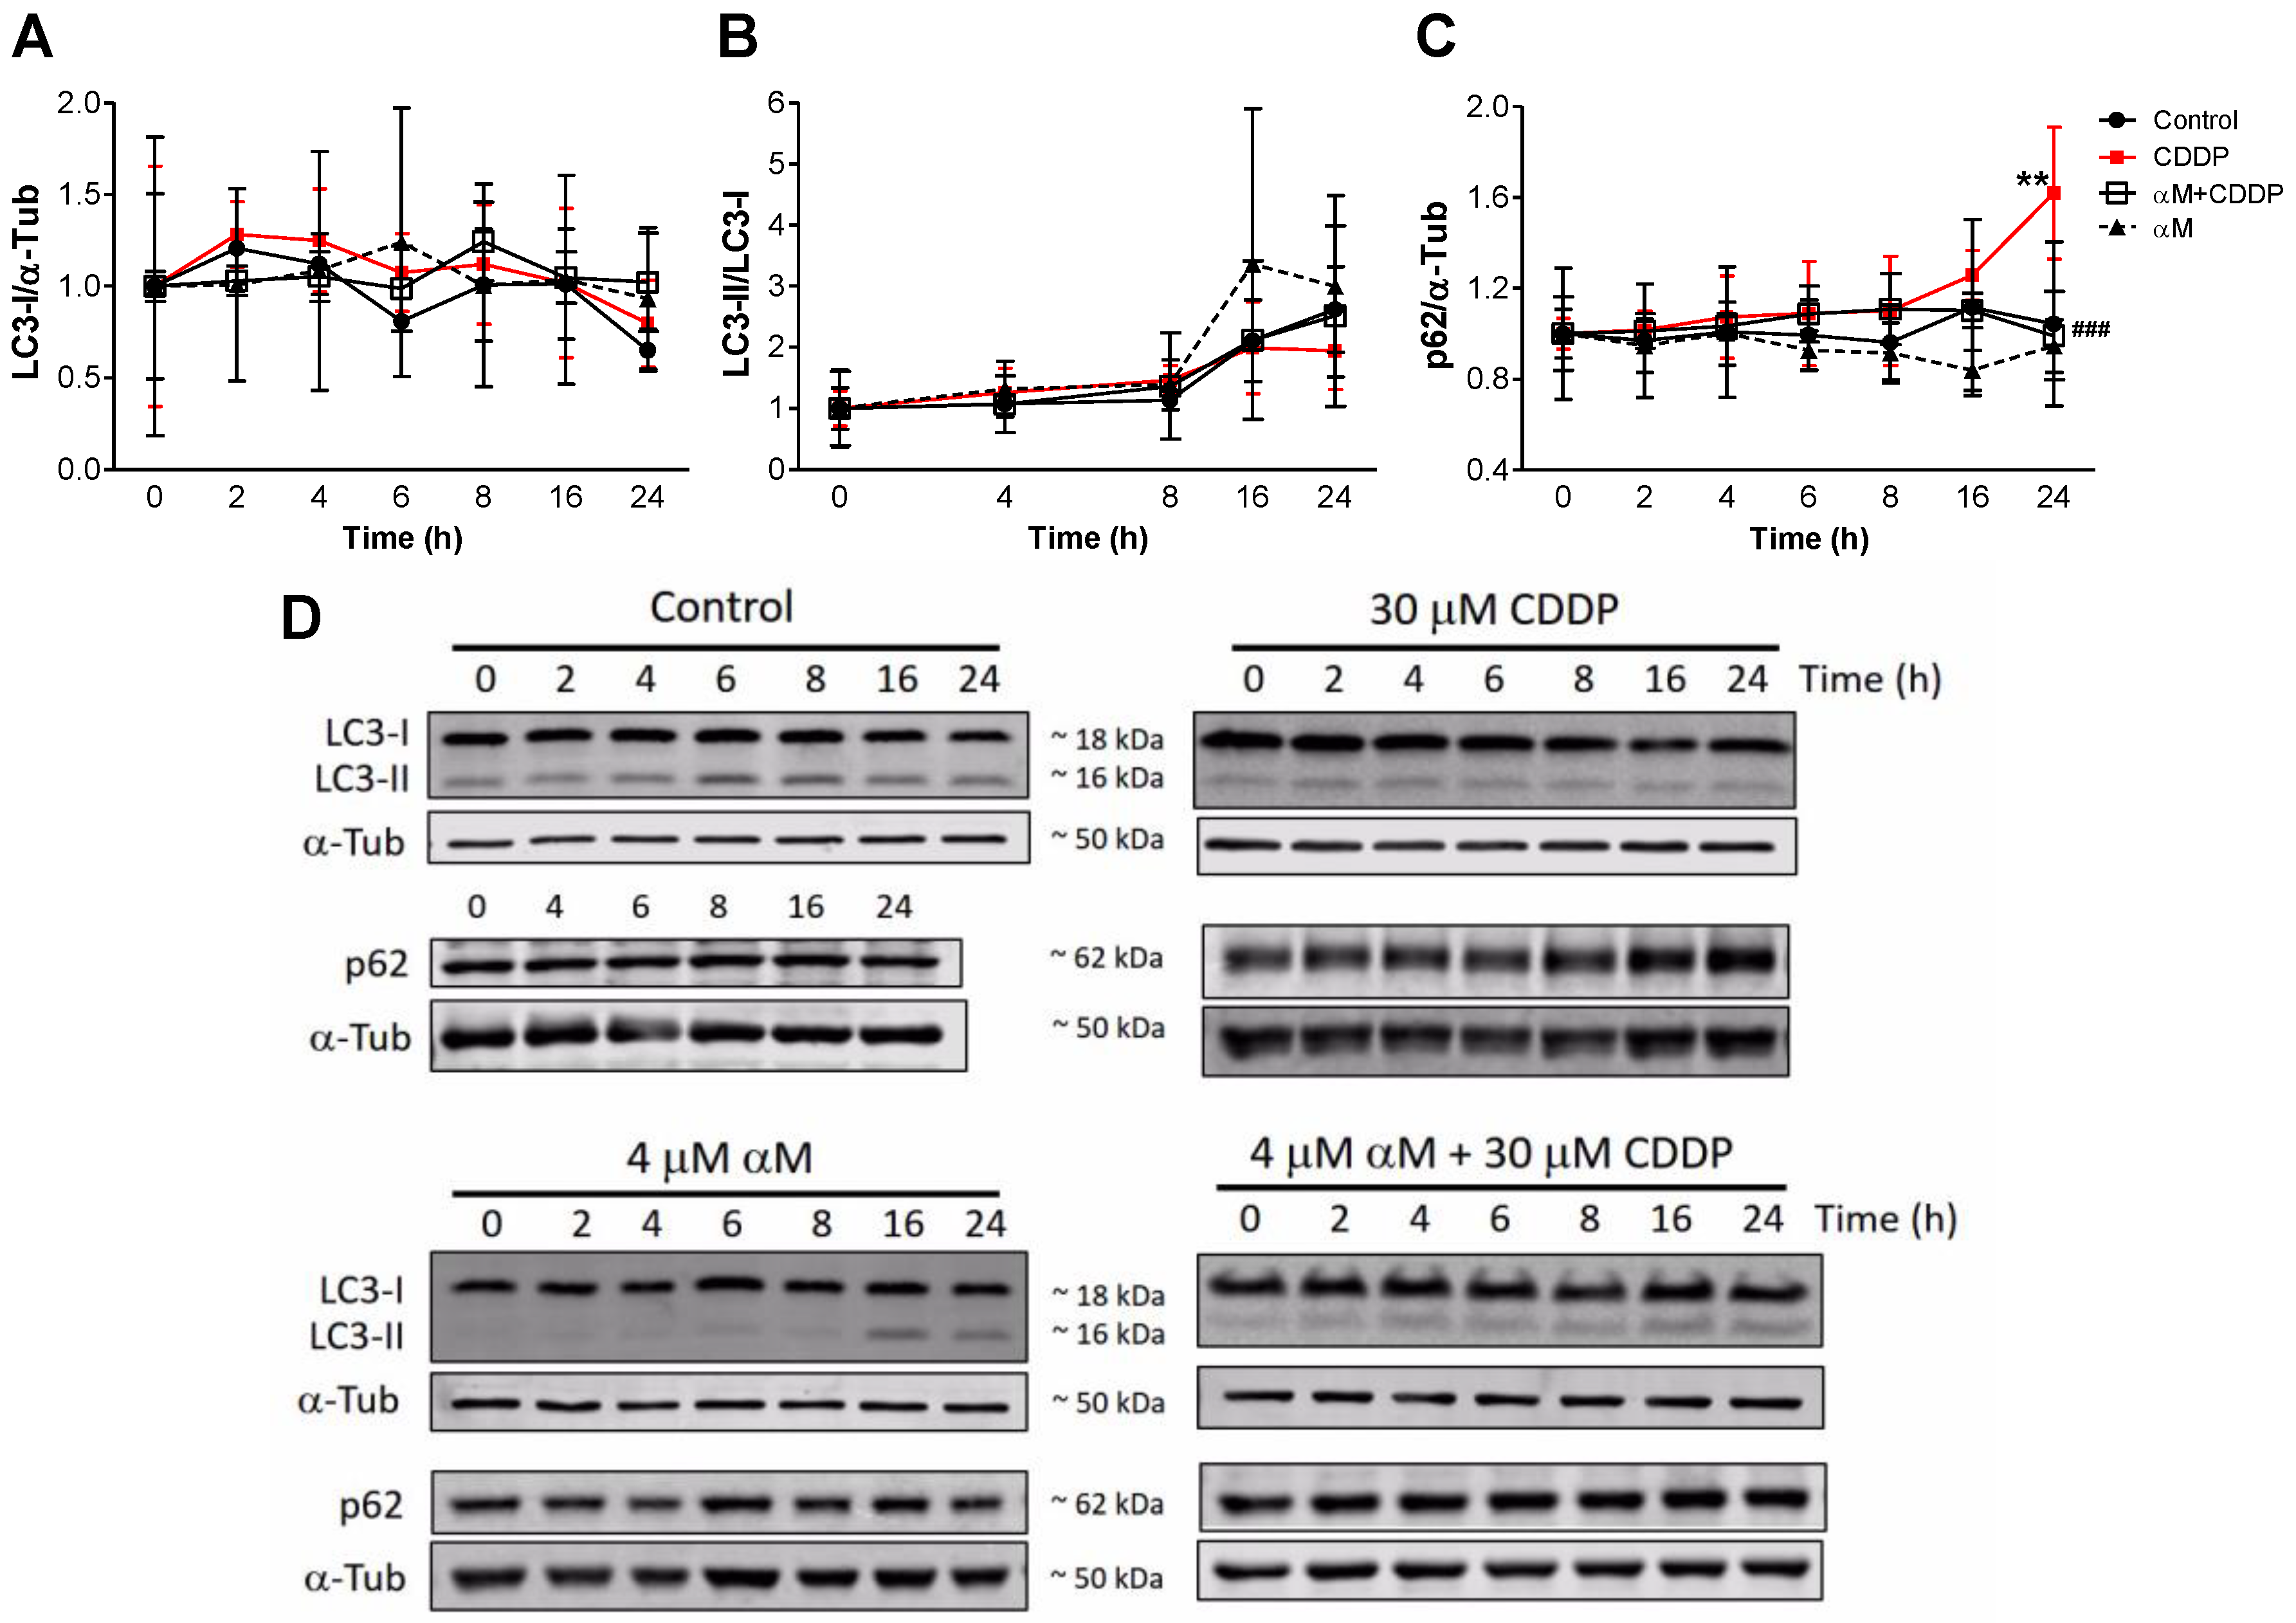
3.4. The Induction of Mitophagy is Related to Protection by αM
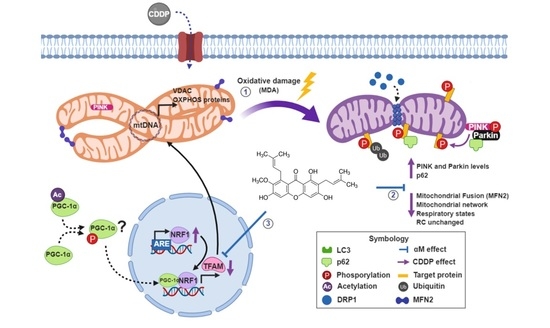
4. Discussion
5. Conclusions
Author Contributions
Funding
Acknowledgments
Conflicts of Interest
References
- Duffy, E.A.; Fitzgerald, W.; Boyle, K.; Rohatgi, R. Nephrotoxicity: Evidence in Patients Receiving Cisplatin Therapy. Clin. J. Oncol. Nurs. 2018, 22, 175–183. [Google Scholar] [CrossRef] [PubMed]
- Manohar, S.; Leung, N. Cisplatin nephrotoxicity: A review of the literature. J. Nephrol. 2018, 31, 15–25. [Google Scholar] [CrossRef]
- Pérez-Rojas, J.M.; Cruz, C.; García-López, P.; Sánchez-González, D.J.; Martínez-Martínez, C.M.; Ceballos, G.; Espinosa, M.; Meléndez-Zajgla, J.; Pedraza-Chaverri, J. Renoprotection by alpha-Mangostin is related to the attenuation in renal oxidative/nitrosative stress induced by cisplatin nephrotoxicity. Free Radic. Res. 2009, 43, 1122–1132. [Google Scholar] [CrossRef] [PubMed]
- Sancho-Martínez, S.M.; Prieto-García, L.; Prieto, M.; López-Novoa, J.M.; López-Hernández, F.J. Subcellular targets of cisplatin cytotoxicity: An integrated view. Pharmacol. Ther. 2012, 136, 35–55. [Google Scholar] [CrossRef]
- Heidari-Soreshjani, S.; Asadi-Samani, M.; Yang, Q.; Saeedi-Boroujeni, A. Phytotherapy of nephrotoxicity-induced by cancer drugs: An updated review. J. Nephropathol. 2017, 6, 254–263. [Google Scholar] [CrossRef] [PubMed]
- Ovalle-Magallanes, B.; Eugenio-Pérez, D.; Pedraza-Chaverri, J. Medicinal properties of mangosteen (Garcinia mangostana L.): A comprehensive update. Food Chem. Toxicol. 2017, 109, 102–122. [Google Scholar] [CrossRef]
- Pérez-Rojas, J.M.; González-Macías, R.; González-Cortes, J.; Jurado, R.; Pedraza-Chaverri, J.; García-López, P. Synergic Effect of α-Mangostin on the Cytotoxicity of Cisplatin in a Cervical Cancer Model. Oxid. Med. Cell. Longev. 2016, 2016, 7981397. [Google Scholar] [CrossRef]
- Pedraza-Chaverri, J.; Cárdenas-Rodríguez, N.; Orozco-Ibarra, M.; Pérez-Rojas, J.M. Medicinal properties of mangosteen (Garcinia mangostana). Food Chem. Toxicol. 2008, 46, 3227–3239. [Google Scholar] [CrossRef] [PubMed]
- Sánchez-Pérez, Y.; Morales-Bárcenas, R.; García-Cuellar, C.M.; López-Marure, R.; Calderon-Oliver, M.; Pedraza-Chaverri, J.; Chirino, Y.I. The alpha-mangostin prevention on cisplatin-induced apoptotic death in LLC-PK1 cells is associated to an inhibition of ROS production and p53 induction. Chem. Biol. Interact. 2010, 188, 144–150. [Google Scholar] [CrossRef]
- Lee, C.-H.; Ying, T.-H.; Chiou, H.-L.; Hsieh, S.-C.; Wen, S.-H.; Chou, R.-H.; Hsieh, Y.-H. Alpha-mangostin induces apoptosis through activation of reactive oxygen species and ASK1/p38 signaling pathway in cervical cancer cells. Oncotarget 2017, 8, 47425–47439. [Google Scholar] [CrossRef] [Green Version]
- Liu, G.; Tang, L.; She, J.; Xu, J.; Gu, Y.; Liu, H.; He, L. Alpha-mangostin attenuates focal segmental glomerulosclerosis of mice induced by adriamycin. Zhong Nan Da Xue Xue Bao Yi Xue Ban 2018, 43, 1089–1096. [Google Scholar] [PubMed]
- Wang, M.-H.; Zhang, K.-J.; Gu, Q.-L.; Bi, X.-L.; Wang, J.-X. Pharmacology of mangostins and their derivatives: A comprehensive review. Chin. J. Nat. Med. 2017, 15, 81–93. [Google Scholar] [CrossRef]
- Ralto, K.M.; Parikh, S.M. Mitochondria in Acute Kidney Injury. Semin. Nephrol. 2016, 36, 8–16. [Google Scholar] [CrossRef] [PubMed]
- Ortega-Domínguez, B.; Aparicio-Trejo, O.E.; García-Arroyo, F.E.; León-Contreras, J.C.; Tapia, E.; Molina-Jijón, E.; Hernández-Pando, R.; Sánchez-Lozada, L.G.; Barrera-Oviedo, D.; Pedraza-Chaverri, J. Curcumin prevents cisplatin-induced renal alterations in mitochondrial bioenergetics and dynamic. Food Chem. Toxicol. 2017, 107, 373–385. [Google Scholar] [CrossRef] [PubMed]
- Pan, H.; Chen, J.; Shen, K.; Wang, X.; Wang, P.; Fu, G.; Meng, H.; Wang, Y.; Jin, B. Mitochondrial modulation by Epigallocatechin 3-Gallate ameliorates cisplatin induced renal injury through decreasing oxidative/nitrative stress, inflammation and NF-kB in mice. PLoS ONE 2015, 10, e0124775. [Google Scholar] [CrossRef]
- Yang, Y.; Liu, H.; Liu, F.; Dong, Z. Mitochondrial dysregulation and protection in cisplatin nephrotoxicity. Arch. Toxicol. 2014, 88, 1249–1256. [Google Scholar] [CrossRef] [PubMed]
- Yu, X.; Meng, X.; Xu, M.; Zhang, X.; Zhang, Y.; Ding, G.; Huang, S.; Zhang, A.; Jia, Z. Celastrol ameliorates cisplatin nephrotoxicity by inhibiting NF-κB and improving mitochondrial function. EBioMedicine 2018, 36, 266–280. [Google Scholar] [CrossRef] [PubMed]
- Kaushal, G.P.; Shah, S.V. Autophagy in acute kidney injury. Kidney Int. 2016, 89, 779–791. [Google Scholar] [CrossRef]
- Galluzzi, L.; Baehrecke, E.H.; Ballabio, A.; Boya, P.; Bravo-San Pedro, J.M.; Cecconi, F.; Choi, A.M.; Chu, C.T.; Codogno, P.; Colombo, M.I.; et al. Molecular definitions of autophagy and related processes. EMBO J. 2017, 36, 1811–1836. [Google Scholar] [CrossRef] [Green Version]
- Takahashi, A.; Kimura, T.; Takabatake, Y.; Namba, T.; Kaimori, J.; Kitamura, H.; Matsui, I.; Niimura, F.; Matsusaka, T.; Fujita, N.; et al. Autophagy guards against cisplatin-induced acute kidney injury. Am. J. Pathol. 2012, 180, 517–525. [Google Scholar] [CrossRef] [PubMed]
- Yang, C.; Kaushal, V.; Shah, S.V.; Kaushal, G.P. Autophagy is associated with apoptosis in cisplatin injury to renal tubular epithelial cells. Am. J. Physiol. Renal Physiol. 2008, 294, F777–F787. [Google Scholar] [CrossRef] [PubMed]
- Zhao, C.; Chen, Z.; Qi, J.; Duan, S.; Huang, Z.; Zhang, C.; Wu, L.; Zeng, M.; Zhang, B.; Wang, N.; et al. Drp1-dependent mitophagy protects against cisplatin-induced apoptosis of renal tubular epithelial cells by improving mitochondrial function. Oncotarget 2017, 8, 20988–21000. [Google Scholar] [CrossRef] [PubMed] [Green Version]
- Ichinomiya, M.; Shimada, A.; Ohta, N.; Inouchi, E.; Ogihara, K.; Naya, Y.; Nagane, M.; Morita, T.; Satoh, M. Demonstration of Mitochondrial Damage and Mitophagy in Cisplatin-Mediated Nephrotoxicity. Tohoku J. Exp. Med. 2018, 246, 1–8. [Google Scholar] [CrossRef] [PubMed]
- Wang, Y.; Tang, C.; Cai, J.; Chen, G.; Zhang, D.; Zhang, Z.; Dong, Z. PINK1/Parkin-mediated mitophagy is activated in cisplatin nephrotoxicity to protect against kidney injury. Cell Death Dis. 2018, 9, 1113. [Google Scholar] [CrossRef] [PubMed]
- Nava Catorce, M.; Acero, G.; Pedraza-Chaverri, J.; Fragoso, G.; Govezensky, T.; Gevorkian, G. Alpha-mangostin attenuates brain inflammation induced by peripheral lipopolysaccharide administration in C57BL/6J mice. J. Neuroimmunol. 2016, 297, 20–27. [Google Scholar] [CrossRef] [PubMed]
- Patricia Moreno-Londoño, A.; Bello-Alvarez, C.; Pedraza-Chaverri, J. Isoliquiritigenin pretreatment attenuates cisplatin induced proximal tubular cells (LLC-PK1) death and enhances the toxicity induced by this drug in bladder cancer T24 cell line. Food Chem. Toxicol. 2017, 109, 143–154. [Google Scholar] [CrossRef] [PubMed]
- Aparicio-Trejo, O.E.; Reyes-Fermín, L.M.; Briones-Herrera, A.; Tapia, E.; León-Contreras, J.C.; Hernández-Pando, R.; Sánchez-Lozada, L.G.; Pedraza-Chaverri, J. Protective effects of N-acetyl-cysteine in mitochondria bioenergetics, oxidative stress, dynamics and S-glutathionylation alterations in acute kidney damage induced by folic acid. Free Radic. Biol. Med. 2019, 130, 379–396. [Google Scholar] [CrossRef]
- Lowry, O.H.; Rosebrough, N.J.; Farr, A.L.; Randall, R.J. Protein measurement with the Folin phenol reagent. J. Biol. Chem. 1951, 193, 265–275. [Google Scholar]
- Romero-Calvo, I.; Ocón, B.; Martínez-Moya, P.; Suárez, M.D.; Zarzuelo, A.; Martínez-Augustin, O.; de Medina, F.S. Reversible Ponceau staining as a loading control alternative to actin in Western blots. Anal. Biochem. 2010, 401, 318–320. [Google Scholar] [CrossRef] [PubMed]
- Zhao, M.; Zhou, Y.; Liu, S.; Li, L.; Chen, Y.; Cheng, J.; Lu, Y.; Liu, J. Control release of mitochondria-targeted antioxidant by injectable self-assembling peptide hydrogel ameliorated persistent mitochondrial dysfunction and inflammation after acute kidney injury. Drug Deliv. 2018, 25, 546–554. [Google Scholar] [CrossRef] [Green Version]
- Wang, C.; Li, L.; Liu, S.; Liao, G.; Li, L.; Chen, Y.; Cheng, J.; Lu, Y.; Liu, J. GLP-1 receptor agonist ameliorates obesity-induced chronic kidney injury via restoring renal metabolism homeostasis. PLoS ONE 2018, 13, e0193473. [Google Scholar] [CrossRef]
- Svensson, K.; Schnyder, S.; Cardel, B.; Handschin, C. Loss of Renal Tubular PGC-1α Exacerbates Diet-Induced Renal Steatosis and Age-Related Urinary Sodium Excretion in Mice. PLoS ONE 2016, 11, e0158716. [Google Scholar] [CrossRef] [PubMed]
- Sun, L.; Yuan, Q.; Xu, T.; Yao, L.; Feng, J.; Ma, J.; Wang, L.; Lu, C.; Wang, D. Pioglitazone Improves Mitochondrial Function in the Remnant Kidney and Protects against Renal Fibrosis in 5/6 Nephrectomized Rats. Front. Pharmacol. 2017, 8, 545. [Google Scholar] [CrossRef] [PubMed]
- Smith, J.A.; Stallons, L.J.; Collier, J.B.; Chavin, K.D.; Schnellmann, R.G. Suppression of mitochondrial biogenesis through toll-like receptor 4-dependent mitogen-activated protein kinase kinase/extracellular signal-regulated kinase signaling in endotoxin-induced acute kidney injury. J. Pharmacol. Exp. Ther. 2015, 352, 346–357. [Google Scholar] [CrossRef] [PubMed]
- Aparicio-Trejo, O.E.; Tapia, E.; Sánchez-Lozada, L.G.; Pedraza-Chaverri, J. Mitochondrial bioenergetics, redox state, dynamics and turnover alterations in renal mass reduction models of chronic kidney diseases and their possible implications in the progression of this illness. Pharmacol. Res. 2018, 135, 1–11. [Google Scholar] [CrossRef] [PubMed]
- Presley, A.D.; Fuller, K.M.; Arriaga, E.A. MitoTracker Green labeling of mitochondrial proteins and their subsequent analysis by capillary electrophoresis with laser-induced fluorescence detection. J. Chromatogr. B Analyt. Technol. Biomed. Life Sci. 2003, 793, 141–150. [Google Scholar] [CrossRef]
- Geisler, S.; Holmström, K.M.; Skujat, D.; Fiesel, F.C.; Rothfuss, O.C.; Kahle, P.J.; Springer, W. PINK1/Parkin-mediated mitophagy is dependent on VDAC1 and p62/SQSTM1. Nat. Cell Biol. 2010, 12, 119–131. [Google Scholar] [CrossRef]
- Liu, H.; Dai, C.; Fan, Y.; Guo, B.; Ren, K.; Sun, T.; Wang, W. From autophagy to mitophagy: The roles of P62 in neurodegenerative diseases. J. Bioenerg. Biomembr. 2017, 49, 413–422. [Google Scholar] [CrossRef]
- Peres, L.A.B.; da Cunha, A.D. Acute nephrotoxicity of cisplatin: Molecular mechanisms. Braz. J. Nephrol. 2013, 35, 332–340. [Google Scholar] [CrossRef]
- Zhang, L.; Cooper, A.J.L.; Krasnikov, B.F.; Xu, H.; Bubber, P.; Pinto, J.T.; Gibson, G.E.; Hanigan, M.H. Cisplatin-induced toxicity is associated with platinum deposition in mouse kidney mitochondria in vivo and with selective inactivation of the alpha-ketoglutarate dehydrogenase complex in LLC-PK1 cells. Biochemistry 2006, 45, 8959–8971. [Google Scholar] [CrossRef]
- Cunningham, R.M.; DeRose, V.J. Platinum Binds Proteins in the Endoplasmic Reticulum of S. cerevisiae and Induces Endoplasmic Reticulum Stress. ACS Chem. Biol. 2017, 12, 2737–2745. [Google Scholar] [CrossRef] [PubMed]
- Hull, R.N.; Cherry, W.R.; Weaver, G.W. The origin and characteristics of a pig kidney cell strain, LLC-PK. In Vitro 1976, 12, 670–677. [Google Scholar] [CrossRef]
- Nielsen, R.; Birn, H.; Moestrup, S.K.; Nielsen, M.; Verroust, P.; Christensen, E.I. Characterization of a kidney proximal tubule cell line, LLC-PK1, expressing endocytotic active megalin. J. Am. Soc. Nephrol. JASN 1998, 9, 1767–1776. [Google Scholar] [PubMed]
- Bergeron, M.; Thiéry, G.; Lenoir, F.; Giocondi, M.C.; Le Grimellec, C. Organization of the endoplasmic reticulum in renal cell lines MDCK and LLC-PK1. Cell Tissue Res. 1994, 277, 297–307. [Google Scholar] [CrossRef] [PubMed]
- Liu, H.; Baliga, R. Endoplasmic reticulum stress-associated caspase 12 mediates cisplatin-induced LLC-PK1 cell apoptosis. J. Am. Soc. Nephrol. JASN 2005, 16, 1985–1992. [Google Scholar] [CrossRef] [PubMed]
- Sanchis-Gomar, F.; García-Giménez, J.L.; Gómez-Cabrera, M.C.; Pallardó, F.V. Mitochondrial biogenesis in health and disease. Molecular and therapeutic approaches. Curr. Pharm. Des. 2014, 20, 5619–5633. [Google Scholar] [CrossRef] [PubMed]
- Piantadosi, C.A.; Carraway, M.S.; Babiker, A.; Suliman, H.B. Heme oxygenase-1 regulates cardiac mitochondrial biogenesis via Nrf2-mediated transcriptional control of nuclear respiratory factor-1. Circ. Res. 2008, 103, 1232–1240. [Google Scholar] [CrossRef] [PubMed]
- Fang, Y.; Su, T.; Qiu, X.; Mao, P.; Xu, Y.; Hu, Z.; Zhang, Y.; Zheng, X.; Xie, P.; Liu, Q. Protective effect of alpha-mangostin against oxidative stress induced-retinal cell death. Sci. Rep. 2016, 6, 21018. [Google Scholar] [CrossRef] [PubMed] [Green Version]
- Fu, T.; Li, H.; Zhao, Y.; Cai, E.; Zhu, H.; Li, P.; Liu, J. Hepatoprotective effect of α-mangostin against lipopolysaccharide/d-galactosamine-induced acute liver failure in mice. Biomed. Pharmacother. Biomed. Pharmacother. 2018, 106, 896–901. [Google Scholar] [CrossRef] [PubMed]
- Sampath, P.D.; Kannan, V. Mitigation of mitochondrial dysfunction and regulation of eNOS expression during experimental myocardial necrosis by alpha-mangostin, a xanthonic derivative from Garcinia mangostana. Drug Chem. Toxicol. 2009, 32, 344–352. [Google Scholar] [CrossRef] [PubMed]
- Tsai, S.-Y.; Chung, P.-C.; Owaga, E.E.; Tsai, I.-J.; Wang, P.-Y.; Tsai, J.-I.; Yeh, T.-S.; Hsieh, R.-H. Alpha-mangostin from mangosteen (Garcinia mangostana Linn.) pericarp extract reduces high fat-diet induced hepatic steatosis in rats by regulating mitochondria function and apoptosis. Nutr. Metab. 2016, 13, 88. [Google Scholar] [CrossRef] [PubMed]
- Martínez-Abundis, E.; García, N.; Correa, F.; Hernández-Reséndiz, S.; Pedraza-Chaverri, J.; Zazueta, C. Effects of alpha-mangostin on mitochondrial energetic metabolism. Mitochondrion 2010, 10, 151–157. [Google Scholar] [CrossRef] [PubMed]
- Zhu, G.; Lee, A.S. Role of the unfolded protein response, GRP78 and GRP94 in organ homeostasis. J. Cell. Physiol. 2015, 230, 1413–1420. [Google Scholar] [CrossRef] [PubMed]


© 2019 by the authors. Licensee MDPI, Basel, Switzerland. This article is an open access article distributed under the terms and conditions of the Creative Commons Attribution (CC BY) license (http://creativecommons.org/licenses/by/4.0/).
Share and Cite
Reyes-Fermín, L.M.; Avila-Rojas, S.H.; Aparicio-Trejo, O.E.; Tapia, E.; Rivero, I.; Pedraza-Chaverri, J. The Protective Effect of Alpha-Mangostin against Cisplatin-Induced Cell Death in LLC-PK1 Cells is Associated to Mitochondrial Function Preservation. Antioxidants 2019, 8, 133. https://0-doi-org.brum.beds.ac.uk/10.3390/antiox8050133
Reyes-Fermín LM, Avila-Rojas SH, Aparicio-Trejo OE, Tapia E, Rivero I, Pedraza-Chaverri J. The Protective Effect of Alpha-Mangostin against Cisplatin-Induced Cell Death in LLC-PK1 Cells is Associated to Mitochondrial Function Preservation. Antioxidants. 2019; 8(5):133. https://0-doi-org.brum.beds.ac.uk/10.3390/antiox8050133
Chicago/Turabian StyleReyes-Fermín, Laura María, Sabino Hazael Avila-Rojas, Omar Emiliano Aparicio-Trejo, Edilia Tapia, Isabel Rivero, and José Pedraza-Chaverri. 2019. "The Protective Effect of Alpha-Mangostin against Cisplatin-Induced Cell Death in LLC-PK1 Cells is Associated to Mitochondrial Function Preservation" Antioxidants 8, no. 5: 133. https://0-doi-org.brum.beds.ac.uk/10.3390/antiox8050133