Article

Epigenetic Scanning of KEAP1 CpG Sites Uncovers New Molecular-Driven Patterns in Lung Adeno and Squamous Cell Carcinomas

by
Federico Pio Fabrizio
1,*,†,
Tommaso Mazza
2,†,
Stefano Castellana
2,
Angelo Sparaneo
1 and
Lucia Anna Muscarella
1,*
1
Laboratory of Oncology, Fondazione IRCCS Casa Sollievo della Sofferenza, San Giovanni Rotondo, 71013 Foggia, Italy
2
Unit of Bioinformatics, Fondazione IRCCS Casa Sollievo della Sofferenza, San Giovanni Rotondo, 71013 Foggia, Italy
*
Authors to whom correspondence should be addressed.
These authors contributed equally in this work.
Submission received: 23 July 2020 / Revised: 18 September 2020 / Accepted: 19 September 2020 / Published: 22 September 2020
(This article belongs to the Special Issue Keap1/Nrf2 Signaling Pathway)

Abstract

:
Background: The KEAP1/NRF2 (Kelch-like ECH-associated protein 1/nuclear factor erythroid 2–related factor 2) pathway modulates detoxification processes and participates in the resistance of solid tumors to therapy. Scientific evidence about the presence of genetic and epigenetic abnormalities of the KEAP1 gene was firstly reported in non-small-cell lung cancer (NSCLC) and then described in other tumors. At present, the prognostic role of aberrant methylation at cytosine-guanine dinucleotide (CpG) sites of the KEAP1 gene promoter is debated in NSCLC, and its correlation with transcriptional changes and protein levels remains to be defined in large sample cohorts. Methods: We evaluated and compared multiple KEAP1 omics data (methylation, transcript, and protein expression levels) from The Cancer Genome Atlas (TCGA) to explore the role of CpGs located in different portions of KEAP1 and the correlation between methylation, transcription, and protein levels. Data from two subsets of lung adenocarcinoma (LUAD, n = 617) and lung squamous cell carcinoma (LUSC, n = 571) cohorts of NSCLC patients with different disease stages were evaluated. Results: We found that the methylation levels of many KEAP1 CpGs at various promoter and intragenic locations showed a significant inverse correlation with the transcript levels. Interestingly, these results were limited to the KRAS wild-type LUSC and LUAD cohorts, whereas in LUAD the effect of the epigenetic silencing of KEAP1 on its transcription was also observed in the EGFR mutated subpopulation. Conclusions: These results support the idea that the prognostic role of KEAP1 CpG sites warrants more in-depth investigation and that the impact of their changes in methylation levels may differ among specific NSCLC histologies and molecular backgrounds. Moreover, the observed impact of epigenetic silencing on KEAP1 expression in specific KRAS and EGFR settings may suggest a potential role of KEAP1 methylation as a predictive marker for NSCLC patients for whom anti-EGFR treatments are considered.

Graphical Abstract

1. Introduction

Lung cancer is the leading cause of cancer-related deaths worldwide. Due to the lack of symptoms in early-stage of the disease, most patients are diagnosed when the lung tumor is at an advanced stage, thus resulting in poor outcomes [1]. Hundreds of studies have been published on discovering new prognostic molecular factors beyond the tumor-node-metastasis (TNM) non-small-cell lung cancer (NSCLC) staging system, aiming to provide some new biological and clinical insights [2]. Interestingly, a significant translational impact in terms of increased risk of cancer progression and shorter overall survival was documented for alterations in the Kelch-like ECH-associated protein 1 (KEAP1) gene [3,4,5]. KEAP1 is a cytoplasmic anchor protein of Nuclear factor erythoid-2-related factor 2 (NRF2), encoded by the NFE2L2 gene, which predominantly acts as a key regulator of antioxidant stress responses also in the context of tumor resistance and progression [6,7,8]. In cancer, loss of KEAP1 function leads to enhanced activity of NRF2 and antioxidant-related element (ARE)-driven gene expression, thus promoting cellular resistance to oxidative stress, rapid proliferation, and metabolic deregulation [9]. Among the genetic lesions that affect KEAP1/NRF2 activity, point mutations were the first reported mechanism of deregulation in NSCLC and other solid tumors [6,10]. Generally, they commonly affect the exonic regions of the KEAP1 gene that code for the interaction sites between the Kelch/double-glycine repeat (DGR) domain of KEAP1 and the Nrf2-ECH homology (Neh2) domain of NRF2. Mutations in the KEAP1 or NFE2L2 genes are mutually exclusive and occur in NSCLC patients with a variable incidence (3.5–15% for KEAP1; 12–17% for NFE2L2), with the first ones mainly clustered with the lung adenocarcinoma (LUAD) histology [11,12,13]. In addition to the genetic lesions, epigenetic abnormalities, such as aberrant cytosine-guanine dinucleotide (CpG) methylation at the KEAP1 promoter island, have been widely reported as one of the main mechanisms of KEAP1 silencing in tumors [6]. Aberrant methylation at the KEAP1 promoter was firstly described in human NSCLC cell lines and tissues and involves the CpGs grouped into one main island located near the transcriptional start site (TSS) [14]. In consequence, the observed effect of KEAP1 methylation was to suppress gene expression by abrogating the Sp1 transcription factor binding sites in the promoter region [15]. This mechanism of KEAP1 epigenetic silencing was also reported in neoplastic tissues of patients affected by NSCLC and carcinoid tumors, and it was associated with increased risk of lung cancer progression in surgically resected NSCLC patients [16,17]. In clear-cell renal cell carcinoma (ccRCC), the epigenetic modulation of KEAP1 was shown to be the leading mechanism of KEAP1 deregulation, and it was able to strongly predict patient survival [18]. In primary breast cancers and pre-invasive lesions, aberrant KEAP1 promoter methylation was seen to be associated to the estrogen receptor (ER)-positive status and was hypothesized to be a prognostic marker of mortality risk [19]. Aberrant KEAP1 methylation was also reported in colorectal cancer cells and cancer tissues and was linked to a downregulation of its transcriptional activity and an upregulation of NRF2 and its target genes’ expression [20,21]. In pancreatic cancer cell lines, the suppression of KEAP1 protein by promoter methylation was demonstrated to be correlated with Ubiquitin-like containing PHD and RING finger domains 1 (UHRF1) increased expression, a scaffold protein for DNA methyltransferase 1 (DNMT1). Finally, in glioma KEAP1, methylation was inversely correlated with its transcription levels and reported as a predictor of patient outcome [22,23].
Despite the well-documented clinical impact of KEAP1 and NFE2L2 mutations [12], the role of aberrant KEAP1 methylation was not fully elucidated in NSCLC, and its clinical prognostic significance in many solid tumors remains controversial [17]. Studies on chemoresistance suggested that selective inhibition of KEAP1 methylation in adenocarcinoma cells could represent a marker of radiosensitizing effects in lung cancer [24]. More recently, our group observed that epigenetic deregulation of the KEAP1/NRF2 system by methylation at the KEAP1 promoter could involve only some CpGs at the P1a region, thus suggesting that an evaluation of each single CpG methylation status might give more information and have more translational utility than a semi-quantitative evaluation of an entire CpG island [17,25]. Less information is available in NSCLC about additional mechanisms of epigenetic modulation, such as alteration in poorly investigated intragenic methylation sites of the KEAP1 gene. The latest emerging roles of non-promoter CpG islands of cancer-related genes and the translational impact of KEAP1/NRF2 point mutations in predicting resistance to treatment further beg the question of the translational utility of KEAP1 methylation in the clinical context. It is thus important to clarify if KEAP1 methylation status at specific CpGs should be included or not in the molecular prognostic algorithm to optimize patient management and improve outcomes in terms of response to therapy and survival.
To help address this question, we performed an integrated multi-omics data evaluation of KEAP1 annotated CpGs using the available The Cancer Genome Atlas (TCGA) data from NSCLC datasets. More specifically, we investigated whether KEAP1 CpG methylation sites correlated with KEAP1 gene expression and KEAP1 protein levels in LUAD and lung squamous carcinoma (LUSC) histologies at different stages of the disease.

2. Materials and Methods

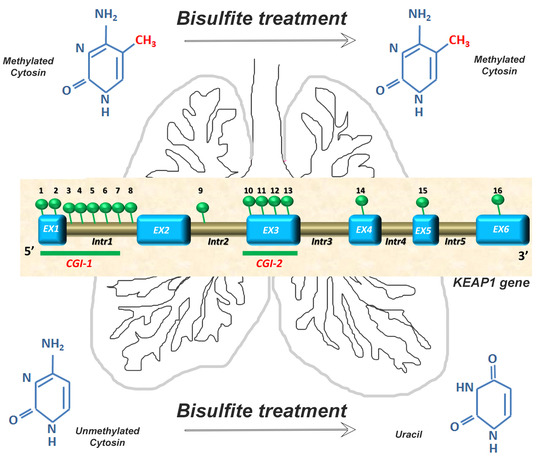
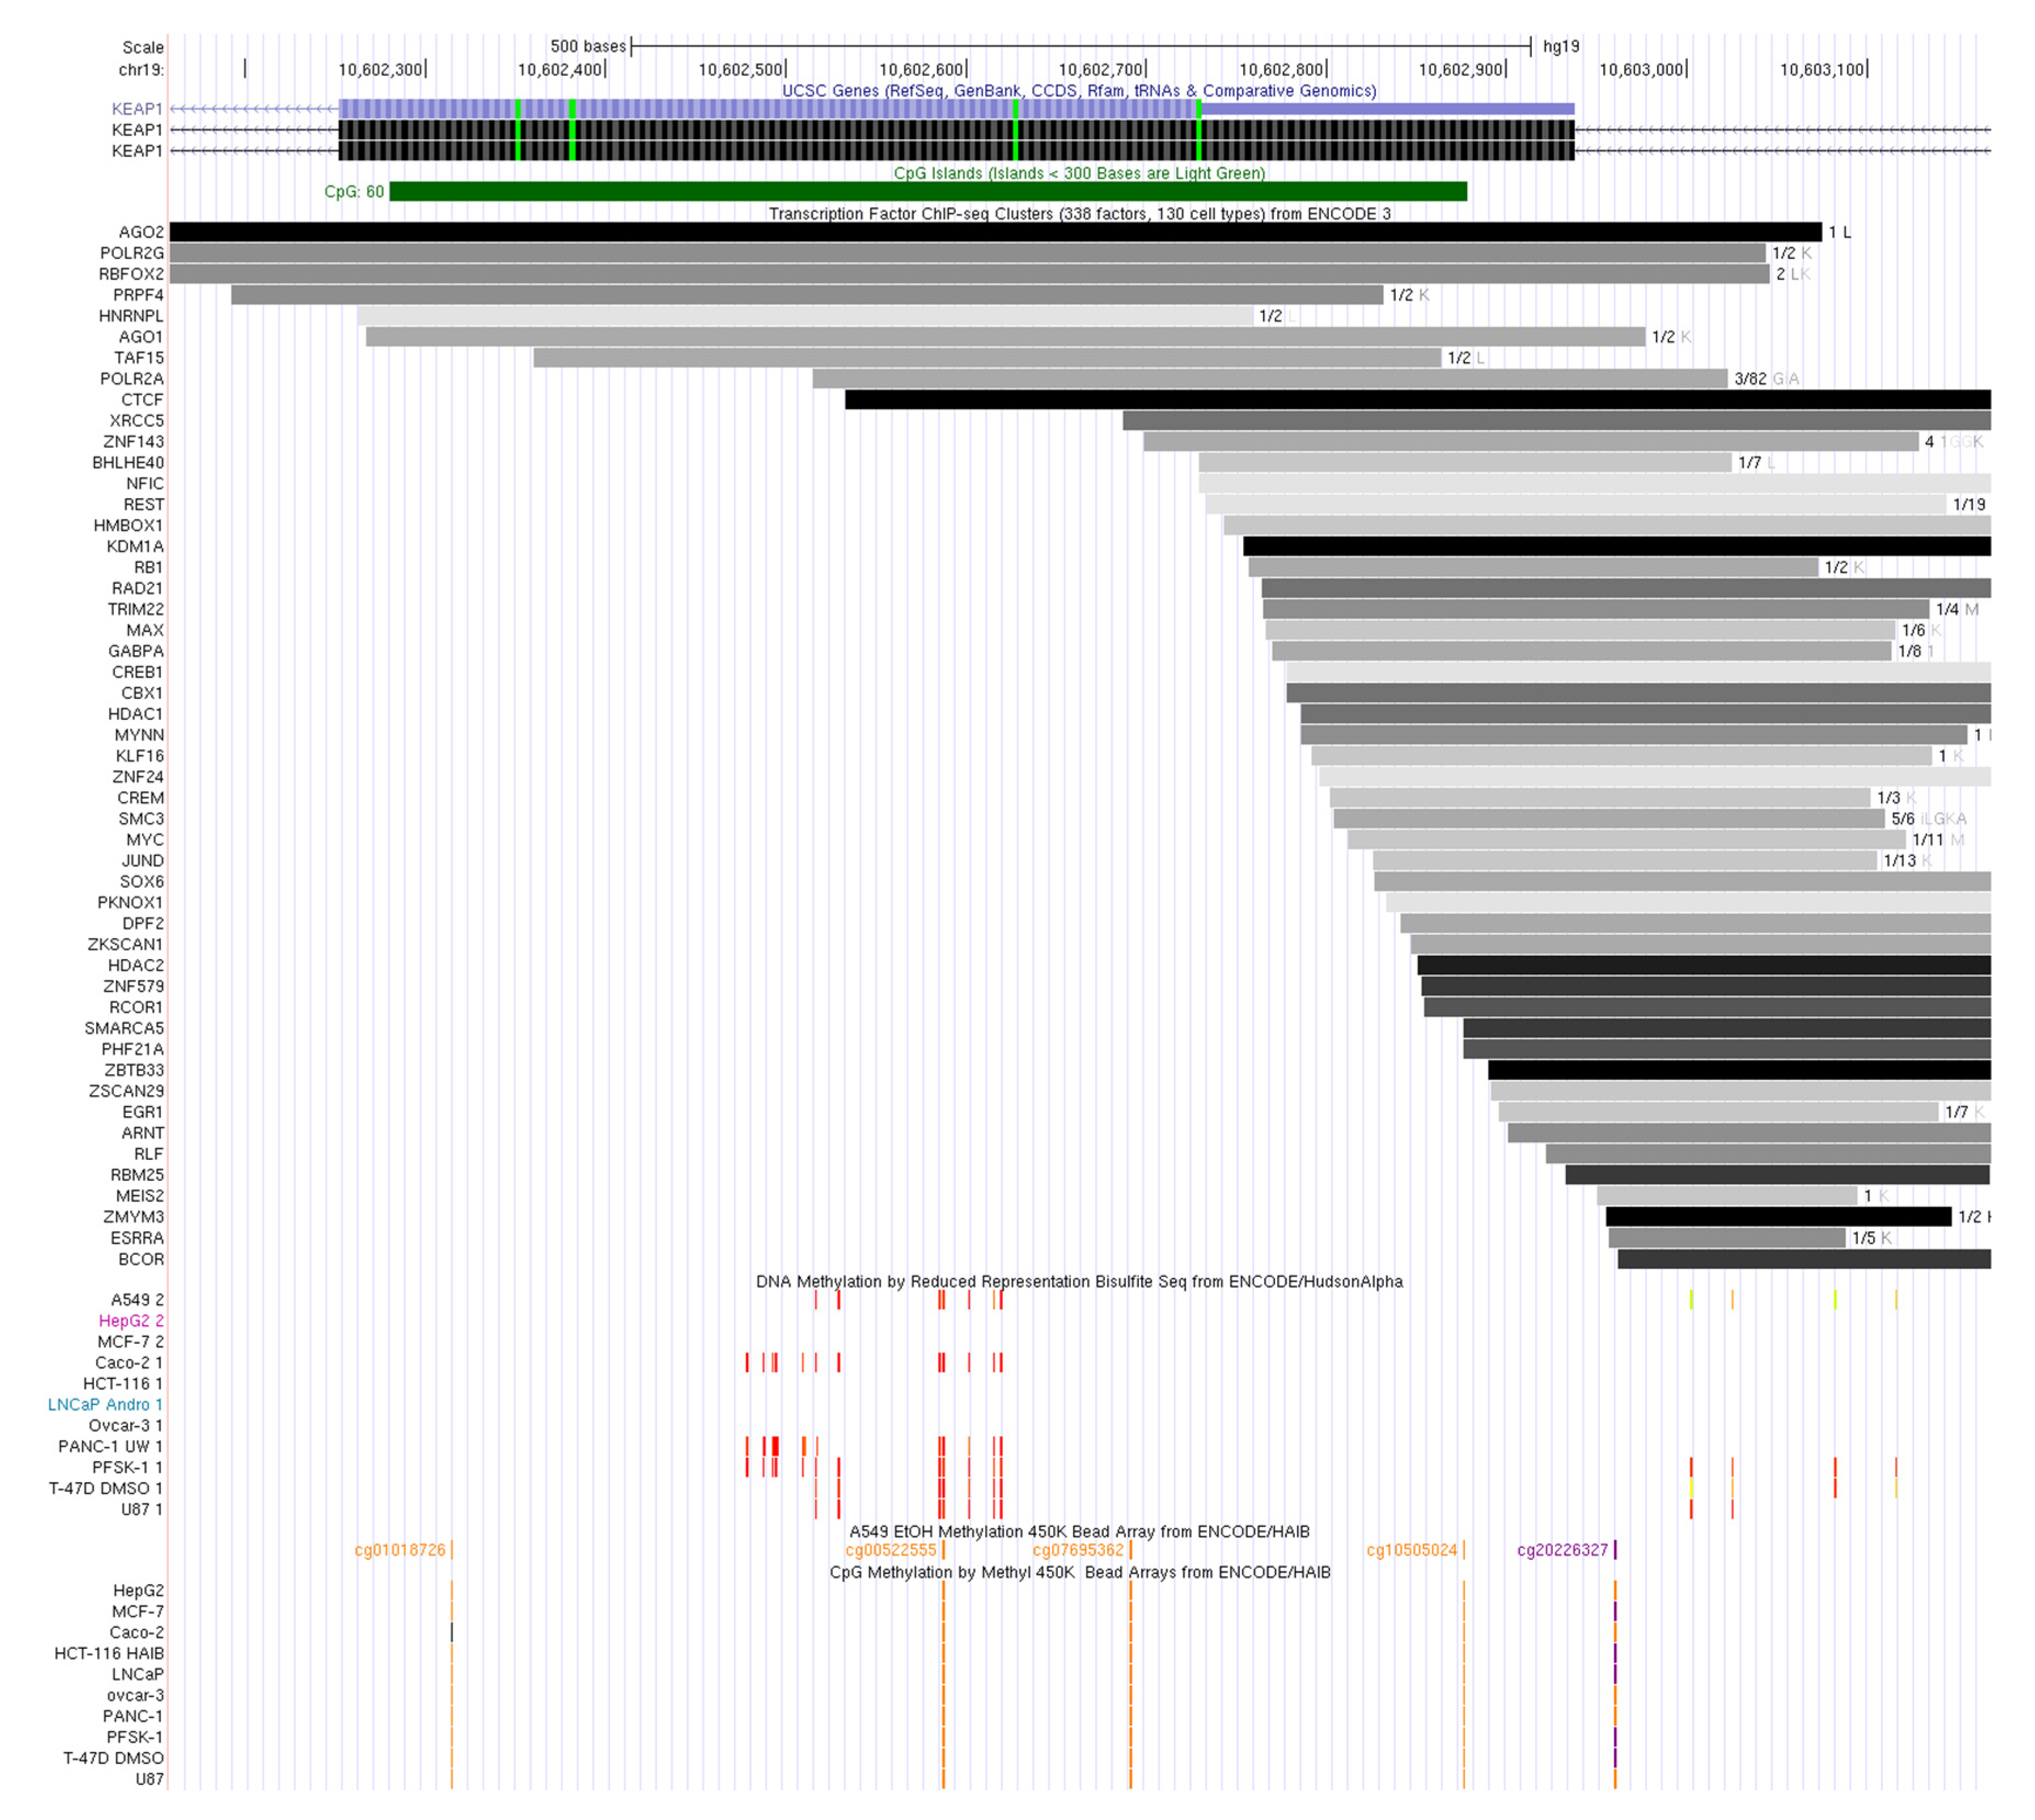
2.1. KEAP1 Promoter and Intragenic CpGs

We investigated a total of 16 CpGs of the KEAP1 gene located inside or outside the well-known gene promoter region. All methylation data of CpGs are from Illumina 450K TGCA datasets, and their genomic positions are reported in Table 1. The respective fully converted DNA sequence of each KEAP1 CpG island or single CpG site is available in Supplementary Materials (Supplemental Table S1).
Many investigated CpGs are located in two main KEAP1 CpG mapped islands. The first one (CpG island 1, CGI-1) comprises a long CpG-rich island of ~1.2 kb (chr19:10613047-10614280) that spans from the gene promoter region to intron 1, within the human hg19/GRCh37 genome sequence. The CGI-1 island includes a total of 148 CpGs, distributed in the P1 Region (-291-89) near the KEAP1 TSS, and the P2 Region (-88+337), [25]. Four out of the 16 investigated CpGs fall in a shorter CpG island (CGI-2) that starts from chr19:10602253 and ends at 10602938, according to the University of California, Santa Cruz (UCSC) CpG island track (hg19/GRCh37), and includes a total of 60 CpGs (Figure 1).

2.2. TCGA Data Analysis

The TCGA KEAP1 methylation and expression data of LUSC and LUAD datasets were directly pulled down from UCSC Xena public data hubs (https://xenabrowser.net). Clinical data were complemented and completed with information available from the GDC (Genomic Data Commons) Data Portal (https://portal.gdc.cancer.gov). These data include 617 LUAD patients (all stages) and 571 LUSC (all stages) patients. We also extrapolated the two subsets of LUAD (n = 128) and LUSC (n = 141) patients with non-metastatic disease from the whole cohorts (Table 2 and Table 3). Data related to EGFR, KRAS, and smoking status were also obtained, and patients were divided into the following cohorts: LUAD smokers (all stages, n = 508; early stages, n = 124), LUAD non-smokers (all stages, n = 14; early stages, n = 2); LUAD EGFR mutated (all stages, n = 63; early stages, n = 5), LUAD EGFR wild-type (all stages, n = 459; early stages, n = 98); LUAD KRAS mutated (all stages, n = 447; early stages, n = 101), LUAD KRAS wild-type (all stages, n = 75; early stages, n = 25). A total of 60 LUAD patients of all stages (95% EGFR mutated and 80% KRAS wild-type) shared the EGFR mutated/KRAS wild-type molecular subsets. Ninety-five LUAD subjects were not annotated with any information about KRAS/EGFR mutations and smoking habits. Finally, there were 15 LUSC KRAS mutated patients (all stages) and 246 LUSC KRAS wild-type patients (all stages). A set of 30 normal lung tissues was also included in our study to assess differences in CpG methylation levels.
Specifically, the DNA methylation data were generated by Infinium Human Methylation 450K BeadChip microarrays and are stored in the Pan-Cancer Atlas Hub; gene expression data were obtained by RNA-Seq experiments and are available from the UCSC Toil RNAseq Recompute Compendium. Methylation data were available as beta-values, while expression data were available as TPM (Transcripts Per kilobase Million)-normalized reads counts. RPPA (Reverse phase protein array)-based protein expression data were retrieved from LinkedOmics (http://www.linkedomics.org).

2.3. Statistical Analysis

Clinical and histological characteristics of patients were reported as mean ± standard deviation (SD) or absolute frequencies and percentages for continuous and categorical variables, respectively.
Correlation between KEAP1 mRNA expression and all individual beta-values of KEAP1 in the TCGA datasets was assessed using Pearson’s correlation coefficient. Similarly, an overall assessment of correlation was calculated by aggregating the beta-values of all CpGs (average). Differential methylation was assessed using the Wilcoxon rank-sum test with continuity correction.
Results were deemed statistically significant when p was <0.05.

3. Results

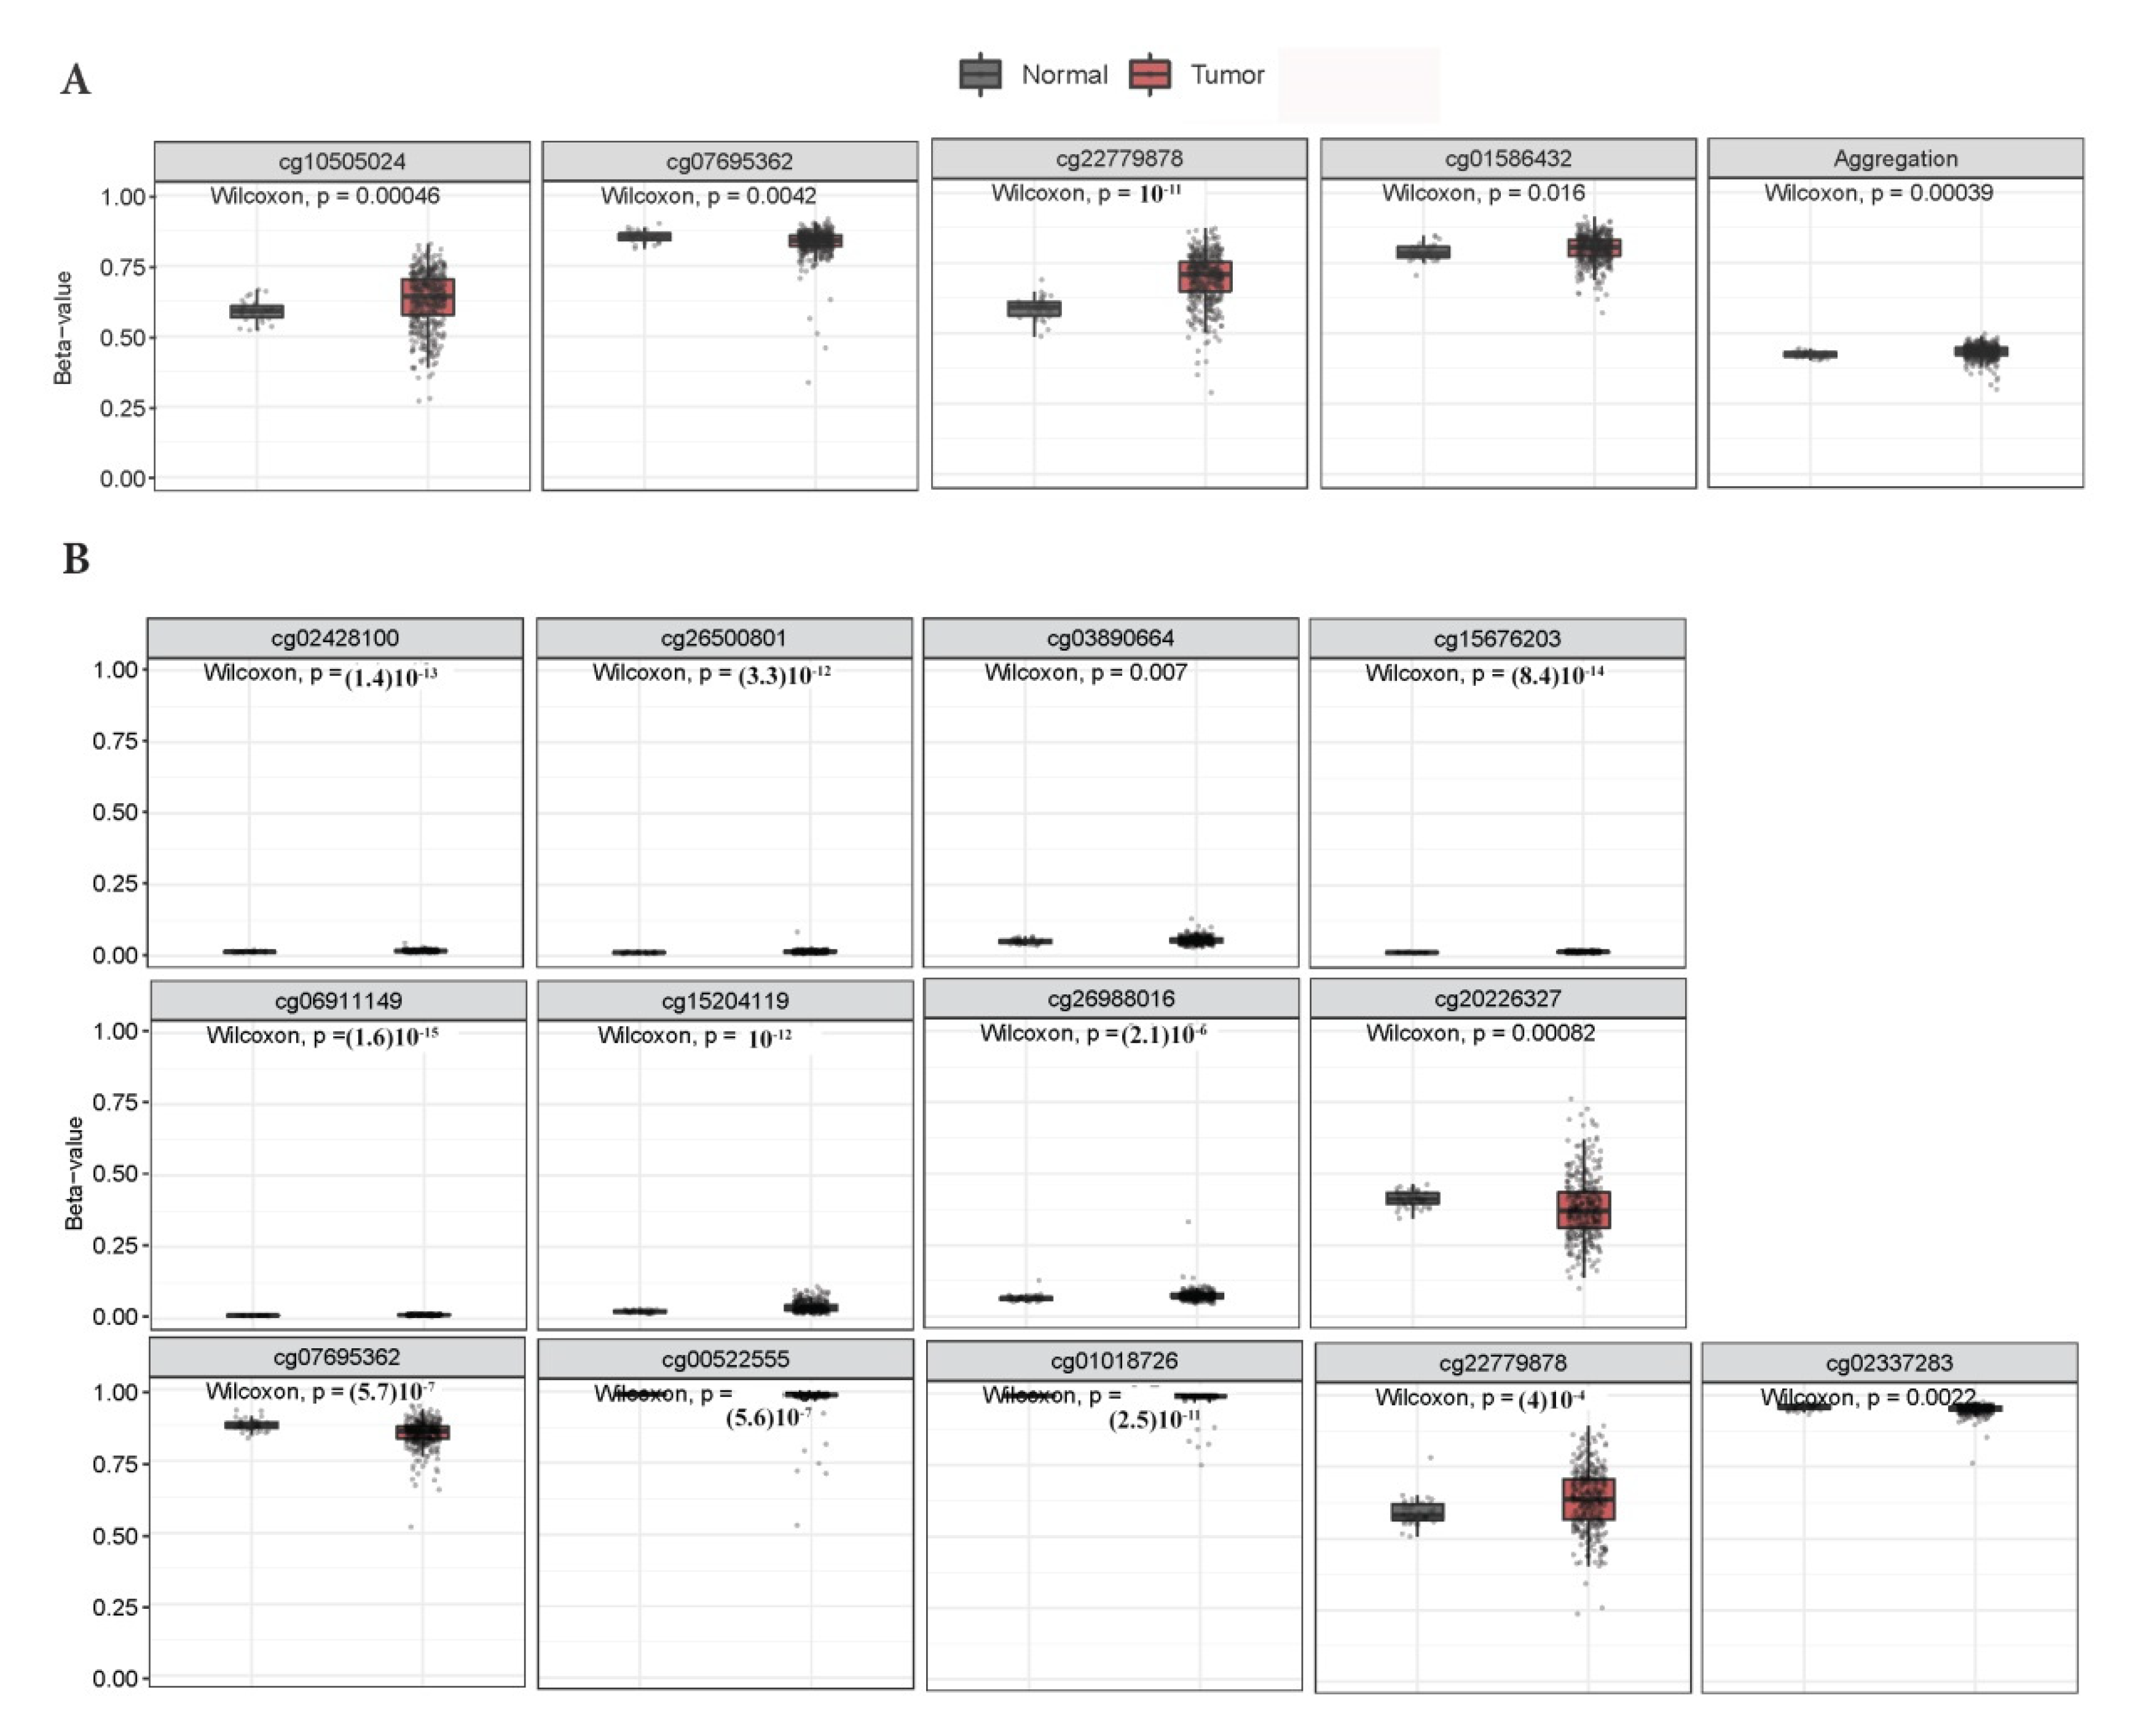
3.1. KEAP1 Is Hypermethylated in Tumor Compared to Non-Neoplastic Tissues

For the analysis of KEAP1 CpGs methylation within the TCGA cohort, Illumina Infinium Human Methylation 450 BeadChip beads (cg25801292, cg02428100, cg06911149, cg26500801, cg03890664, cg15676203, cg15204119, cg26988016, cg20226327, cg10505024, cg07695362, cg00522555, cg01018726, cg22779878, cg02337283, cg01586432) were used.
Both in non-neoplastic and in tumor tissues of LUAD and LUSC, CpG-sites targeted by beads located peripherally in the CpG-dense area of KEAP1 (which includes the GCI-1 island) showed lower methylation levels, than the beads located in the central position of KEAP1 gene, including the CGI-2 island; the only exception was cg25801292 (Figure 2).
Interestingly, KEAP1 hypermethylation was found in tumors compared to non-neoplastic tissues of the LUAD all-stages cohort in 4/16 CpGs vs. 13/16 CpGs in the LUSC all-stages cohort (Figure 3). Statistically significant differences between tumor and non-neoplastic lung tissues were observed also at CpGs having low methylation levels and located at the CGI-1 island.

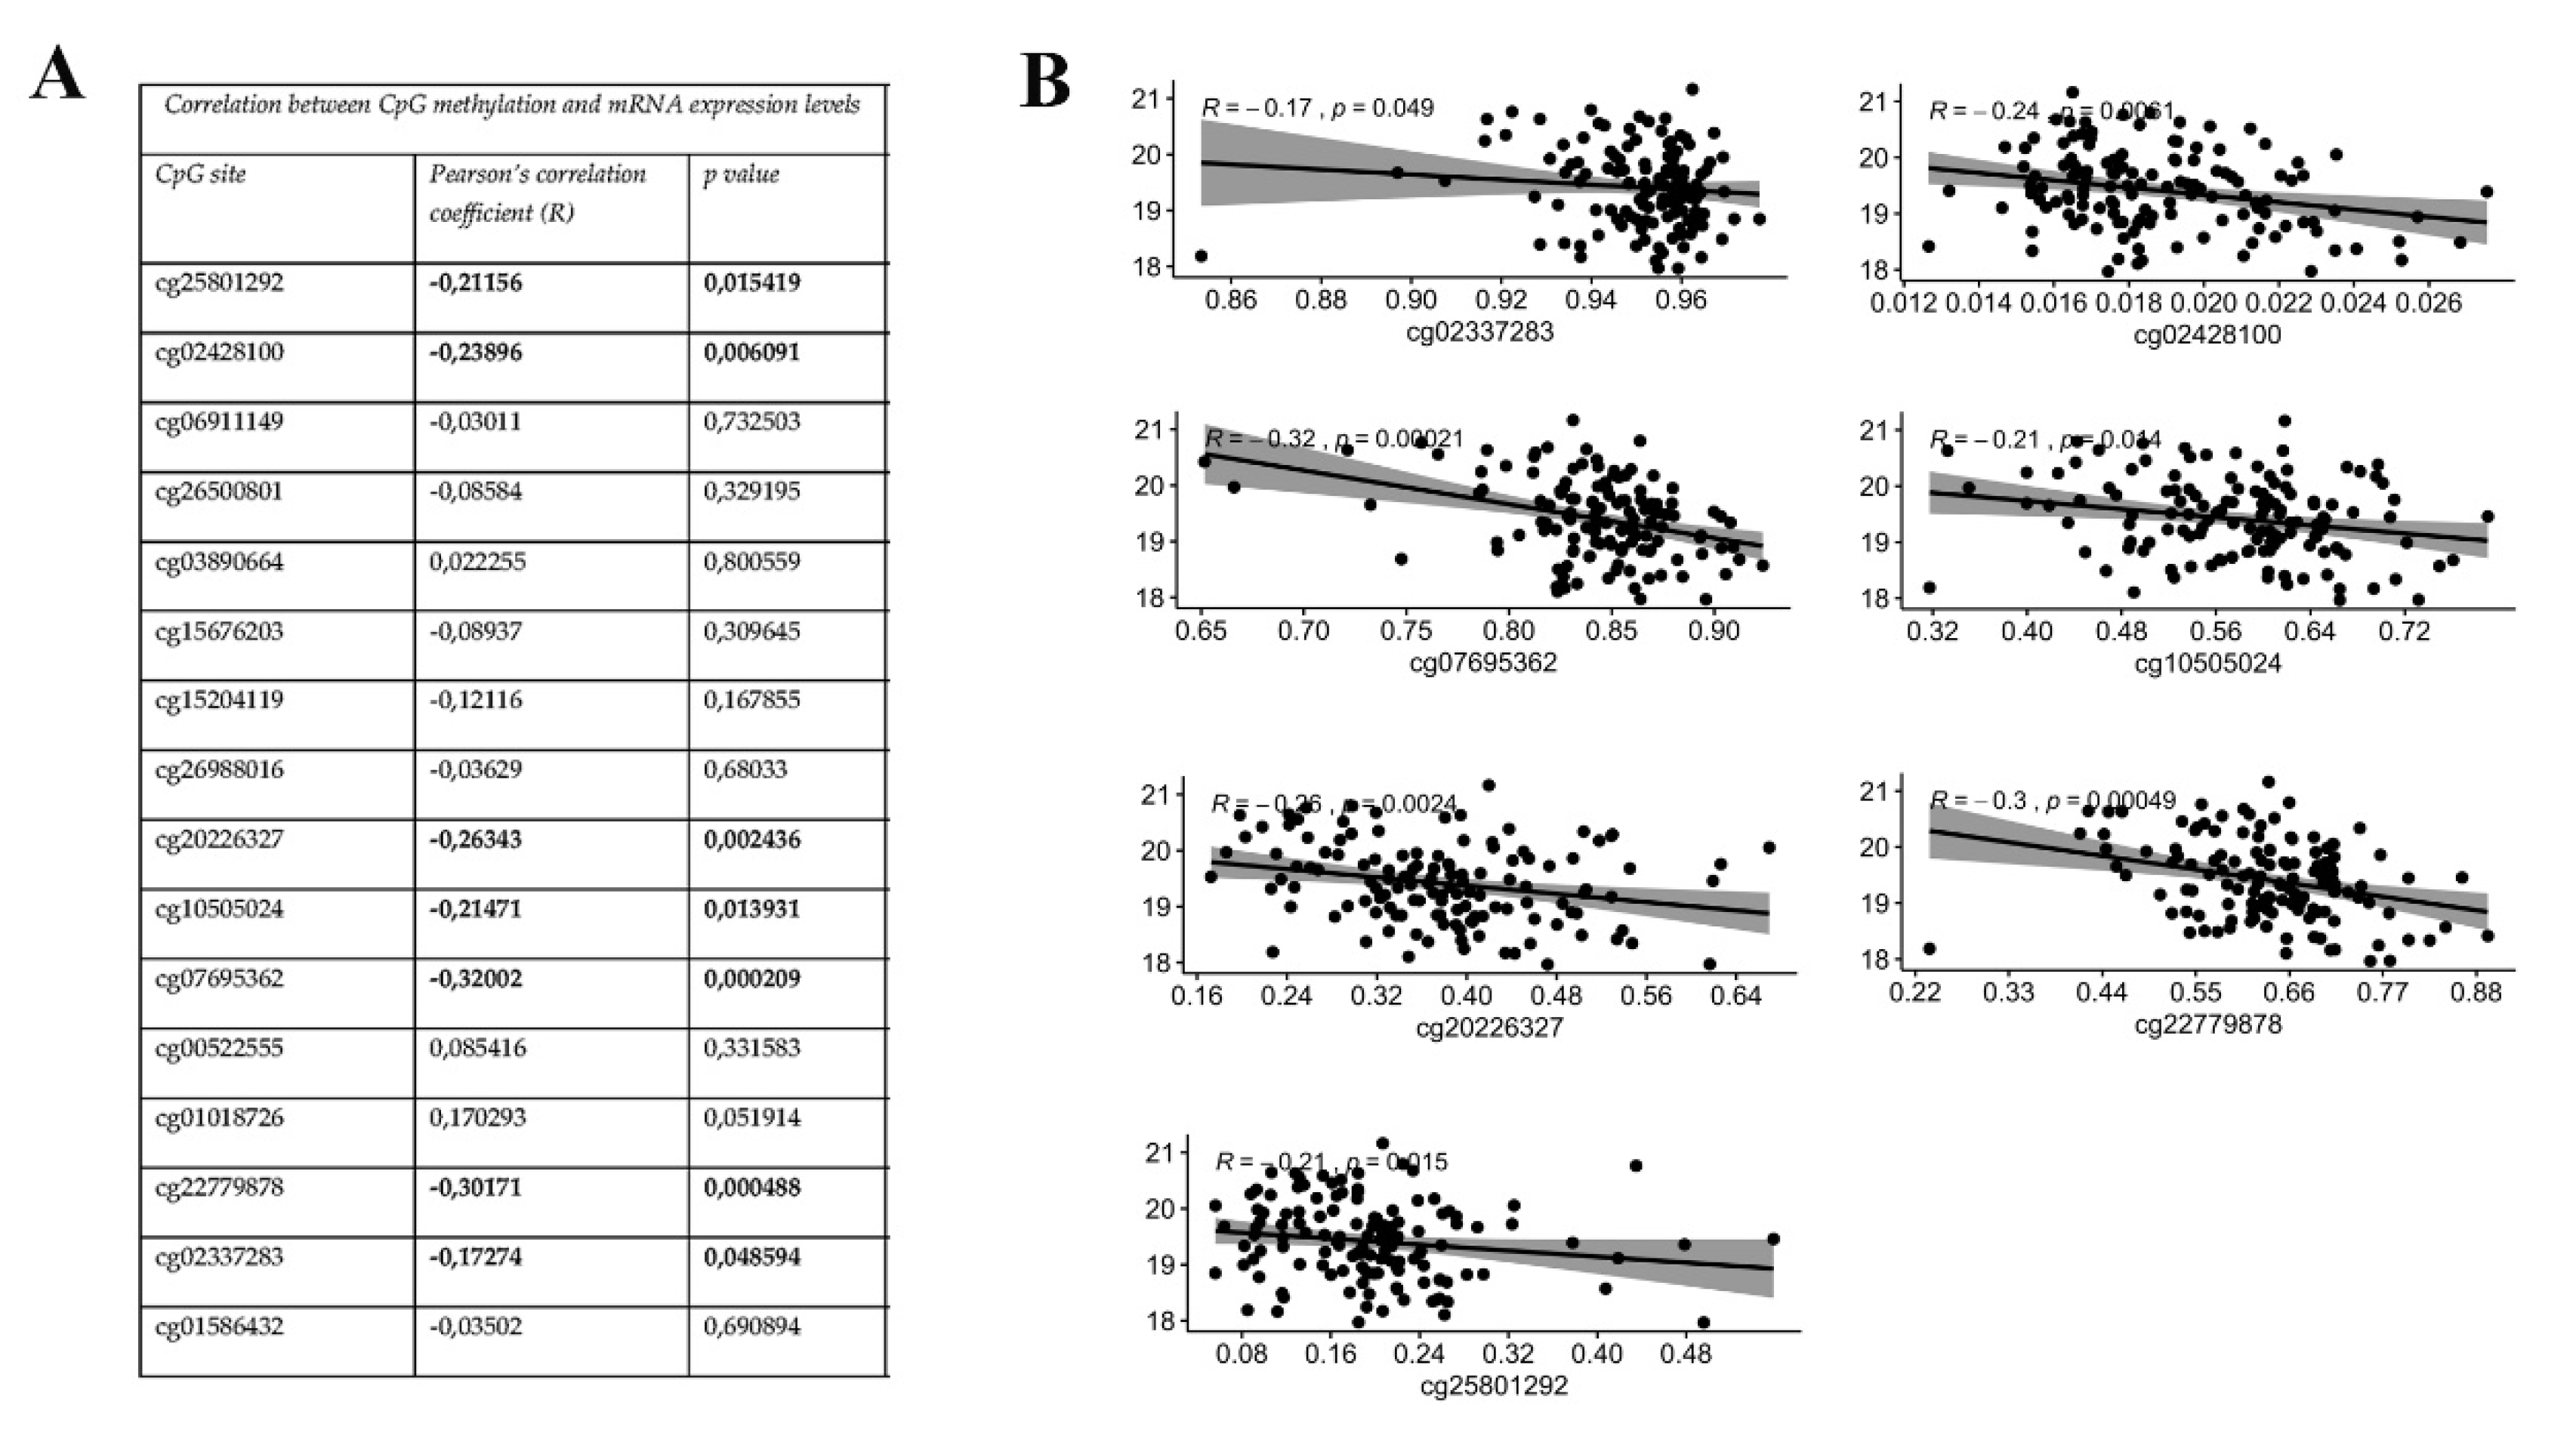
3.2. KEAP1 CpGs Methylation Inversely Correlates with mRNA Expression of KEAP1

Considering all-stages of LUAD patients, we found that only two predicted KEAP1 CpG sites, are located in the CGI-1 and CGI-2 islands (cg15204119, R = −0,18, p = 8 × 10−0.5; cg10505024, R = −0,12, p = 0.0097), were significantly and inversely correlated with KEAP1 mRNA levels (Figure 4A,B). More surprisingly, we observed a clear and inverse association between six KEAP1 CpG sites (cg25801292, R = −0.18, p = 0.001; cg20226327, R = −0.18, p = 0.0005; cg10505024, R =−0.21, p =3.9 × 10−0.5; cg07695362, R = −0.3, p = 6 × 10−0.9; cg22779878, R = −0.33 p = 1.40 × 10⁻¹⁰; cg02337283, R = −0.17, p = 0.001) and mRNA levels in the LUSC group (all stages) (Figure 4C,D). As for the LUAD cohort, three out of these CpGs are located in the CGI-1 (cg25801292) and CGI-2 (cg10505024 and cg07695362) regions.
We also explored whether these same CpGs correlated with mRNA levels in LUAD and LUSC, but strictly related to non-metastastic disease. Almost half of the KEAP1 CpG sites related to the LUSC cohort exhibited a significant correlation with KEAP1 expression (cg25801292 and cg02428100, exon 1-CGI-1; cg20226327, intron 2; cg10505024 and cg07695362, exon 3-CGI-2; cg22779878, exon 4; cg02337283, exon 5; Figure 5A,B),whereas KEAP1 methylated CpG sites did not show any significant correlation in the LUAD non-metastatic cohort. Results were slightly different when the LUAD smoker all-stages cohort was examined, where a significant inverse correlation between KEAP1 methylation and its expression emerged for the cg22779878 (exon 4), cg07695362 (exon 3-CGI-2), and cg15676203, (intron 1-CGI-1), (Supplemental Table S2). As a result of the small number of cases, no conclusive results were obtained for the LUAD non-smoker cohort.
By contrast, a new, very intriguing scenario appeared when we considered the EGFR wild-type/mutated LUAD all-stages cohort. The effect of the KEAP1 methylation on its transcript level was observed only in the EGFR mutated cohort, strictly related to the cg22779878 (exon 4), a block of 3 CpGs of the CGI-2 intragenic island (cg07695362, cg10505024, and cg20226327) an only one CpG of the CGI-1 promoter island (cg15676203). Conversely, in the subpopulation of KRAS wild-type all-stages LUAD, correlation was observed at the cg22779878 (exon 4), in only one CpG located in the CGI-2 intragenic island (cg07695362), but in three CpGs located in the CGI-1 promoter island (cg06911149, cg15676203, and cg03890664). The same pattern of clusterization of epigenetic events with KRAS wild-type status was confirmed when we examined the KRAS wild-type/mutated all-stages LUSC cohort (Supplemental Table S2). In this cohort, a large number of CpGs located in the CGI-1 (cg25801292, cg02428100, cg15204119, cg15676203) and CGI-2 islands (cg2022637, cg10505024, cg07695362, cg01018726) showed a negative correlation between KEAP1 methylation and transcript expression, but only in the group of KRAS wild-type tumors (Supplemental Table S2).
We then investigated the possibility that patterns of methylation may interfere with the transcription of KEAP1 through modulation of the accessibility of transcription factor binding sites (TFBSs). Data of cell lines, derived from those tumors where methylation of KEAP1 was described, were included into the computational analysis (Supplemental Table S3). Table 4 summarizes all the regulatory elements that co-localize with the CpG islands. CGI-1 was found to overlap with binding sites of E2F6 and CTCF (ENCODE Data release 3), and with functional elements of POL2RA, PHF8, MAX, and CTCF (ENCODE V2). Concerning the KEAP1 exon 3 and the CGI-2, we observed the presence of CTCF sites at the position chr19: 1062751-10603103 (ENCODE V3 cell lines) and chr19:10602731-10603130 (ENCODE V2). Moreover, several cell line-specific TFBSs were located within this region (Figure 6), reinforcing the hypothesis that CGI-2 may influence the regulation of an alternative KEAP1 transcript.
Finally, we investigated if KEAP1 methylation at different CpG sites could be correlated with KEAP1 protein levels by using RPPA-based protein expression data were retrieved from LinkedOmics (http://www.linkedomics.org). No inverse correlation between CpGs methylation and KEAP1 protein levels was found in either the LUAD or the LUSC cohort (all-stage and non-metastatic disease stages, Supplemental Table S4).
Taken together, a novel interesting pattern of KEAP1 CpG clusterization emerged by comparing the inverse correlation results between methylation and transcription levels in LUAD and LUSC at different stages (Figure 7).

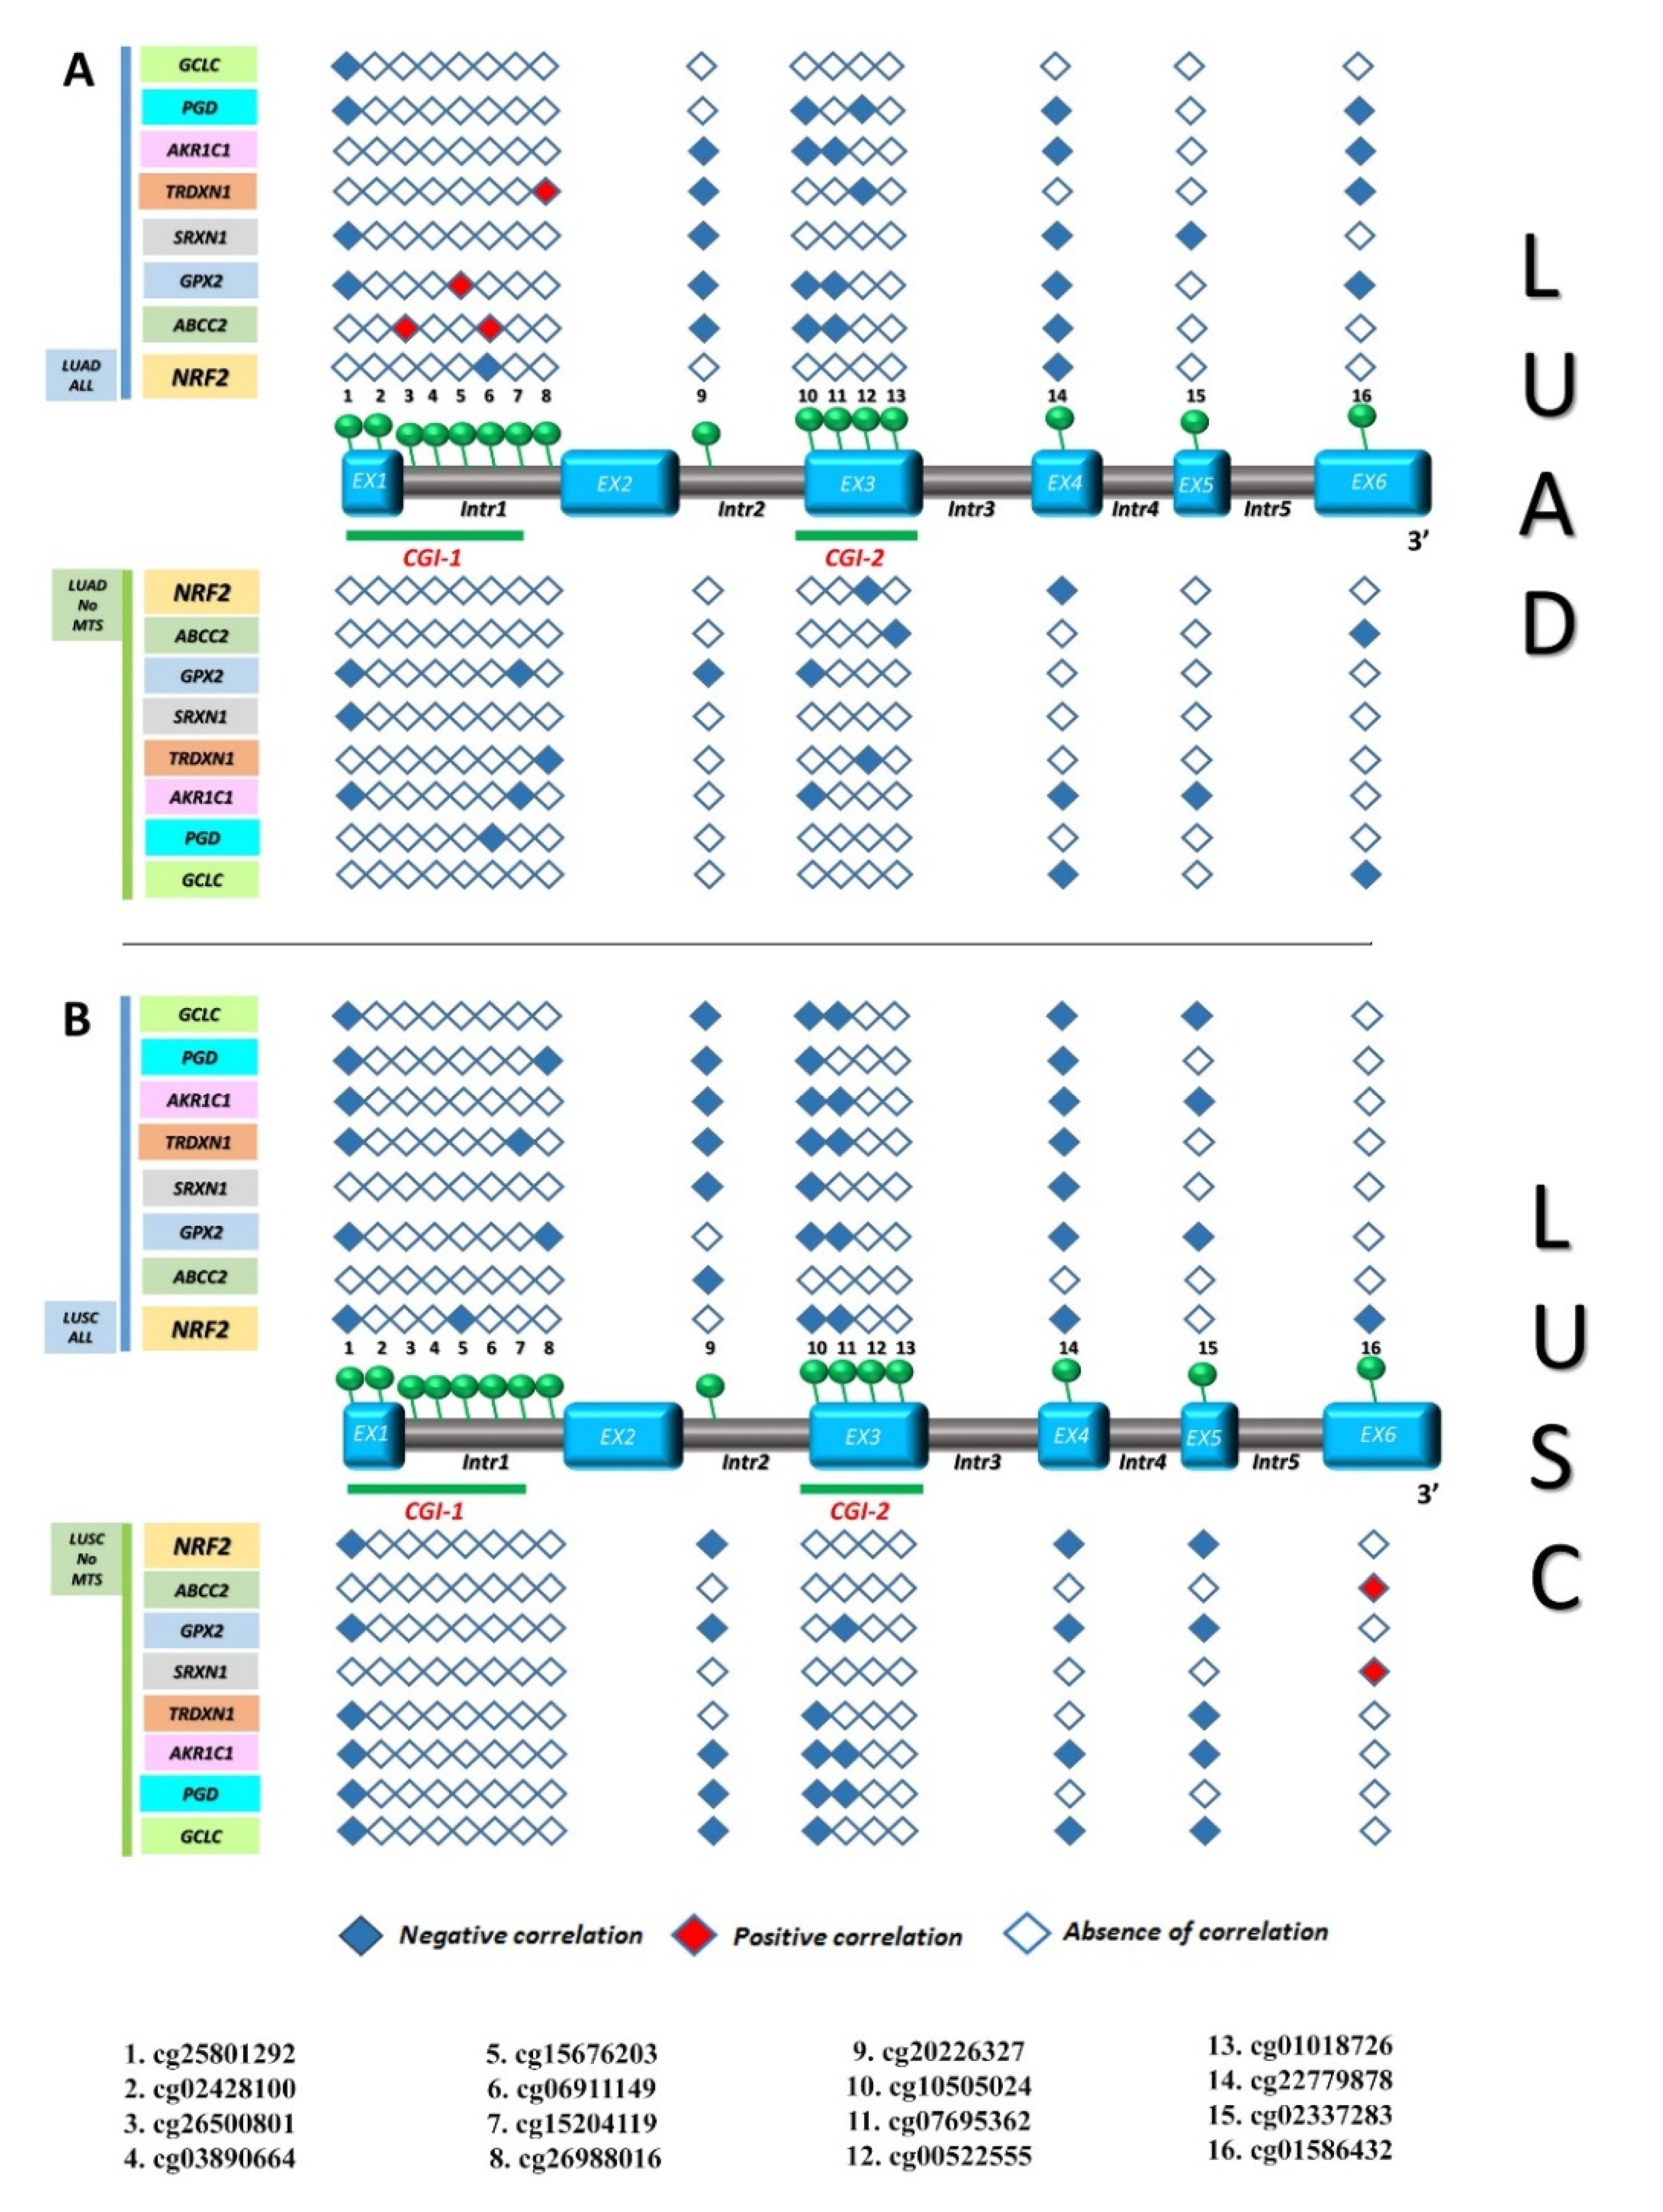
3.3. Identification of Gene Expression Signature Associated with KEAP1 Methylation in NSCLC

In order to investigate the effect of KEAP1 methylation on NRF2 modulation, we correlated each KEAP1 CpGs methylation level with the expression level of NRF2 and some of its target genes that are involved in oxidative stress, oxidation-reduction processes, and the cellular response to oxidative stress: GPX2Glutathione Peroxidase 2, GCLCGlutamate-Cysteine Ligase Catalytic Subunit, TXNRD1Thioredoxin Reductase 1, AKR1C1aldo-ketoreductase family 1, PGDPhosphogluconate Dehydrogenase, SRXN1Sulfiredoxin 1, and ABCC2—ATP Binding Cassette Subfamily C Member 2 [26,27]. An inverse, strong correlation between KEAP1 methylation and mRNA expression levels of NRF2 and its targets was observed in both the LUAD and LUSC cohorts. In the LUAD cohort, a common pattern of correlation emerged between the methylation of cg227799878 (exon 4) and the expression of NRF2 and its targets. Many other CpGs, mainly located in the gene body regions, also showed a significant correlation with the expression levels of many NRF2 targets, such as GPX2 and AKR1C1 (Supplemental Table S5). In the LUSC cohort, a similar pattern of correlation was observed, but it was much more extended regarding the number of KEAP1 CpGs that correlated with the expression of NRF2 and its target genes (Figure 8).
Looking at the molecularly stratified NSCLC subpopulations, a strong positive correlation between KEAP1 hypermethylation, mRNA expression levels of NRF2, and many ARE-driven target genes was observed in the LUAD KRAS wild-type subpopulation, both for many CpGs located in the CGI-1 island and in those located in the gene body. Among these, hypermethylation of cg15204119 (CGI-I island), cg07695362 (CGI-2 island), and cg22779878 (exon 4) correlated with both KEAP1 mRNA downregulation and NRF2/ARE-driven target genes upregulation. This pattern of correlation was not found in the LUSC KRAS wild-type subpopulations, but an inverse correlation between KEAP1 hypermethylation and mRNA expression levels of NRF2 and its ARE-driven target genes was observed for many CpGs (Figure 9 and Supplemental Table S6). Among these, hypermethylation of cg15204119, cg02428100, cg15676203, cg15204119 (all located in the CGI-I island), cg20226327 (intron 2), cg10505024 and cg07695362 (all located in the CGI-2 island), cg22779878 (exon 4), and cg02337283 (exon 5) correlated with both KEAP1 mRNA downregulation and NRF2/ARE-driven target genes downregulation.

4. Discussion

As a result of their frequency and plasticity, epigenetic alterations are now emerging as innovative cancer biomarkers. Among these, DNA methylation is the most recognized one in lung tumors across neoplastic stages, since it has been observed that methylation patterns have undergone massive distortion in cancer cells, and it occurs early at different stages of the lung tumorigenesis process [28,29]. Similar to many genes that have CpG islands subjected to aberrant methylation, the KEAP1 gene offers an interesting model to investigate epigenetic mechanisms in cancer cells, since the KEAP1/NRF2 pathway is directly linked to oxidative-stress and promotes chemo- and radio-resistance in different tumor types [6,30]. The presence of genetic and epigenetic abnormalities in this pathway, such as point mutations in functional domains of KEAP1 and NFE2L2 and methylation at the KEAP1 promoter region, was firstly described in NSCLC and then widely reported in many solid tumors, with the hypothesis that the lack of KEAP1 transcription induced high NRF2 activity and aberrant overexpression of ARE-driven target genes [6,10,16,18]. Actually, increasing attention to the KEAP1 gene in lung cancer is mainly due to point mutations that show great translational impact in terms of increased risk of cancer progression, shorter overall survival and response of NSCLC patients’ to chemo and biological treatments [3,4,5,31]. This notion is also supported by a clear co-occurrence with STK11 and KRAS gene alterations with a suggested synergic role of these genes in enhancement of tumorigenesis and lung cancer progression. Unlike KEAP1 genetic lesions, the potential clinical utility of information related to KEAP1 methylation has not been yet emerged. Methylation at the main CpG island located at the promoter gene region was widely investigated in the last decades, but without finding a real clinical implication in the context of lung cancer; this may be due to different reasons. Firstly, the published methylation analysis of KEAP1 at promoter CpG island (named CGI-1 in the present work) has been frequently performed by semi-quantitative methods, such as real-time quantitative PCR. Even if rapid and sensitive, this method does not offer a detailed overview of each CpG function in the context of gene expression regulation. In support of this idea, our group recently observed that an evaluation of each CpG methylation status at the promoter region of KEAP1 by pyrosequencing provides more information with a possible translational utility than the conventional semi-quantitative approach used until now [25]. Secondly, only some CpGs located at the promoter region and not all CpGs of KEAP1 that could exert a strong regulatory effect on its transcription and protein levels have been yet investigated [26]. As for the intragenic CpGs island of many cancer-related genes, the function of CpGs located in the gene body of KEAP1 has been poorly investigated. Near all current knowledge on transcriptional regulation by DNA methylation focuses on its role at the promoter of actively transcribed genes, since hypermethylation of the promoter clearly results in gene repression. Recently, accumulating scientific evidence has shown that changes in methylation patterns across a gene may exert a significant role in modulating the transcription of cancer-related genes [32]. In light of these observations, in this study we investigated all 16 KEAP1 CpGs covered by 450K Illumina array, which are located in different regions of the gene. The data analyzed came from a large TCGA NSCLC cohort, and LUAD samples were analyzed separately from LUSC samples.
Our results confirmed that methylation events in NSCLC involve not only the CpGs at 5′ region of KEAP1 gene, and showed, at first instance, that this event is apparently linked only to LUSC histology, with marginal effects in LUAD samples. These findings were corroborated by the fact that, regardless of non-metastatic and metastatic stages, no strong correlation appeared between KEAP1 CpGs methylation and mRNA levels in LUAD, while this occurred instead in LUSC (both in all-stages and in non-metastatic stages). A novel and unexpected finding is that, when we stratified the LUAD population on the basis of the EGFR and KRAS status, the effects of KEAP1 methylation on KEAP1 transcription strongly re-emerged, strictly linked to an EGFR mutated and KRAS wild-type context. The link between the epigenetic silencing of KEAP1 and KRAS wild-type status was also confirmed in LUSC, being present in the KRAS wild-type subpopulation and absent in KRAS mutated patients.
Our results support the documented link between KEAP1, EGFR, and KRAS mutations and open the debate on the role of KEAP1 methylation in the context of anti-EGFR treatments. For NSCLC patients whose tumors harbor mutations in EGFR, disruption of the KEAP1/NRF2 pathway is of the most recently reported mechanisms by which EGFR-tyrosine kinase inhibitors (EGFR-TKI) resistance occurs [5]. Coexisting mutations in the KEAP1/NFE2L2/CUL3 genes were in fact reported to be associated with significantly decreased time to TKI treatment failure [4]. Taking into account our findings of a clear connection between KEAP1 methylation and an EGFR mutated condition, we speculate that KEAP1 methylation might represent an additional mechanism of TKI resistance in the context of oxidative stress modulation.
Apart from the mutual exclusivity of EGFR and KRAS mutations, the link between KEAP1 methylation and a KRAS wild-type status deserves a specific consideration on the basis of two major scientific findings. First, oncogenic KRAS mutations were associated with chemoresistance and poor prognosis in NSCLC, also by controlling the NFE2L2 gene transcription through a direct link of KRAS to a TPA response element (TRE) located in the NFE2L2 promoter [33]. Second, KRAS-mutant tumors with coexisting TP53 or KEAP1 mutations were associated with a more aggressive tumor phenotype, and loss of KEAP1 in tumors exhibits unique characteristics dictated by their cellular origin and metabolic program [34]. The finding that KEAP1 transcript levels are modulated by methylation only in KRAS wild-type NSCLC might indicate that methylation is a KRAS-independent mechanism to modulate NRF2 levels in tumor cells. Alternatively, given that in our study no clear inverse correlation was observed between KEAP1 methylation and NFE2L2 transcription, the epigenetic silencing of KEAP1 could represent an alternative or synergic way for NRF2 modulation of chemoresistance in NSCLC mediated by the KRAS gene status.
Methylation at different portions of the gene body appeared to have an active role in this context. Notably, even if the methylation pattern is different in tumor and non-neoplastic tissues, the methylation levels of the CpGs located in the 5′ portion of the gene are lower than those affecting the intragenic CpGs, thus suggesting that DNA methylation at these sites could have only a limited role in regulating tissue-specific transcription initiating from the canonical 5′ promoter region. In contrast, the high levels of methylation observed in all lung tumors at the intragenic CGI-2 and additional CpGs located in the gene body might reflect a functional role. In fact, we hypothesized that a non-canonical epigenetic regulation may exist for KEAP1 at the exonic level, and specifically at exon 3, where a short CpG island (CGI-2 in our work) was predicted that starts from chr19:10602253 and ends at 10602938, according to the UCSC CpG Island track (human genome build: hg19). When hypermethylation occurs at this site, it might block the transcription machinery recruitment, thus producing two different transcripts. Specifically, the hypothetical model concerns the activation of KEAP1 methylation at exon 3 that might impede the recruitment of CTCF, a multifunctional protein in genome regulation and gene expression, with consequent fast slipping of RNA Polymerase II [35]. At the protein level, an aberrant transcript without exon 3 should produce a shorter KEAP1 protein (624 amino acids in its canonical form), lacking amino acids 214-536. This would lead to partial loss of IVR and KELCH domains, both responsible for NRF2 interaction (fundamental arginine residues would be deleted, including Arg-380, Arg-415, and Arg-483). At the cellular level, intragenic KEAP1 hypermethylation would increase the dosage of aberrant KEAP1 proteins at the expense of its canonical form, thereby contributing to enhance the levels of un-sequestered NRF2. To test this hypothesis, experimental assays are warranted to verify CpG methylation levels for the KEAP1 genomic region, the presence of an exon 3-skipped transcript variant, and the dosage balance between normal and aberrant KEAP1 protein [36,37]. Surprisingly, we also observed that one KEAP1 CpG (cg02337283), predicted in exon 5, was significantly recurrent in all bioinformatics analysis on non-metastatic LUAD and LUSC correlations; we thus wonder if DNA methylation might facilitate KEAP1 exon inclusion in other settings by recruiting methyl-binding domain (MBD) proteins [38,39]. In contrast to the transcript level, no correlation was observed between methylation and protein levels. One explanation for this is that the proteome was probed using protein array Reverse Phase Protein Assay (RPPA) technology and that the antibodies-based analyses are inherently limited because of reduced coverage and inability to easily compare across proteins due to differential binding effects [40].
Strong correlations were observed between many CpGs located both in the KEAP1 promoter and in the KEAP1 gene body CGI and the mRNA transcript levels of NRF2 and some of its target genes, both in LUAD and in LUSC; this evidence confirms the strong link between epigenetic KEAP1 silencing and NRF2 activity modulation. Looking at different EGFR/KRAS subpopulations, a high level of methylation seems to be differently correlated in LUSC and LUAD with NRF2 mRNA levels and the transcription activity ARE-genes. Globally, a complex link emerges between KEAP1 methylation and NRF2 deregulation that needs to be confirmed on large independent NSCLC cohorts.

5. Conclusions

Epigenetic deregulation has been increasingly recognized as one of the major mechanisms of the KEAP1 gene deregulation in lung cancer. Our findings broaden the current knowledge on this topic and open the debate from multiple points of view. KEAP1 methylation was described in lung many years ago and was mainly investigated at promoter region using a semi-quantitative approach, rather than a more detailed approach that might give more information with possible translational utility. This could represent one of the reasons why no strong clinical correlations have emerged in lung tumors, but this hypothesis warrants testing by high-throughput studies in large NSCLC cohorts. The intersection between the KEAP1 methylation event and the EGFR mutant/KRAS wild-type status suggests a possible translational impact in terms of shorter overall survival and clinical benefit to chemotherapeutic and targeted biological treatments of patients with NSCLC. Therefore, it may be of interest to scan for this epigenetic event in specific oncogenic-addicted NSCLC patients, taking into consideration that the potential inclusion of KEAP1 methylation in a molecular predictive/prognostic algorithm would first need a clinically validated cut-off setting specific for lung cancer.
KEAP1 promoter methylation appears to have an unusual impact on NRF2 and its target genes’ expression, but no prior evidence about this has been published. Therefore, a conclusive demonstration of a potential non-canonical role of KEAP1 in modulating the NRF2 pathway warrants further investigation. Overall, it is hoped that functional validation of our results in cellular models and in independent lung cancer cohorts will contribute to rapidly translate these molecular results into the clinical context.

Supplementary Materials

The following are available online at https://0-www-mdpi-com.brum.beds.ac.uk/2076-3921/9/9/904/s1, Table S1: List of methylation-converted sequences for each predicted KEAP1 CpG site; Table S2: Results from correlation analysis between KEAP1 methylation levels and its expression related to the KRAS/EGFR and smoking status. Table S3: Details on cancer cell lines used for in silico prediction analysis at exon3 CpG island (CGI-2). Table S4: Significant KEAP1 CpG site in non-metastatic cohort. Table S5: Results from correlation analysis between KEAP1 methylation levels and expression of NRF2 and ARE-targets. Table S6: Results from correlation analysis between KEAP1 methylation levels and expression of NRF2 and ARE-targets in LUAD and LUSC EGFR/KRAS subpopulations.

Author Contributions

Conceptualization, L.A.M. and F.P.F.; methodology, F.P.F., T.M., L.A.M.; formal analysis, T.M.; investigation, L.A.M., F.P.F.; data curation, T.M., S.C., A.S.; writing—original draft preparation, F.P.F., L.A.M.; writing—review and editing, A.S., T.M., S.C.; supervision, L.A.M.; funding acquisition, L.A.M. All authors have read and agreed to the published version of the manuscript.

Funding

This research was funded by the Italian Ministry of Health, Ricerca Corrente 2020, by the “5x1000” voluntary contributions to Fondazione IRCCS Casa Sollievo della Sofferenza, and by the AIRC/MGAF grant 12983 (to L.A.M.).

Conflicts of Interest

The authors declare no conflict of interest.

References

  1. Blandin Knight, S.; Crosbie, P.A.; Balata, H.; Chudziak, J.; Hussell, T. Dive C Progress and prospects of early detection in lung cancer. Open Biol. 2017, 7, 170070. [Google Scholar] [CrossRef] [PubMed] [Green Version]
  2. Sandler, J.E.; D’Aiello, A.; Halmos, B. Changes in store for early-stage non-small cell lung cancer. J. Thorac. Dis. 2019, 11, 2117–2125. [Google Scholar] [CrossRef] [PubMed]
  3. Arbour, K.C.; Jordan, E.; Kim, H.R.; Dienstag, J.; Yu, H.A.; Sanchez-Vega, F.; Lito, P.; Berger, M.; Solit, D.B.; Hellmann, M.; et al. Effects of Co-occurring Genomic Alterations on Outcomes in Patients with KRAS-Mutant Non-Small Cell Lung Cancer. Clin. Cancer Res. 2018, 24, 334–340. [Google Scholar] [CrossRef] [PubMed] [Green Version]
  4. Hellyer, J.A.; Stehr, H.; Das, M.; Padda, S.K.; Ramchandran, K.; Neal, J.W.; Diehn, M.; Wakelee, H.A. Impact of KEAP1/NFE2L2/CUL3 mutations on duration of response to EGFR tyrosine kinase inhibitors in EGFR mutated non-small cell lung cancer. Lung Cancer 2019, 134, 42–45. [Google Scholar] [CrossRef]
  5. Park, S.H.; Kim, J.H.; Ko, E.; Kim, J.Y.; Park, M.J.; Kim, M.J.; Seo, H.; Li, S.; Lee, J.Y. Resistance to gefitinib and cross-resistance to irreversible EGFR-TKIs mediated by disruption of the Keap1-Nrf2 pathway in human lung cancer cells. FASEB J. 2018, 32, 5862–5873. [Google Scholar] [CrossRef]
  6. Fabrizio, F.P.; Sparaneo, A.; Trombetta, D.; Muscarella, L.A. Epigenetic versus Genetic Deregulation of the KEAP1/NRF2 Axis in Solid Tumors: Focus on Methylation and Noncoding RNAs. Oxid. Med. Cell Longev. 2018, 2492063. [Google Scholar] [CrossRef]
  7. Leinonen, H.M.; Kansanen, E.; Pölönen, P.; Heinäniemi, M.; Levonen, A.L. Role of the Keap1-Nrf2 pathway in cancer. Adv. Cancer Res. 2014, 122, 281–320. [Google Scholar]
  8. Taguchi, K.; Yamamoto, M. The KEAP1-NRF2 System in Cancer. Front. Oncol. 2017, 7, 85. [Google Scholar] [CrossRef] [PubMed]
  9. Menegon, S.; Columbano, A.; Giordano, S. The Dual Roles of NRF2 in Cancer. Trends Mol. Med. 2016, 22, 578–593. [Google Scholar] [CrossRef]
  10. Singh, A.; Misra, V.; Thimmulappa, R.K.; Lee, H.; Ames, S.; Hoque, M.O.; Herman, J.G.; Baylin, S.B.; Sidransky, D.; Gabrielson, E.; et al. Dysfunctional KEAP1-NRF2 interaction in non-small-cell lung cancer. PLoS Med. 2006, 3, e420. [Google Scholar] [CrossRef] [PubMed] [Green Version]
  11. Cancer Genome Atlas Research Network. Comprehensive genomic characterization of squamous cell lung cancers. Nature 2012, 489, 519–525. [Google Scholar] [CrossRef] [PubMed]
  12. Frank, R.; Scheffler, M.; Merkelbach-Bruse, S.; Ihle, M.A.; Kron, A.; Rauer, M.; Ueckeroth, F.; König, K.; Michels, S.; Fischer, R.; et al. Clinical and Pathological Characteristics of KEAP1- and NFE2L2-Mutated Non-Small Cell Lung Carcinoma (NSCLC). Clin. Cancer Res. 2018, 24, 3087–3096. [Google Scholar] [CrossRef] [PubMed] [Green Version]
  13. Nadal, E.; Palmero, R.; Munoz-Pinedo, C. Mutations in the Antioxidant KEAP1/NRF2 Pathway Define an Aggressive Subset of NSCLC Resistant to Conventional Treatments. J. Thorac. Oncol. 2019, 14, 1881–1883. [Google Scholar] [CrossRef] [PubMed]
  14. Wang, R.; An, J.; Ji, F.; Jiao, H.; Sun, H.; Zhou, D. Hypermethylation of the Keap1 gene in human lung cancer cell lines and lung cancer tissues. Biochem. Biophys. Res. Commun. 2008, 373, 151–154. [Google Scholar] [CrossRef]
  15. Guo, D.; Wu, B.; Yan, J.; Li, X.; Sun, H.; Zhou, D. A possible gene silencing mechanism: Hypermethylation of the Keap1 promoter abrogates binding of the transcription factor Sp1 in lung cancer cells. Biochem. Biophys. Res. Commun. 2012, 428, 80–85. [Google Scholar] [CrossRef]
  16. Muscarella, L.A.; Parrella, P.; D’Alessandro, V.; la Torre, A.; Barbano, R.; Fontana, A.; Tancredi, A.; Guarnieri, V.; Balsamo, T.; Coco, M.; et al. Frequent epigenetics inactivation of KEAP1 gene in non-small cell lung cancer. Epigenetics 2011, 6, 710–719. [Google Scholar] [CrossRef] [Green Version]
  17. Sparaneo, A.; Fabrizio, F.P.; la Torre, A.; Graziano, P.; Di Maio, M.; Fontana, A.; Bisceglia, M.; Rossi, A.; Pizzolitto, S.; De Maglio, G.; et al. Effects of KEAP1 Silencing on the Regulation of NRF2 Activity in Neuroendocrine Lung Tumors. Int. J. Mol. Sci. 2019, 20, 2531. [Google Scholar] [CrossRef] [Green Version]
  18. Fabrizio, F.P.; Costantini, M.; Copetti, M.; la Torre, A.; Sparaneo, A.; Fontana, A.; Poeta, L.; Gallucci, M.; Sentinelli, S.; Graziano, P.; et al. Keap1/Nrf2 pathway in kidney cancer: Frequent methylation of KEAP1 gene promoter in clear renal cell carcinoma. Oncotarget 2017, 8, 11187–11198. [Google Scholar] [CrossRef] [Green Version]
  19. Barbano, R.; Muscarella, L.A.; Pasculli, B.; Valori, V.M.; Fontana, A.; Coco, M.; la Torre, A.; Balsamo, T.; Poeta, M.L.; Marangi, G.F.; et al. Aberrant Keap1 methylation in breast cancer and association with clinicopathological features. Epigenetics 2013, 8, 105–112. [Google Scholar] [CrossRef] [Green Version]
  20. Gao, L.; Yuan, F.; Che, G.; Xiao, X.; Nie, X.; Wang, Y.; Jia, J.; Kong, A.N.; Zhang, L. Epigenetic modifications but not genetic polymorphisms regulate KEAP1 expression in colorectal cancer. J. Cell. Biochem. 2019, 120, 12311–12320. [Google Scholar] [CrossRef]
  21. Hanada, N.; Takahata, T.; Zhou, Q.; Ye, X.; Sun, R.; Itoh, J.; Ishiguro, A.; Kijima, H.; Mimura, J.; Itoh, K.; et al. Methylation of the KEAP1 gene promoter region in human colorectal cancer. Methylation of the KEAP1 gene promoter region in human colorectal cancer. BMC Cancer 2012, 12, 66. [Google Scholar] [CrossRef] [PubMed] [Green Version]
  22. Abu-Alainin, W.; Gana, T.; Liloglou, T.; Olayanju, A.; Barrera, L.N.; Ferguson, R.; Campbell, F.; Andrews, T.; Goldring, C.; Kitteringham, N.; et al. UHRF1 regulation of the Keap1-Nrf2 pathway in pancreatic cancer contributes to oncogenesis. J. Pathol. 2016, 238, 423–433. [Google Scholar] [CrossRef] [PubMed] [Green Version]
  23. Muscarella, L.A.; Barbano, R.; D’Angelo, V.; Copetti, M.; Coco, M.; Balsamo, T.; la Torre, A.; Notarangelo, A.; Troiano, M.; Parisi, S.; et al. Regulation of KEAP1 expression by promoter methylation in malignant gliomas and association with patient’s outcome. Epigenetics 2011, 6, 317–325. [Google Scholar] [CrossRef] [Green Version]
  24. Liu, X.; Sun, C.; Liu, B.; Jin, X.; Li, P.; Zheng, X.; Zhao, T.; Li, F.; Li, Q. Genistein mediates the selective radiosensitizing effect in NSCLC A549 cells via inhibiting methylation of the keap1 gene promoter region. Oncotarget 2016, 7, 27267–27279. [Google Scholar] [CrossRef] [Green Version]
  25. Fabrizio, F.P.; Sparaneo, A.; Centra, F.; Trombetta, D.; Storlazzi, C.T.; Graziano, P.; Maiello, E.; Fazio, V.M.; Muscarella, L.A. Methylation Density Pattern of KEAP1 Gene in Lung Cancer Cell Lines Detected by Quantitative Methylation Specific PCR and Pyrosequencing. Int. J. Mol. Sci. 2019, 20, 2697. [Google Scholar] [CrossRef] [Green Version]
  26. Elshaer, M.; ElManawy, A.I.; Hammad, A.; Namani, A.; Wang, X.J.; Tang, X. Integrated data analysis reveals significant associations of KEAP1 mutations with DNA methylation alterations in lung adenocarcinomas. Aging 2020, 12, 7183–7206. [Google Scholar] [CrossRef] [PubMed]
  27. Tonelli, C.; Chio, I.I.C.; Tuveson, D.A. Transcriptional Regulation by Nrf2. Antioxid. Redox Signal. 2018, 29, 1727–1745. [Google Scholar] [CrossRef] [Green Version]
  28. Duruisseaux, M.; Esteller, M. Lung cancer epigenetics: From knowledge to applications. Semin. Cancer Biol. 2018, 51, 116–128. [Google Scholar] [CrossRef]
  29. Selamat, S.A.; Galler, J.S.; Joshi, A.D.; Fyfe, M.N.; Campan, M.; Siegmund, K.D.; Kerr, K.M.; Laird-Offringa, I.A. DNA methylation changes in atypical adenomatous hyperplasia, adenocarcinoma in situ, and lung adenocarcinoma. PLoS ONE 2011, 6, e21443. [Google Scholar] [CrossRef] [Green Version]
  30. Kitamura, H.; Motohashi, H. NRF2 addiction in cancer cells. Cancer Sci. 2018, 109, 900–911. [Google Scholar] [CrossRef] [Green Version]
  31. Jeong, Y.; Hellyer, J.A.; Stehr, H.; Hoang, N.T.; Niu, X.; Das, M.; Padda, S.K.; Ramchandran, K.; Neal, J.W.; Wakelee, H.; et al. Role of KEAP1/NFE2L2 Mutations in the Chemotherapeutic Response of Patients with Non-Small Cell Lung Cancer. Clin. Cancer Res. 2019, 26, 274–281. [Google Scholar] [CrossRef] [PubMed] [Green Version]
  32. Brenet, F.; Moh, M.; Funk, P.; Feierstein, E.; Viale, A.J.; Socci, N.D.; Scandura, J.M. DNA methylation of the first exon is tightly linked to transcriptional silencing. PLoS ONE 2011, 6, e14524. [Google Scholar] [CrossRef] [PubMed]
  33. Tao, S.; Wang, S.; Moghaddam, S.J.; Ooi, A.; Chapman, E.; Wong, P.K.; Zhang, D.D. Oncogenic KRAS confers chemoresistance by upregulating NRF2. Cancer Res. 2014, 74, 7430–7441. [Google Scholar] [CrossRef] [Green Version]
  34. Skoulidis, F.; Byers, L.A.; Diao, L.; Papadimitrakopoulou, V.A.; Tong, P.; Izzo, J.; Behrens, C.; Kadara, H.; Parra, E.R.; Canales, J.R.; et al. Co-occurring genomic alterations define major subsets of KRAS-mutant lung adenocarcinoma with distinct biology, immune profiles, and therapeutic vulnerabilities. Cancer Discov. 2015, 5, 860–877. [Google Scholar] [CrossRef] [PubMed] [Green Version]
  35. Kulis, M.; Queirós, A.C.; Beekman, R.; Martín-Subero, J.I. Intragenic DNA methylation in transcriptional regulation, normal differentiation and cancer. Biochim. Biophys. Acta 2013, 1829, 1161–1174. [Google Scholar] [CrossRef] [PubMed]
  36. Berman, B.P.; Weisenberger, D.J.; Aman, J.F.; Hinoue, T.; Ramjan, Z.; Liu, Y.; Noushmehr, H.; Lange, C.P.; van Dijk, C.M.; Tollenaar, R.A.; et al. Regions of focal DNA hypermethylation and long-range hypomethylation in colorectal cancer coincide with nuclear lamina-associated domains. Nat. Genet. 2011, 44, 40–46. [Google Scholar] [CrossRef] [Green Version]
  37. Selamat, S.A.; Chung, B.S.; Girard, L.; Zhang, W.; Zhang, Y.; Campan, M.; Siegmund, K.D.; Koss, M.N.; Hagen, J.A.; Lam, W.L.; et al. Genome-scale analysis of DNA methylation in lung adenocarcinoma and integration with mRNA expression. Genome Res. 2012, 22, 1197–1211. [Google Scholar] [CrossRef] [Green Version]
  38. Shukla, S.; Kavak, E.; Gregory, M.; Imashimizu, M.; Shutinoski, B.; Kashlev, M.; Oberdoerffer, P.; Sandberg, R.; Oberdoerffer, S. CTCF-promoted RNA polymerase II pausing links DNA methylation to splicing. Nature 2011, 479, 74–79. [Google Scholar] [CrossRef]
  39. Maunakea, A.K.; Chepelev, I.; Cui, K.; Zhao, K. Intragenic DNA methylation modulates alternative splicing by recruiting MeCP2 to promote exon recognition. Cell Res. 2013, 23, 1256–1269. [Google Scholar] [CrossRef] [Green Version]
  40. Kosti, I.; Jain, N.; Aran, D.; Butte, A.J.; Sirota, M. Cross-tissue Analysis of Gene and Protein Expression in Normal and Cancer Tissues. Sci. Rep. 2016, 6, 24799. [Google Scholar] [CrossRef] [Green Version]
Figure 1. Schematic representation of the KEAP1 gene structure within the human hg19 genome sequence. The first reference transcript (NM_203500) is located at chr19:10596796-10614054 (strand -, 17259 bp long), while the second one (NM_012289) is located at chr19:10596796-10613481 (16686 bp long). They encode for a 624 aa protein (NCBIID: NP_987096, Uniprot ID: Q14145). Annotation and methylation data retrieved by the University of California, Santa Cruz (UCSC) Genome Browser. From top to bottom: NCBI RefSeq and Consensus CDS tracks for KEAP1 exon/intron structure; predicted CpG islands (“Regulation” >> “CpG Island” track); detected methylation sites (“Regulation” >> “ENCODE DNA Methylation tracks” >> “DNA Methylation by Reduced Representation Bisulfite Seq from ENCODE/Hudson Alpha” and “CpG Methylation by Methyl 450K Bead Arrays from ENCODE/HAIB”. Methylation status of genomic sites is represented through a color gradient vertical bars. Red-orange bars indicate strong methylation signals (i.e., a high relative number of methylated molecules vs. unmethylated molecules in bisulfite sequencing experiments); orange and blue bars indicate strong methylated vs. unmethylated status in 450K array experiments.
Antioxidants 09 00904 g001
Figure 2. KEAP1 per-CpG violin plots of beta-values of the all-stages (A: LUAD, D: LUSC), non-metastatic disease (B: LUAD, E: LUSC) and control cohorts (C: LUAD, F: LUSC). Violins report the median beta-values and interquartile ranges.
Antioxidants 09 00904 g002
Figure 3. Box plots of differentially methylated KEAP1 CpGs between all-stages cohort (A: LUAD, B: LUSC) and control.
Antioxidants 09 00904 g003
Figure 4. Correlation analysis between KEAP1 methylation (450 K BeadChip array, beta-values) and its expression levels (RNA-Seq, TPM-normalized read counts) values from TCGA-LUAD all-stages (A) and LUSC all-stages (C) datasets. Scatter plots between β-values (x-axis) and expression values of KEAP1 in LUSC (B) and LUAD (D). TCGA cohort includes the most significant CpG sites and aggregated data of all CpGs. Pearson’s correlation coefficient (R) and significance level (p) are reported for each plot.
Antioxidants 09 00904 g004
Figure 5. (A) Results from correlation analysis between KEAP1 methylation (450 K BeadChip array, Beta-values) and its expression levels (RNA-Seq, TPM-normalized read counts). (B) Scatter plots between β-values (x-axis) and expression values of KEAP1 in the TCGA LUSC non-metastatic disease dataset include the most significantly correlated CpG sites. Pearson’s correlation coefficient (R) and significance level (p) are also reported for each plot.
Antioxidants 09 00904 g005
Figure 6. Schematic representation of KEAP1 exon 3 (hg19 genome sequence). From top to bottom: NCBI RefSeq and Consensus CDS UCSC tracks for KEAP1 exon/intron structure; TFBSs from the ENCODE Project; predicted CpG islands; detected methylation sites. The gray scale intensity of TF binding sites is proportional to the signal strength in the different tested cell lines (darker color indicates stronger signal). Red-orange bars indicate strong methylation signals; orange and blue bars indicate strong methylated vs. unmethylated status in 450K bead array experiments.
Antioxidants 09 00904 g006
Figure 7. Correlation between KEAP1 CpGs methylation and KEAP1 transcript levels in LUSC and LUAD cohorts. The KEAP1 gene structure is shown in the middle, including exons (sky blue boxes) and introns (brown boxes), as well as its two CpG islands: CGI-1 and CGI-2 (both underlined with green bars). A total of 16 CpG sites, marked with green circles, are indicated from 5′ to 3′ genomic localization (listed below). A filled rhombus, corresponding to a KEAP1 CpG site, depicts a significant inverse correlation (R ≤ −0.1; p < 0.05) between methylation and transcription levels in LUSC (on the top, orange both for all, non-metastatic stages, and KRAS wild-type) and particularly in LUAD (on the bottom, blue both for all, non-metastatic stages, KRAS wild-type, and EGFR mutated), in contrast to an empty rhombus indicating no significant correlation. Abbreviations: EX, exon; Intr, intron; CGI-1, CpG Island 1; CGI-2, CpG Island 2; LUSC, lung squamous cell carcinoma; LUAD, lung adenocarcinoma; No-mts, non-metastatic disease stages.
Antioxidants 09 00904 g007
Figure 8. Correlation between KEAP1 CpGs methylation and transcript levels of NRF2 or its target genes in LUAD and LUSC cohorts. The KEAP1 gene structure is shown in the middle, including exons (sky blue boxes) and introns (brown boxes), as well as its two CpG islands: CGI-1 and CGI-2 (both underlined with green bars). A total of 16 CpG sites, marked with green circles, are indicated from 5′ to 3′ genomic localization (listed below). A filled rhombus, corresponding to a KEAP1 CpG site, depicts a significant inverse (blue square) or direct (red square) correlation (R ≤ −0.1; p < 0.05) between methylation and transcript levels of NRF2 or its target genes in LUAD (A) and particularly in LUSC (B), in contrast to an empty rhombus indicating no significant correlation. Abbreviations: EX, exon; Intr, intron; CGI-1, CpG Island 1; CGI-2, CpG Island 2; LUSC, lung squamous cell carcinoma; LUAD, lung adenocarcinoma; No-mts, non-metastatic disease stages.
Antioxidants 09 00904 g008
Figure 9. Correlation between KEAP1 CpGs methylation and transcript levels of NRF2 or its target genes in LUAD and LUSC KRAS wild-type/KRAS mutated subpopulations. The KEAP1 gene structure, is shown in the middle, including exons (sky blue boxes) and introns (brown boxes), as well as two CpG islands: CGI-1 and CGI-2 (both underlined with green bars). A total of 16 CpG sites, marked with green circles, are indicated from 5′ to 3′ genomic localization (listed below). A filled rhombus, corresponding to a KEAP1 CpG site, depicts a significant inverse (blue square) or direct (red square) correlation (R ≤ −0.1; p < 0.05) between methylation and transcript levels of NRF2 or its target genes in LUAD KRAS wild-type/KRAS mutated (A) and particularly in LUSC KRAS wild-type/KRAS mutated (B), in contrast to an empty rhombus indicating no significant correlation. Abbreviations: EX, exon; Intr, intron; CGI-1, CpG Island 1; CGI-2, CpG Island 2; LUSC, lung squamous cell carcinoma; LUAD, lung adenocarcinoma; No-mts, non-metastatic disease stages.
Antioxidants 09 00904 g009
Table 1. List of investigated KEAP1 exonic and intronic cytosine-guanine dinucleotide (CpG) sites.
Gene SymbolCpGChromosomeExonic/Intronic LocationStrandStartEnd
KEAP1cg25801292chr19Exon 1+1061427210614273
KEAP1cg02428100chr19Exon 11061402210614023
KEAP1cg26500801chr19Intron 11061385510613856
KEAP1cg03890664chr19Intron 1+1061349210613493
KEAP1cg15676203chr19Intron 1+1061348810613489
KEAP1cg06911149chr19Intron 1+1061345610613457
KEAP1cg15204119chr19Intron 1+1061318010613181
KEAP1cg26988016chr19Intron 1+1061280210612803
KEAP1cg20226327chr19Intron 21060296010602961
KEAP1cg10505024chr19Exon 3+1060287710602878
KEAP1cg07695362chr19Exon 31060269110602692
KEAP1cg00522555chr19Exon 3-1060258710602588
KEAP1cg01018726chr19Exon 31060231410602315
KEAP1cg22779878chr19Exon 4+1060044610600447
KEAP1cg02337283chr19Exon 5+1059997610599977
KEAP1cg01586432chr19Exon 61059701610597017
CpGs located at KEAP1 CGI-1 (P1 and P2 regions) and CGI-2 3 islands are marked in bold. Chromosome 19p13.2 position is referred NM_203500.2, GRCh37/hg19 release. CpG Island Promoter position (including P1 region -291-89 and P2 region -88+337 from TSS): chr19:10613047-10614280 (Genomic Size: 1234; CpG count: 148). CpG Island exon 3 position: chr19:10602281-10602878 (Genomic Size: 598; CpG count: 60).
Table 2. Clinical-pathological data of lung adenocarcinoma (LUAD) from The Cancer Genome Atlas (TCGA) dataset.
CharacteristicsTotalCharacteristicsTotal
All StagesNon-Metastatic Disease
Cohort size (n)617128
Age at diagnosis
Mean ± devst
65.94 ± 9.88Age at diagnosis
Mean ± devst
64.55 ± 9.82
SexSex
Male284 (46%)Male60 (46.9%)
Female333 (54%)Female68 (53.1%)
RaceRace
White465 (75.4%) White101 (78.9%)
Black or African American59 (9.6%)Black or African American19 (14.8%)
Asian10 (1.6%)Asian2 (1.6%)
NA83 (13.5%)NA6 (4.7%)
Number of packs/year
Mean ± SD
41.63 ± 27.22Number of packs/year
Mean ± SD
41.62 ± 24.71
Stage of diseaseStage of disease
Stage I5 (0.8%)Stage I1 (0.8%)
Stage IA164 (26.6%)Stage IA47 (36.7%)
Stage IB163 (26.4%)Stage IB30 (23.4%)
Stage II1 (0.2%)Stage II1 (0.8%)
Stage IIA63 (10.2%)Stage IIA22 (17.2%)
Stage IIB87 (14.1%)Stage IIB14 (10.9%)
Stage IIIA98 (15.9%)Stage IIIA13 (10.2%)
Stage IV28 (4.5%)
NA8 (1.3%)
SD, standard deviation.
Table 3. Clinical-pathological data of lung squamous cell carcinoma (LUSC) from the TCGA dataset.
CharacteristicsTotalCharacteristicsTotal
All StagesNon-Metastatic Disease
Cohort size (n)571141
Age at diagnosis
Mean ± SD
67.65 ± 8.58Age at diagnosis
Mean ± SD
65.91 ± 8.66
SexSex
Male424 (74.3%)Male112 (79.4%)
Female147 (25.7%)Female29 (20.6%)
RaceRace
White402 (70.4%)White124 (87.9%)
Black or African American40 (7%)Black or African American4 (2.8%)
Asian10 (1.8%)Asian4 (2.8%)
NA119 (20.8%)NA9 (6.4%)
Number of packs/year
Mean ± SD
53.62 ± 32.12Number of packs/year
Mean ± SD
49.29 ± 25.24
Stage of diseaseStage of disease
Stage I5 (0.9%)Stage IA29 (20.6%)
Stage IA107 (18.7%)Stage IB40 (28.4%)
Stage IB172 (30.1%)Stage IIA30 (21.3%)
Stage II3 (0.5%)Stage IIB24 (17%)
Stage IIA75 (13.1%)Stage IIIA18 (12.8%)
Stage IIB108 (18.9%)
Stage III3 (0.5%)
Stage IIIA66 (11.6%)
Stage IIIB21 (3.7%)
Stage IV7 (1.2%)
NA4 (0.7%)
SD, standard deviation.
Table 4. Regulatory features co-localizing with KEAP1 CpGs.
CpGRegulatory Feature
Exonic/Intronic LocationStrandStartEndCpGFeat StartFeat EndNameScoreUCSC
Track
Exon 1+1061427210614273cg258012921061391010614318E2F61000A
Exon 1+1061427210614273cg258012921061391910614347E2F6_(H-50)1000A
Exon 11061402210614023cg024281001061391010614318E2F61000A
Exon 11061402210614023cg024281001061391910614347E2F6_(H-50)1000A
Intron 21060296010602961cg202263271060275110603103CTCF1000A
Exon 3+1060287710602878cg105050241060275110603103CTCF1000A
Exon 1+1061427210614273cg258012921061258010614352POLR2A1000B
Exon 1+1061427210614273cg258012921061295510614326PHF81000B
Exon 1+1061427210614273cg258012921061327210614430MAX1000B
Exon 1+1061427210614273cg258012921061381410614366E2F61000B
Exon 1-1061402210614023cg024281001061258010614352POLR2A1000B
Exon 11061402210614023cg024281001061295510614326PHF81000B
Exon 11061402210614023cg024281001061327210614430MAX1000B
Exon 11061402210614023cg024281001061381410614366E2F61000B
Intron 21060296010602961cg202263271060273110603130CTCF1000B
Exon 3+1060287710602878cg105050241060273110603130CTCF1000B
Exon 31060269110602692cg076953621060273110603130CTCF1000B
Exon 5+1059997610599977cg023372831059996710599986V$GR_Q6850C
For each overlapping feature, the chromosomal start/end, the transcription factor name and scores are provided. Only high-confidence features (score > 800; maximum score = 1000) are reported. UCSC track A is related to transcription factor binding sites (TFBSs) from the ENCODE Project Release 3 (wgEncodeRegTfbsClusteredV3); track B is related to TFBS from the ENCODE Project Release 2 (wgEncodeRegTfbsClusteredV2); track C is related to a collection of computationally predicted TFBS (tfbsConsSites); conservation scores are computed through the Transfac Matrix and Factor Database v7.0, considering three species (human, mouse, rat). “V$GR_Q6” refers to a binding matrix associated with the NR3C1 receptor.

