
Analyses of Public Attention and Sentiments towards Different COVID-19 Vaccines Using Data Mining Techniques

 , ,
, , 
Abstract
:1. Introduction
2. Background
3. Materials and Methods
3.1. Data Collection
3.2. Data Statistics
3.3. Pre-Processing
3.4. Sentiment Analysis
3.5. Temporal Analysis
3.6. Geographical Analysis
4. Results and Discussion
4.1. Data Separation
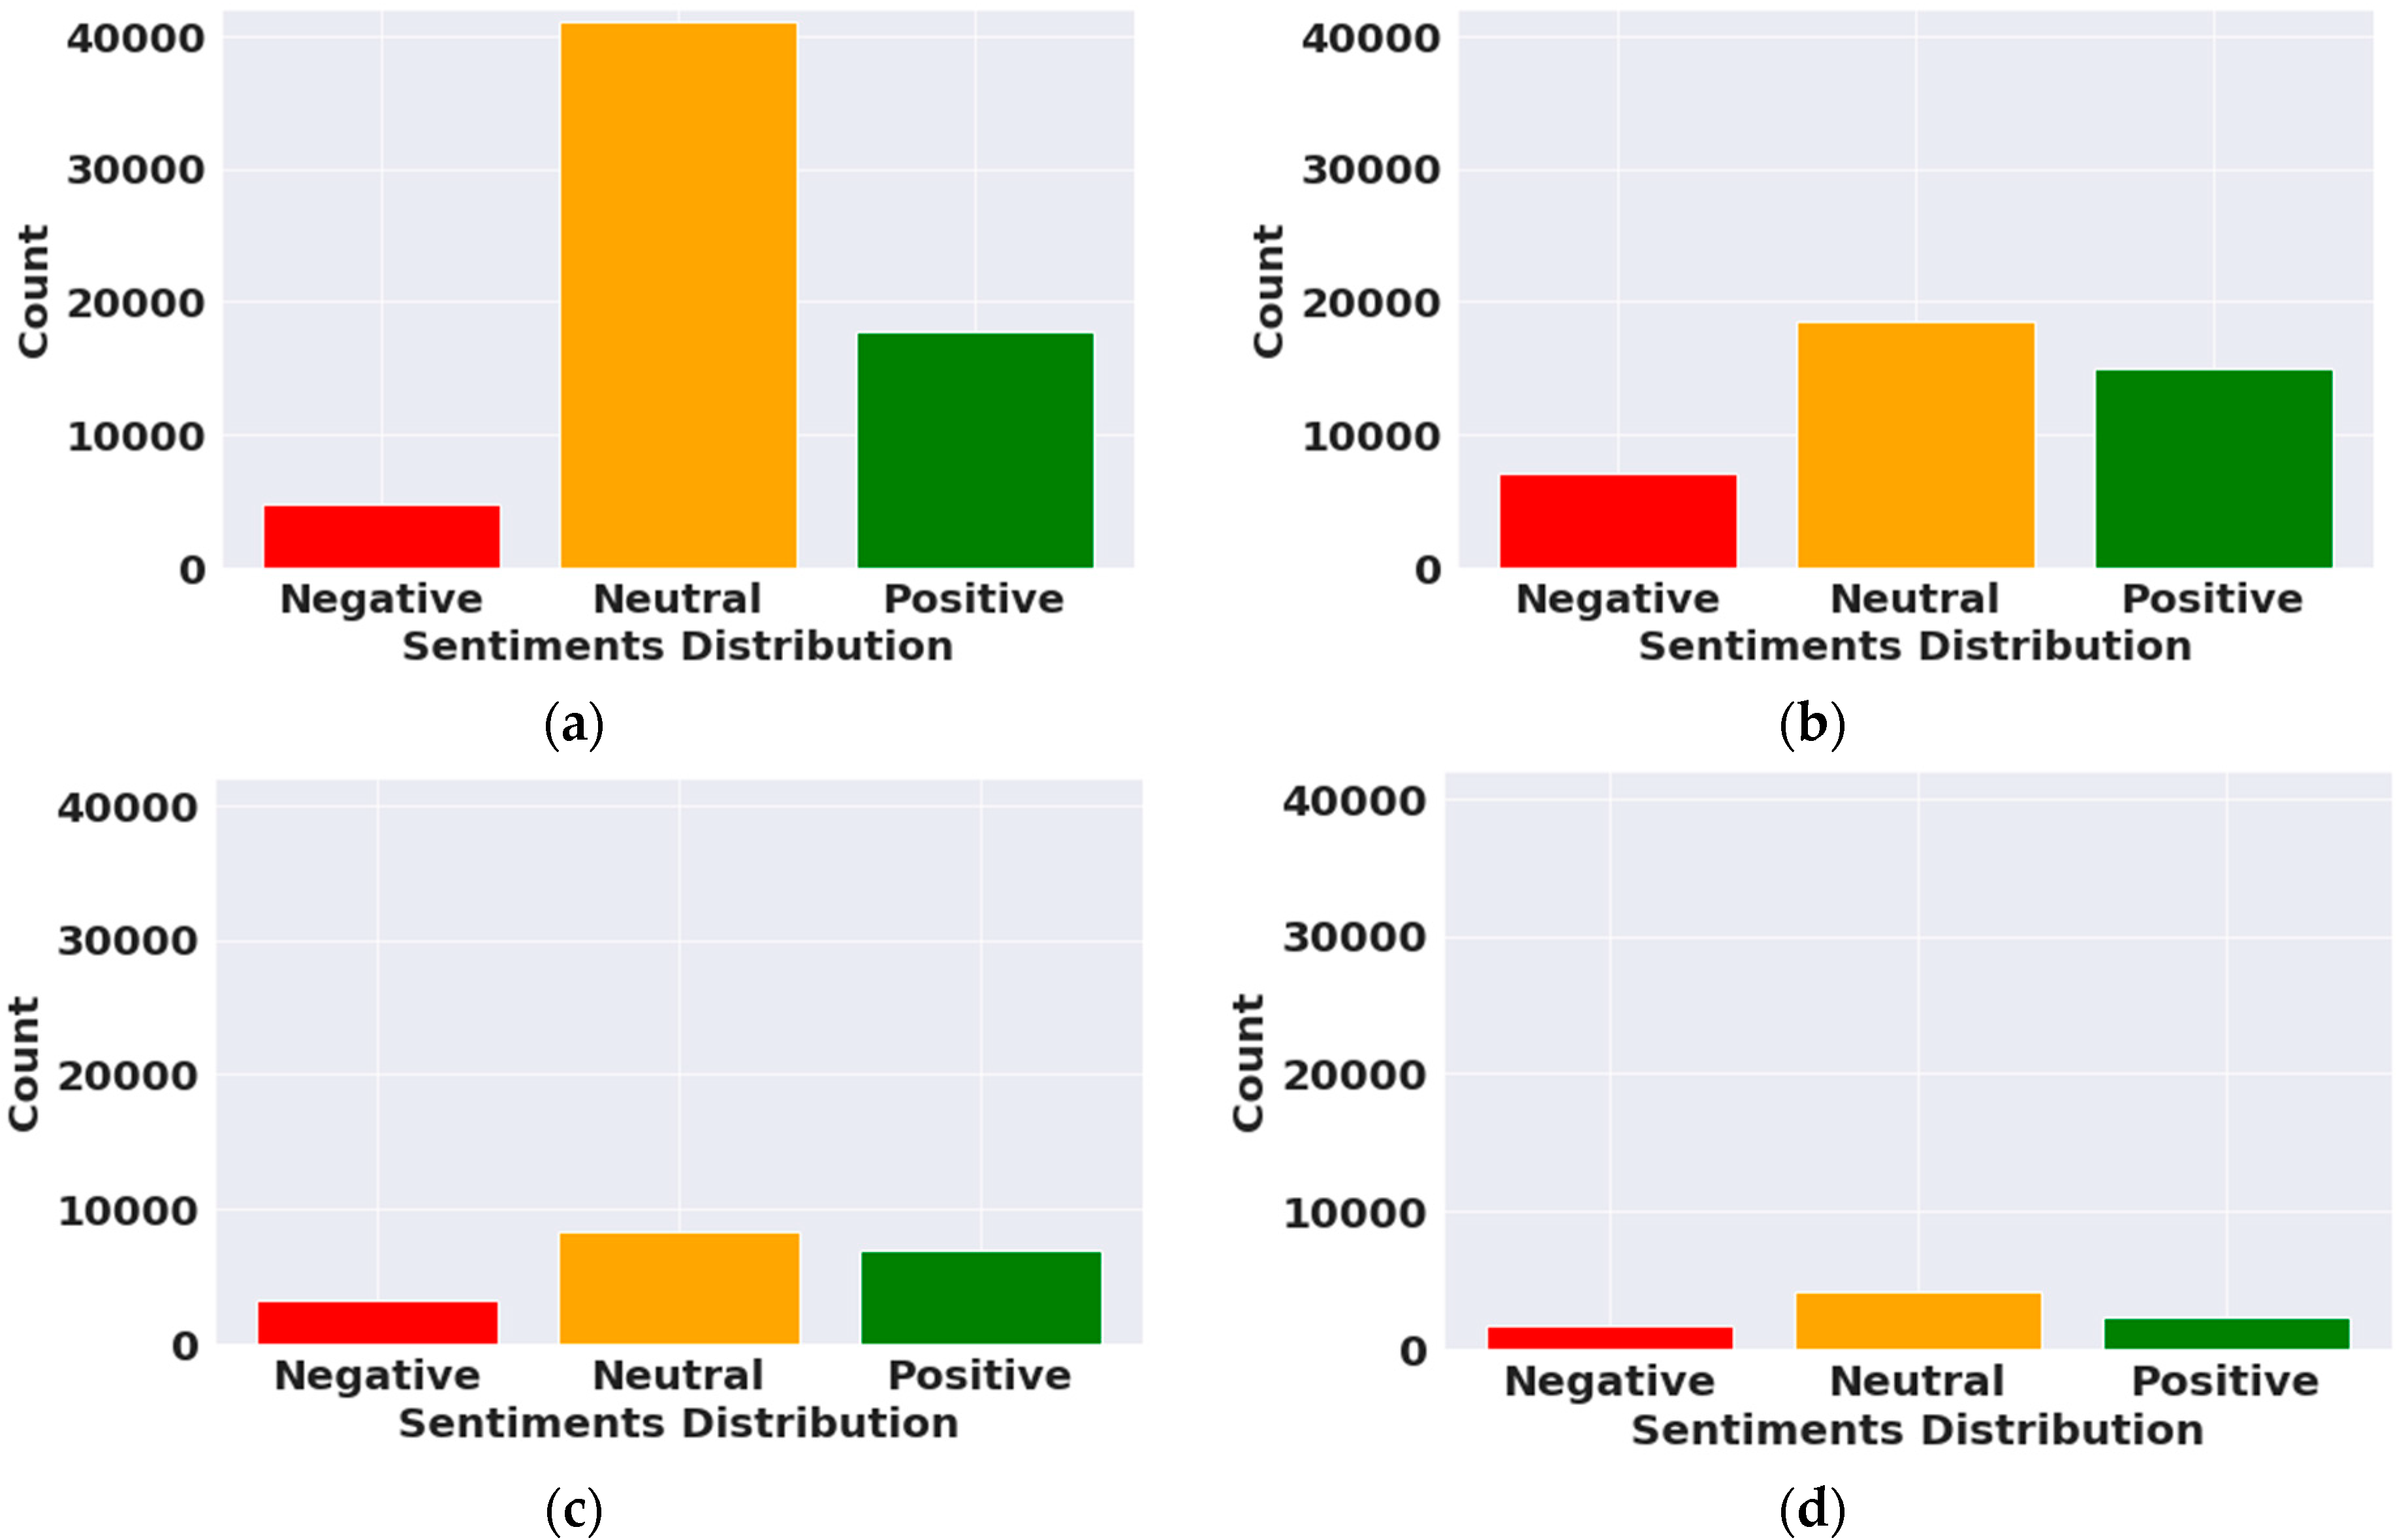
4.2. Sentiment Analysis
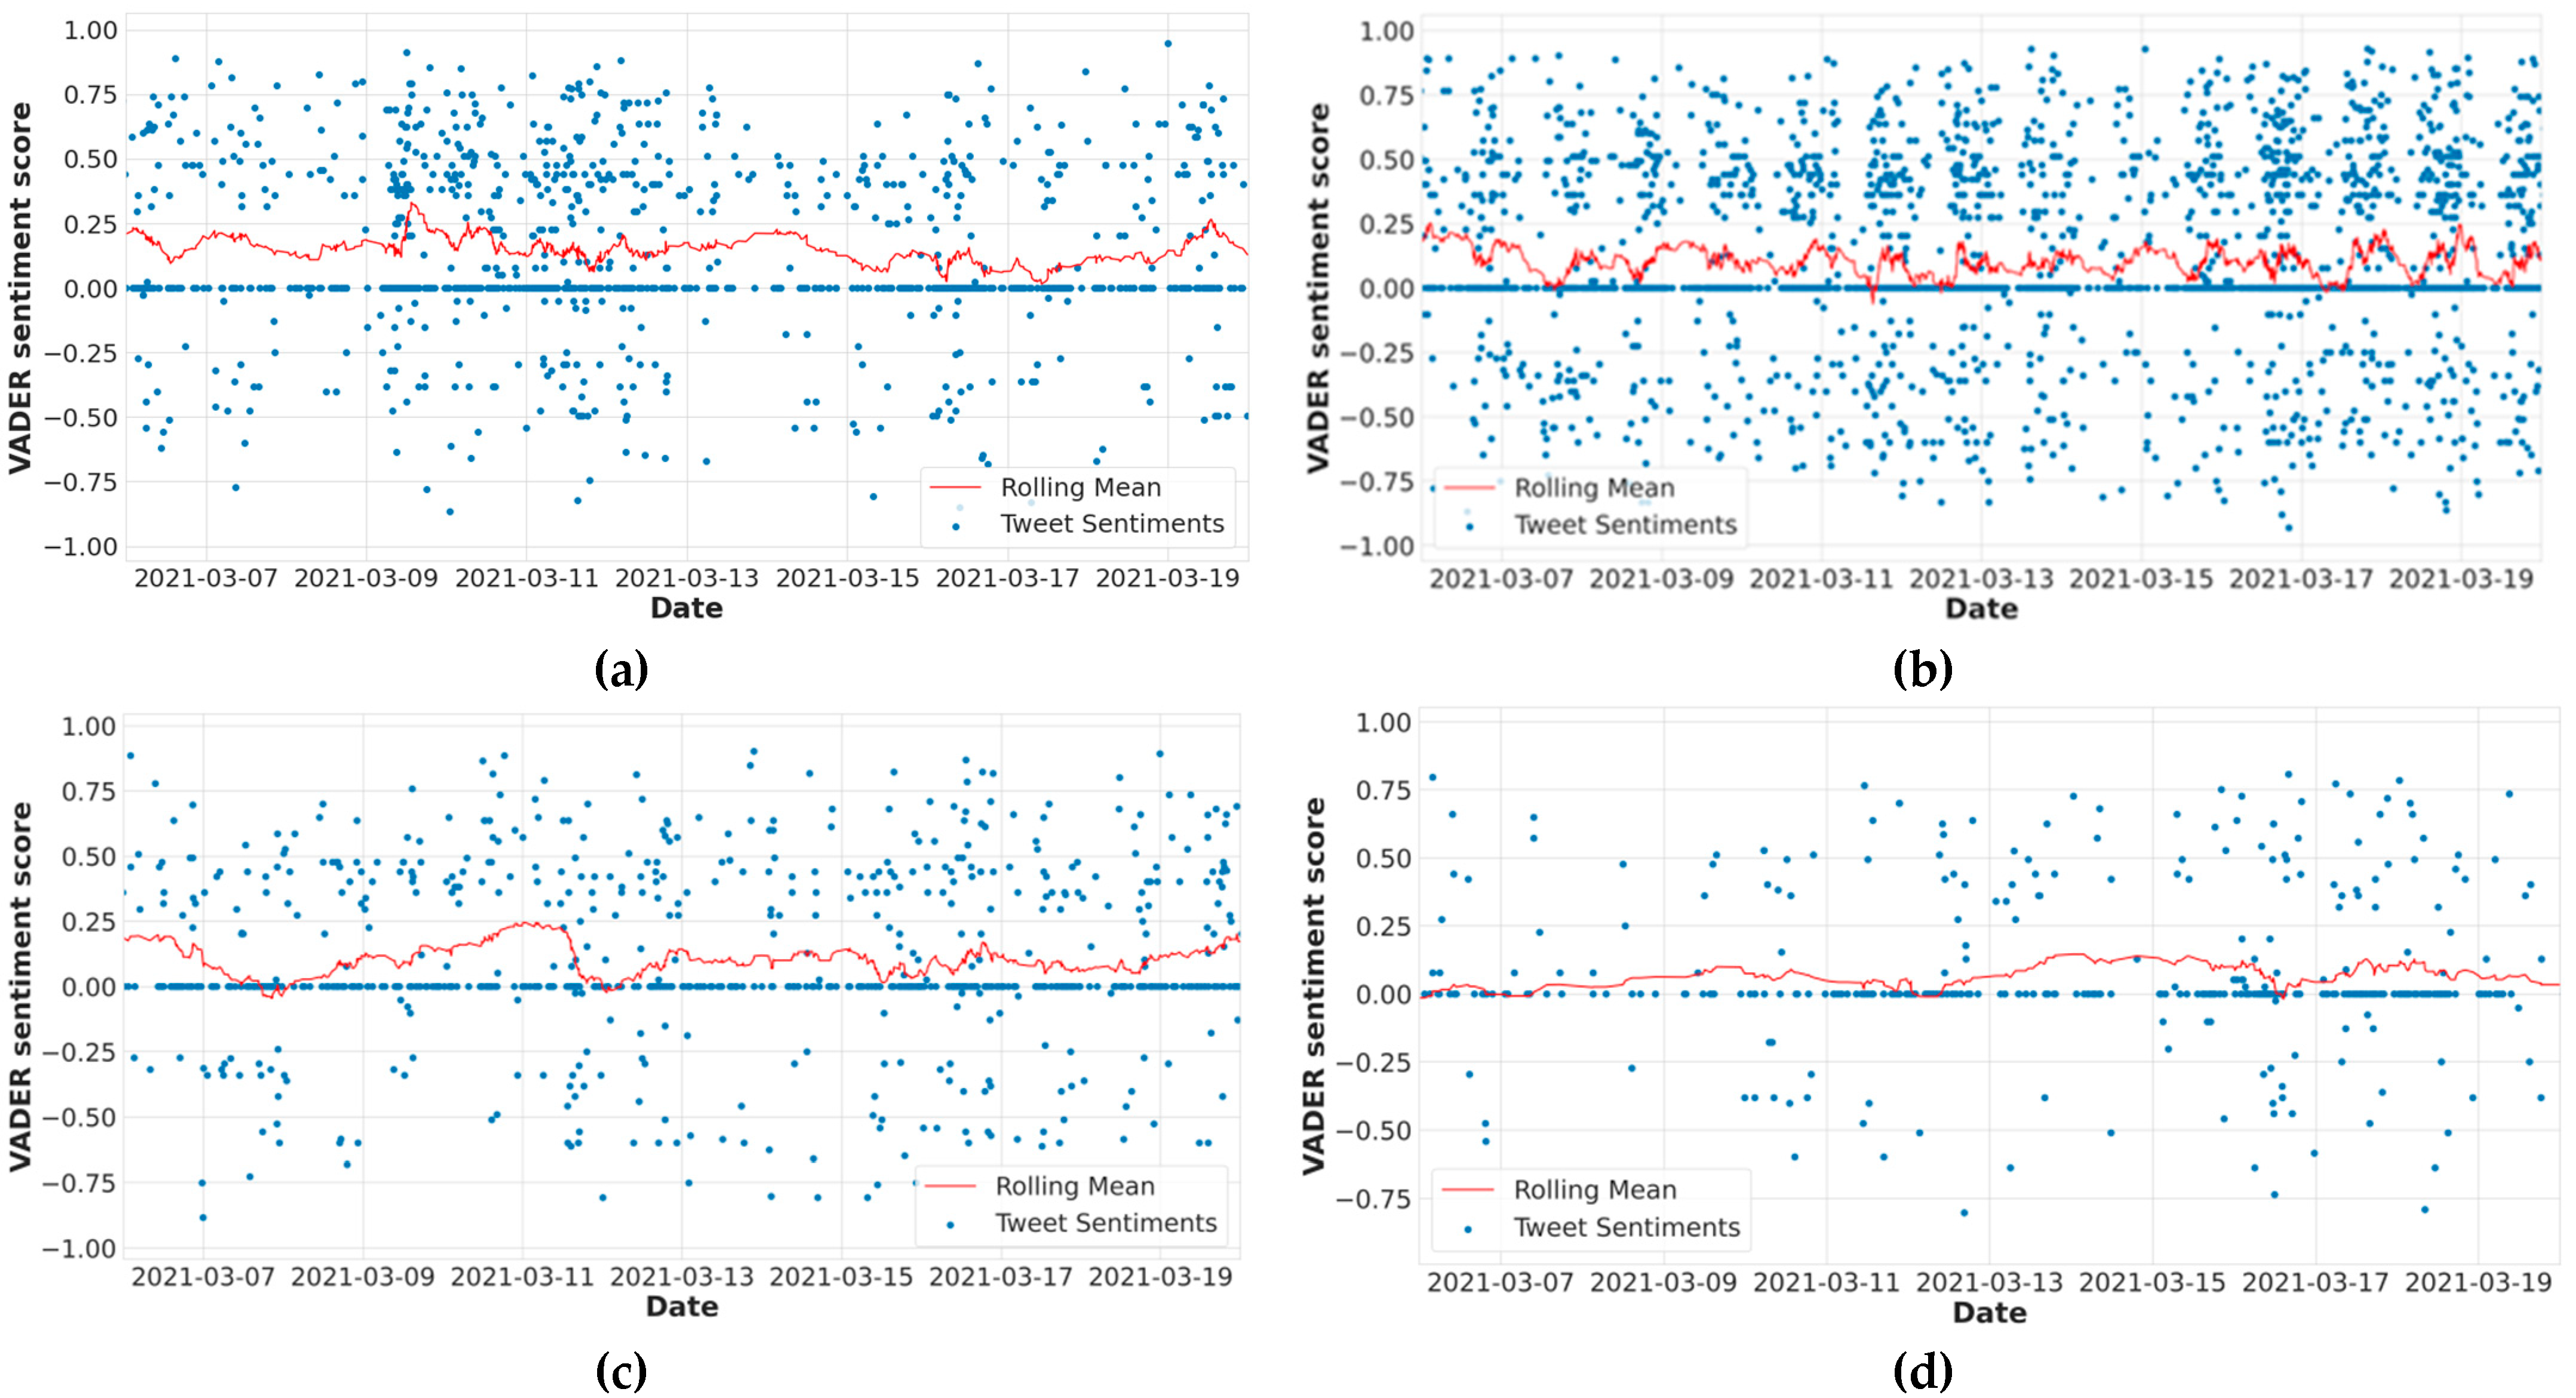
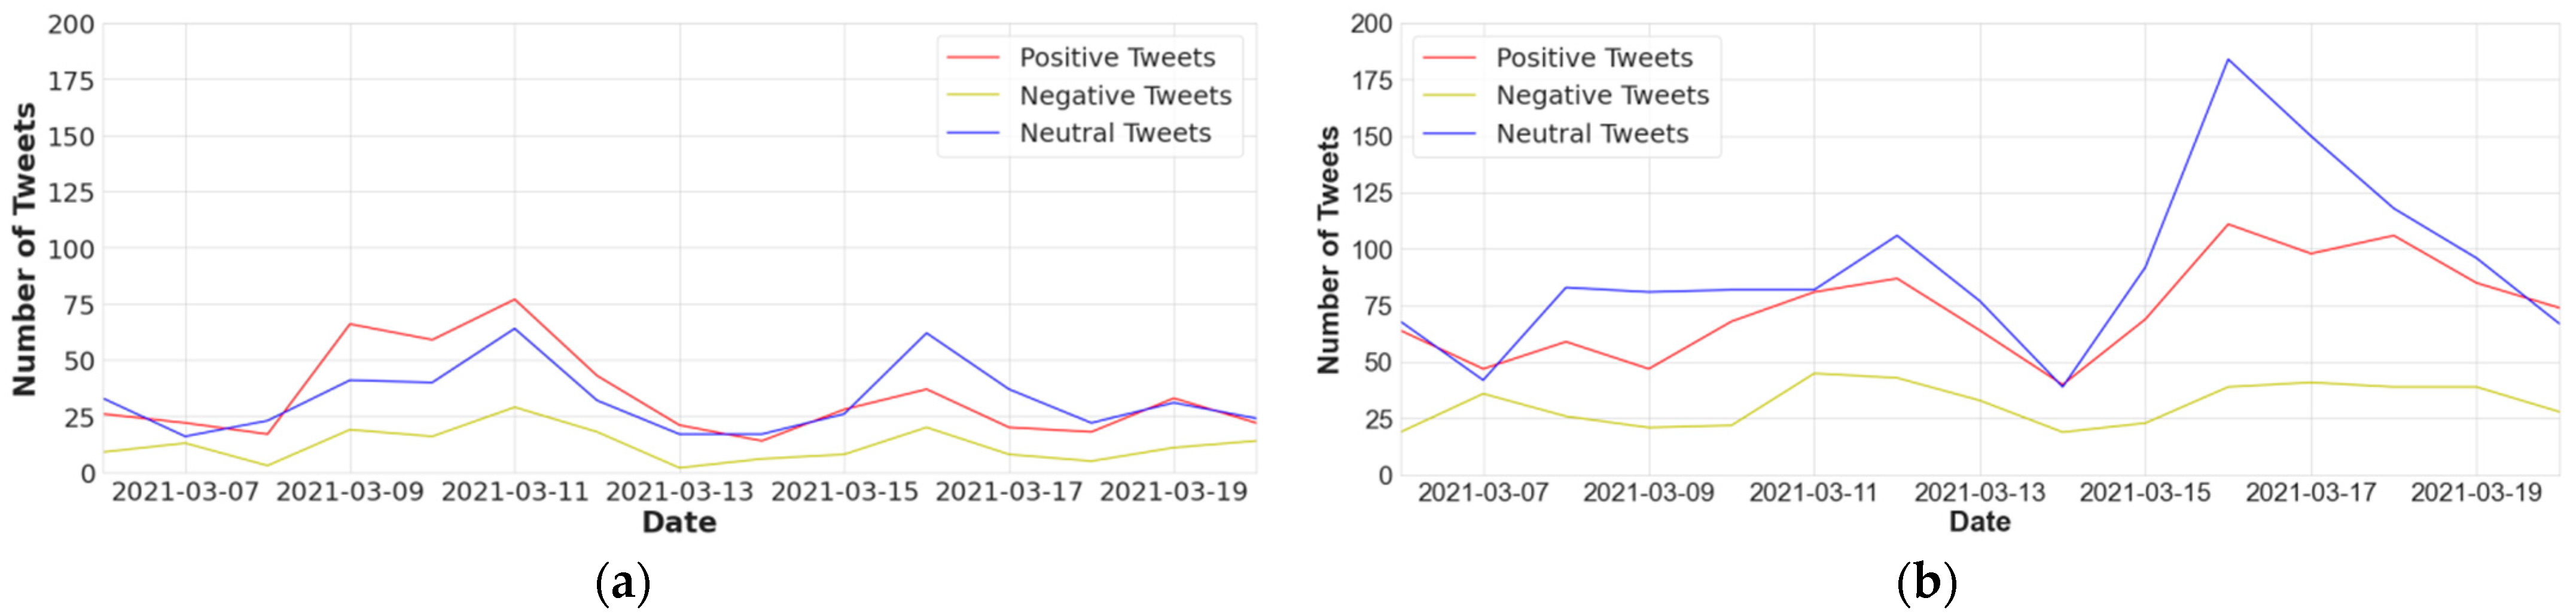
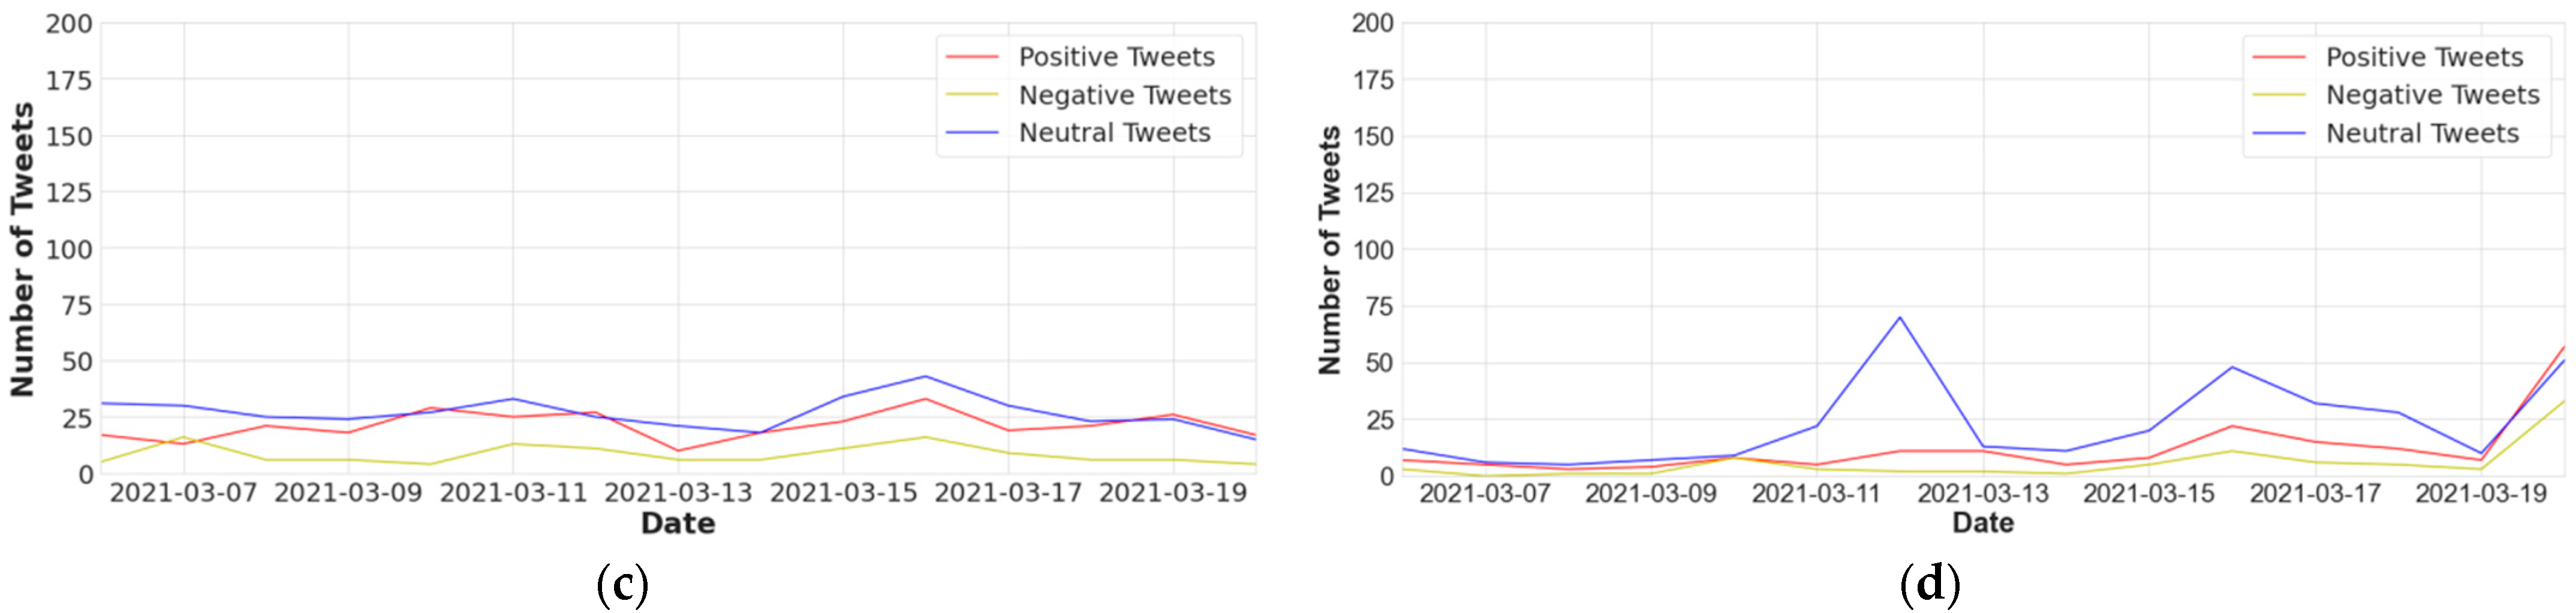
4.3. Temporal Analysis
4.3.1. Covaxin
4.3.2. Moderna
4.3.3. Pfizer
4.3.4. Sinopharm
4.4. Geographical Analysis
4.4.1. Covaxin
4.4.2. Moderna
4.4.3. Pfizer
4.4.4. Sinopharm
5. Conclusions
6. Limitations
Author Contributions
Funding
Institutional Review Board Statement
Informed Consent Statement
Data Availability Statement
Acknowledgments
Conflicts of Interest
References
- Jung, S.-M.; Akhmetzhanov, A.R.; Hayashi, K.; Linton, N.M.; Yang, Y.; Yuan, B.; Kobayashi, T.; Kinoshita, R.; Nishura, H. Real-time estimation of the risk of death from novel coronavirus (COVID-19) infection: Inference using exported cases. J. Clin. Med. 2020, 9, 523. [Google Scholar] [CrossRef] [PubMed] [Green Version]
- Times, G. Global Coronavirus Cases Hit 100 m, Can Humanity Really Learn from the Apocalypse-Like Pandemic? 2021. Available online: https://www.globaltimes.cn/page/202101/1213962.shtml (accessed on 21 November 2021).
- CDC. Different COVID-19 Vaccines. 2020. Available online: https://www.cdc.gov/coronavirus/2019-ncov/vaccines/different-vaccines.html (accessed on 22 November 2021).
- WHO. COVID-19: What We Know about the Future of COVID-19 Vaccines. 2020. Available online: https://www.who.int/china/news/feature-stories/detail/covid-19-what-we-know-about-the-Future-covid-19-vaccines (accessed on 22 November 2021).
- WHO. The Pfizer BioNTech (BNT162b2) COVID-19 Vaccine: What You Need to Know. 2021. Available online: https://www.who.int/news-room/feature-stories/detail/who-can-take-the-pfizer-biontech-covid-19--vaccine (accessed on 22 November 2021).
- WHO. The Oxford/AstraZeneca COVID-19 Vaccine: What You Need to Know. 2021. Available online: https://www.who.int/news-room/feature-stories/detail/the-oxford-astrazeneca-covid-19-vaccine-what-you-need-to-know (accessed on 22 November 2021).
- WHO. The Janssen Ad26.COV2.S COVID-19 Vaccine: What You Need to Know. 2021. Available online: https://www.who.int/news-room/feature-stories/detail/the-j-j-covid-19-vaccine-what-you-need-to-know (accessed on 22 November 2021).
- WHO. The Moderna COVID-19 (mRNA-1273) Vaccine: What You Need to Know. 2021. Available online: https://www.who.int/news-room/feature-stories/detail/the-moderna-covid-19-mrna-1273-vaccine-what-you-need-to-know (accessed on 22 November 2021).
- WHO. The Sinopharm COVID-19 Vaccine: What You Need to Know. 2021. Available online: https://www.who.int/news-room/feature-stories/detail/the-sinopharm-covid-19-vaccine-what-you-need-to-know (accessed on 22 November 2021).
- Randolph, H.E.; Barreiro, L.B. Herd immunity: Understanding COVID-19. Immunity 2020, 52, 737–741. [Google Scholar] [CrossRef]
- Altmann, D.M.; Douek, D.C.; Boyton, R.J. What policy makers need to know about COVID-19 protective immunity. Lancet 2020, 395, 1527–1529. [Google Scholar] [CrossRef]
- Larson, H.; de Figueiredo, A.; Karafillakis, E.; Rawal, M. State of Vaccine Confidence in the EU 2018; Publications Office of the European Union: Luxembourg, 2018; Volume 10, p. 241099. [Google Scholar]
- Neumann-Böhme, S.; Varghese, N.E.; Sabat, I.; Barros, P.P.; Brouwer, W.; van Exel, J.; Schreyögg, J.; Stargardt, T. Once We Have it, Will We Use It? A European Survey on Willingness to be Vaccinated against COVID-19; Springer: Berlin/Heidelberg, Germany, 2020; pp. 1–6. [Google Scholar]
- Peretti-Watel, P.; Seror, V.; Cortaredona, S.; Launay, O.; Raude, J.; Verger, P.; Beck, F.; Legleye, S.; L’Haridon, O.; Ward, J. A future vaccination campaign against COVID-19 at risk of vaccine hesitancy and politicisation. Lancet Infect. Dis. 2020, 20, 769–770. [Google Scholar] [CrossRef]
- Thunstrom, L.; Ashworth, M.; Finnoff, D.; Newbold, S. Hesitancy towards a COVID-19 vaccine and prospects for herd immunity. Ecohealth 2021, 18, 44–60. [Google Scholar] [CrossRef] [PubMed]
- Masood, S. Pakistan’s War on Polio Falters Amid Attacks on Health Workers and Mistrust. The New York Times. 2019. Available online: https://www.nytimes.com/2019/04/29/world/asia/pakistan-polio-vaccinations-campaign.html (accessed on 22 November 2021).
- Li, Y.; Gao, X.; Du, M.; He, R.; Yang, S.; Xiong, J. What causes different sentiment classification on social network services? Evidence from weibo with genetically modified food in China. Sustainability 2020, 12, 1345. [Google Scholar] [CrossRef] [Green Version]
- Fu, Y.; Jin, H.; Xiang, H.; Wang, N. Optimal lockdown policy for vaccination during COVID-19 pandemic. Finance Res. Lett. 2021, 45, 102123. [Google Scholar] [CrossRef]
- Sinnenberg, L.; Buttenheim, A.M.; Padrez, K.; Mancheno, C.; Ungar, L.; Merchant, R.M. Twitter as a tool for health research: A systematic review. Am. J. Public Health 2017, 107, e1–e8. [Google Scholar] [CrossRef]
- Deiner, M.S.; Fathy, C.; Kim, J.; Niemeyer, K.; Ramirez, D.; Ackley, S.F.; Liu, F.; Lietman, T.; Porco, T. Facebook and Twitter vaccine sentiment in response to measles outbreaks. Health Inform. J. 2019, 25, 1116–1132. [Google Scholar] [CrossRef] [Green Version]
- Ndasauka, Y.; Hou, J.; Wang, Y.; Yang, L.; Yang, Z.; Ye, Z.; Zhang, X. Excessive use of Twitter among college students in the UK: Validation of the Microblog Excessive Use Scale and relationship to social interaction and loneliness. Comput. Human Behav. 2016, 55, 963–971. [Google Scholar] [CrossRef]
- Cureg, M.Q.; De La Cruz, J.A.D.; Solomon, J.C.A.; Saharkhiz, A.T.; Balan, A.K.D.; Samonte, M.J.C. Sentiment analysis on tweets with punctuations, emoticons, and negations. In Proceedings of the 2nd International Conference on Information Science and Systems, Tokyo, Japan, 16–19 March 2019. [Google Scholar]
- Raghupathi, V.; Ren, J.; Raghupathi, W. Studying public perception about vaccination: A sentiment analysis of tweets. Int. J. Environ. Res. Public Health 2020, 17, 3464. [Google Scholar] [CrossRef] [PubMed]
- Du, J.; Luo, C.; Shegog, R.; Bian, J.; Cunningham, R.M.; Boom, J.A.; Tao, C. Use of Deep Learning to Analyze Social Media Discussions About the Human Papillomavirus Vaccine. JAMA Netw. Open 2020, 3, e2022025. [Google Scholar] [CrossRef] [PubMed]
- Dubey, A.D. Public Sentiment Analysis of COVID-19 Vaccination Drive in India. SSRN Electron. J. 2021, 3772401. [Google Scholar] [CrossRef]
- Paul, E.; Steptoe, A.; Fancourt, D. Attitudes towards vaccines and intention to vaccinate against COVID-19: Implications for public health communications. Lancet Reg. Health Eur. 2021, 1, 100012. [Google Scholar] [CrossRef]
- Kreps, S.; Dasgupta, N.; Brownstein, J.S.; Hswen, Y.; Kriner, D.L. Public attitudes toward COVID-19 vaccination: The role of vaccine attributes, incentives, and misinformation. NPJ Vaccines 2021, 6, 1–7. [Google Scholar] [CrossRef]
- Omar, D.I.; Hani, B.M. Attitudes and intentions towards COVID-19 vaccines and associated factors among Egyptian adults. J. Infect. Public Health 2021, 14, 1481–1488. [Google Scholar] [CrossRef]
- Al-Qerem, W.; Jarab, A.S.; Qarqaz, R.; Al Hayek, M. Attitudes of a sample of Jordanian young adults toward different available COVID-19 vaccines. Vacunas 2021. online ahead of print. [Google Scholar] [CrossRef]
- Khan, Z.A.; Allana, R.; Afzasl, I.; Alis, A.S.; Mariam, O.; Aslam, R.; Shaf, I.A.; Allana, S.; Haider, M.M.; Jandani, R.; et al. Assessment of attitude and hesitancy towards vaccine against COVID-19 in a Pakistani population: A mix methods survey. Vacunas 2021. online ahead of print. [Google Scholar] [CrossRef]
- Lazarus, J.V.; Ratzan, S.C.; Palayew, A.; Gostin, L.O.; Larson, H.J.; Rabin, K.; Kimball, S.; El-Mohandes, A. A global survey of potential acceptance of a COVID-19 vaccine. Nat. Med. 2021, 27, 225–228. [Google Scholar] [CrossRef]
- Statista. Rate of COVID-19 Vaccine Doses Administered Worldwide as of December 11, by Country or Territory (per 100 People). 2021. Available online: https://0-www-statista-com.brum.beds.ac.uk/statistics/1194939/rate-covid-vaccination-by-county-worldwide/ (accessed on 22 March 2021).
- Data, O.W.I. Coronavirus (COVID-19) Vaccinations. 2020. Available online: https://ourworldindata.org/covid-vaccinations. (accessed on 22 March 2021).
- Sorathiya, R. Political Analytics on Election Candidates and Their Parties in Context of the US Presidential Elections 2020; Laurentian University of Sudbury: Sudbury, ON, Canada, 2021. [Google Scholar]
- Duca, A.L. How to Build a Dataset from Twitter Using Python Tweepy. Available online: https://towardsdatascience.com/how-to-build-a-dataset-from-twitter-using-python-tweepy-861bdbc16fa5 (accessed on 22 March 2021).
- Agarwal, A.; Xie, B.; Vovsha, I.; Rambow, O.; Passonneau, R.J. Sentiment analysis of twitter data. In Proceedings of the Workshop on Language in Social Media (LSM 2011), Portland, OR, USA, 23 June 2011; pp. 30–38. [Google Scholar]
- Bonta, V.; Janardhan, N.K.a.N. A comprehensive study on lexicon based approaches for sentiment analysis. Asian J. Comput. Sci. Technol. 2019, 8, 1–6. [Google Scholar] [CrossRef]
- Hutto, C.; Gilbert, E. Vader: A parsimonious rule-based model for sentiment analysis of social media text. In Proceedings of the International AAAI Conference on Web and Social Media, Ann Arbor, MI, USA, 1–14 June 2014. [Google Scholar]
- ES, S. Sentiment Analysis in Python: TextBlob vs Vader Sentiment vs Flair vs Building It From Scratch. 2021. Available online: https://neptune.ai/blog/sentiment-analysis-python-textblob-vs-vader-vs-flair (accessed on 3 December 2021).
- Zach. How to Perform McNemar’s Test in Python. 2020. Available online: https://www.statology.org/mcnemars-test-python/ (accessed on 22 November 2021).
- Shah2, R. How to Build Word Cloud in Python? 2021. Available online: https://www.analyticsvidhya.com/blog/2021/05/how-to-build-word-cloud-in-python/ (accessed on 22 November 2021).
- Barrett, P.; Hunter, J.; Miller, J.T.; Hsu, J.C.; Greenfield, P. matplotlib—A Portable Python Plotting Package. In Astronomical Data ANALYSIS Software and Systems XIV; Astronomical Society of the Pacific: San Francisco, CA, USA, 2005. [Google Scholar]
- Randles, B.M.; Pasquetto, I.V.; Golshan, M.S.; Borgman, C.L. Using the Jupyter notebook as a tool for open science: An empirical study. In ACM/IEEE Joint Conference on Digital Libraries (JCDL); IEEE: Piscataway, NJ, USA, 2017. [Google Scholar]
- Pfizer. Pfizer and BioNTech Celebrate Historic First Authorization in the U.S. of Vaccine to Prevent COVID-19. 2020. Available online: https://www.pfizer.com/news/press-release/press-release-detail/pfizer-and-biontech-celebrate-historic-first-authorization (accessed on 25 November 2021).
- Moderna. Moderna’s Work on our COVID-19 Vaccine. 2020. Available online: https://www.modernatx.com/modernas-work-potential-vaccine-against-covid-19 (accessed on 25 November 2021).
- Ostertagova, E.; Ostertag, O.; Kováč, J. Methodology and application of the Kruskal-Wallis test. Appl. Mech. Mater. 2014, 611, 115–120. [Google Scholar] [CrossRef]
- Nanda, A.; Mohapatra, B.B.; Mahapatra, A.P.K.; Abiresh Prasad Kumar Mahapatra, A.P.K.; Mahapatra, A.P.K. Multiple comparison test by Tukey’s honestly significant difference (HSD): Do the confident level control type I error. IJAMS 2021, 6, 59–65. [Google Scholar] [CrossRef]


| Name | Number of Tweets | Percentage of Tweets |
|---|---|---|
| Covaxin | 63,545 | 29.8% |
| Moderna | 40,552 | 19% |
| Pfizer | 18,396 | 8.6% |
| Sinopharm | 8109 | 3.8% |
| Sentiments | Number of Tweets Using TextBlob | Percentage of Tweets Using TextBlob | Number of Tweets Using VADER | Percentage of Tweets Using VADER |
|---|---|---|---|---|
| Positive | 70,607 | 33% | 77,573 | 36% |
| Negative | 21,557 | 10% | 32,085 | 15% |
| Neutral | 120,818 | 57% | 103,324 | 49% |
| Total | 212,982 | 100% | 212,982 | 100% |
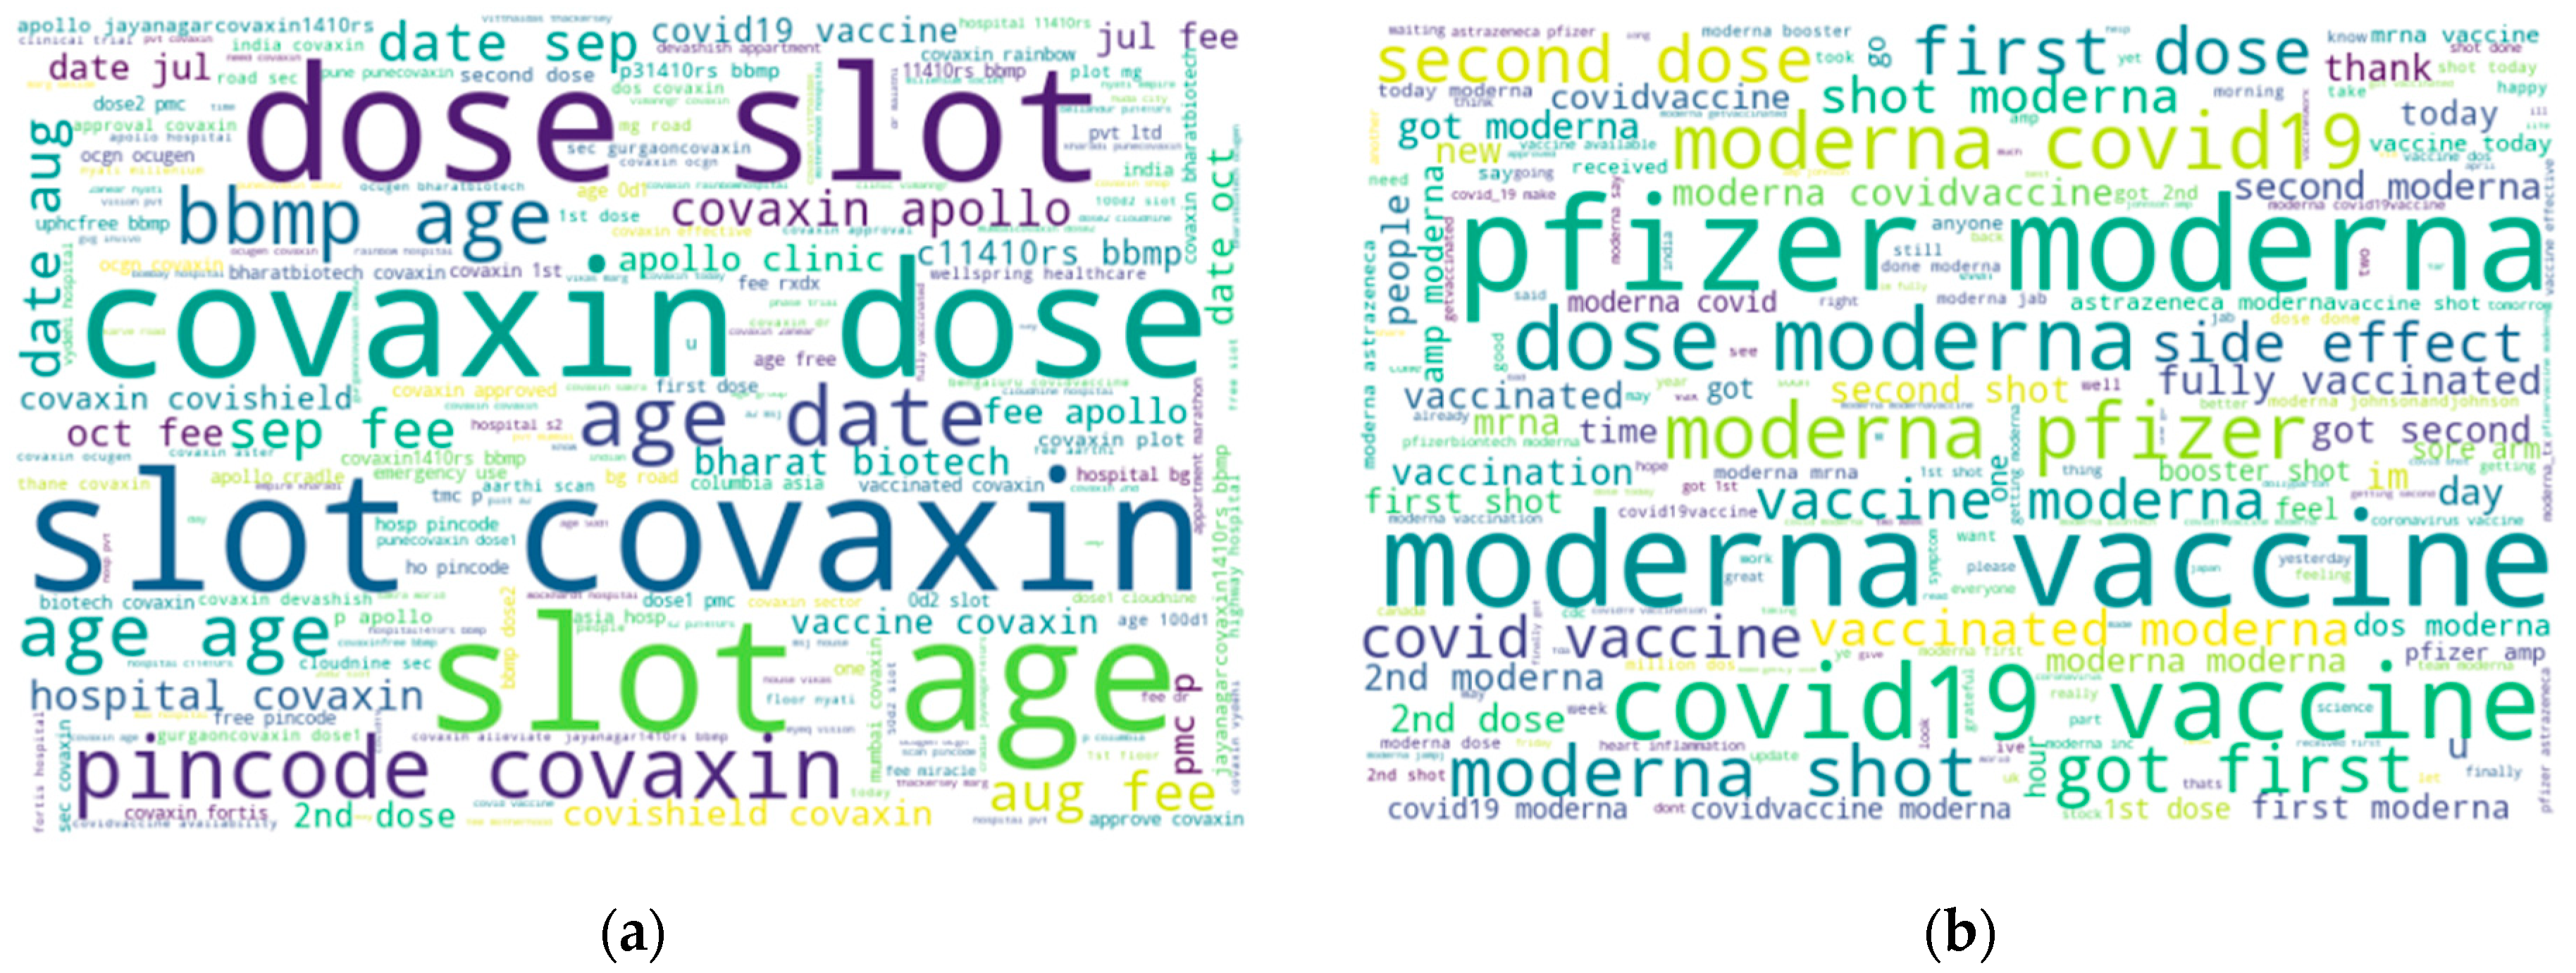
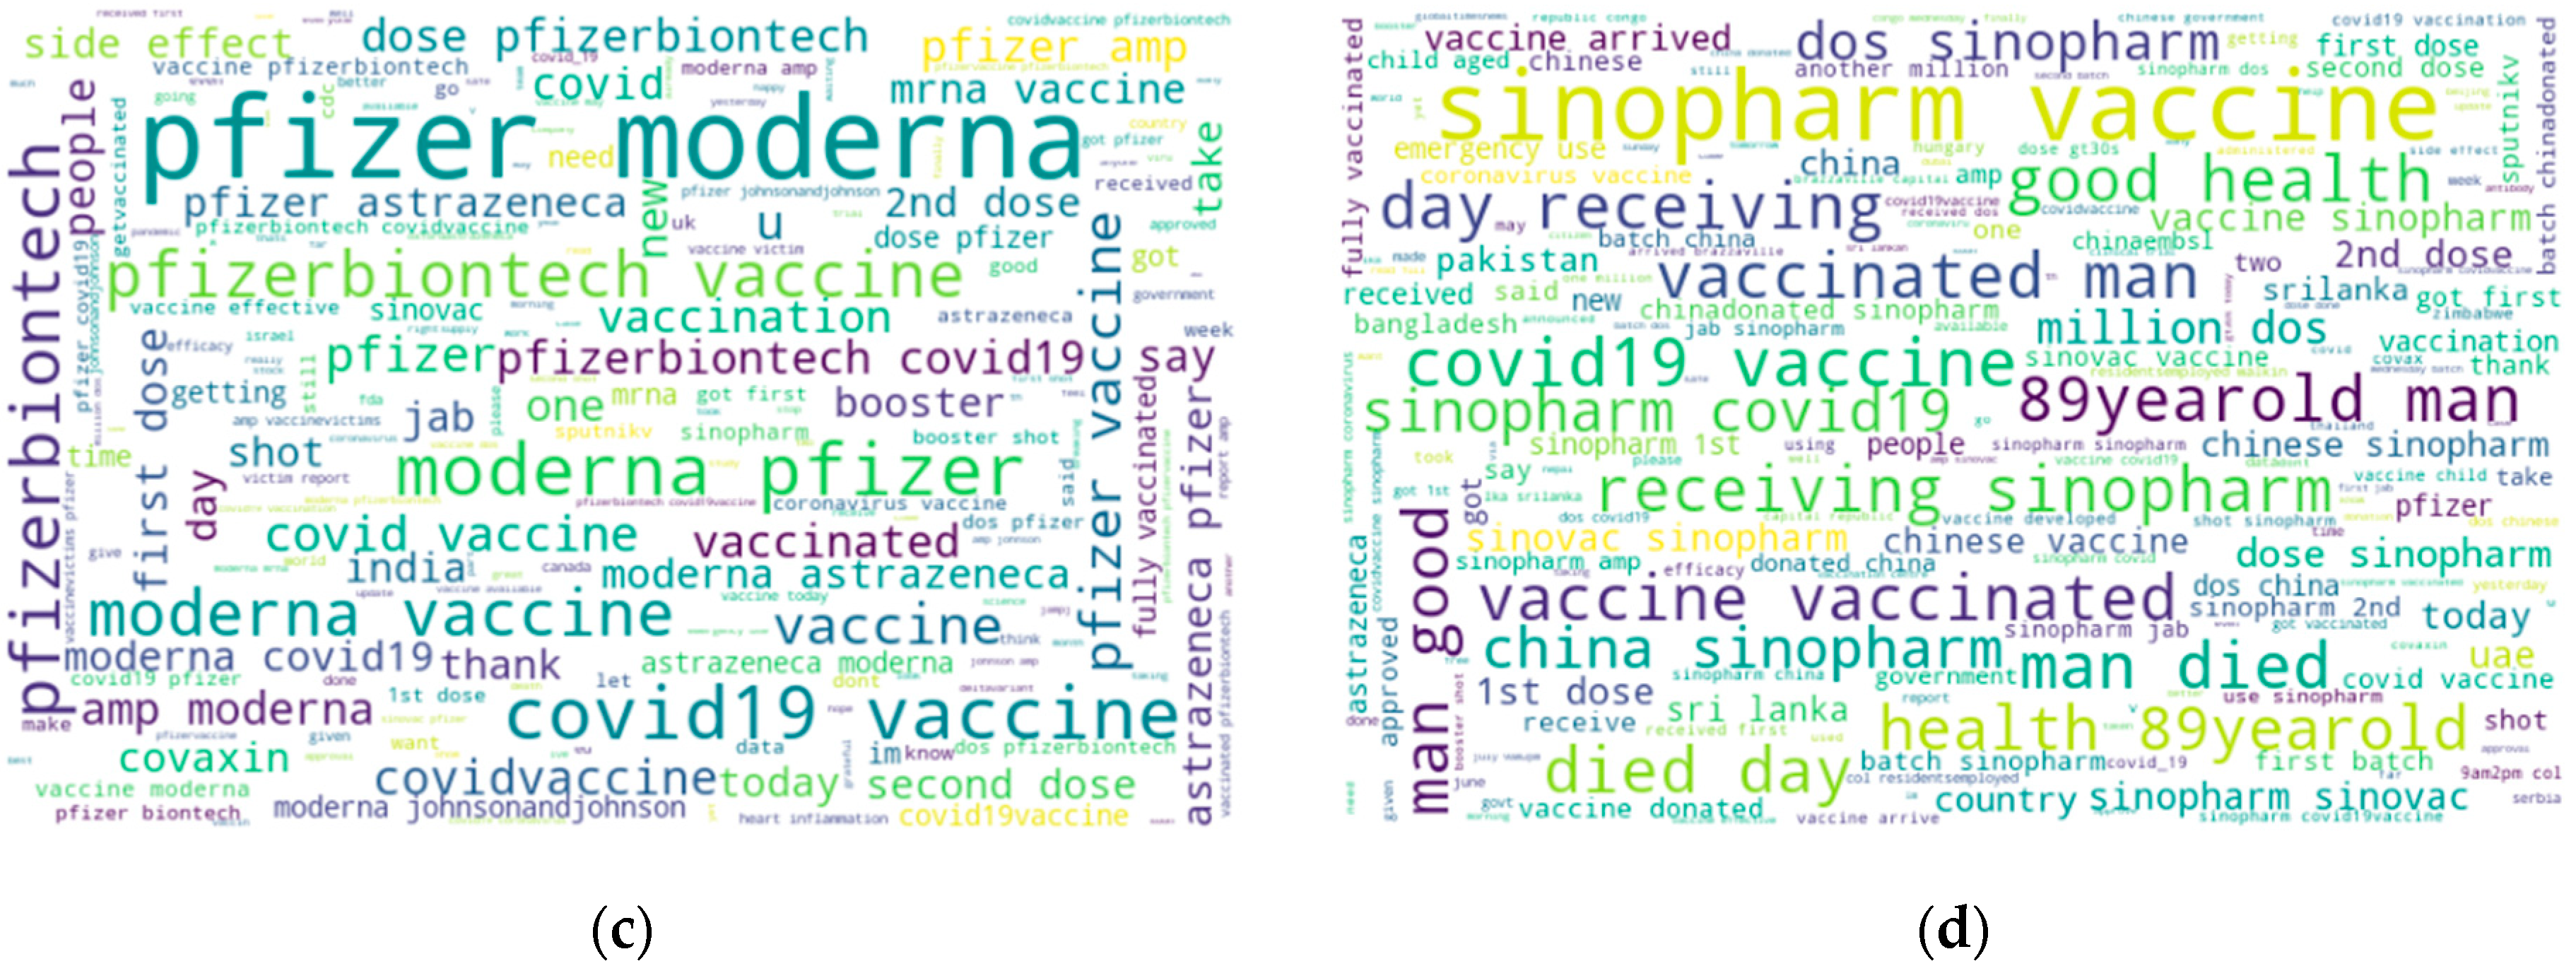
| Sentiments | Frequent Words | |
|---|---|---|
| Positive Sentiments | Negative Sentiments | |
| Covaxin | Covaxin, age, slot, vaccine, dose, Bharat biotech, approval, free, India, covishield | Covaxin, hospital, vaccine, block, age, slot, emergency, dose, use, India |
| Moderna | Moderna, vaccine, Pfizer, COVID19, shot, got, dose, first, today, vaccinated | Moderna, vaccine, Pfizer, arm, sore, effect, hour, pain, report, death, Japan |
| Pfizer | Pfizer, vaccine, Moderna, Pfizerbiontech, COVID19, dose, effective, first, get, shot | Pfizer, Moderna, vaccine, Pfizerbiontech, covid19, AstraZeneca, death, report, people, victims |
| Sinopharm | Sinopharm, vaccine, China, COVID19, approved, Sinovac, Chinese, dose, use, got, vaccinated, effective | man, Sinopharm, vaccine, day, vaccinated, died, receiving, health, Sinovac, China |
| Country | Vaccine | |||||||
|---|---|---|---|---|---|---|---|---|
| Covaxin | Moderna | Pfizer | Sinopharm | |||||
| Mean | Tweets | Moderna | Tweets | Pfizer | Tweets | Mean | Tweets | |
| India | 0.0046 | 24,313 | −0.0372 | 1228 | −0.0053 | 1028 | 0.0237 | 198 |
| USA | 0.0291 | 869 | −0.0007 | 4632 | 0.0045 | 1188 | −0.0164 | 53 |
| Canada | 0.1302 | 399 | 0.0104 | 2489 | 0.0401 | 1068 | 0.1659 | 34 |
| UK | 0.0076 | 392 | 0.0492 | 898 | 0.0007 | 740 | 0.0269 | 71 |
| China | 0.2107 | 09 | 0.0551 | 71 | −0.0530 | 38 | 0.0912 | 818 |
Publisher’s Note: MDPI stays neutral with regard to jurisdictional claims in published maps and institutional affiliations. |
© 2022 by the authors. Licensee MDPI, Basel, Switzerland. This article is an open access article distributed under the terms and conditions of the Creative Commons Attribution (CC BY) license (https://creativecommons.org/licenses/by/4.0/).
Share and Cite
Mushtaq, M.F.; Fareed, M.M.S.; Almutairi, M.; Ullah, S.; Ahmed, G.; Munir, K. Analyses of Public Attention and Sentiments towards Different COVID-19 Vaccines Using Data Mining Techniques. Vaccines 2022, 10, 661. https://0-doi-org.brum.beds.ac.uk/10.3390/vaccines10050661
Mushtaq MF, Fareed MMS, Almutairi M, Ullah S, Ahmed G, Munir K. Analyses of Public Attention and Sentiments towards Different COVID-19 Vaccines Using Data Mining Techniques. Vaccines. 2022; 10(5):661. https://0-doi-org.brum.beds.ac.uk/10.3390/vaccines10050661
Chicago/Turabian StyleMushtaq, Muhammad Faheem, Mian Muhammad Sadiq Fareed, Mubarak Almutairi, Saleem Ullah, Gulnaz Ahmed, and Kashif Munir. 2022. "Analyses of Public Attention and Sentiments towards Different COVID-19 Vaccines Using Data Mining Techniques" Vaccines 10, no. 5: 661. https://0-doi-org.brum.beds.ac.uk/10.3390/vaccines10050661