Inferring Numbers of Wild Poliovirus Excretors Using Quantitative Environmental Surveillance

 , , , , , and
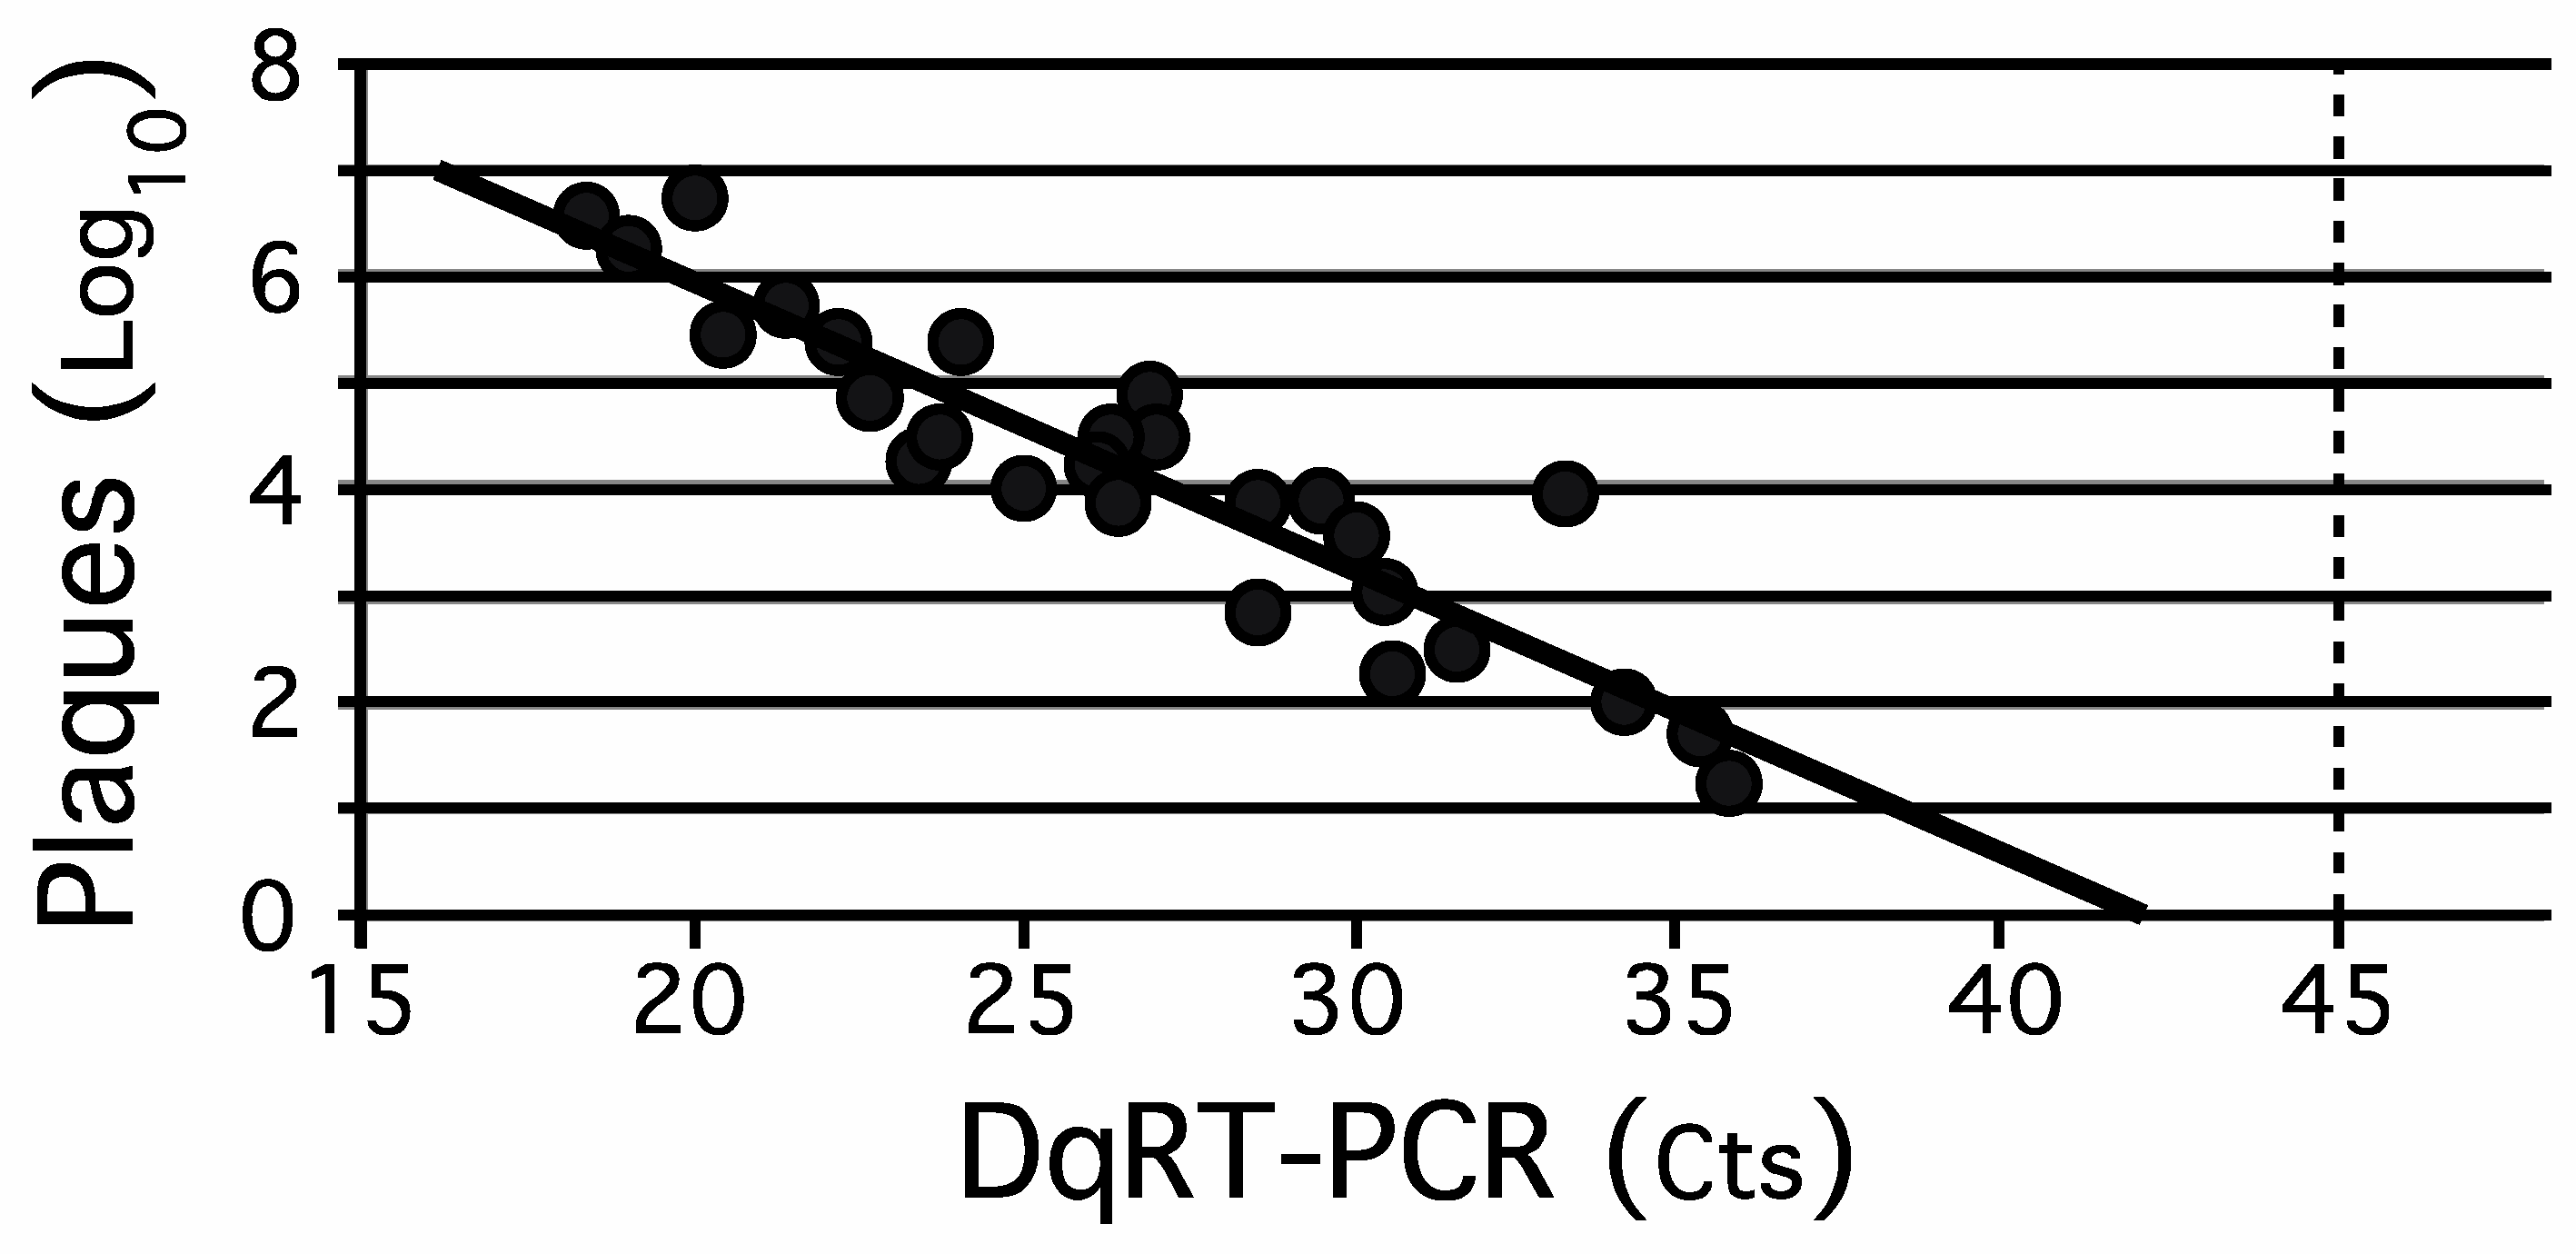
Abstract
:1. Introduction
2. Materials and Methods
2.1. Polioviruses
2.2. Polio Vaccination Status in Israel at the Times Studies Were Performed
2.3. EnvS Samples
2.3.1. Nomenclature
2.3.2. Collection
2.3.3. Sewage System Spiking/Recovery Experiments
2.4. Tissue Culture
2.5. Viral Assays
2.5.1. Tube Culture Assays
2.5.2. Plaque Assays
2.5.3. Immunofluorescence Assay (IFA) for Differentiation of Serotypes of Polioviruses
2.5.4. Molecular Assays
2.6. Statistical Analysis
2.7. Ethical Approval
3. Results
3.1. Comparison of Quantitative Tissue Culture-Based Plaque Assay Methods with Direct Quantitative RT-PCR (DqRT-PCR)
3.2. Spiking/Recovery of OPV Serotypes from a Sewage System
3.3. Inferring the Number of Infected Individuals in a Catchment Area from Quantitative Recovery of Virus from Sewage
3.4. Validating the Algorithm for Inferring the Number of Individuals Infected with OPV1
3.5. Calibrating the Algorithm for Inferring the Number of Excretors of OPV1
3.6. Inferring the Number of Asymptomatic Excretors of WPV1-SoAS during the 2013–2014 Outbreak in Israel
4. Discussion
4.1. Step 1. Comparison of Quantitative Assays for Poliovirus
4.2. Step 2. Identifying Measurable Factors That Impact on the Amount of Poliovirus That Can Be Recovered from an EnvS Sample
4.3. Step 3. Determining the Impact of Measurable Environmental Factors on Recovery of Polioviruses from EnvS Samples
4.4. Step 4. The Development, Evaluation, and Validation of a Model for Inferring the Number of Excretors from Direct EnvS Quantitative Poliovirus Assay Results
5. Conclusions
Supplementary Materials
Author Contributions
Funding
Institutional Review Board Statement and Informed Consent Statement
Data Availability Statement
Acknowledgments
Conflicts of Interest
References
- Marx, A.; Glass, J.D.; Sutter, R.W. Differential diagnosis of acute flaccid paralysis and its role in poliomyelitis surveillance. Epidemiol. Rev. 2000, 22, 298–316. [Google Scholar] [CrossRef] [PubMed] [Green Version]
- Racaniello, V.R.; Ren, R. Poliovirus biology and pathogenesis. Curr. Top. Microbiol. Immunol. 1996, 206, 305–325. [Google Scholar] [PubMed]
- Melnick, J.L. Current status of poliovirus infections. Clin. Microbiol. Rev. 1996, 9, 293–300. [Google Scholar] [CrossRef] [PubMed]
- Nathanson, N.; Kew, O.M. From emergence to eradication: The epidemiology of poliomyelitis deconstructed. Am. J. Epidemiol. 2010, 172, 1213–1229. [Google Scholar] [CrossRef]
- World Health Organization. Global Eradication of Poliomyelitis by the Year 2000. Resolution of the 41st World Health Assembly, WHA 41.28; World Health Organization: Geneva, Switzerland, 1988. [Google Scholar]
- Breman, J.G.; Arita, I. The confirmation and maintenance of smallpox eradication. N. Engl. J. Med. 1980, 303, 1263–1273. [Google Scholar] [CrossRef] [PubMed]
- Sutter, R.W.; Kew, O.M.; Cochi, S.L. Poliovirus vaccine—Live. In Vaccines, 5th ed.; Plotkin, S.A., Orenstein, W.A., Offit, P.A., Eds.; Saunders/Elsevier: Philadelphia, PA, USA, 2008; pp. 631–685. [Google Scholar]
- Plotkin, S.; Murdin, A.; Vidor, E. Inactivated Polio Vaccine. In Vaccines, 3rd ed.; Plotkin, S., Orenstein, W.A., Eds.; W.B. Saunders Company: Philadelphia, PA, USA, 1999; pp. 345–363. [Google Scholar]
- Shulman, L.M. Polio and Its Epidemiology. In Encyclopedia of Sustainability Science and Technology Volume Infectious Diseases; Meyers, R.A., Ed.; Springer: New York, NY, USA, 2020; pp. 1–73. [Google Scholar]
- World Health Organization. Polio Laboratory Manual, 4th ed.; WHO/IVB/04.10 WHO; World Health Organization: Geneva, Switzerland, 2004. [Google Scholar]
- Alexander, J.P., Jr.; Gary, H.E., Jr.; Pallansch, M.A. Duration of poliovirus excretion and its implications for acute flaccid paralysis surveillance: A review of the literature. J. Infect. Dis. 1997, 175 (Suppl. 1), S176–S182. [Google Scholar] [CrossRef] [PubMed] [Green Version]
- Dowdle, W.R.; De Gourville, E.; Kew, O.M.; Pallansch, M.A.; Wood, D.J. Polio eradication: The OPV paradox. Rev. Med. Virol. 2003, 13, 277–291. [Google Scholar] [CrossRef]
- Fine, P.E.; Carneiro, I.A. Transmissibility and persistence of oral polio vaccine viruses: Implications for the global poliomyelitis eradication initiative. Am. J. Epidemiol. 1999, 150, 1001–1021. [Google Scholar] [CrossRef] [Green Version]
- Chumakov, K.; Ehrenfeld, E.; Agol, V.I.; Wimmer, E. Polio eradication at the crossroads. Lancet Glob. Health 2021. [Google Scholar] [CrossRef]
- Berchenko, Y.; Manor, Y.; Freedman, L.S.; Kaliner, E.; Grotto, I.; Mendelson, E.; Huppert, A. Estimation of polio infection prevalence from environmental surveillance data. Sci. Transl. Med. 2017, 9, eaaf6786. [Google Scholar] [CrossRef] [PubMed]
- Mbaeyi, C.; Ryan, M.J.; Smith, P.; Mahamud, A.; Farag, N.; Haithami, S.; Sharaf, M.; Jorba, J.C.; Ehrhardt, D. Response to a Large Polio Outbreak in a Setting of Conflict—Middle East, 2013–2015. MMWR Morb. Mortal Wkly. Rep. 2017, 66, 227–231. [Google Scholar] [CrossRef] [Green Version]
- Kaliner, E.; Kopel, E.; Anis, E.; Mendelson, E.; Moran-Gilad, J.; Shulman, L.M.; Singer, S.R.; Manor, Y.; Somekh, E.; Rishpon, S.; et al. The Israeli public health response to wild poliovirus importation. Lancet Infect. Dis. 2015, 15, 1236–1242. [Google Scholar] [CrossRef]
- Swartz, T.A. The Epidemiology of Polio in Israel An Historical Perspective; Dyonon Publishing Ltd.: Tel Aviv, Israel, 2008. [Google Scholar]
- Hovi, T.; Shulman, L.M.; van der Avoort, H.; Deshpande, J.; Roivainen, M.; Gourville, E.M.D.E. Role of environmental poliovirus surveillance in global polio eradication and beyond. Epidemiol. Infect. 2012, 140, 1–13. [Google Scholar] [CrossRef] [Green Version]
- Shulman, L.M.; Manor, Y.; Sofer, D.; Mendelson, E. Bioterrorism and Surveillance for Infectious Diseases—Lessons from Poliovirus and Enteric Virus Surveillance. J. Bioterr. Biodef. 2012, S4, 004. [Google Scholar] [CrossRef] [Green Version]
- Shulman, L.M.; Mendelson, E.; Anis, E.; Bassal, R.; Gdalevich, M.; Hindiyeh, M.; Kaliner, E.; Kopel, E.; Manor, Y.; Moran-Gilad, J.; et al. Laboratory challenges in response to silent introduction and sustained transmission of wild poliovirus type 1 in Israel during 2013. J. Infect. Dis. 2014, 210 (Suppl. 1), S304–S314. [Google Scholar] [CrossRef]
- Shulman, L.M.; Manor, Y.; Sofer, D.; Handsher, R.; Swartz, T.; Delpeyroux, F.; Mendelson, E. Neurovirulent vaccine-derived polioviruses in sewage from highly immune populations. PLoS ONE 2006, 1, e69. [Google Scholar] [CrossRef] [PubMed] [Green Version]
- World Health Organization. Poliomyelitis Fact Sheet. 2016. Available online: http://www.who.int/mediacentre/factsheets/fs114/en/ (accessed on 31 July 2021).
- World Health Organization. Polio Global Eradication Initiative WHO. 2018. Available online: http://polioeradication.org/polio-today/polio-now/this-week/ (accessed on 9 February 2019).
- Kew, O.M.; Cochi, S.L.; Jafari, H.S.; Wassilak, S.G.F.; Mast, E.E.; Diop, O.M.; Tangermann, R.H.; Armstrong, G.L. Possible Eradication of Wild Poliovirus Type 3—Worldwide, 2012. MMWR Morb. Mortal. Wkly. Rep. 2014, 63, 1031–1033. [Google Scholar] [PubMed]
- Global Polio Eradication Initiative. Global Eradication of Wild Poliovirus Type 2 Declared. 2015. Available online: http://www.polioeradication.org/mediaroom/newsstories/Global-eradication-of-wild-poliovirus-type-2-declared/tabid/526/news/1289/Default.aspx (accessed on 31 July 2021).
- Centers for Disease Control and Prevention. Global Certification of Eradication of Indigenous Wild Poliovirus Type 3. 2019. Available online: https://www.cdc.gov/globalhealth/immunization/stories/global-certification-of-eradication-of-indigenous-wild-poliovirus-type-3.html (accessed on 31 July 2021).
- World Health Organization. Two Out of Three Wild Poliovirus Strains Eradicated. Global Eradication of Wild Poliovirus Type 3 Declared on World Polio Day. 2019. Available online: https://www.who.int/news-room/feature-stories/detail/two-out-of-three-wild-poliovirus-strains-eradicated (accessed on 31 July 2021).
- Global Polio Eradication Initiative. Public Health Emergency Status. IHR Public Health Emergency of International Concern—Temporary Recommendations to Reduce International Spread of Poliovirus. 2021. Available online: https://polioeradication.org/polio-today/polio-now/public-health-emergency-status/ (accessed on 31 July 2021).
- Jorba, J.; Diop, O.M.; Iber, J.; Henderson, E.; Zhao, K.; Sutter, R.W.; Wassilak, S.G.F.; Burns, C.C. Update on Vaccine-Derived Polioviruses—Worldwide, January 2017–June 2018. MMWR Morb. Mortal. Wkly. Rep. 2018, 67, 1189–1194. [Google Scholar] [CrossRef] [Green Version]
- Moran-Gilad, J.; Mendelson, E.; Burns, C.C.; Bassal, R.; Gdalevich, M.; Sofer, D.; Oberste, M.S.; Shulman, L.M.; Kaliner, E.; Hindiye, M.; et al. Field study of fecal excretion as a decision support tool in response to silent reintroduction of wild-type poliovirus 1 into Israel. J. Clin. Virol. 2015, 66, 51–55. [Google Scholar] [CrossRef] [PubMed]
- Tucker, D.M.; Sandstead, H.H.; Logan, G.M.; Klevay, L.M., Jr.; Mahalko, J.; Johnson, L.K.; Inman, L.; Inglett, G.E. Dietary fiber and personality factors as determinants of stool output. Gastroenterology 1981, 81, 879–883. [Google Scholar] [CrossRef]
- Shulman, L.M.; Manor, Y.; Hindiyeh, M.; Sofer, D.; Mendelson, E. Molecular Characterization of Polio from Environmental Samples: ISSP, The Israeli Sewage Surveillance Protocol. Methods Mol. Biol. 2016, 1387, 55–107. [Google Scholar] [PubMed]
- Swartz, T.A.; Green, M.S.; Handscher, R.; Sofer, D.; Cohen-Dar, M.; Shohat, T.; Habib, S.; Barak, E.; Dror, Z.; Somekh, E.; et al. Intestinal immunity following a combined enhanced inactivated polio vaccine/oral polio vaccine programme in Israel. Vaccine 2008, 26, 1083–1090. [Google Scholar] [CrossRef] [PubMed]
- World Health Organization. WHO Global Action Plan to Minimize Poliovirus Facility-Associated Risk after Type-Specific Eradication of Wild Polioviruses and Sequential Cessation of Oral Polio Vaccine Use (GAPIII). 2015. Available online: https://apps.who.int›WHO_POLIO_15.05_eng.pdf (accessed on 31 July 2021).
- Whittle, H.; Hazlett, D.; Wood, D.; Bell, E. Immunofluorescence technique for the identification of polioviruses. Lancet 1992, 339, 429–430. [Google Scholar] [CrossRef]
- Hindiyeh, M.Y.; Moran-Gilad, J.; Manor, Y.; Ram, D.; Shulman, L.M.; Sofer, D.; Mendelson, E. Development and Validation of a Quantitative RT-PCR Assay for Investigation of Wild Type Poliovirus 1 (SOAS) Reintroduced into Israel. Euro Surveill 2014, 19, 20710. [Google Scholar]
- Ranta, J.; Hovi, T.; Arjas, E. Poliovirus surveillance by examining sewage water specimens: Studies on detection probability using simulation models. Risk Anal. 2001, 21, 1087–1096. [Google Scholar] [CrossRef]
- World Health Organization. Guidelines on Environmental Surveillance for Detection of Polioviruses Working Draft—March 2015 WHO, Dept of Vaccines and Biologicals. Available online: http://polioeradication.org/wp-content/uploads/2016/07/GPLN_GuidelinesES_April2015.pdf. (accessed on 31 July 2021).
- Kilpatrick, D.R.; Ching, K.; Iber, J.; Campagnoli, R.; Freeman, C.J.; Mishrik, N.; Liu, H.M.; Pallansch, M.A.; Kew, O.M. Multiplex PCR method for identifying recombinant vaccine-related polioviruses. J. Clin. Microbiol. 2004, 42, 4313–4315. [Google Scholar] [CrossRef] [PubMed] [Green Version]
- Kilpatrick, D.R.; Ching, K.; Iber, J.; Chen, Q.; Yang, S.J.; De, L.; Williams, A.J.; Mandelbaum, M.; Sun, H.; Oberste, M.S.; et al. Identification of vaccine-derived polioviruses using dual-stage real-time RT-PCR. J. Virol. Methods 2014, 197, 25–28. [Google Scholar] [CrossRef]
- Kilpatrick, D.R.; Nottay, B.; Yang, C.F.; Yang, S.J.; Da Silva, E.; Penaranda, S.; Pallansch, M.; Kew, O. Serotype-specific identification of polioviruses by PCR using primers containing mixed-base or deoxyinosine residues at positions of codon degeneracy. J. Clin. Microbiol. 1998, 36, 352–357. [Google Scholar] [CrossRef] [Green Version]
- World Health Organization. Guidelines for Environmental Surveillance of Poliovirus Circulation: WHO, Dept of Vaccines and Biologicals. 2003. Available online: http://apps.who.int/iris/handle/10665/67854 (accessed on 23 July 2014).
- Manor, Y.; Handsher, R.; Halmut, T.; Neuman, M.; Bobrov, A.; Rudich, H.; Vonsover, A.; Shulman, L.; Kew, O.; Mendelson, E. Detection of poliovirus circulation by environmental surveillance in the absence of clinical cases in Israel and the Palestinian authority. J. Clin. Microbiol. 1999, 37, 1670–1675. [Google Scholar] [CrossRef] [Green Version]
- Hovi, T.; Stenvik, M.; Partanen, H.; Kangas, A. Poliovirus surveillance by examining sewage specimens. Quantitative recovery of virus after introduction into sewerage at remote upstream location. Epidemiol. Infect. 2001, 127, 101–106. [Google Scholar] [CrossRef] [PubMed]
- Lodder, W.J.; Buisman, A.M.; Rutjes, S.A.; Heijne, J.C.; Teunis, P.F.; de Roda Husman, A.M. Feasibility of quantitative environmental surveillance in poliovirus eradication strategies. Appl. Environ. Microbiol. 2012, 78, 3800–3805. [Google Scholar] [CrossRef] [PubMed] [Green Version]
- Brouwer, A.F.; Eisenberg, J.N.S.; Pomeroy, C.D.; Shulman, L.M.; Hindiyeh, M.; Manor, Y.; Grotto, I.; Koopman, J.S.; Eisenberg, M.C. Epidemiology of the silent polio outbreak in Rahat, Israel, based on modeling of environmental surveillance data. Proc. Natl. Acad. Sci. USA 2018, 115, E10625–E10633. [Google Scholar] [CrossRef] [PubMed] [Green Version]
- Schade, J.P. Constepation. In the Complete Encyclopedia of Medicine & Health; Schade, J.P., Ed.; Foreign Media Books: Franklin Park, NJ, USA, 2006; pp. 280–281. [Google Scholar]
- Meade, M. Digestion. Available online: http://mmeade.com/cheat/digestion.html (accessed on 31 July 2021).
- Greenberger, N.J. Diarrhea. In the MERCK Manual of Diagnosis and Therapy, Professional Version; Porter, R.S., Kaplan, J.L., Eds.; Merck Sharp & Dohme Corp: Kenilworth, NJ, USA, 2011; Available online: http://www.merckmanuals.com/professional/gastrointestinal-disorders/symptoms-of-gi-disorders/diarrhea (accessed on 31 July 2021).
- Teitelbaum, D.H.; Btaiche, I.C.; Coran, A.G. Nutritional Support in the Pediatric Surgical Patient. In Pediatric Surgery E-Book, 7th ed.; Coran, A.G.S.A.N., Krummel, T.M., Laberge, J.-M., Shamberger, R.C., Caldamone, A.A., Eds.; Elsevier Health Sciences: Philadelphia, PA, USA, 2012; pp. 179–200. [Google Scholar]
- Schiller, L.R.; Sellin, J.H. Diarrhea. In Sleisenger & Fordtran’s Gastrointestinal and Liver Disease: Pathophysiology/Diagnosis/Management, 7th ed.; Feldman, M., Friedman, L.S., Sleisenger, M.H., Eds.; Elsevier Health Sciences: Philadelphia, PA, USA, 2002; pp. 131–155. [Google Scholar]
- Yaari, R.; Kaliner, E.; Grotto, I.; Katriel, G.; Moran-Gilad, J.; Sofer, D.; Mendelson, E.; Miller, E.; Huppert, A.; Anis, E.; et al. Modeling the spread of polio in an IPV-vaccinated population: Lessons learned from the 2013 silent outbreak in southern Israel. BMC Med. 2016, 14, 95. [Google Scholar]
- Leung, W.K.; To, K.F.; Chan, P.K.; Chan, H.L.; Wu, A.K.; Lee, N.; Yuen, K.Y.; Sung, J.J. Enteric involvement of severe acute respiratory syndrome-associated coronavirus infection. Gastroenterology 2003, 125, 1011–1017. [Google Scholar] [CrossRef] [Green Version]
- Corman, V.M.; Albarrak, A.M.; Omrani, A.S.; Albarrak, M.M.; Farah, M.E.; Almasri, M.; Muth, D.; Sieberg, A.; Meyer, B.; Assiri, A.M.; et al. Viral Shedding and Antibody Response in 37 Patients With Middle East Respiratory Syndrome Coronavirus Infection. Clin. Infect. Dis. 2016, 62, 477–483. [Google Scholar] [CrossRef] [Green Version]
- Xiao, F.; Tang, M.; Zheng, X.; Liu, Y.; Li, X.; Shan, H. Evidence for Gastrointestinal Infection of SARS-CoV-2. Gastroenterology 2020, 158, 1831–1833.e3. [Google Scholar] [CrossRef]
- Xu, Y.; Li, X.; Zhu, B.; Liang, H.; Fang, C.; Gong, Y.; Guo, Q.; Sun, X.; Zhao, D.; Shen, J.; et al. Characteristics of pediatric SARS-CoV-2 infection and potential evidence for persistent fecal viral shedding. Nat. Med. 2020, 26, 502–505. [Google Scholar] [CrossRef] [Green Version]
- Li, X.; Zhang, S.; Shi, J.; Luby, S.P.; Jiang, G. Uncertainties in estimating SARS-CoV-2 prevalence by wastewater-based epidemiology. Chem. Eng. J. 2021, 415, 129039. [Google Scholar] [CrossRef]
- Rački, N.; Morisset, D.; Gutierrez-Aguirre, I.; Ravnikar, M. One-step RT-droplet digital PCR: A breakthrough in the quantification of waterborne RNA viruses. Anal. Bioanal. Chem. 2014, 406, 661. [Google Scholar] [CrossRef] [Green Version]
- Pavsic, J.; Zel, J.; Milavec, M. Assessment of the real-time PCR and different digital PCR platforms for DNA quantification. Anal. Bioanal. Chem. 2016, 408, 107–121. [Google Scholar] [CrossRef] [Green Version]
- McGonigle, D.; Bennett, A.; Callaghan, K.; Dancer, S.; Gormley, M.; Graham, D.W.; Hart, A.; Jones, D.L.; Kay, D.; Keevil, B.; et al. Transmission of COVID-19 In the Wider Environment Group (TWEG), Reporting to UK Scientific Advisory Group for Emergencies; SAGE: London, UK, 2020. Available online: https://www.gov.uk/government/publications/tweg-environmental-monitoring-of-viral-presence-infectivity-and-transmission-of-sars-cov-2-3-december-2020 (accessed on 31 July 2021).
- Ahmed, W.; Payyappat, S.; Cassidy, M.; Harrison, N.; Besley, C. Interlaboratory accuracy and precision among results of three sewage-associated marker genes in urban environmental estuarine waters and freshwater streams. Sci. Total Environ. 2020, 741, 140071. [Google Scholar] [CrossRef] [PubMed]
- Chik, A.H.S.; Glier, M.B.; Servos, M.; Mangat, C.S.; Pang, X.-L.; Qiu, Y.; D’Aoust, P.M.; Burnet, J.-B.; Delatolla, R.; Dorner, S.; et al. Comparison of approaches to quantify SARS-CoV-2 in wastewater using RT-qPCR: Results and implications from a collaborative inter-laboratory study in Canada. J. Environ. Sci. 2021, 107, 218–229. [Google Scholar] [CrossRef]
- Matrajt, G.; Naughton, B.; Bandyopadhyay, A.S.; Meschke, J.S. A Review of the Most Commonly Used Methods for Sample Collection in Environmental Surveillance of Poliovirus. Clin. Infect. Dis. 2018, 67 (Suppl. 1), S90–S97. [Google Scholar] [CrossRef] [Green Version]
- Fuschi, C.; Pu, H.; Negri, M.; Colwell, R.; Chen, J. Wastewater-Based Epidemiology for Managing the COVID-19 Pandemic. ACS ES&T Water 2021, 1, 1352–1362. [Google Scholar]
- Lu, D.; Huang, Z.; Luo, J.; Zhang, X.; Sha, S. Primary concentration—The critical step in implementing the wastewater based epidemiology for the COVID-19 pandemic: A mini-review. Sci. Total Environ. 2020, 747, 141245. [Google Scholar] [CrossRef] [PubMed]
- Hay, J.A.; Kennedy-Shaffer, L.; Kanjilal, S.; Lennon, N.J.; Gabriel, S.B.; Lipsitch, M.; Mina, M.J. Estimating epidemiologic dynamics from cross-sectional viral load distributions. Science 2021, 373, eabh0635. [Google Scholar] [CrossRef] [PubMed]


Publisher’s Note: MDPI stays neutral with regard to jurisdictional claims in published maps and institutional affiliations. |
© 2021 by the authors. Licensee MDPI, Basel, Switzerland. This article is an open access article distributed under the terms and conditions of the Creative Commons Attribution (CC BY) license (https://creativecommons.org/licenses/by/4.0/).
Share and Cite
Perepliotchikov, Y.; Ziv-Baran, T.; Hindiyeh, M.; Manor, Y.; Sofer, D.; Moran-Gilad, J.; Stephens, L.; Mendelson, E.; Weil, M.; Bassal, R.; et al. Inferring Numbers of Wild Poliovirus Excretors Using Quantitative Environmental Surveillance. Vaccines 2021, 9, 870. https://0-doi-org.brum.beds.ac.uk/10.3390/vaccines9080870
Perepliotchikov Y, Ziv-Baran T, Hindiyeh M, Manor Y, Sofer D, Moran-Gilad J, Stephens L, Mendelson E, Weil M, Bassal R, et al. Inferring Numbers of Wild Poliovirus Excretors Using Quantitative Environmental Surveillance. Vaccines. 2021; 9(8):870. https://0-doi-org.brum.beds.ac.uk/10.3390/vaccines9080870
Chicago/Turabian StylePerepliotchikov, Yuri, Tomer Ziv-Baran, Musa Hindiyeh, Yossi Manor, Danit Sofer, Jacob Moran-Gilad, Laura Stephens, Ella Mendelson, Merav Weil, Ravit Bassal, and et al. 2021. "Inferring Numbers of Wild Poliovirus Excretors Using Quantitative Environmental Surveillance" Vaccines 9, no. 8: 870. https://0-doi-org.brum.beds.ac.uk/10.3390/vaccines9080870