Tuning the Pore Structures of Organosilica Membranes for Enhanced Desalination Performance via the Control of Calcination Temperatures


Abstract
:1. Introduction
2. Experimental
2.1. Sol Synthesis
2.2. Membrane Preparation
2.3. Characterization
2.4. Membrane Performance
3. Results and Discussions
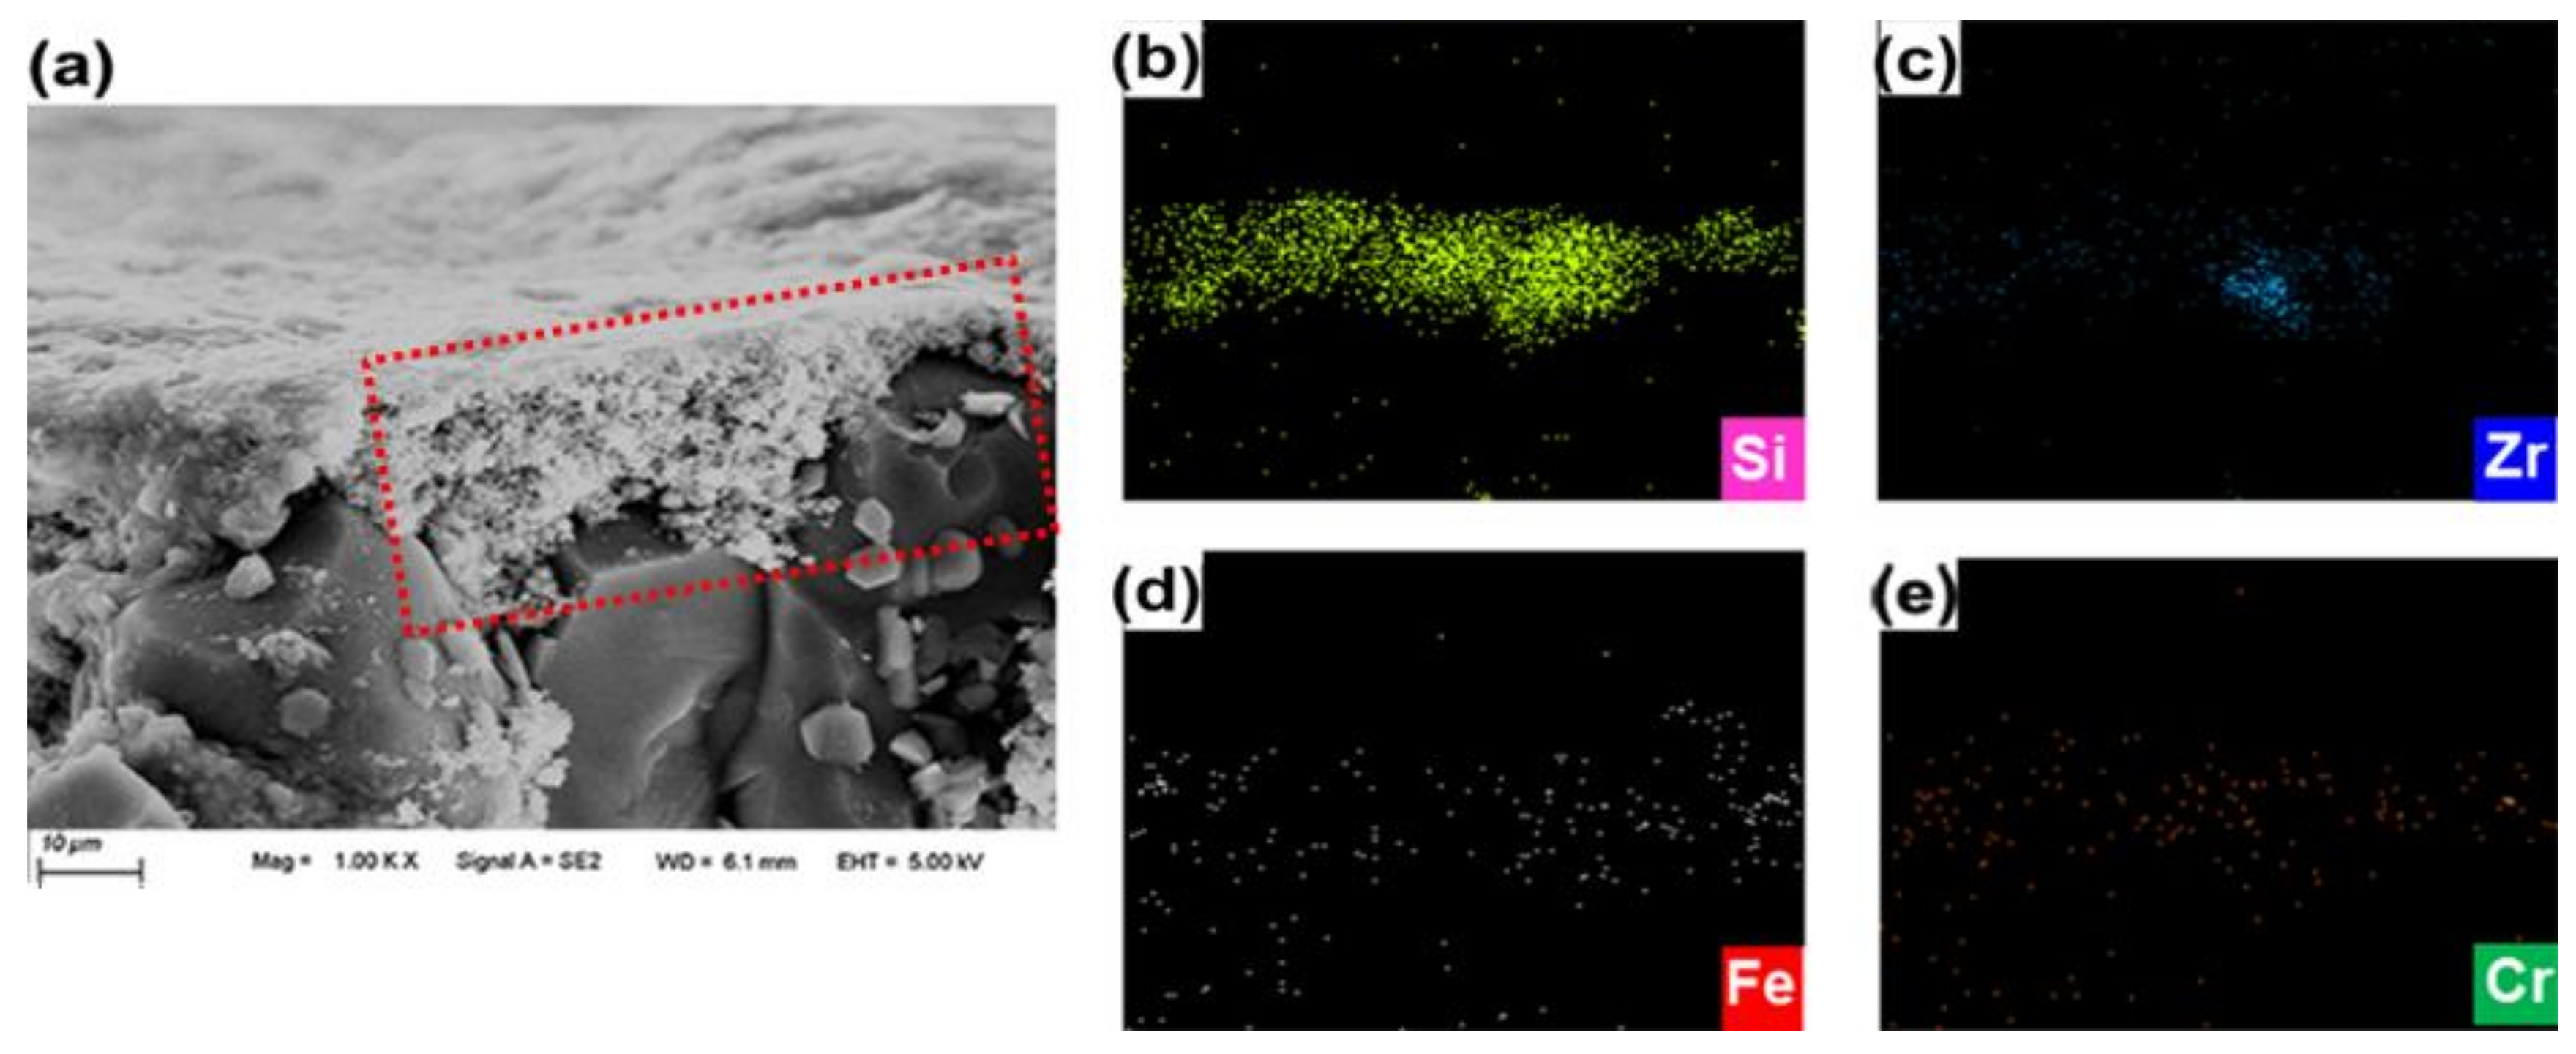
3.1. Characterization of the Membranes
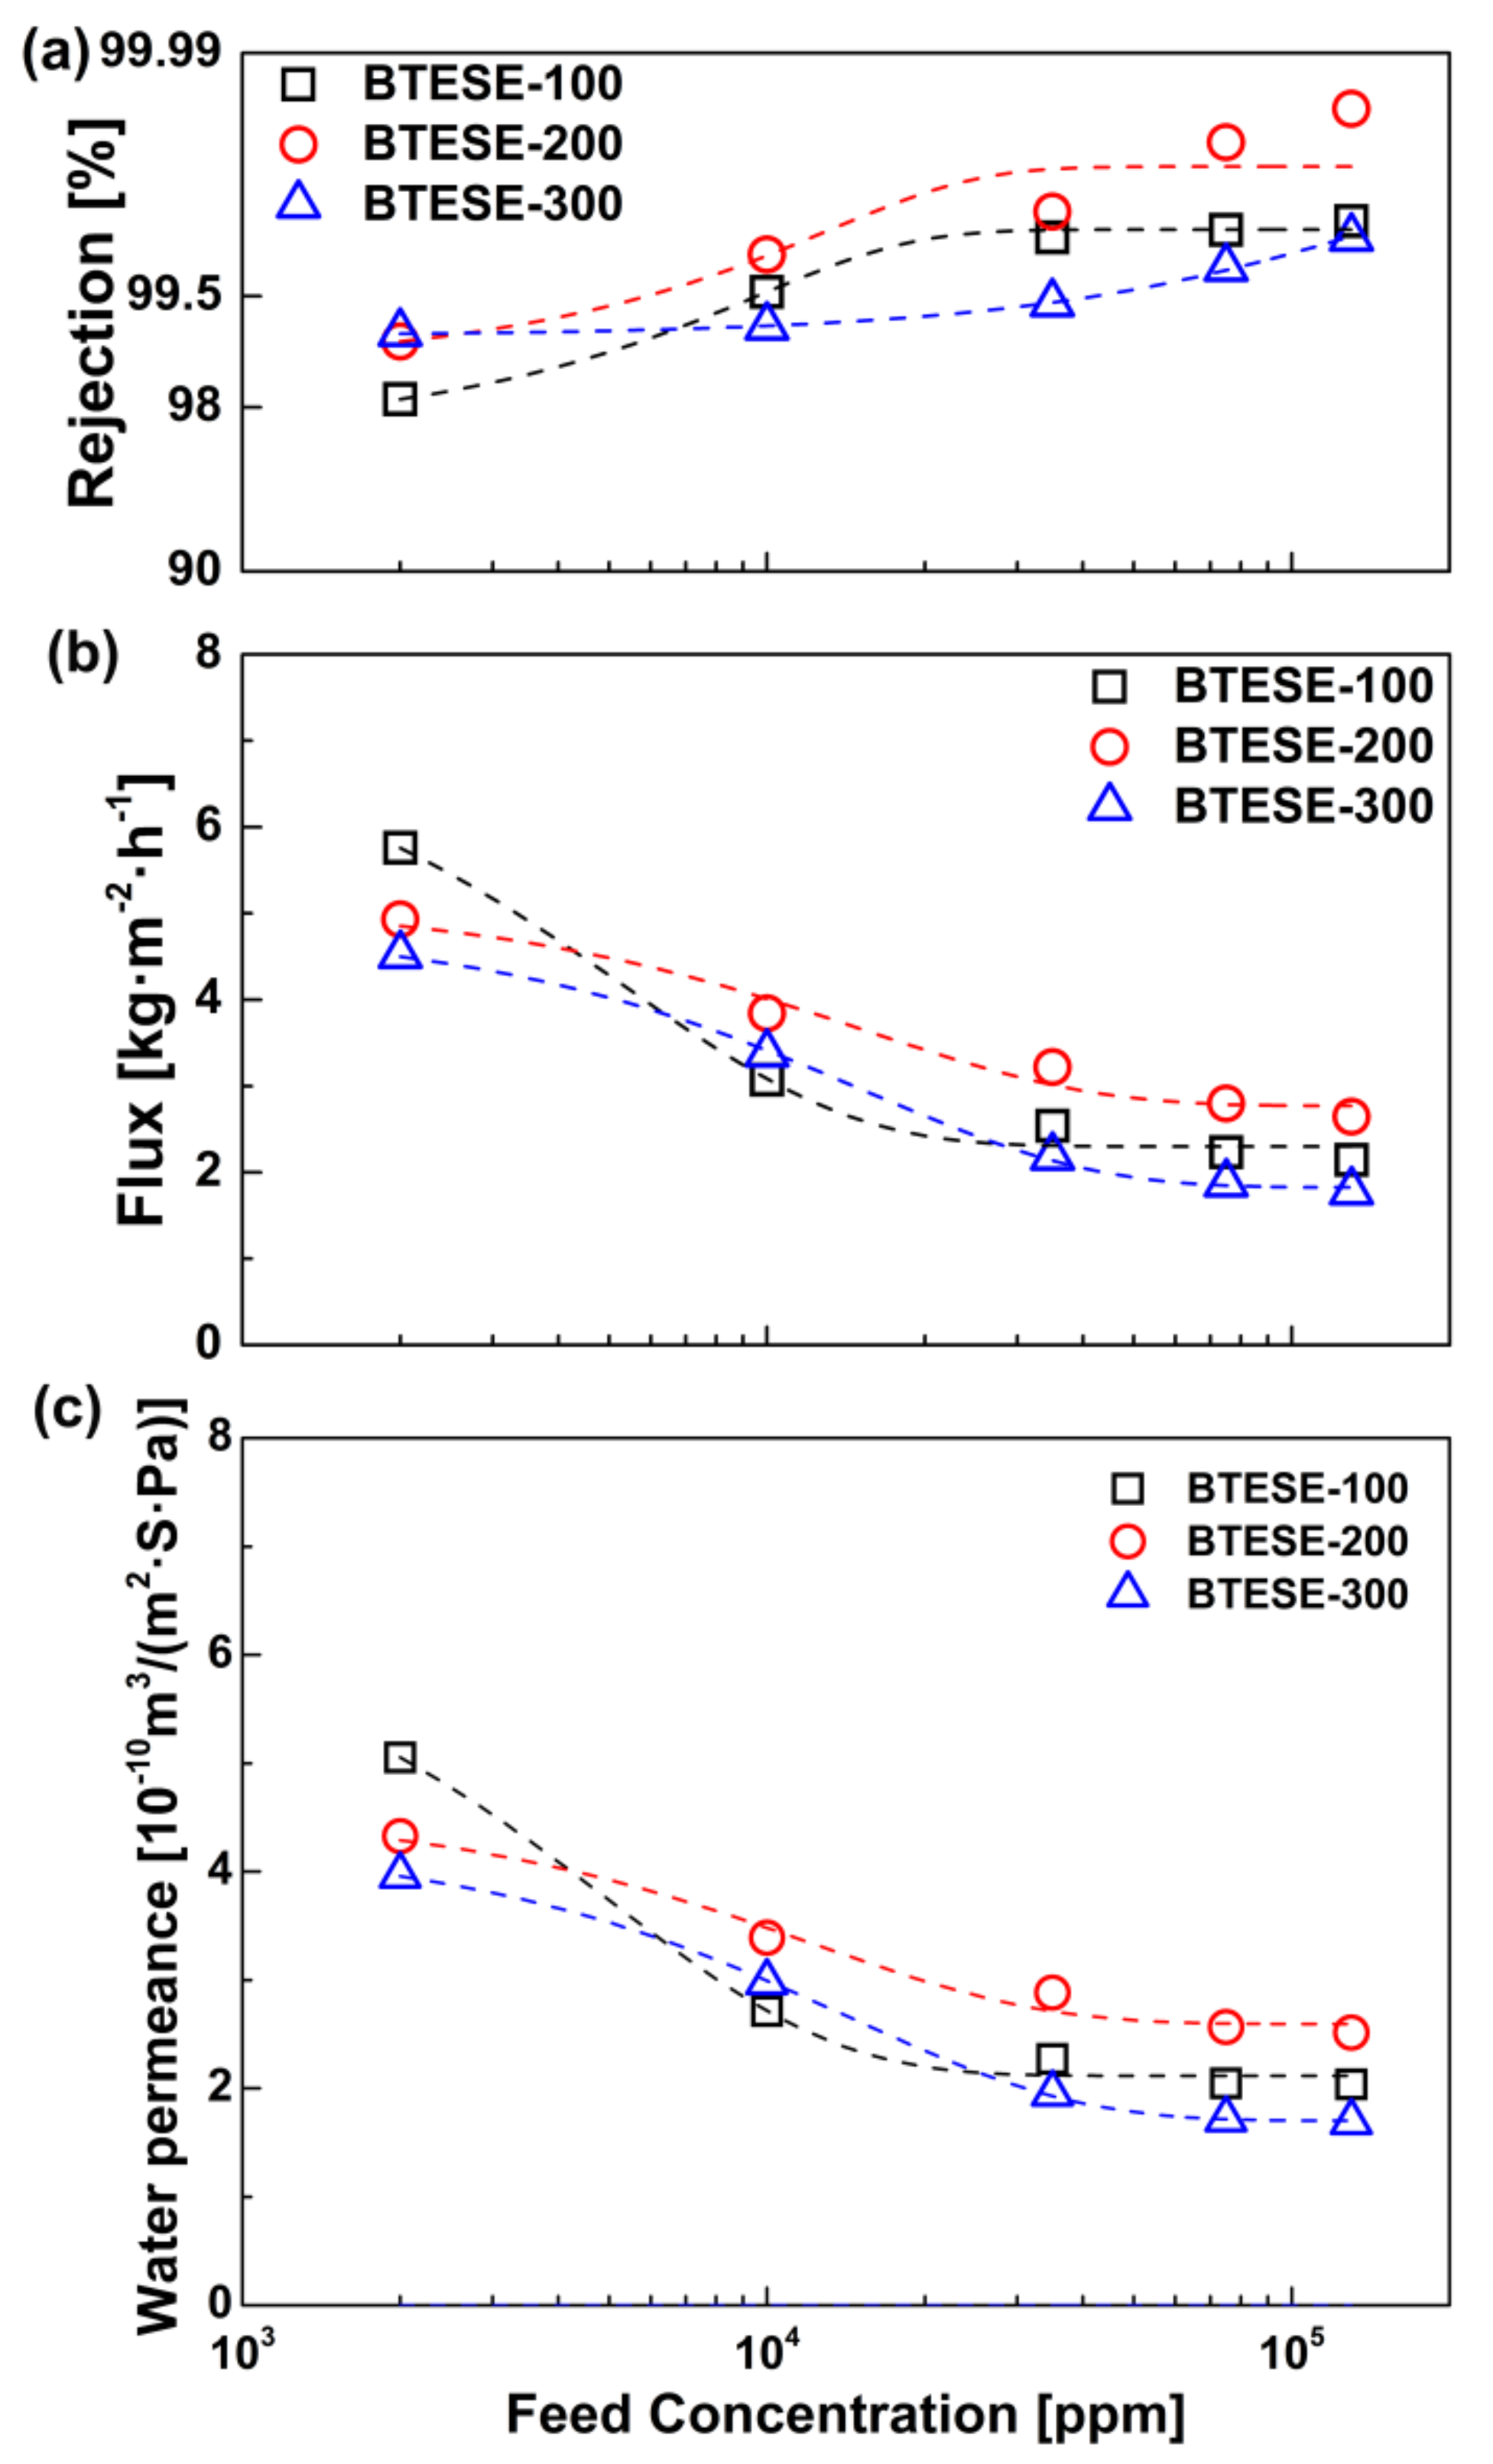
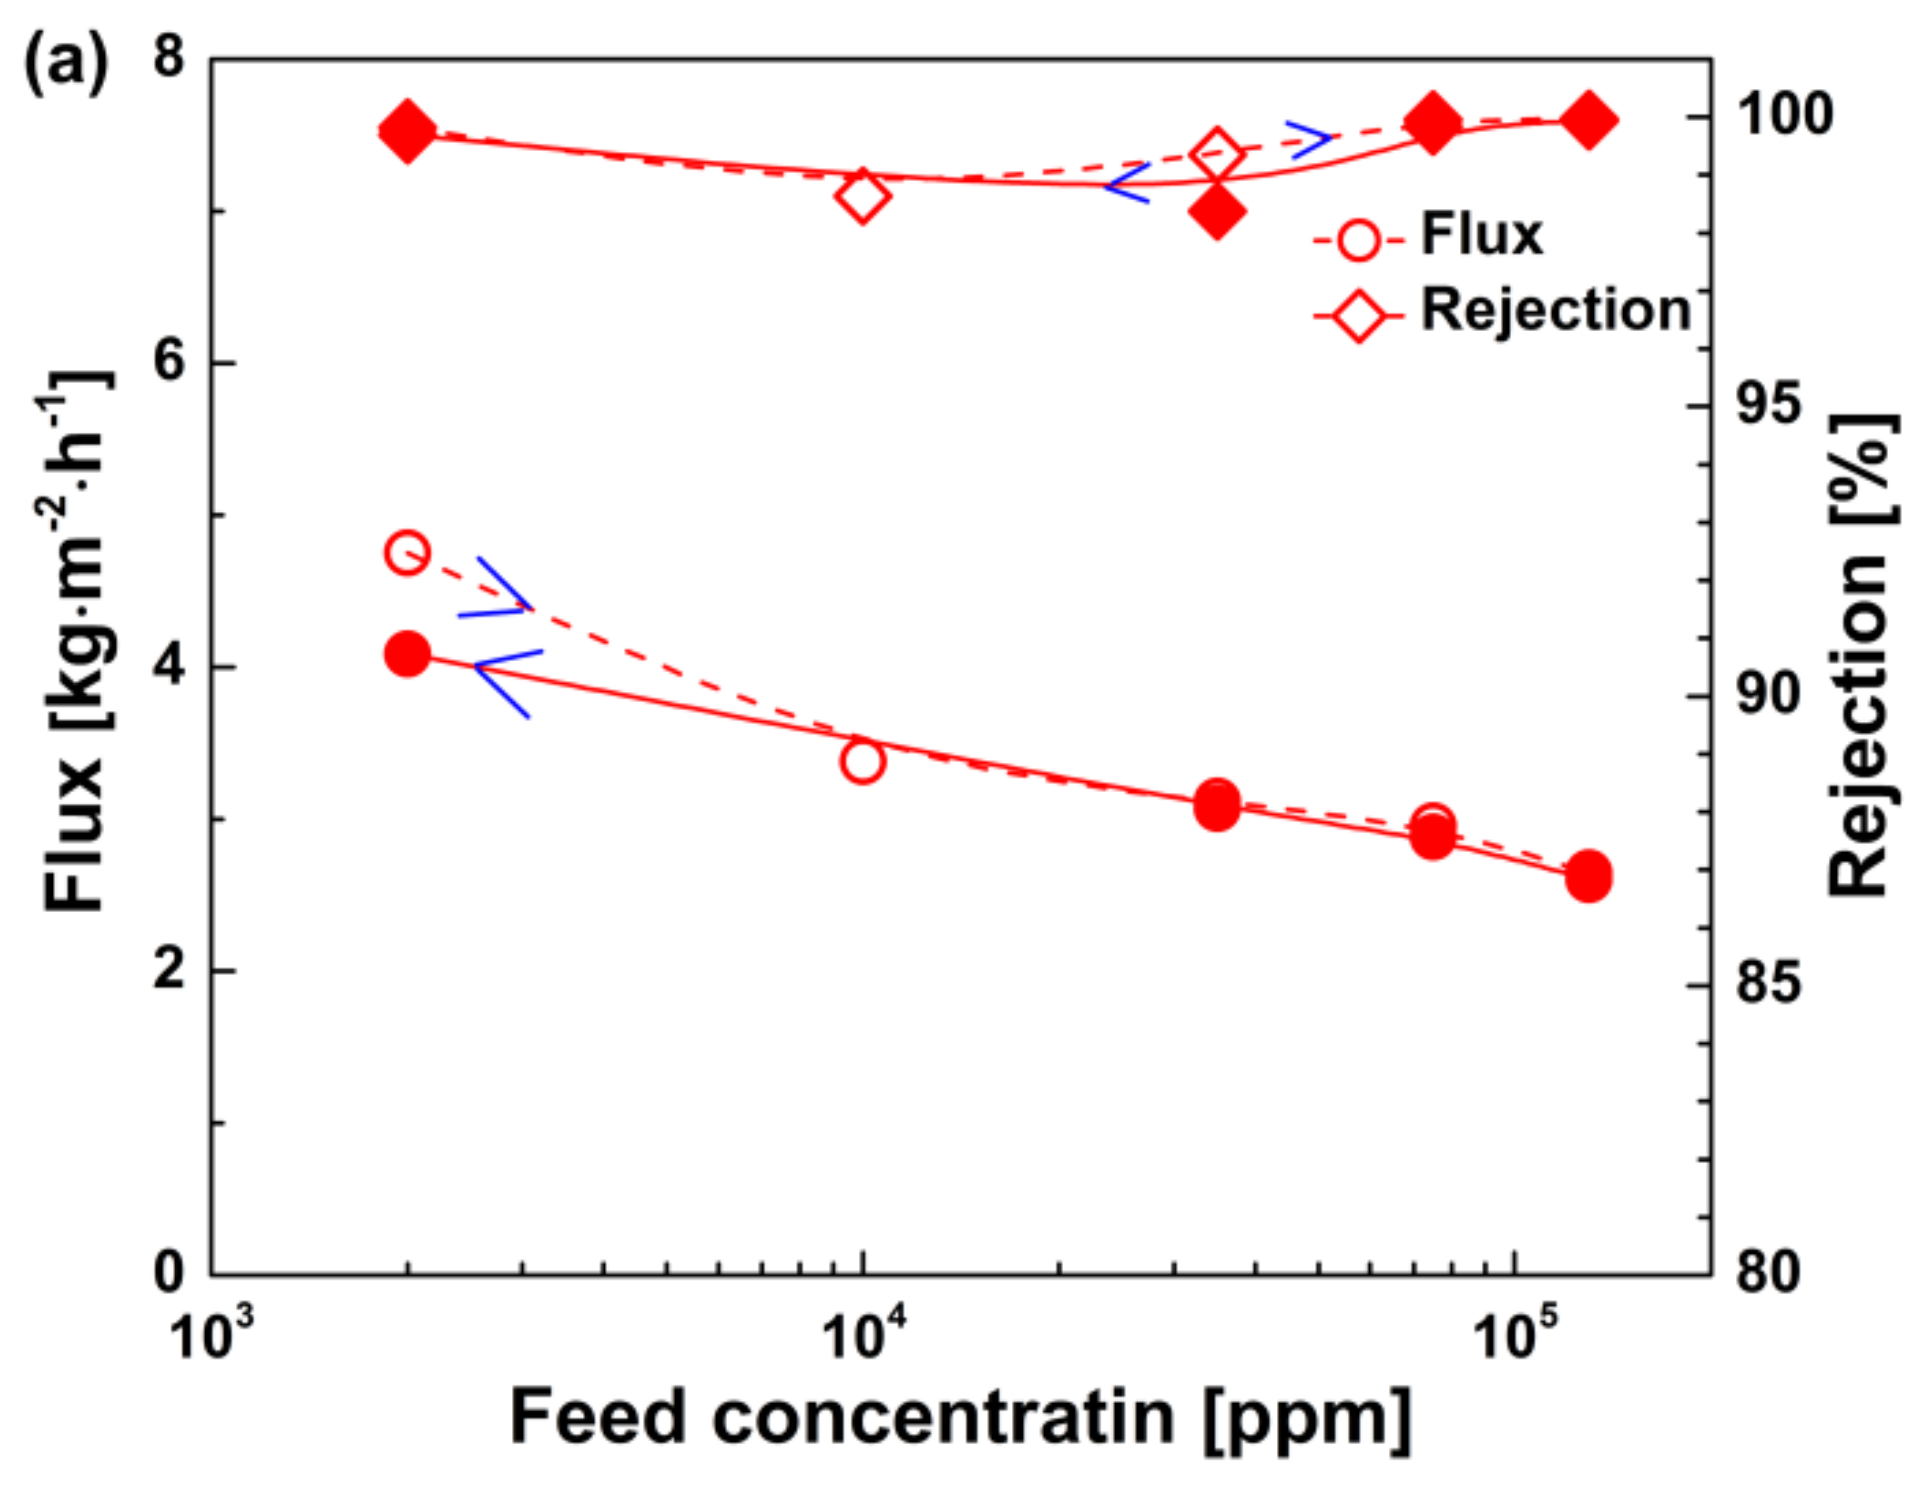
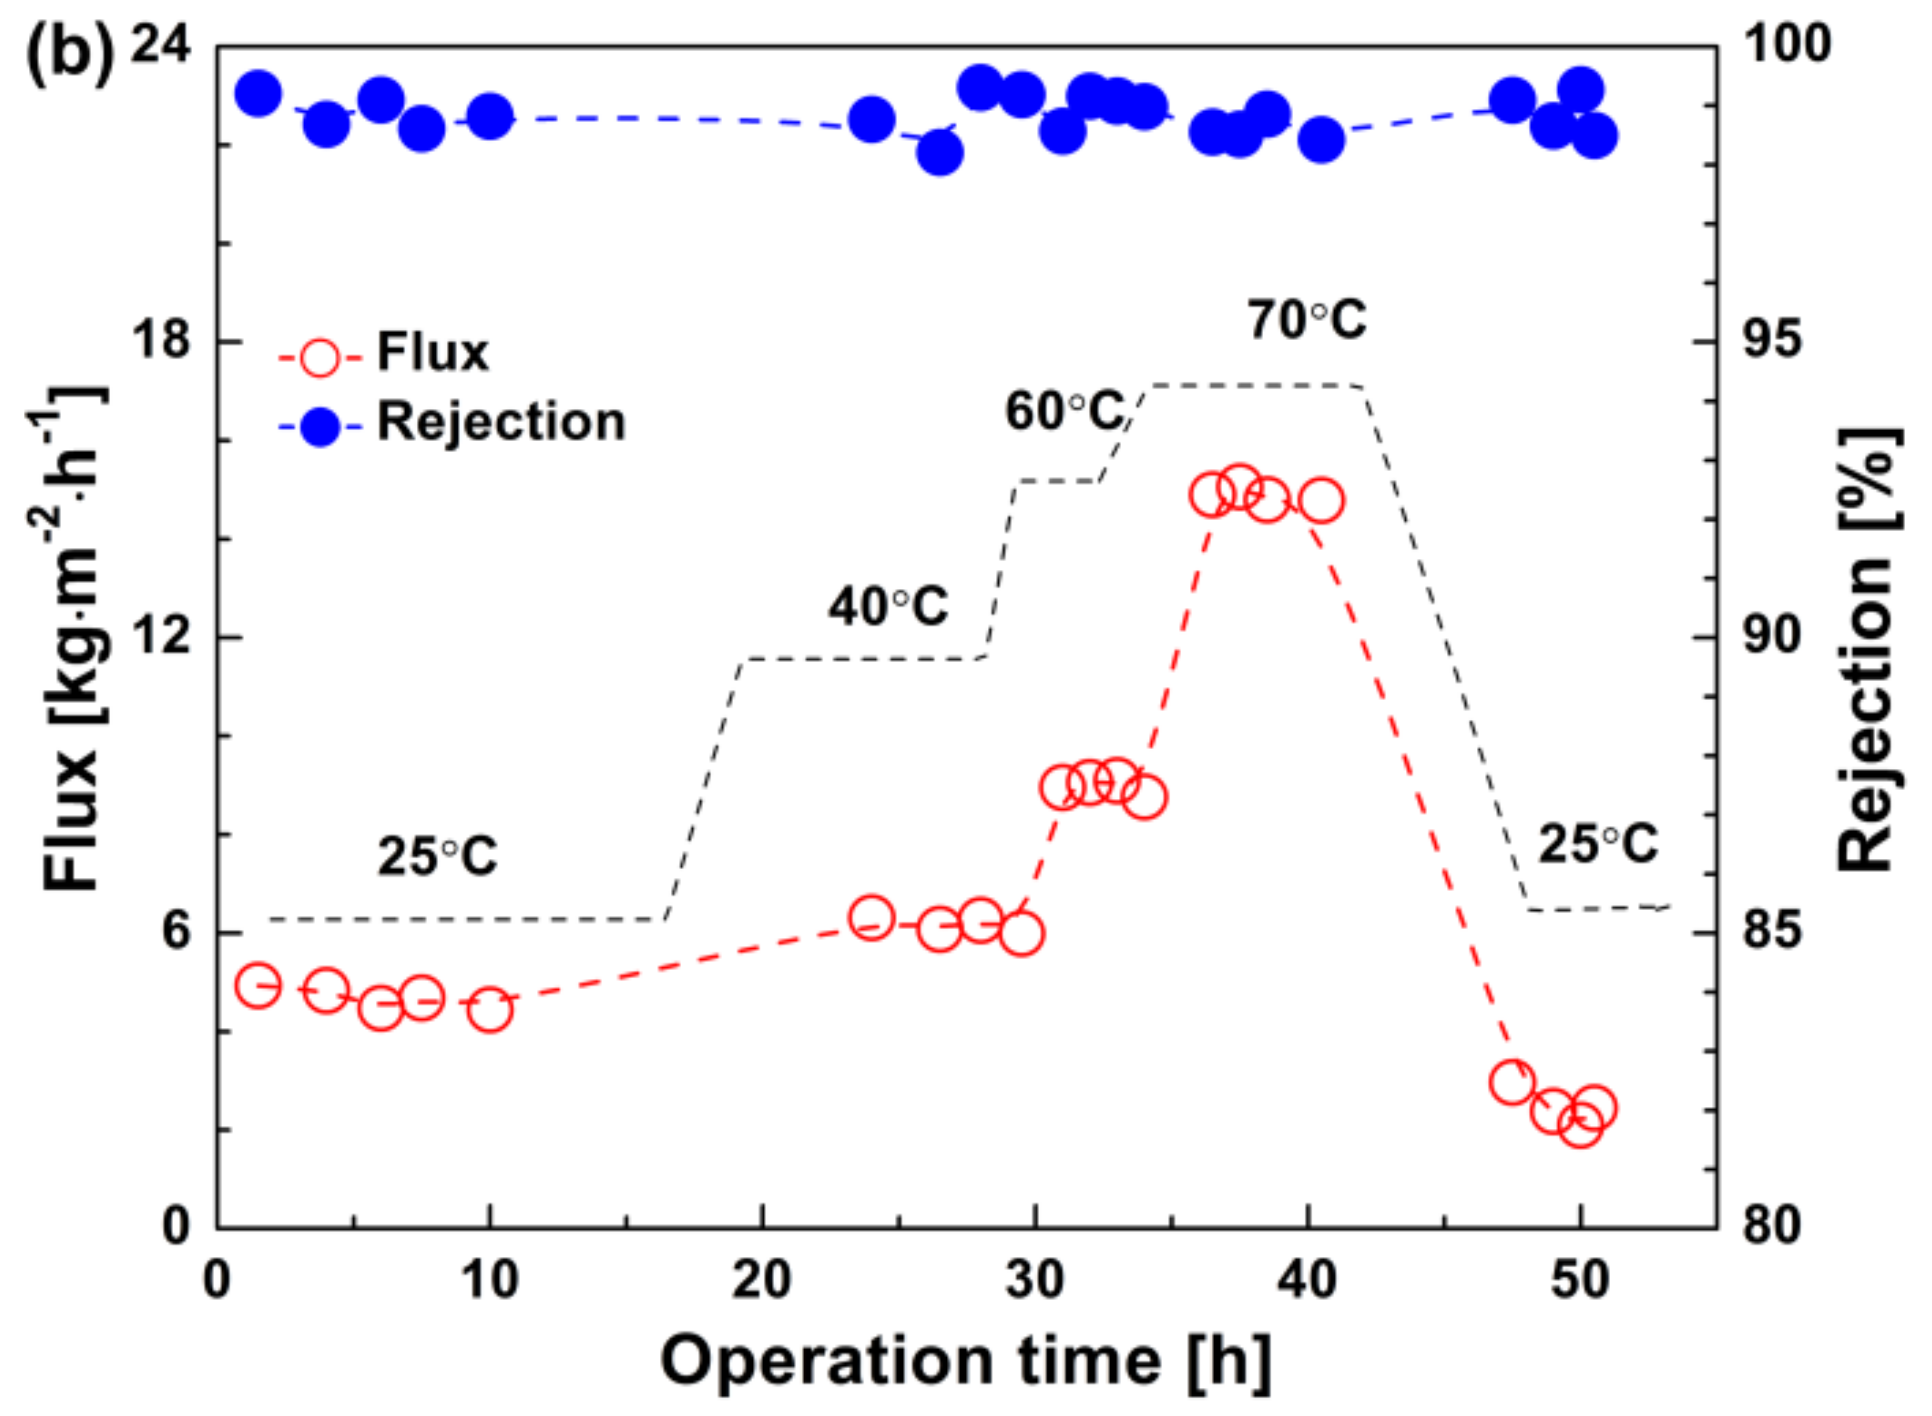
3.2. Pervaporation Performance for Desalination
4. Conclusions
Author Contributions
Funding
Acknowledgments
Conflicts of Interest
References
- Elimelech, M.; Phillip, W.A. The future of seawater desalination: Energy, technology, and the environment. Science 2011, 333, 712–717. [Google Scholar] [CrossRef] [PubMed]
- Greenlee, L.F.; Lawler, D.F.; Freeman, B.D.; Marrot, B.; Moulin, P. Reverse osmosis desalination: Water sources, technology, and today’s challenges. Water Res. 2009, 43, 2317–2348. [Google Scholar] [CrossRef] [PubMed]
- Mansouri, J.; Harrison, S.; Chen, V. Strategies for controlling biofouling in membrane filtration systems: Challenges and opportunities. J. Mater. Chem. 2010, 20, 4567–4586. [Google Scholar] [CrossRef]
- Lawson, K.W.; Lloyd, D.R. Membrane distillation. J. Membr. Sci. 1997, 124, 1–25. [Google Scholar] [CrossRef]
- Sadrzadeh, M.; Mohammadi, T. Sea water desalination using electrodialysis. Desalination 2008, 221, 440–447. [Google Scholar] [CrossRef]
- McCutcheon, J.R.; McGinnis, R.L.; Elimelech, M. A novel ammonia-carbon dioxide forward (direct) osmosis desalination process. Desalination 2005, 174, 1–11. [Google Scholar] [CrossRef]
- Feng, X.S.; Huang, R.Y.M. Liquid separation by membrane pervaporation: A review. Ind. Eng. Chem. Res. 1997, 36, 1048–1066. [Google Scholar] [CrossRef]
- Subramani, A.; Jacangelo, J.G. Emerging Desalination Technologies for Water Treatment: A Critical Review. Water Res. 2015, 75, 164–187. [Google Scholar] [CrossRef]
- Wang, Q.; Li, N.; Bolto, B.; Hoang, M.; Xie, Z. Desalination by pervaporation: A review. Desalination 2016, 387, 46–60. [Google Scholar] [CrossRef]
- Shaffer, D.L.; Chavez, L.H.A.; Ben-Sasson, M.; Romero-Vargas Castrillón, S.; Yip, N.Y.; Elimelech, M. Desalination and reuse of high-salinity shale gas produced water: Drivers, technologies, and future directions. Environ. Sci. Technol. 2013, 47, 9569–9583. [Google Scholar] [CrossRef]
- Kaminski, W.; Marszalek, J.; Tomczak, E. Water desalination by pervaporation—Comparison of energy consumption. Desalination 2018, 433, 89–93. [Google Scholar] [CrossRef]
- Xue, Y.L.; Huang, J.; Lau, C.H.; Cao, B.; Li, P. Tailoring the molecular structure of crosslinked polymers for pervaporation desalination. Nat. Commun. 2020, 11, 1461. [Google Scholar] [CrossRef] [Green Version]
- Song, Y.M.; Li, R.; Pan, F.S.; He, Z.; Yang, H.; Li, Y.; Yang, L.X.; Wang, M.D.; Wang, H.J.; Jiang, Z.Y. Ultrapermeable graphene oxide membranes with tunable interlayer distances via vein-like supramolecular dendrimers. J. Mater. Chem. A 2019, 7, 18642–18652. [Google Scholar] [CrossRef]
- Zhu, Y.Q.; Gupta, K.M.; Liu, Q.; Jiang, J.W.; Caro, J.; Huang, A.S. Synthesis and seawater desalination of molecular sieving zeolitic imidazolate framework membranes. Desalination 2016, 385, 75–82. [Google Scholar] [CrossRef]
- Duke, M.C.; Abrahamb, J.O.; Milnea, N.; Zhu, B.; Lin, J.Y.S.; Diniz da Costa, J.C. Seawater desalination performance of MFI type membranes made by secondary growth. Sep. Sci. Technol. 2009, 68, 343–350. [Google Scholar] [CrossRef]
- Drobek, M.; Yacou, C.; Motuzas, J.; Julbe, A.; Ding, L.P.; Diniz da Costa, J.C. Long term pervaporation desalination of tubular MFI zeolite membranes. J. Membr. Sci. 2012, 415, 816–823. [Google Scholar] [CrossRef]
- Cao, Z.S.; Zeng, S.X.; Xu, Z.; Arvanitis, A.; Yang, S.W.; Gu, X.H.; Dong, J.H. Ultrathin ZSM-5 zeolite nanosheet laminated membrane for high-flux desalination of concentrated brines. Sci. Adv. 2018, 4, eaau8634. [Google Scholar] [CrossRef] [PubMed] [Green Version]
- Castricum, H.L.; Sah, A.; Kreiter, R.; Blank, D.H.A.; Vente, J.F.; ten Elshof, J.E. Hybrid Ceramic Nanosieves: Stabilizing Nanopores with Organic Links. Chem. Commun. 2008, 1103–1105. [Google Scholar] [CrossRef] [PubMed]
- Castricum, H.L.; Sah, A.; Kreiter, R.; Blank, D.H.A.; Vente, J.F.; ten Elshof, J.E. Hydrothermally Stable Molecular Separation Membranes from Organically Linked Silica. J. Mater. Chem. 2008, 18, 2150–2158. [Google Scholar] [CrossRef]
- Kanezashi, M.; Yada, K.; Yoshioka, T.; Tsuru, T. Design of silica networks for development of highly permeable hydrogen separation membranes with hydrothermal stability. J. Am. Chem. Soc. 2008, 131, 414–415. [Google Scholar] [CrossRef]
- Xu, R.; Wang, J.; Kanezashi, M.; Yoshioka, T.; Tsuru, T. Development of robust organosilica membranes for reverse osmosis. Langmuir 2011, 27, 13996–13999. [Google Scholar] [CrossRef] [PubMed]
- Pizzoccaro-Zilamy, M.A.; Huiskes, C.; Keim, E.G.; Sluijter, S.N.; van Veen, H.; Nijmeijer, A.; Winnubst, L.; Luiten-Olieman, M.W.J. New Generation of Mesoporous Silica Membranes Prepared by a Stöber-Solution Pore-Growth Approach. ACS Appl. Mater. Interfaces 2019, 11, 18528–18539. [Google Scholar] [CrossRef] [Green Version]
- Ciriminna, R.; Fidalgo, A.; Pandarus, V.; Beland, F.; Ilharco, L.M.; Pagliaro, M. The sol-gel route to advanced silica-based materials and recent applications. Chem. Rev. 2013, 113, 6592–6620. [Google Scholar] [CrossRef] [PubMed]
- Niimi, T.; Nagasawa, H.; Kanezashi, M.; Yoshioka, T.; Ito, K.; Tsuru, T. Preparation of BTESE-derived organosilica membranes for catalytic membrane reactors of methylcyclohexane dehydrogenation. J. Membr. Sci. 2014, 455, 375–383. [Google Scholar] [CrossRef]
- Song, H.; Wei, Y.; Wang, C.; Zhao, S.; Qi, H. Tuning sol size to optimize organosilica membranes for gas separation. Chin. J. Chem. Eng. 2018, 26, 53–59. [Google Scholar] [CrossRef]
- Kanezashi, M.; Sasaki, T.; Tawarayama, H.; Nagasawa, H.; Yoshioka, T.; Ito, K.; Tsuru, T. Experimental and theoretical study on small gas permeation properties through amorphous silica membranes fabricated at different temperatures. J. Phys. Chem. C 2014, 118, 20323–20331. [Google Scholar] [CrossRef]
- Song, H.; Wei, Y.; Qi, H. Tailoring pore structures to improve the permselectivity of organosilica membranes by tuning calcination parameters. J. Mater. Chem. A 2017, 5, 24657–24666. [Google Scholar] [CrossRef]
- Xu, R.; Zou, L.; Lin, P.; Zhang, Q.; Zhong, J. Pervaporative desulfurization of model gasoline using PDMS/BTESE-derived organosilica hybrid membranes. Fuel Process. Technol. 2016, 154, 188–196. [Google Scholar] [CrossRef]
- Wijmans, J.G.; Baker, R.W. The solution-diffusion model: A review. J. Membr. Sci. 1995, 107, 1–21. [Google Scholar] [CrossRef]
- Ngamou, P.H.T.; Overbeek, J.P.; Kreiter, R.; van Veen, H.M.; Vente, J.F.; Wienk, I.M.; Cuperus, P.F.; Creatore, M. Plasma-Deposited Hybrid Silica Membranes with a Controlled Retention of Organic Bridges. J. Mater. Chem. A 2013, 1, 5567–5576. [Google Scholar] [CrossRef] [Green Version]
- Xu, R.; Ibrahim, S.M.; Kanezashi, M.; Yoshioka, T.; Ito, K.; Ohshita, J.; Tsuru, T. New Insights into the Microstructure-Separation Properties of Organosilica Membranes with Ethane, Ethylene, and Acetylene Bridges. ACS Appl. Mater. Interfaces 2014, 6, 9357–9364. [Google Scholar] [CrossRef] [PubMed]
- Fierro, V.; Szczurek, A.; Zlotea, C.; Marêché, J.F.; Izquierdo, M.T.; Albiniak, A.; Latroche, M.; Furdin, G.; Celzard, A. Experimental evidence of an upper limit for hydrogen storage at 77 K on activated carbons. Carbon 2010, 48, 1902–1911. [Google Scholar] [CrossRef]
- Tsuru, T.; Igi, R.; Kanezashi, M.; Yoshioka, T.; Fujisaki, S.; Iwamoto, Y. Permeation properties of hydrogen and water vapor through porous silica membranes at high temperatures. AIChE J. 2011, 57, 618–629. [Google Scholar] [CrossRef]
- Nagasawa, H.; Niimi, T.; Kanezashi, M.; Yoshioka, T.; Tsuru, T. Modified gas-translation model for prediction of gas permeation through microporous organosilica membranes. AIChE J. 2014, 60, 4199–4210. [Google Scholar] [CrossRef]
- Xu, R.; Lin, P.; Zhang, Q.; Zhong, J.; Tsuru, T. Development of ethenylene-bridged organosilica membranes for desalination applications. Ind. Eng. Chem. Res. 2016, 55, 2183–2190. [Google Scholar]
- Zhou, M.; Nemade, P.R.; Lu, X.; Zeng, X.; Hatakeyama, E.S.; Noble, R.D.; Gin, D.L. New type of membrane material for water desalination based on a cross-linked bicontinuous cubic lyotropic liquid crystal assembly. J. Am. Chem. Soc. 2007, 129, 9574–9575. [Google Scholar] [CrossRef]


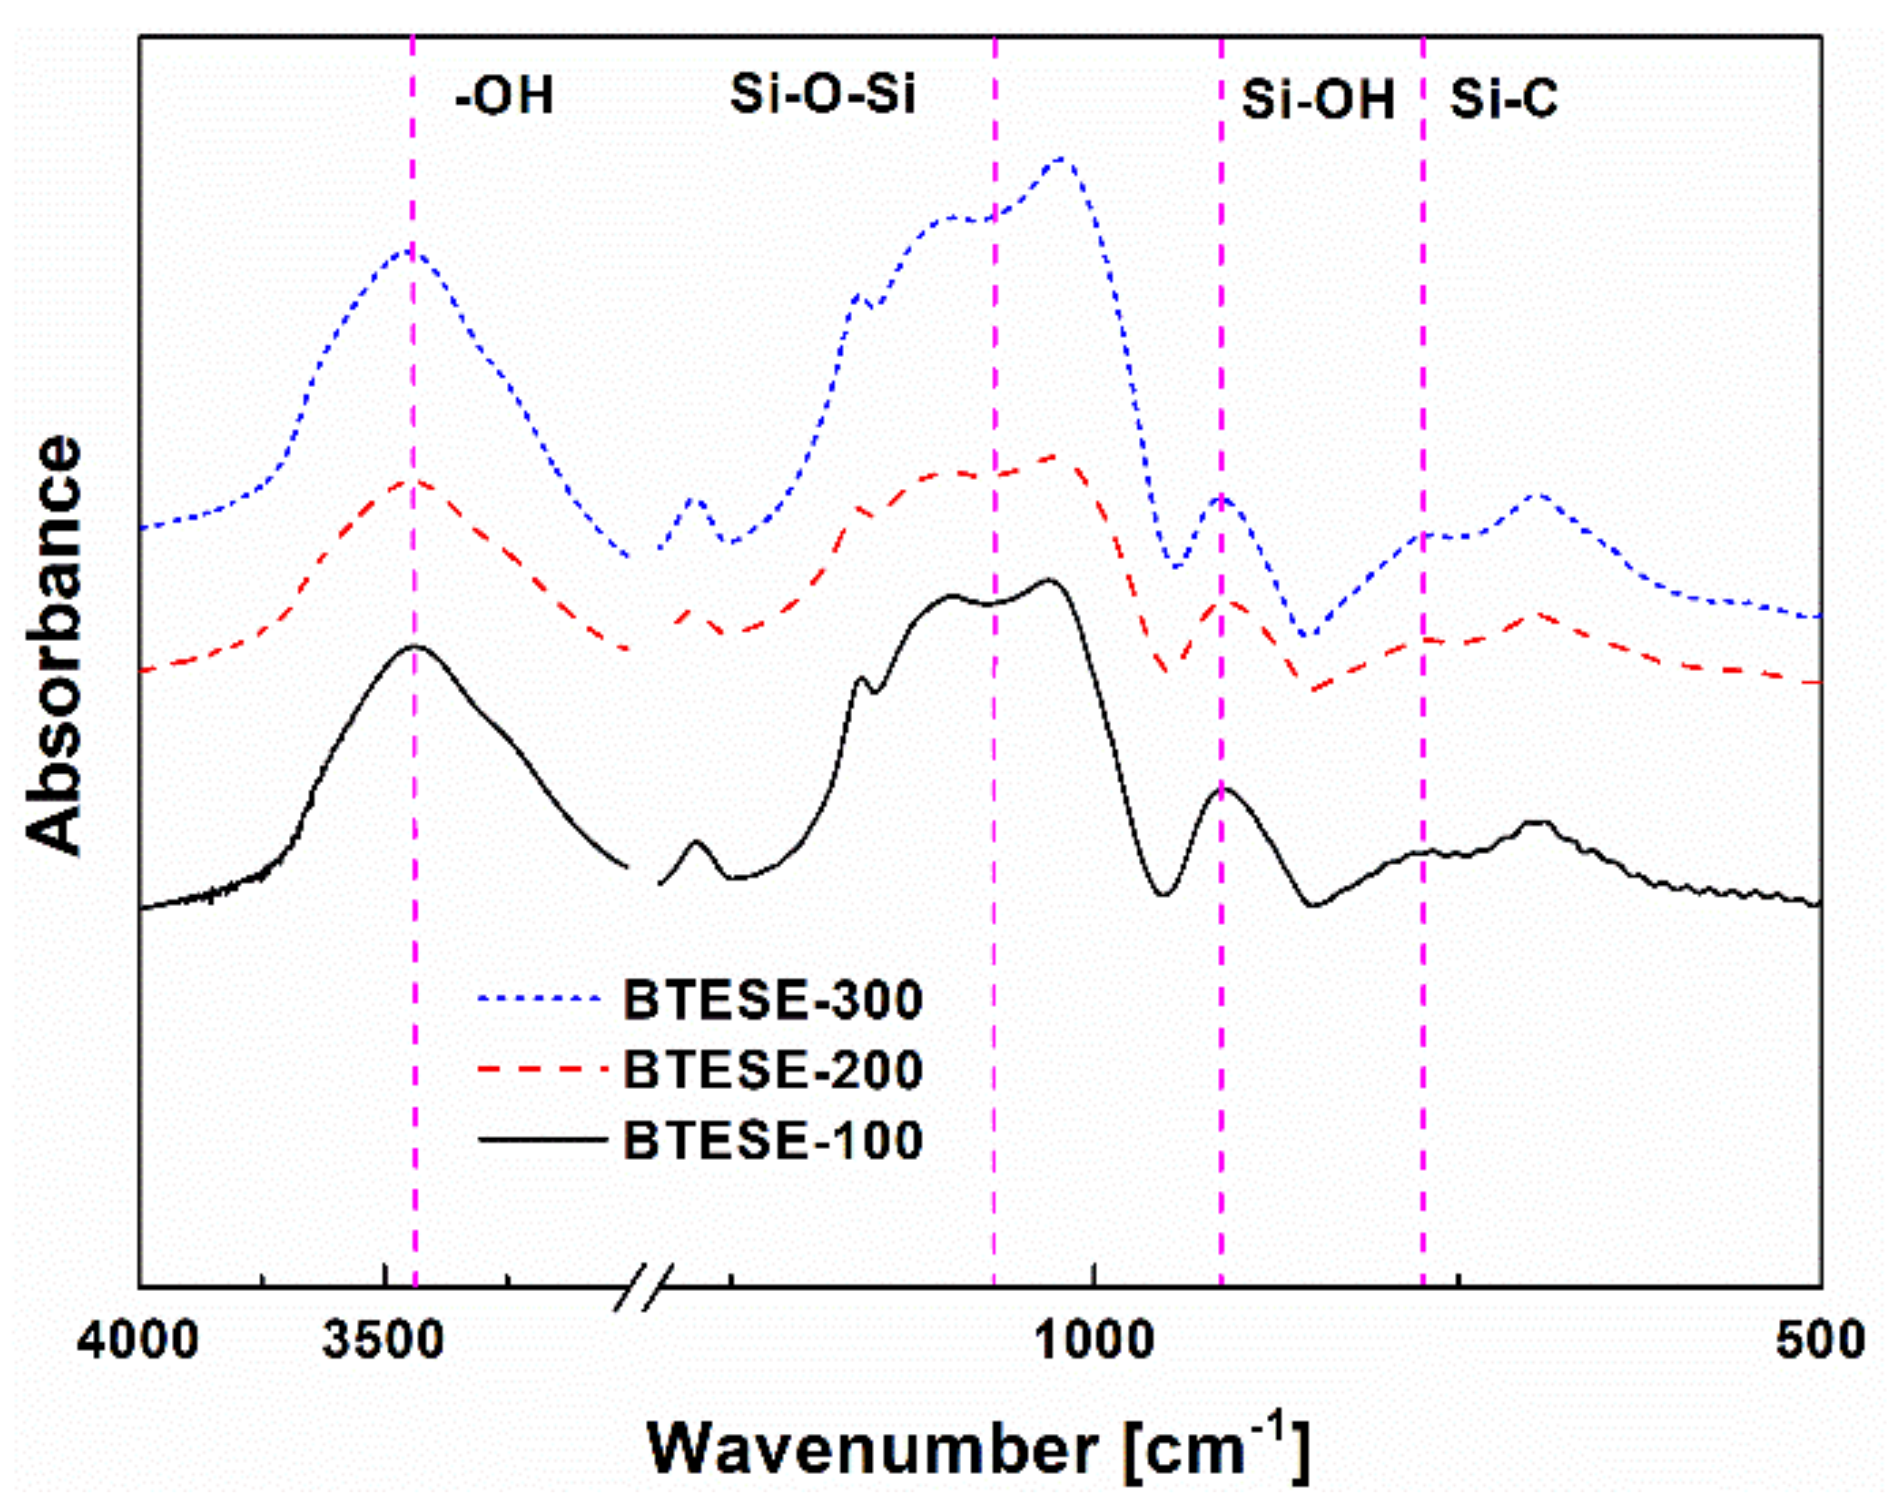
| Samples | Peak Area Ratios (Si–OH/Si–O–Si) | Contact Angles (°) |
|---|---|---|
| BTESE-100 | 0.53 | 52.0 ± 0.5 |
| BTESE-200 | 0.48 | 56.4 ± 0.5 |
| BTESE-300 | 0.41 | 68.0 ± 0.5 |
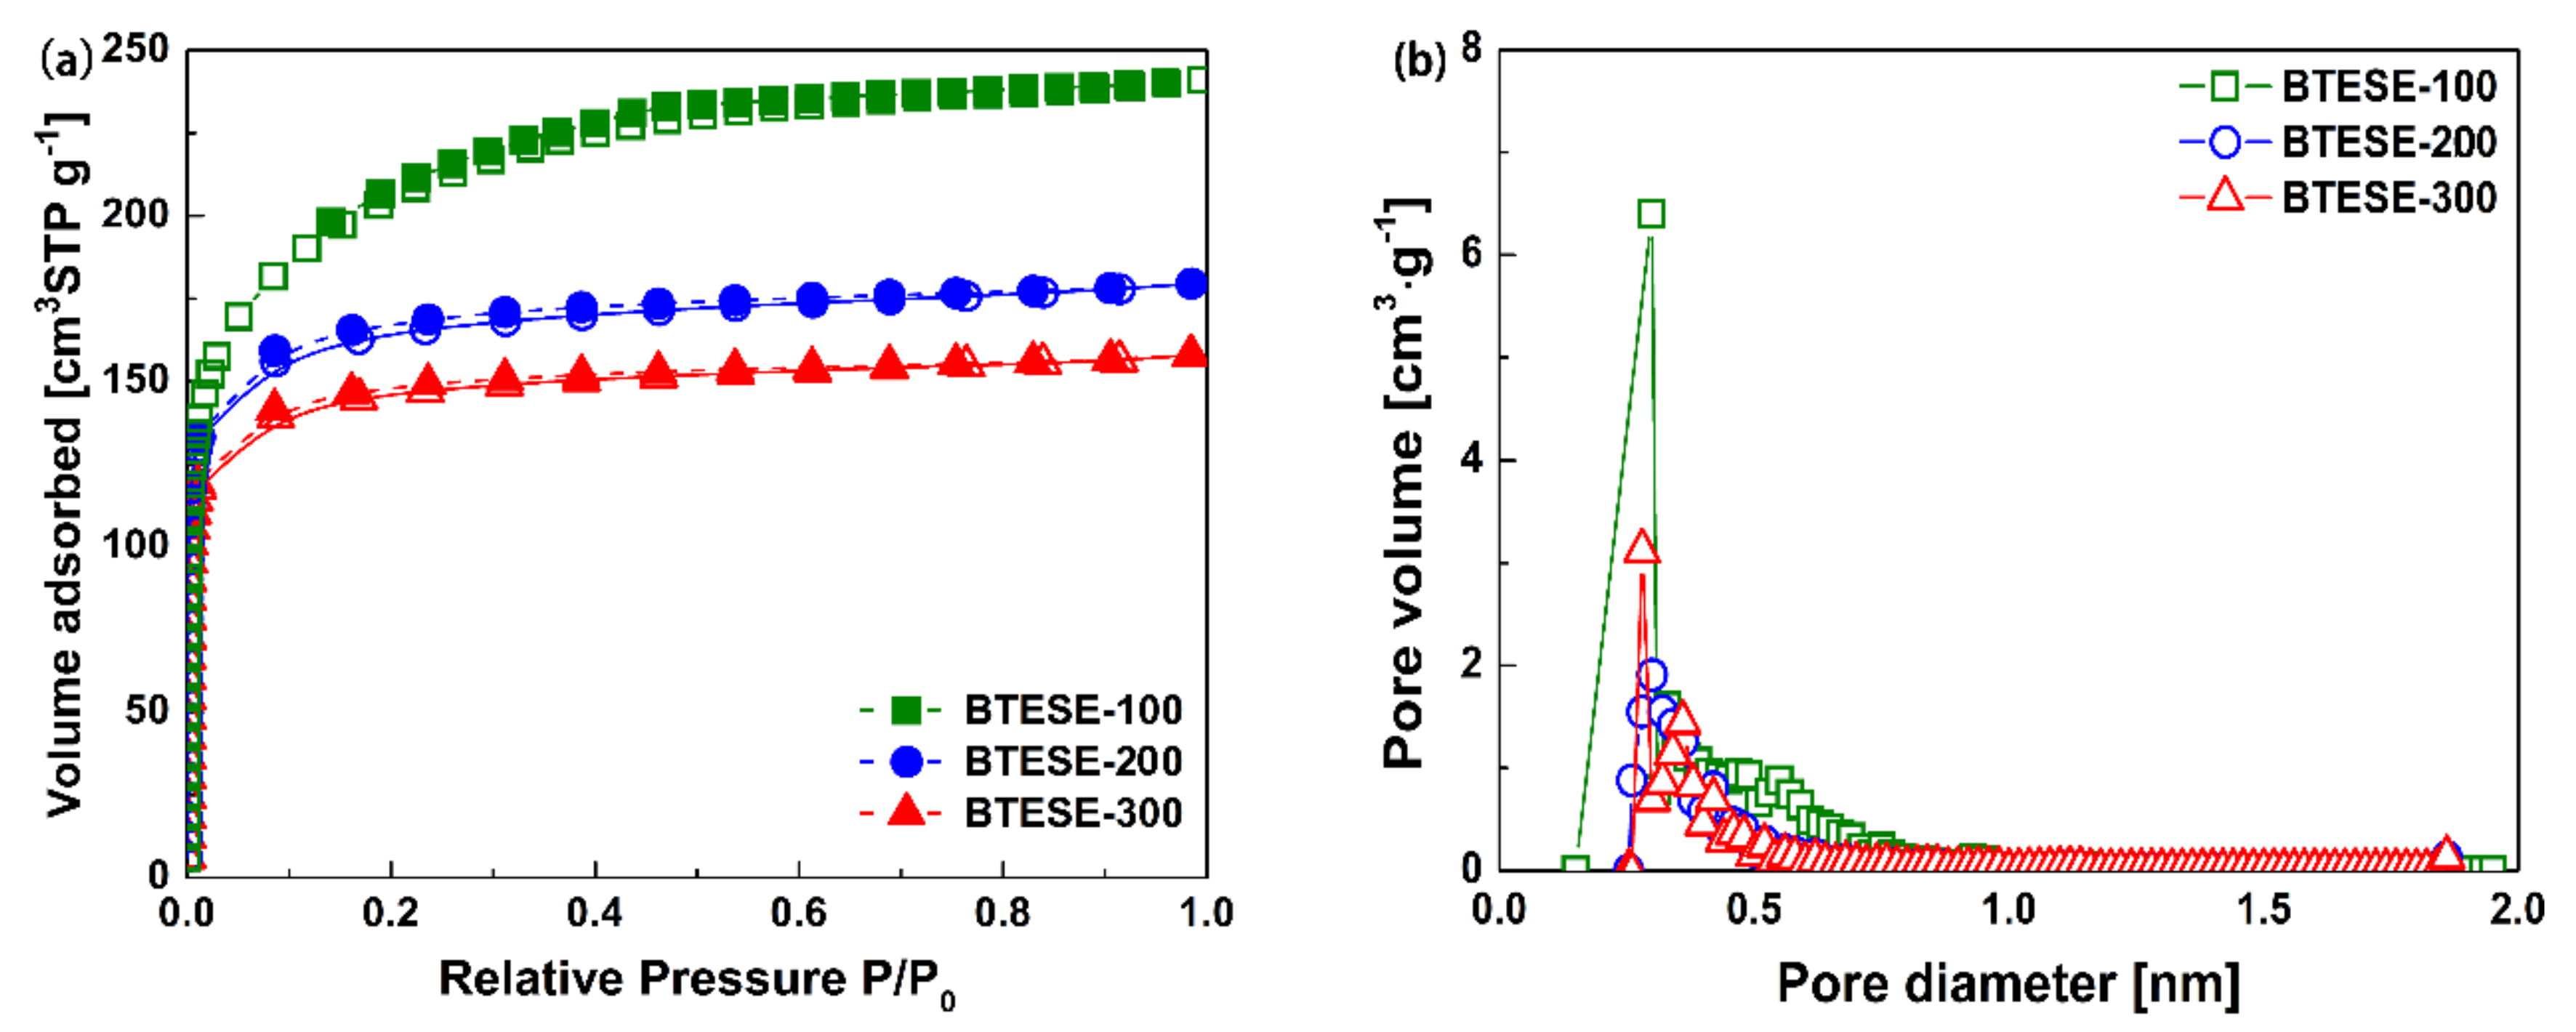
| Samples | SBET [m2 g−1] | Vp [cm3 g−1] | Dp [nm] |
|---|---|---|---|
| BTESE-100 | 728 | 0.16 | 0.32 |
| BTESE-200 | 532 | 0.18 | 0.32 |
| BTESE-300 | 472 | 0.17 | 0.30 |
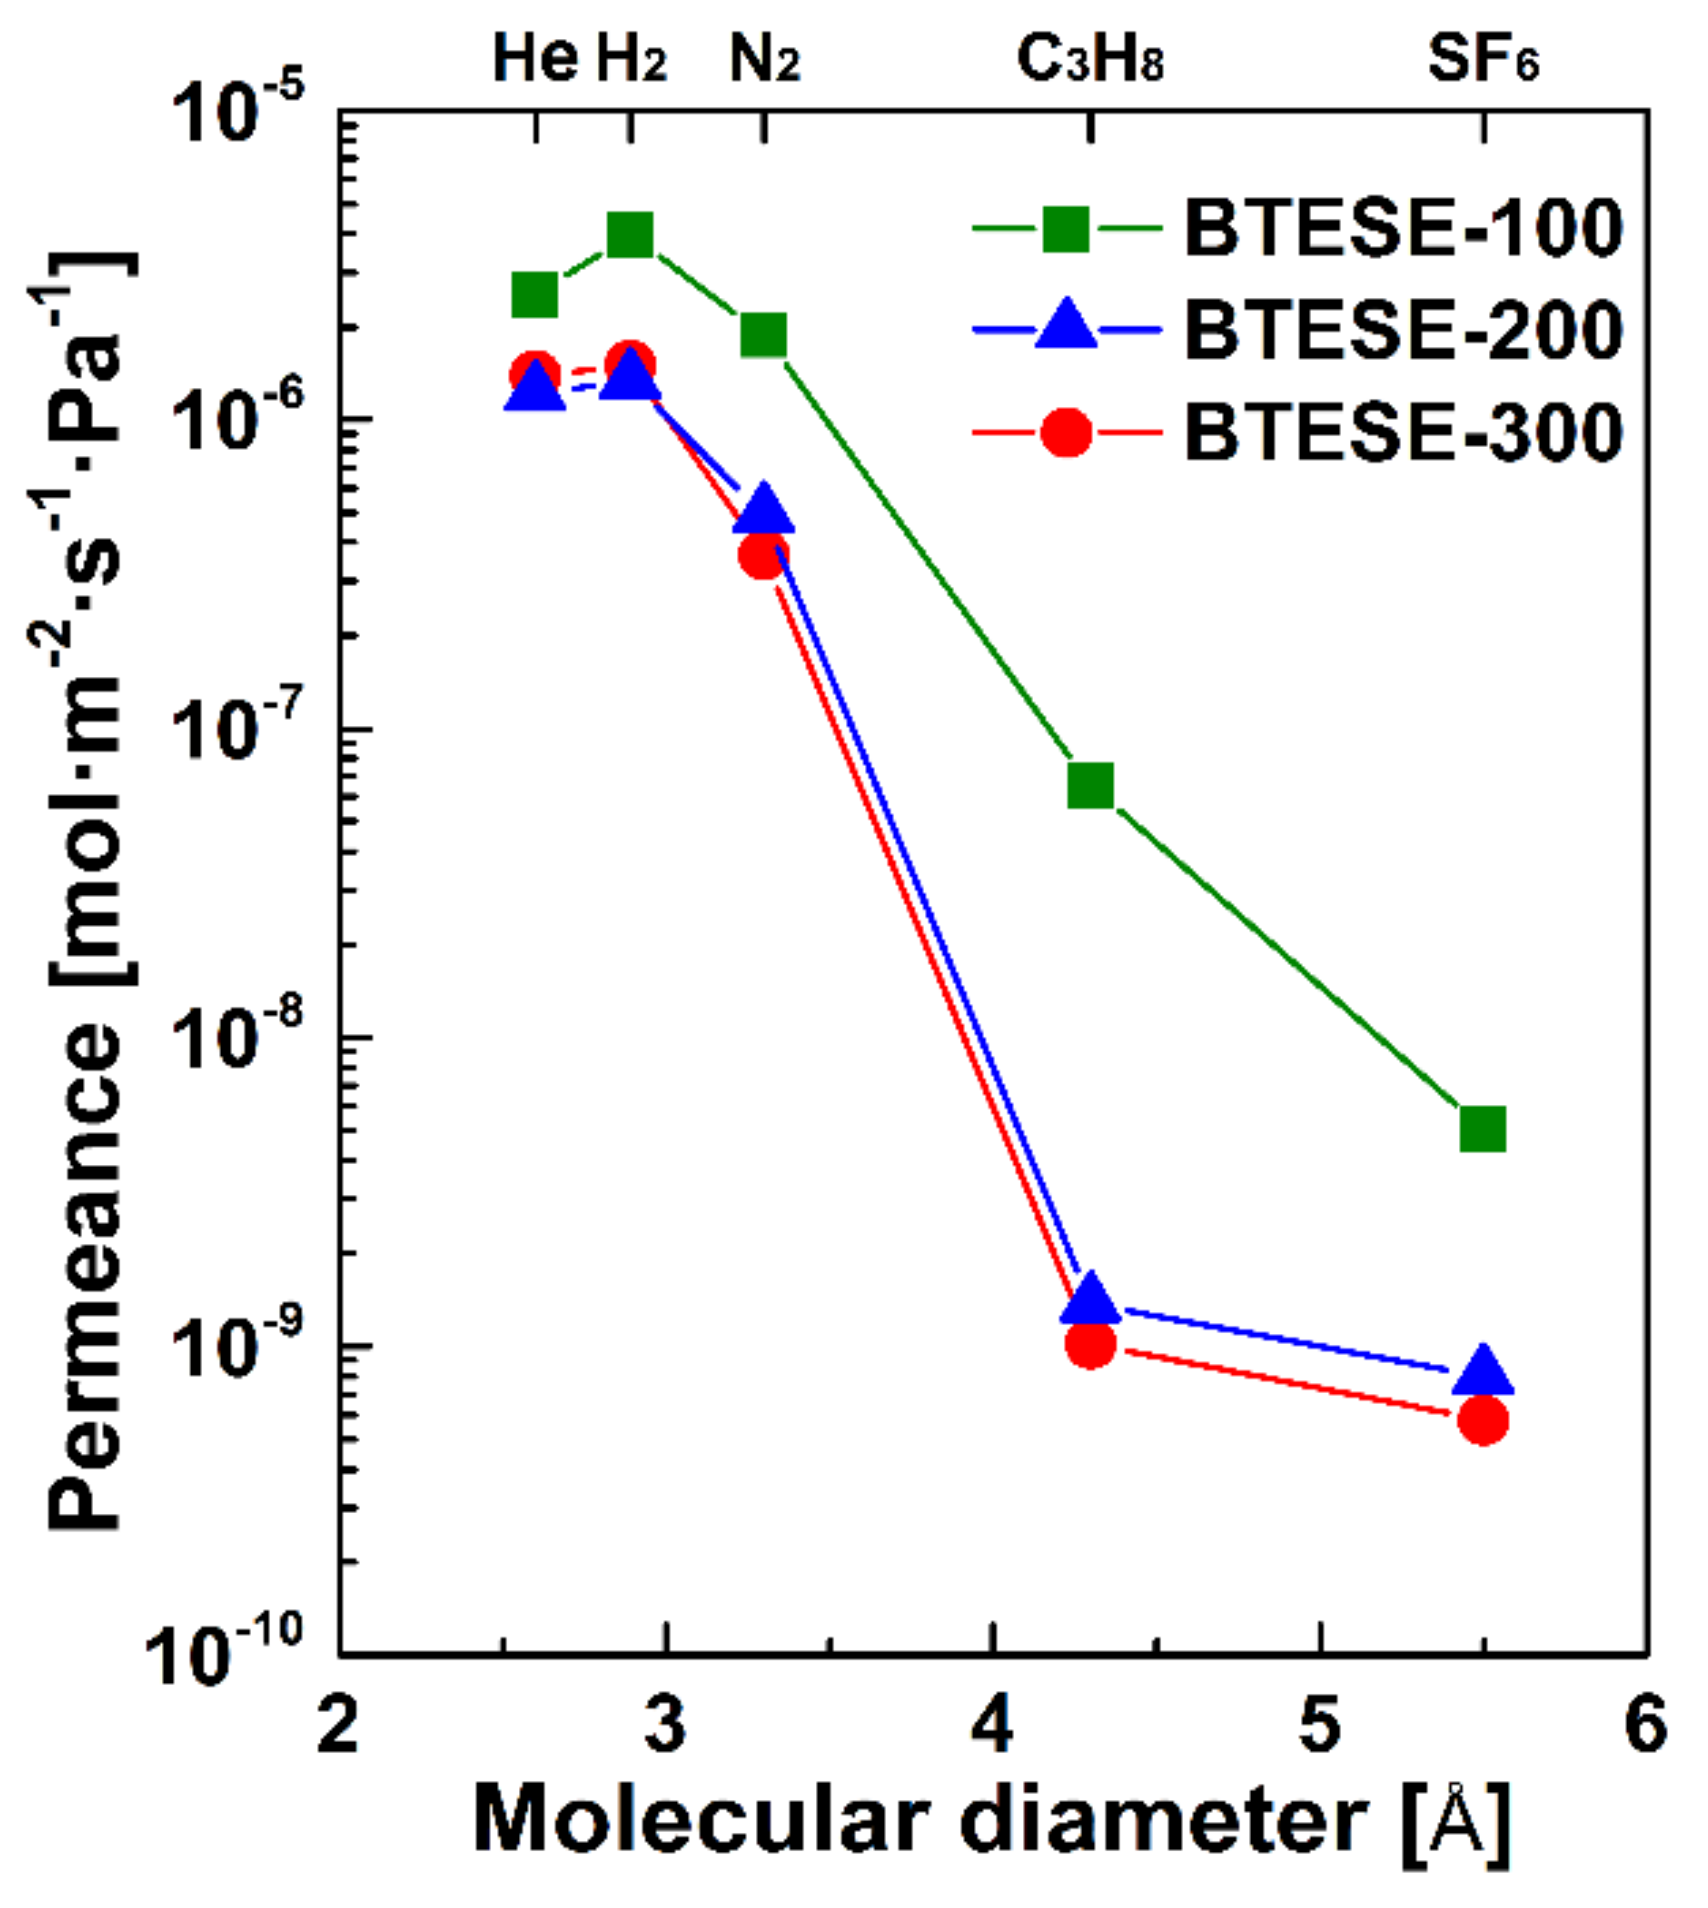
| Membranes | PH2 [mol m−2 s−1 Pa−1] | H2/N2 | H2/SF6 | NKP Pore Size (nm) |
|---|---|---|---|---|
| BTESE-100 | 3.98 × 10⁻⁶ | 2.1 | 790 | 0.56 |
| BTESE-200 | 1.34 × 10⁻⁶ | 2.7 | 1670 | 0.54 |
| BTESE-300 | 1.50 × 10⁻⁶ | 4.1 | 2590 | 0.53 |
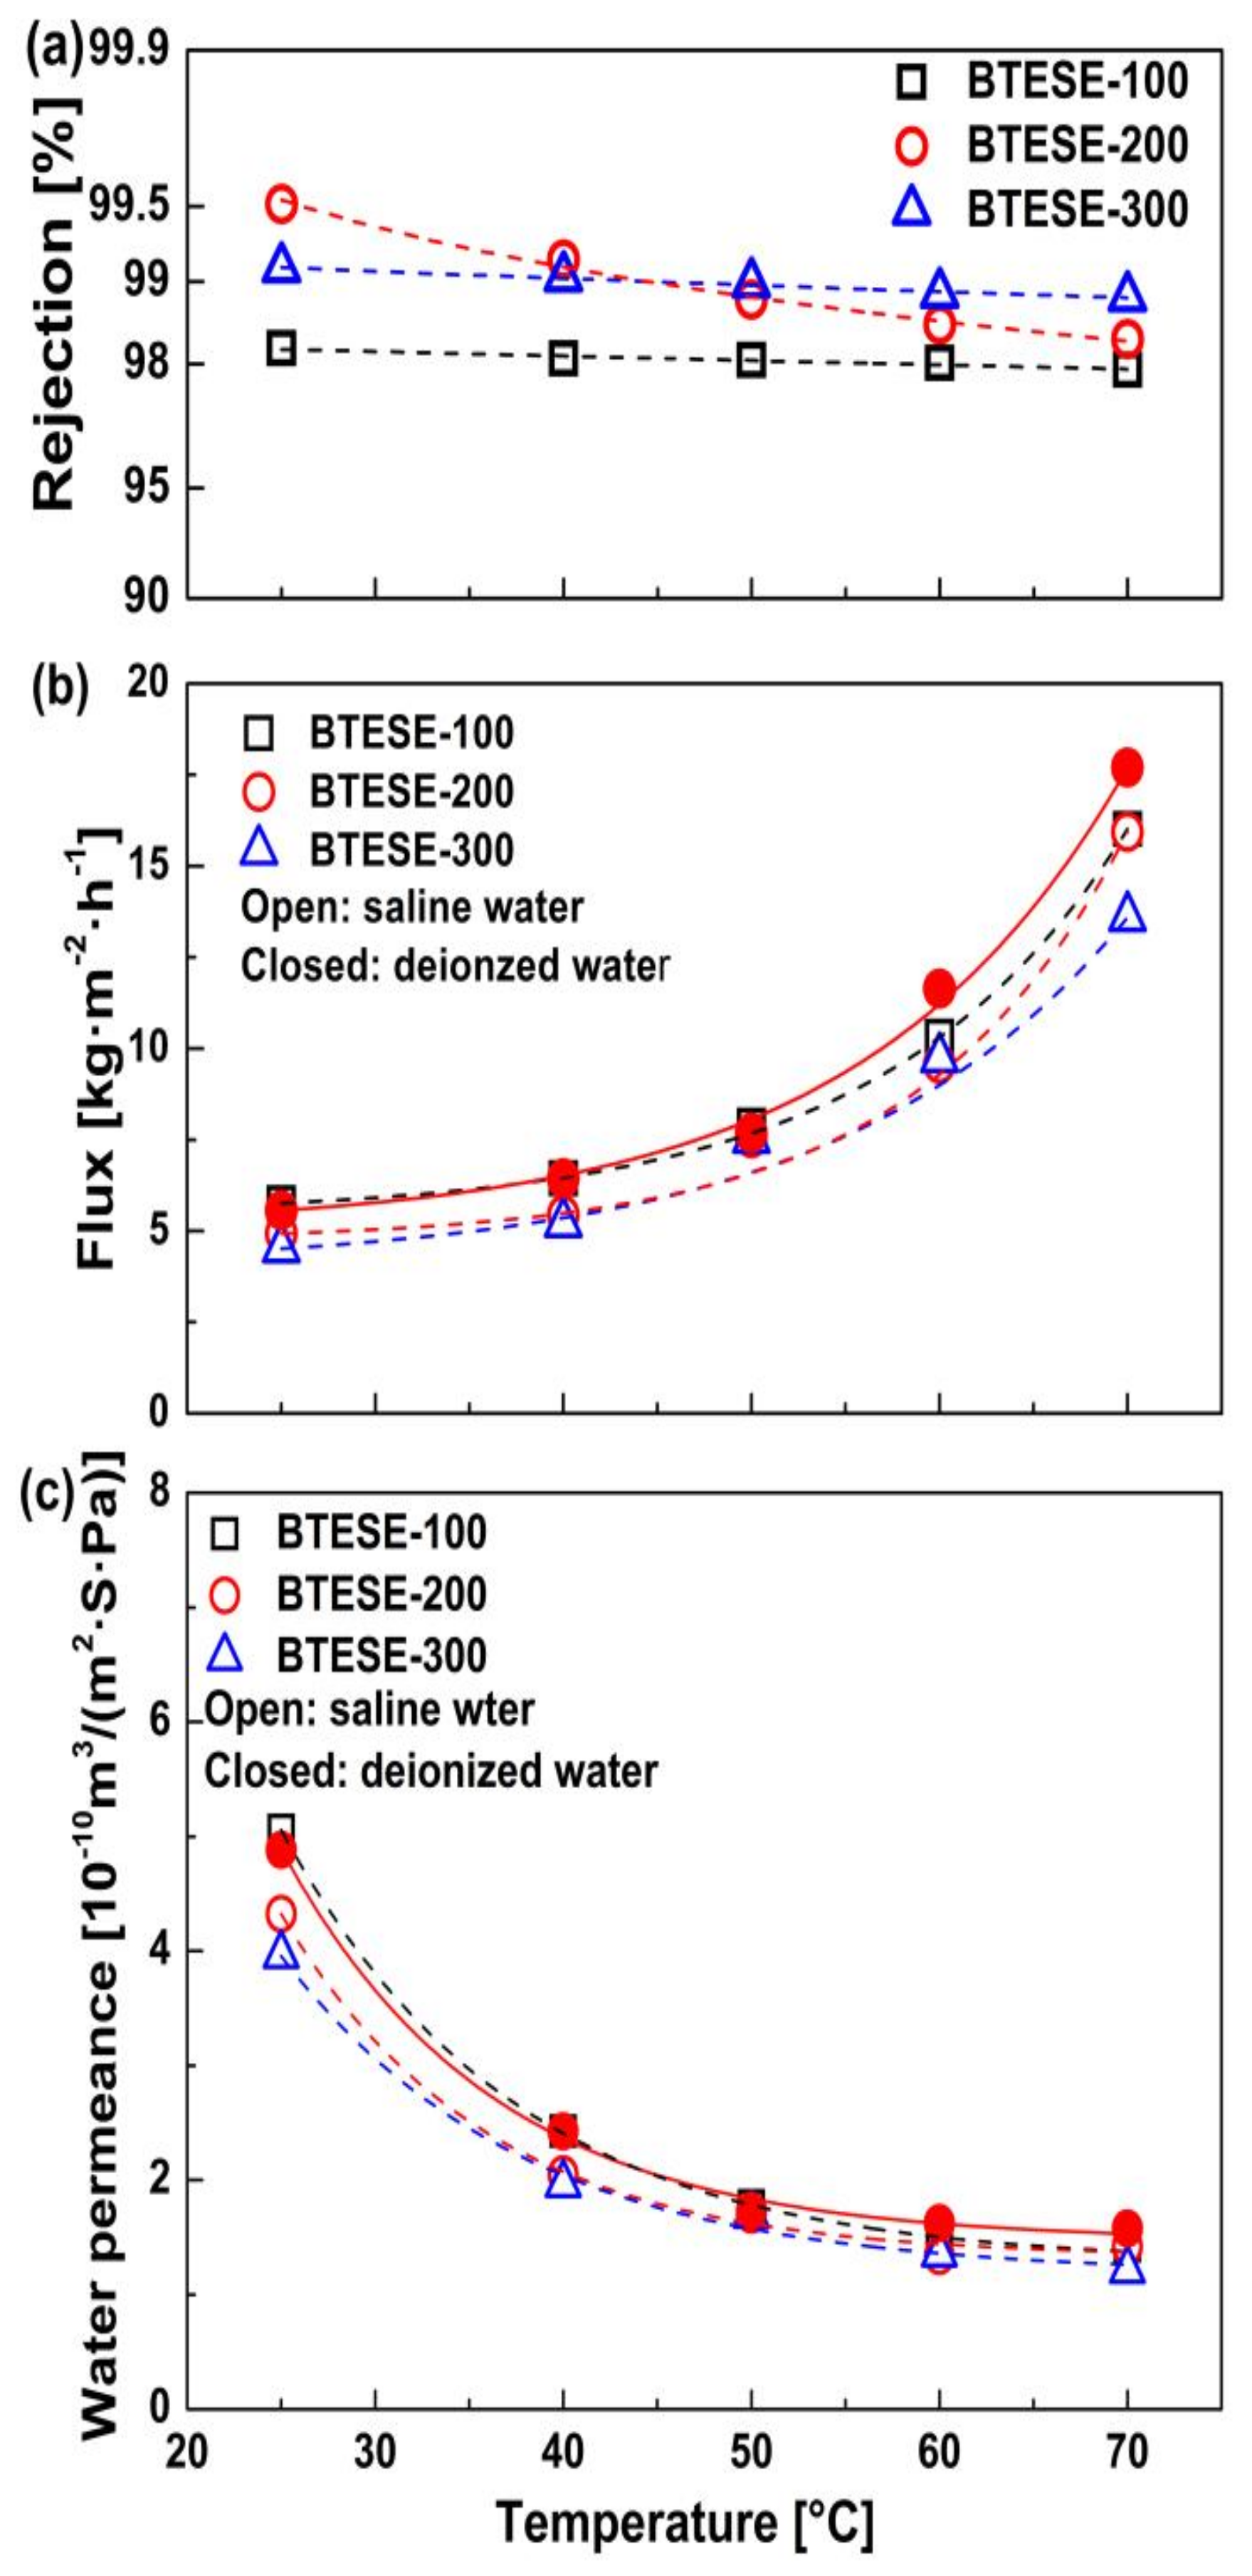
| Samples | Saline Water (2000 ppm NaCl) | Deionized Water BTESE-200 | ||
|---|---|---|---|---|
| BTESE-100 | BTESE-200 | BTESE-300 | ||
| Eapp (kJ∙mol−1) | 12.32 | 14.99 | 15.49 | 14.08 |
Publisher’s Note: MDPI stays neutral with regard to jurisdictional claims in published maps and institutional affiliations. |
© 2020 by the authors. Licensee MDPI, Basel, Switzerland. This article is an open access article distributed under the terms and conditions of the Creative Commons Attribution (CC BY) license (http://creativecommons.org/licenses/by/4.0/).
Share and Cite
Xu, R.; Liu, Q.; Ren, X.; Lin, P.; Zhong, J. Tuning the Pore Structures of Organosilica Membranes for Enhanced Desalination Performance via the Control of Calcination Temperatures. Membranes 2020, 10, 392. https://0-doi-org.brum.beds.ac.uk/10.3390/membranes10120392
Xu R, Liu Q, Ren X, Lin P, Zhong J. Tuning the Pore Structures of Organosilica Membranes for Enhanced Desalination Performance via the Control of Calcination Temperatures. Membranes. 2020; 10(12):392. https://0-doi-org.brum.beds.ac.uk/10.3390/membranes10120392
Chicago/Turabian StyleXu, Rong, Qian Liu, Xiuxiu Ren, Peng Lin, and Jing Zhong. 2020. "Tuning the Pore Structures of Organosilica Membranes for Enhanced Desalination Performance via the Control of Calcination Temperatures" Membranes 10, no. 12: 392. https://0-doi-org.brum.beds.ac.uk/10.3390/membranes10120392