Modeling and Simulation of the Simultaneous Absorption/Stripping of CO2 with Potassium Glycinate Solution in Membrane Contactor


Department of Chemical and Petroleum Eng., UAE University, Al-Ain PO Box 15551, UAE
Membranes 2020, 10(4), 72; https://0-doi-org.brum.beds.ac.uk/10.3390/membranes10040072
Submission received: 26 February 2020
/
Revised: 11 April 2020
/
Accepted: 14 April 2020
/
Published: 16 April 2020
(This article belongs to the Special Issue Membranes: 10th Anniversary)
Abstract
:Global warming is an environmental problem caused mainly by one of the most serious greenhouse gas, CO2 emissions. Subsequently, the capture of CO2 from flue gas and natural gas is essential. Aqueous potassium glycinate (PG) is a promising novelty solvent used in the CO2 capture compared to traditional solvents; simultaneous solvent regeneration is associated with the absorption step. In present work, a 2D mathematical model where radial and axial diffusion are considered is developed for the simultaneous absorption/stripping process. The model describes the CO2/PG absorption/stripping process in a solvent–gas membrane absorption process. Regeneration data of rich potassium glycinate solvent using a varied range of acid gas loading (mol CO2 per mol PG) were used to predict the reversible reaction rate constant. A comparison of simulation results and experimental data validated the accuracy of the model predictions. The stripping reaction rate constant of rich potassium glycinate was determined experimentally and found to be a function of temperature and PG concentration. Model predictions were in good agreement with the experimental data. The results reveal that the percent removal of CO2 is directly proportional to CO2 loading and solvent stripping temperature.
1. Introduction
Carbon dioxide (CO2) is the main contributor to global warming, which is a worldwide concern. Pre- and post-combustion capture of CO2 is the main solution to avoid this problem. The prominent technology nowadays is the absorption of CO2 in amine solution, such as monoethanolamine (MEA) and diethanolamine (DEA) that takes place in a reversible chemical reaction. Despite the success of these chemicals in absorbing CO2 from natural gas and flue gas, they suffer from certain drawbacks such as the regeneration of the alkanolamine solutions, which require high-energy consumption, solvent evaporation and degradation losses, and corrosion to pipes and equipment [1,2,3]. An alternative solvent of CO2 capture is the amino acid salts such as potassium glycinate (PG) [4]. The PG aqueous solvents have high reactivity toward CO2 and less regeneration energy consumption [5], the aqueous PG solvent has a comparable functional group as alkanolamine. The amino acid salts overcome the drawbacks of the alkanolamine solution in terms of low volatility because of their ionic structure, high surface tension, and low opportunity to degradation due to their resistance to oxidative degradation [6]. The reaction mechanism and reaction rate constants are essential for the simulation, evaluation, and design of the absorption/stripping process of CO2 in potassium glycinate (PG) in conventional absorption towers and solvent–gas membrane separation processes. Several researchers have studied the kinetics of these amino acid salts (AAS) [7,8,9,10,11,12,13]. Absorbent based on potassium glycinate showed higher reactivity than sodium based absorbent toward CO2 [14]. The kinetic data of the absorption of CO2 in several AAS are summarized elsewhere [8].
The traditional packed bed and plate column and cryogenic are the most commonly used techniques for the removal of CO2 gas from gaseous mixtures in alkanolamine solutions [5,15,16]. In spite of the success of these units, they suffered from certain weaknesses such as flooding, channeling, foaming, and high operating cost [17]. The alternative emerged technique is the solvent–gas membrane interaction system that can compete with the traditional solvent system; the membrane has a small structure size, liquid absorbent and gas stream flow in separate channels, is easy to scale up, and a high surface area per unit volume [2,17,18,19]. Many researchers recommend a hollow fiber membrane contacting system for the absorption and stripping of CO2 from rich solvent because of its noticeable advantages compared to conventional processes [13,16,20,21,22,23]. The effective absorption of CO2 in lean solvent and the desorption process of CO2 from rich liquid solvent (regeneration process) in hollow fiber membrane contactor depends preferably on the high membrane porosity and less on membrane moistening as wetting depends mainly on the reactivity of membrane material with solvent being used. Accordingly, the membrane material is preferred to be from hydrophobic polymeric material such as polyvinyl fluoride (PVDF) [1,22,24,25]. On the other hand, the absorbent liquid is designated to have high surface tension to prevent the penetration of liquid into the pores of the membrane [26]. Amino acid solvents have high surface tension properties such as glycinate family, potassium glycinate (PG), and sodium glycinate [23,27,28,29,30]. Membrane fabricated from polyetherimide (PEI), polysulfone (PS), and polytetrafluoroethylene (PTFE) have acceptable CO2 absorption and stripping efficiency and have high liquid entry pressure and, hence, were used for absorption and regeneration of carbon dioxide from flue and natural gas by several researchers [22,25,31,32].
Most of the literature work has focused on modeling and simulation of CO2 absorption in membrane contactors; less attention has been given to CO2 stripping from rich solvents in membrane contactors [16,33,34,35,36], and almost none were established for simultaneous modeling and simulation of the absorption/stripping process in the solvent–gas membrane separation process. Accordingly, the purpose of this work is the modeling and simulation of the simultaneous absorption/stripping of CO2 in lean and rich PG aqueous solution in membrane contactor, respectively. The validated model was used to study the effect of gas and solvent flow rates, solvent temperature, and CO2 loading in rich PG on membrane separation efficiency. The simulation results were compared with experimental data.
2. Model Development
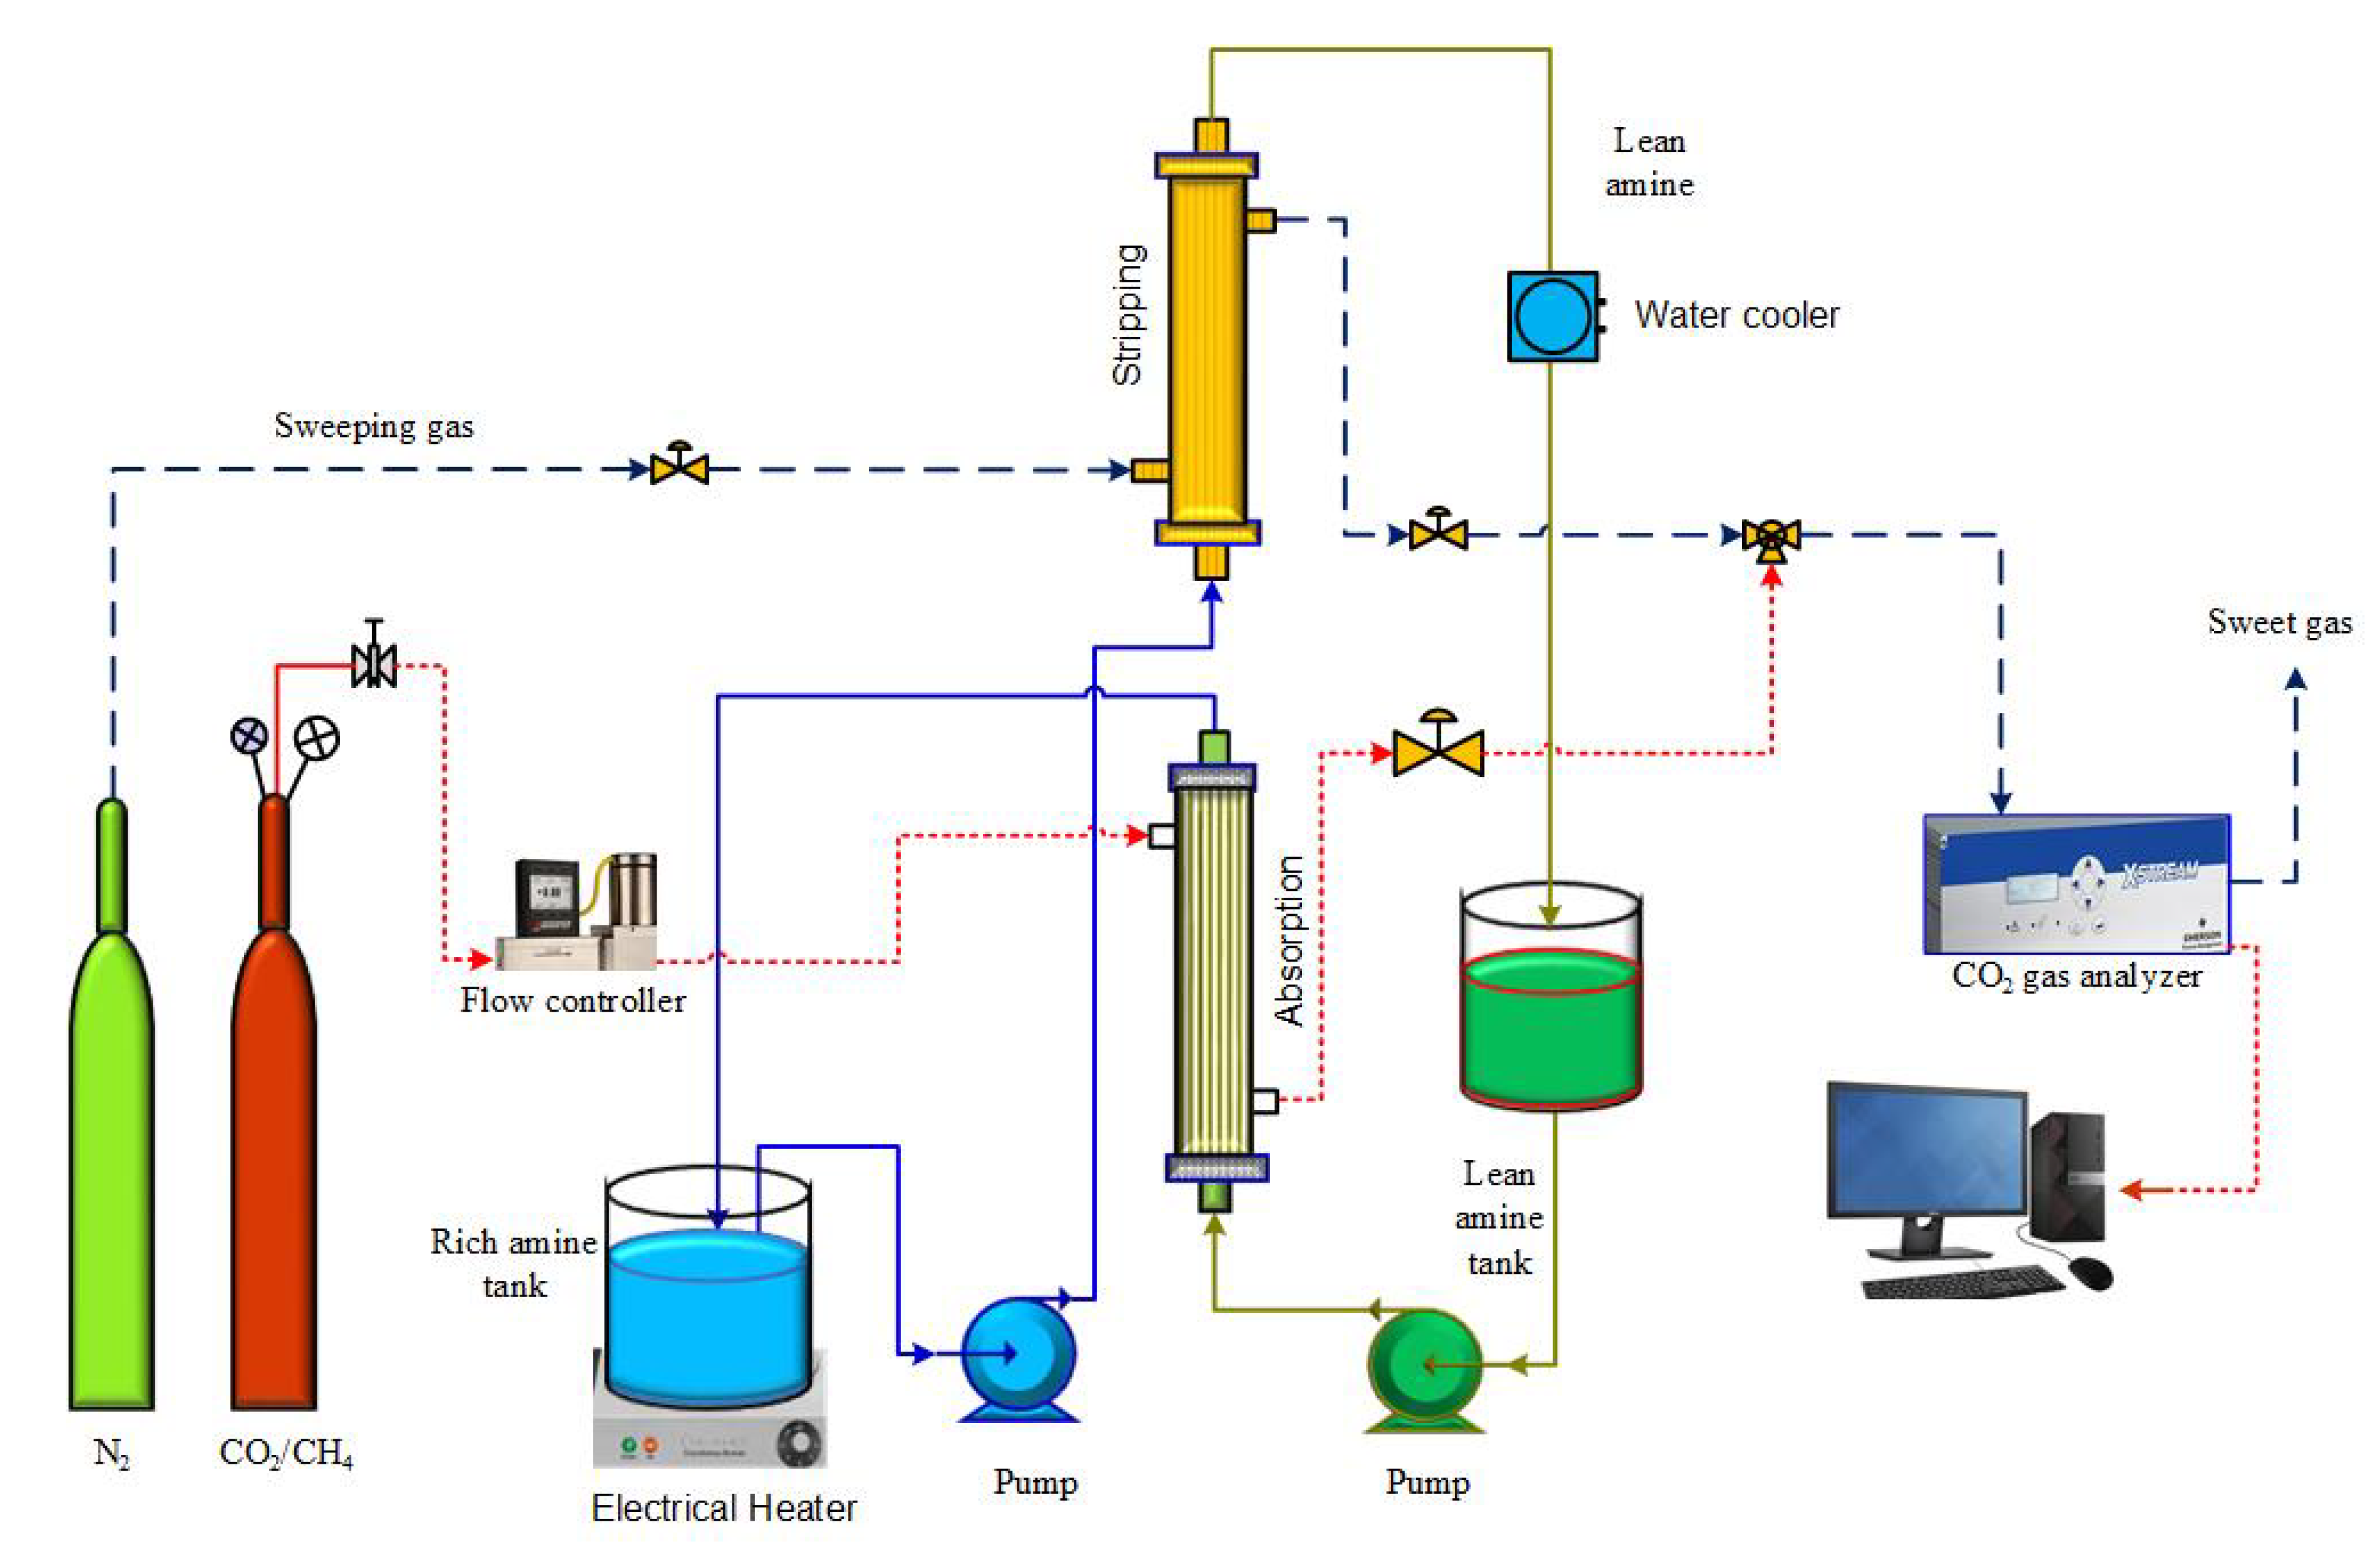
The model equations that describe the absorption/stripping of CO2 in aqueous PG through a gas–solvent membrane contactor were developed. Table 1 outlines the dimensions of the hollow fiber membrane used in the experimental and model development. Figure 1 shows the experimental setup for the absorption of CO2 in potassium glycinate solvent and stripping of rich solvent using solvent-gas membrane contacting modules for both absorption and stripping. The feed is 10% CO2/90% CH4 gas mixture flows into the membrane module shell side at variable gas inlet flow rate adjusted by Alicat mass flow controllers (Alicat Scientific, Tucson, AZ, USA). The solvent was 0.5 M aqueous potassium glycinate. The inlet solvent flow rate to absorber is monitored by a peristaltic pump (Masterflex L/S). The solvent (0.5 MPG) is supplied to the membrane lumen side at variable feed rates. The effluent of the absorber is heated to temperature range 20–80 °C. The heated stream is supplied to the tube side of the stripper (membrane module). The sweeping gas is nitrogen; the exit gas concentrate is measured using gas chromatography (Shimadzu, Kyoto, Japan) and a CO2 gas analyzer (CAI, 600 Series, Orange, CA, USA).
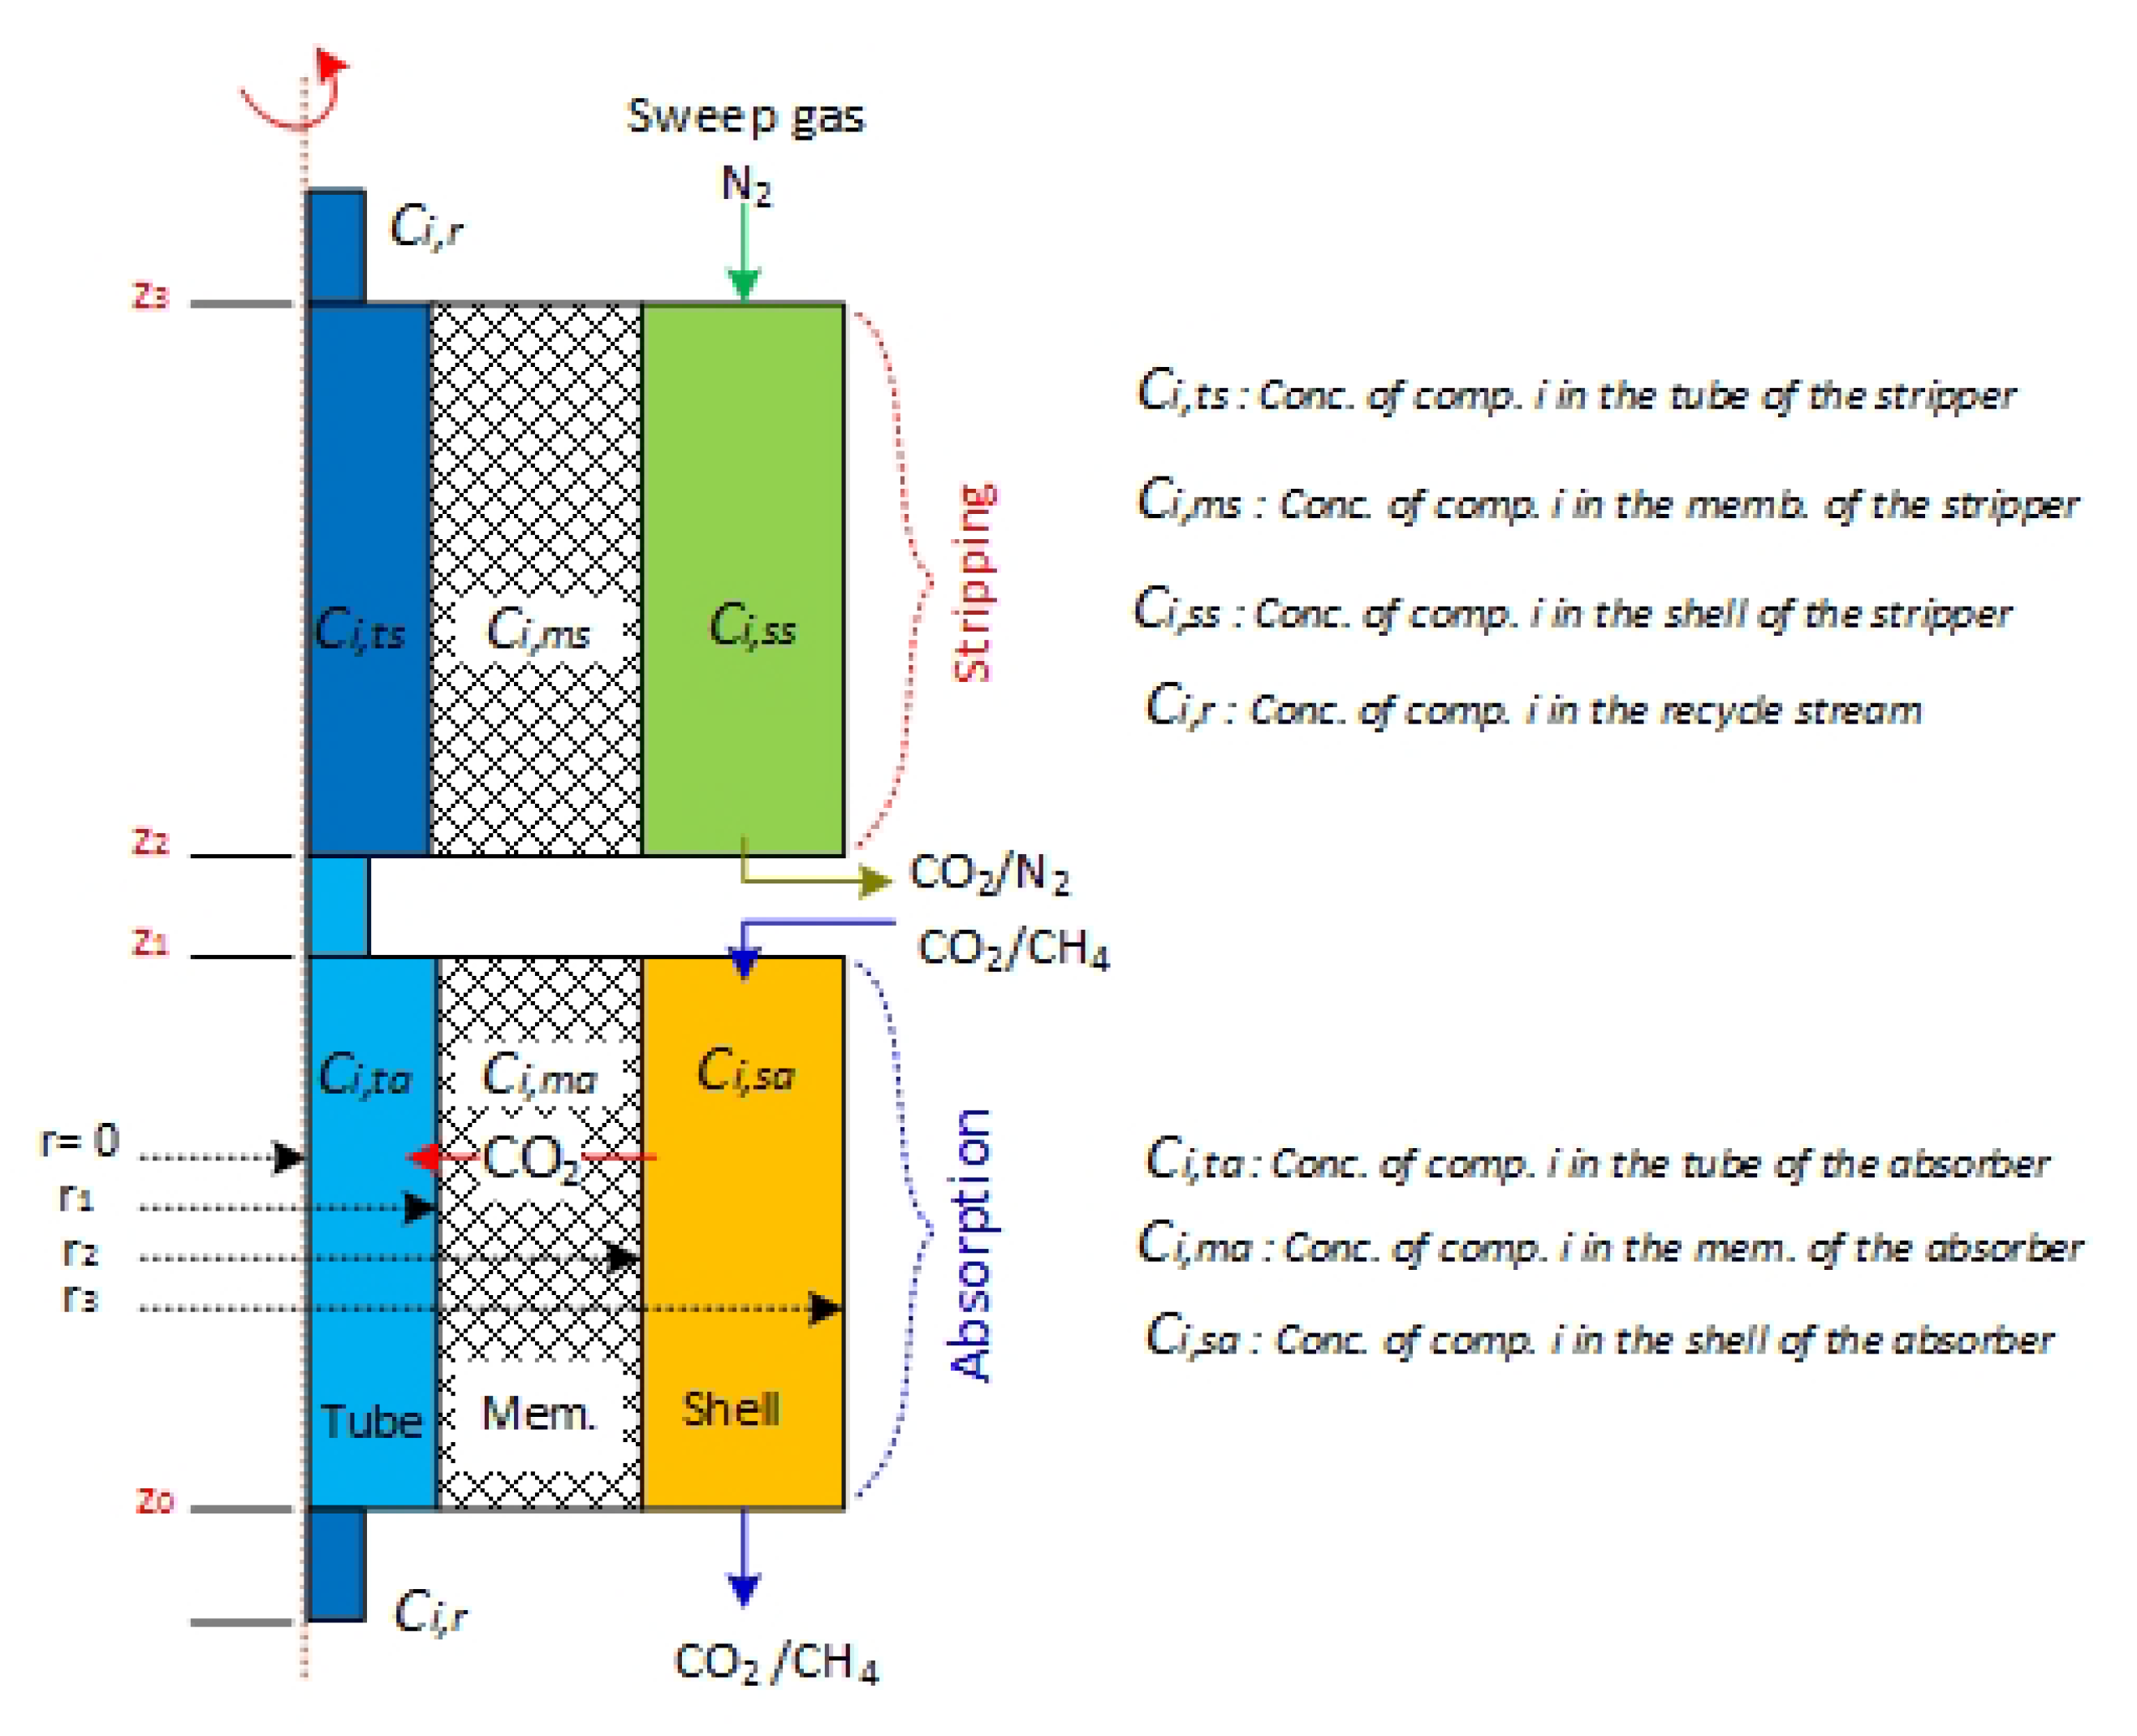
The developed 2D axisymmetric, transient mathematical model describes the absorption/stripping process in the solvent–gas hollow fiber membrane contacting process (Figure 2), considering a cylindrical coordinate, isothermal, and nonwetting mode of operation assumptions. While absorption operates at room temperature, stripping operates at variable solvent feed temperatures (25–80 °C). The model considers the ideal gas, incompressible liquid, and Newtonian fluid assumptions. Henry’s law measures the solubility of CO2 in the solvent at the solvent–gas interface. The CO2 and PG in the liquid phase is transported in the tube side by both diffusion and convection. CO2 diffuses across the membrane film by diffusion only. The following mass transport equations describe the absorption of the CO2 in lean PG and the stripping of CO2 from rich PG solvent.
In the model development, the subscripts in the material balance equations, , , , refers to the tube, membrane, and shell sides of the absorber, respectively, where , , , refers to the tube, membrane, and shell sides of the stripper, respectively. For example, refers to the concentration of CO2 of the solvent present in the tube side of the absorber module. PG is the aqueous liquid solvent, is the forward reaction of component , and is the reverse reaction rate of component .
2.1. Absorption
2.1.1. Hollow Fiber Lumen
The mass balance equation for CO2 in PG rich solvent flowing in the tube side is described by Equation (1):
The solvent circulation velocity () is described by the parabolic equation:
Qt is the solvent circulation volumetric rate, and is the number of fibers.
The boundary settings:
Since the PG contain amino groups similar to traditional amines, the reaction between CO2 and PG can be described by the zwitterion mechanism [21,37].
The forward reaction rate is expressed as follows [36].
where and are the concentrations of PG and CO2; T (K) is the liquid temperature.
2.1.2. Membrane Layer
The mass transfer of solute gas (CO2) in the membrane section bounded between and is expressed in Equation (9) by diffusion only [38]:
Equation (10) describes the material balance for the CH4 in membrane layer
Equations (11) to (14) are the boundary conditions of the membrane layer ()
2.1.3. Shell of the Module
Equations (15) and (16) express the mass transfer of CO2 and CH4 gas in the shell side, respectively:
The velocity of gas in the shell side is estimated by [39]:
The appropriate boundary conditions are as follows:
The radius of the free surface (), is expressed as follows:
The module void fraction ():
where , , are the inner radius of the module, fiber outer radius, and the number of fibers, respectively.
2.2. Stripping
2.2.1. Hollow Fiber Lumen
The mass balance equation for CO2 in PG rich solvent in the tube side of the stripper membrane module is described by Equation (24):
where the velocity of liquid inside the hollow fibers () is described by the parabolic equation:
where Qt is the liquid solvent volumetric flow rate in the tube side, and is the number of hollow fibers.
The appropriate set of boundary conditions are outlined as follows:
where m is the distribution coefficient ( determined from Henry’s law [10,11]:
The Henry’s constant for CO2 in aqueous PG is determined by
The reversible reaction rate is considered first order with respect to rich PG () in the tube side of the stripping unit
where is the reversible reaction rate constant.
2.2.2. Membrane Layer
The transport of the regenerated solute gas (CO2) and the sweep gas (N2) components in the membrane section restrained between and can be designated by the material balance equation (Equation (34)), where diffusion is the only transport mechanism in the membrane phase [38]:
Equation (35) describes the material balance for the sweep nitrogen gas in the membrane section.
Equations (36) to (39) are the boundary conditions of the membrane film ()
2.2.3. Shell of the Module
Equations (40) and (41) express the steady-state mass transport of CO2 and sweep N2 gas in the shell side, respectively:
The velocity profile in the shell side is described by Happel’s free surface [39].
The relevant boundary conditions are as follows:
The model governing equations were solved simultaneously using COMSOL software version 5.5 (COMSOL Inc., Stockholm, Swedon). The software implies a finite element method to solve the model equations. Table 2 outlined the values used in the model predictions.
3. Results and Discussion
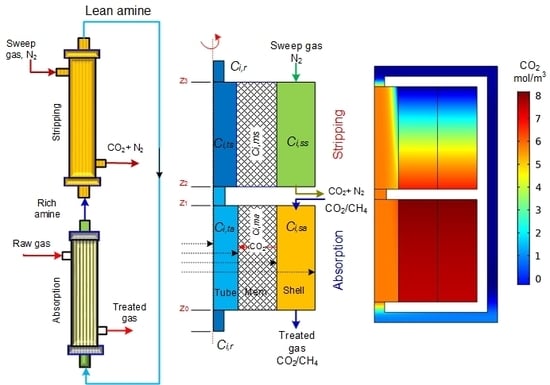
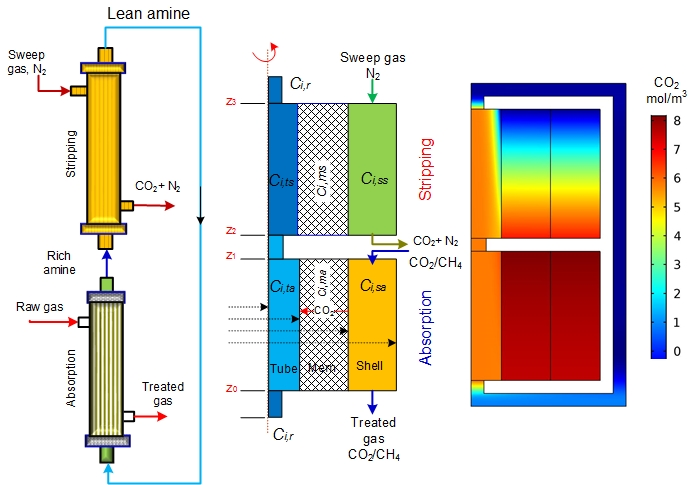
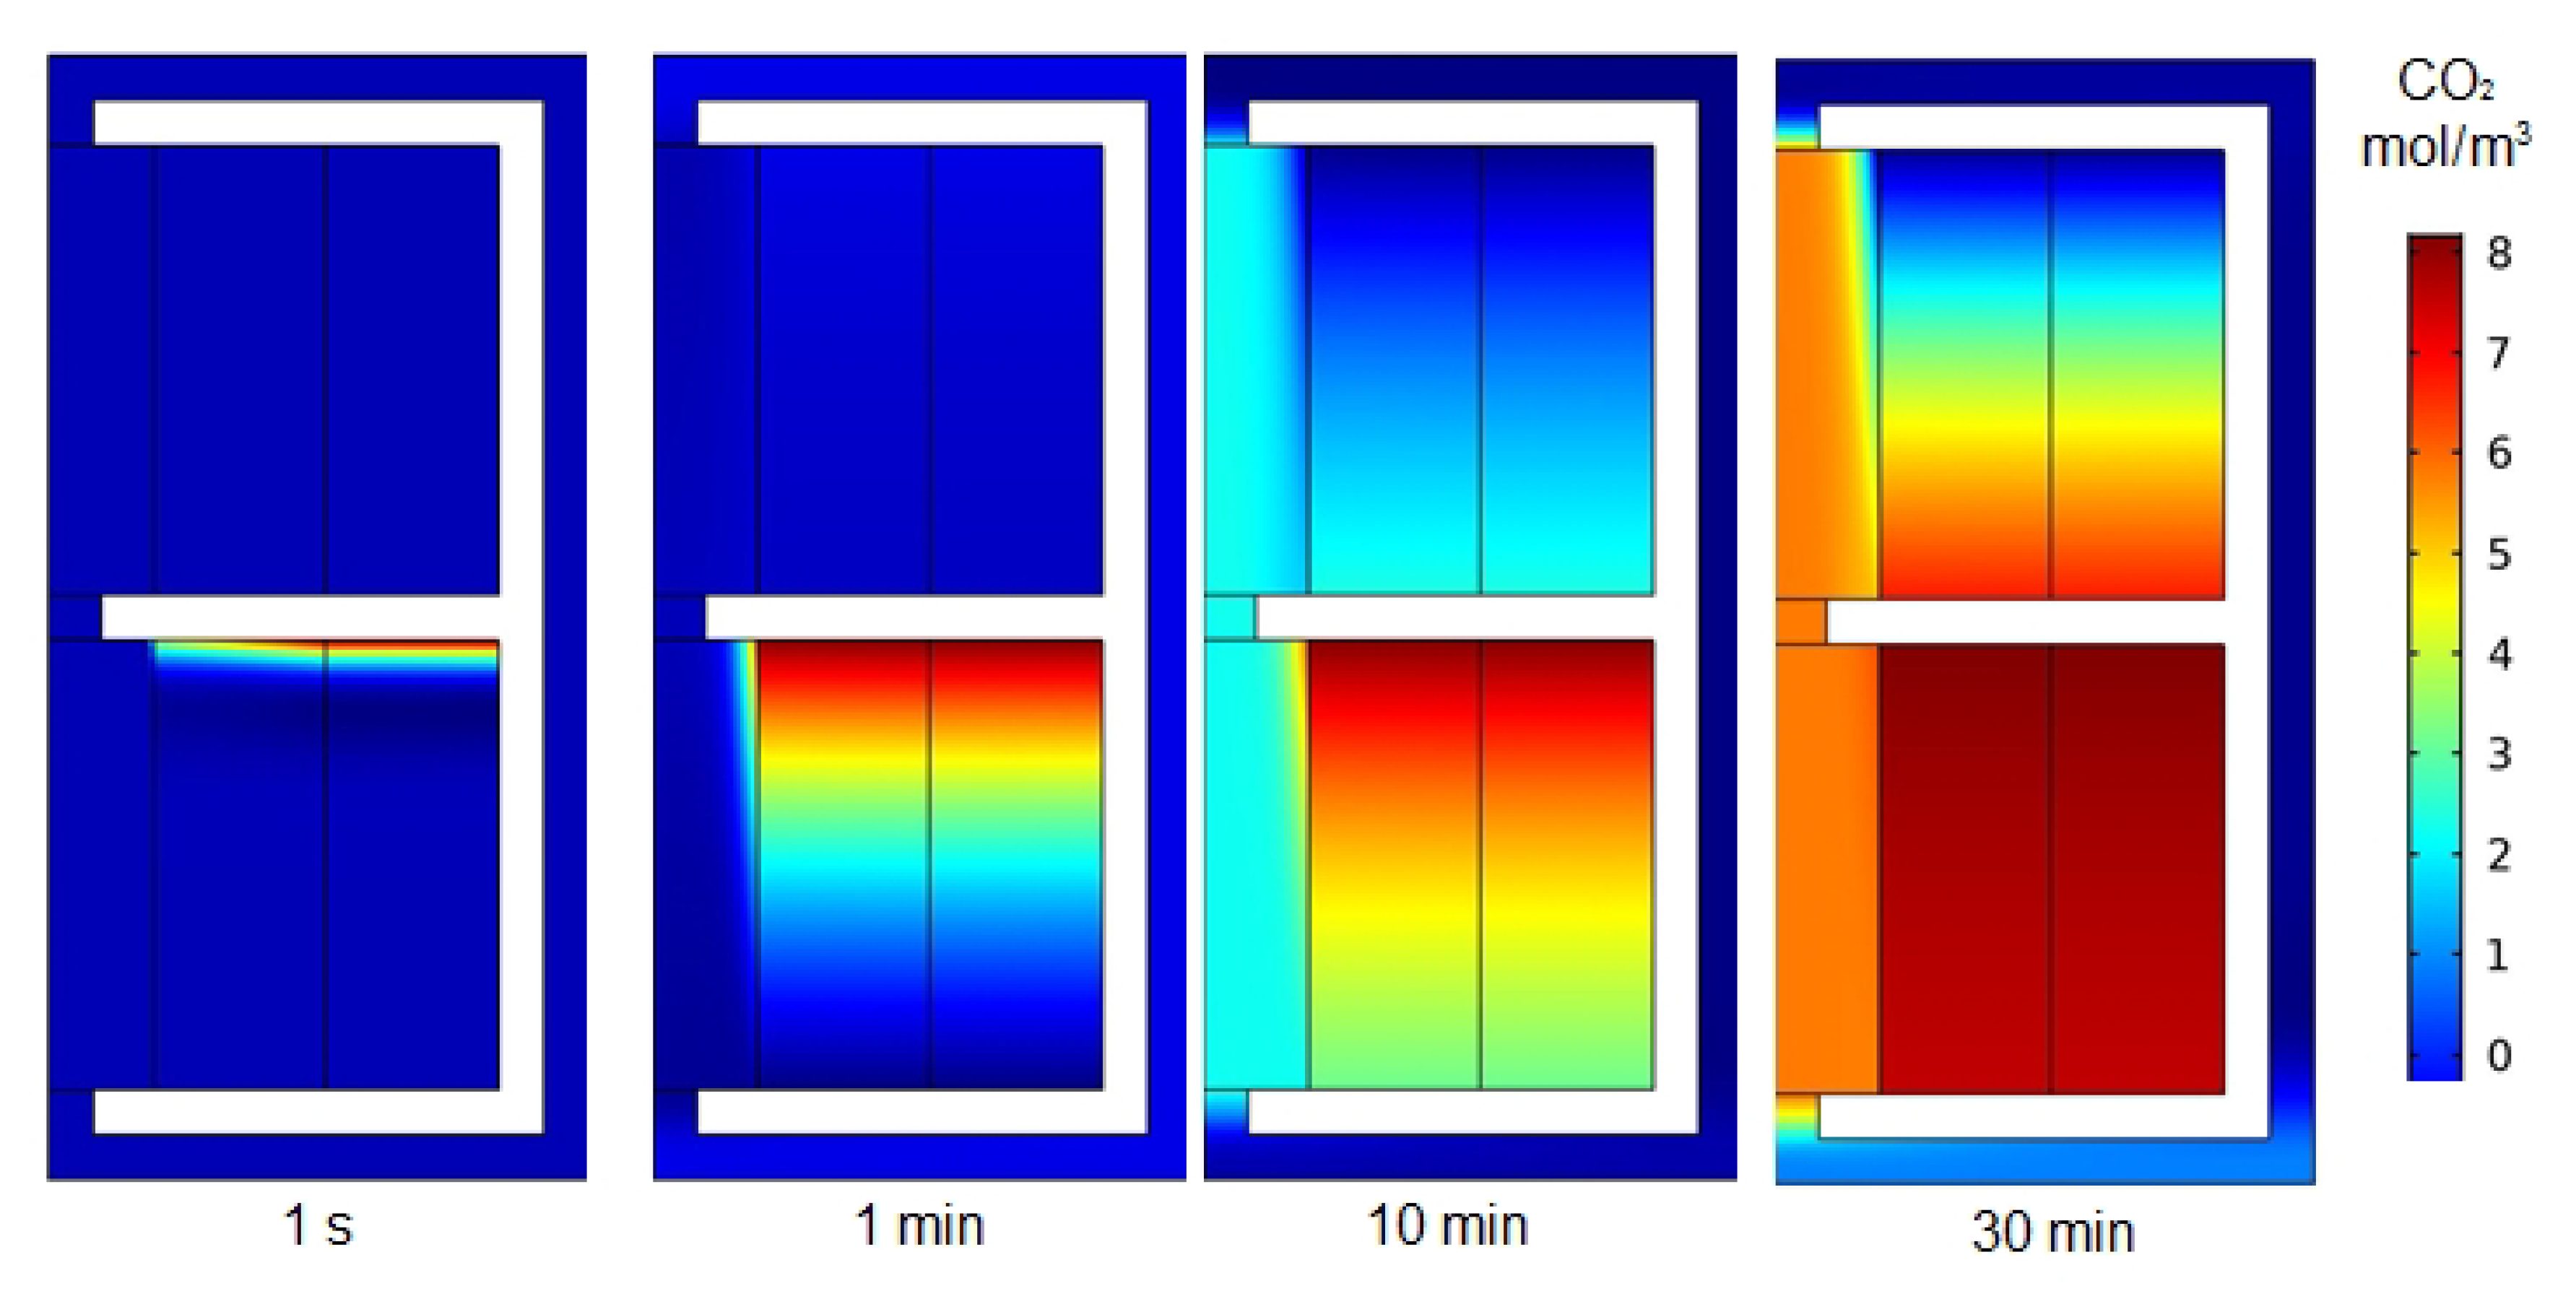
The surface plot of CO2 concentration across the membrane modules (absorption/stripping) is predicted in Figure 3. The inlet concentration of CO2 that enters the shell side of the absorption unit (bottom) is 8 mol/m3, and initial fresh solvent concentration (0.5 M PG) exists in the tube side. The CO2 being absorbed in the absorption unit with the PG solvent. The absorption efficiency declined with time. Initially, the CO2 concentration is the inlet of the membrane (absorber) shell side. With time (after 1 and 10 min), the percentage of CO2 absorbed dropped. The decreased in the absorption efficiency is due to the consumption of the PG solvent available for the absorption of CO2 in the hollow fiber lumen and the week regeneration of the rich PG in the stripping unit (top). After 30 min, almost no CO2 removal is observed in the absorber, the CO2 concentration across the absorber shell side is almost close to inlet concentration (8 mol/m3). This is attributed to the consumption of the available PG for the CO2 absorption and the week regeneration of the solvent.
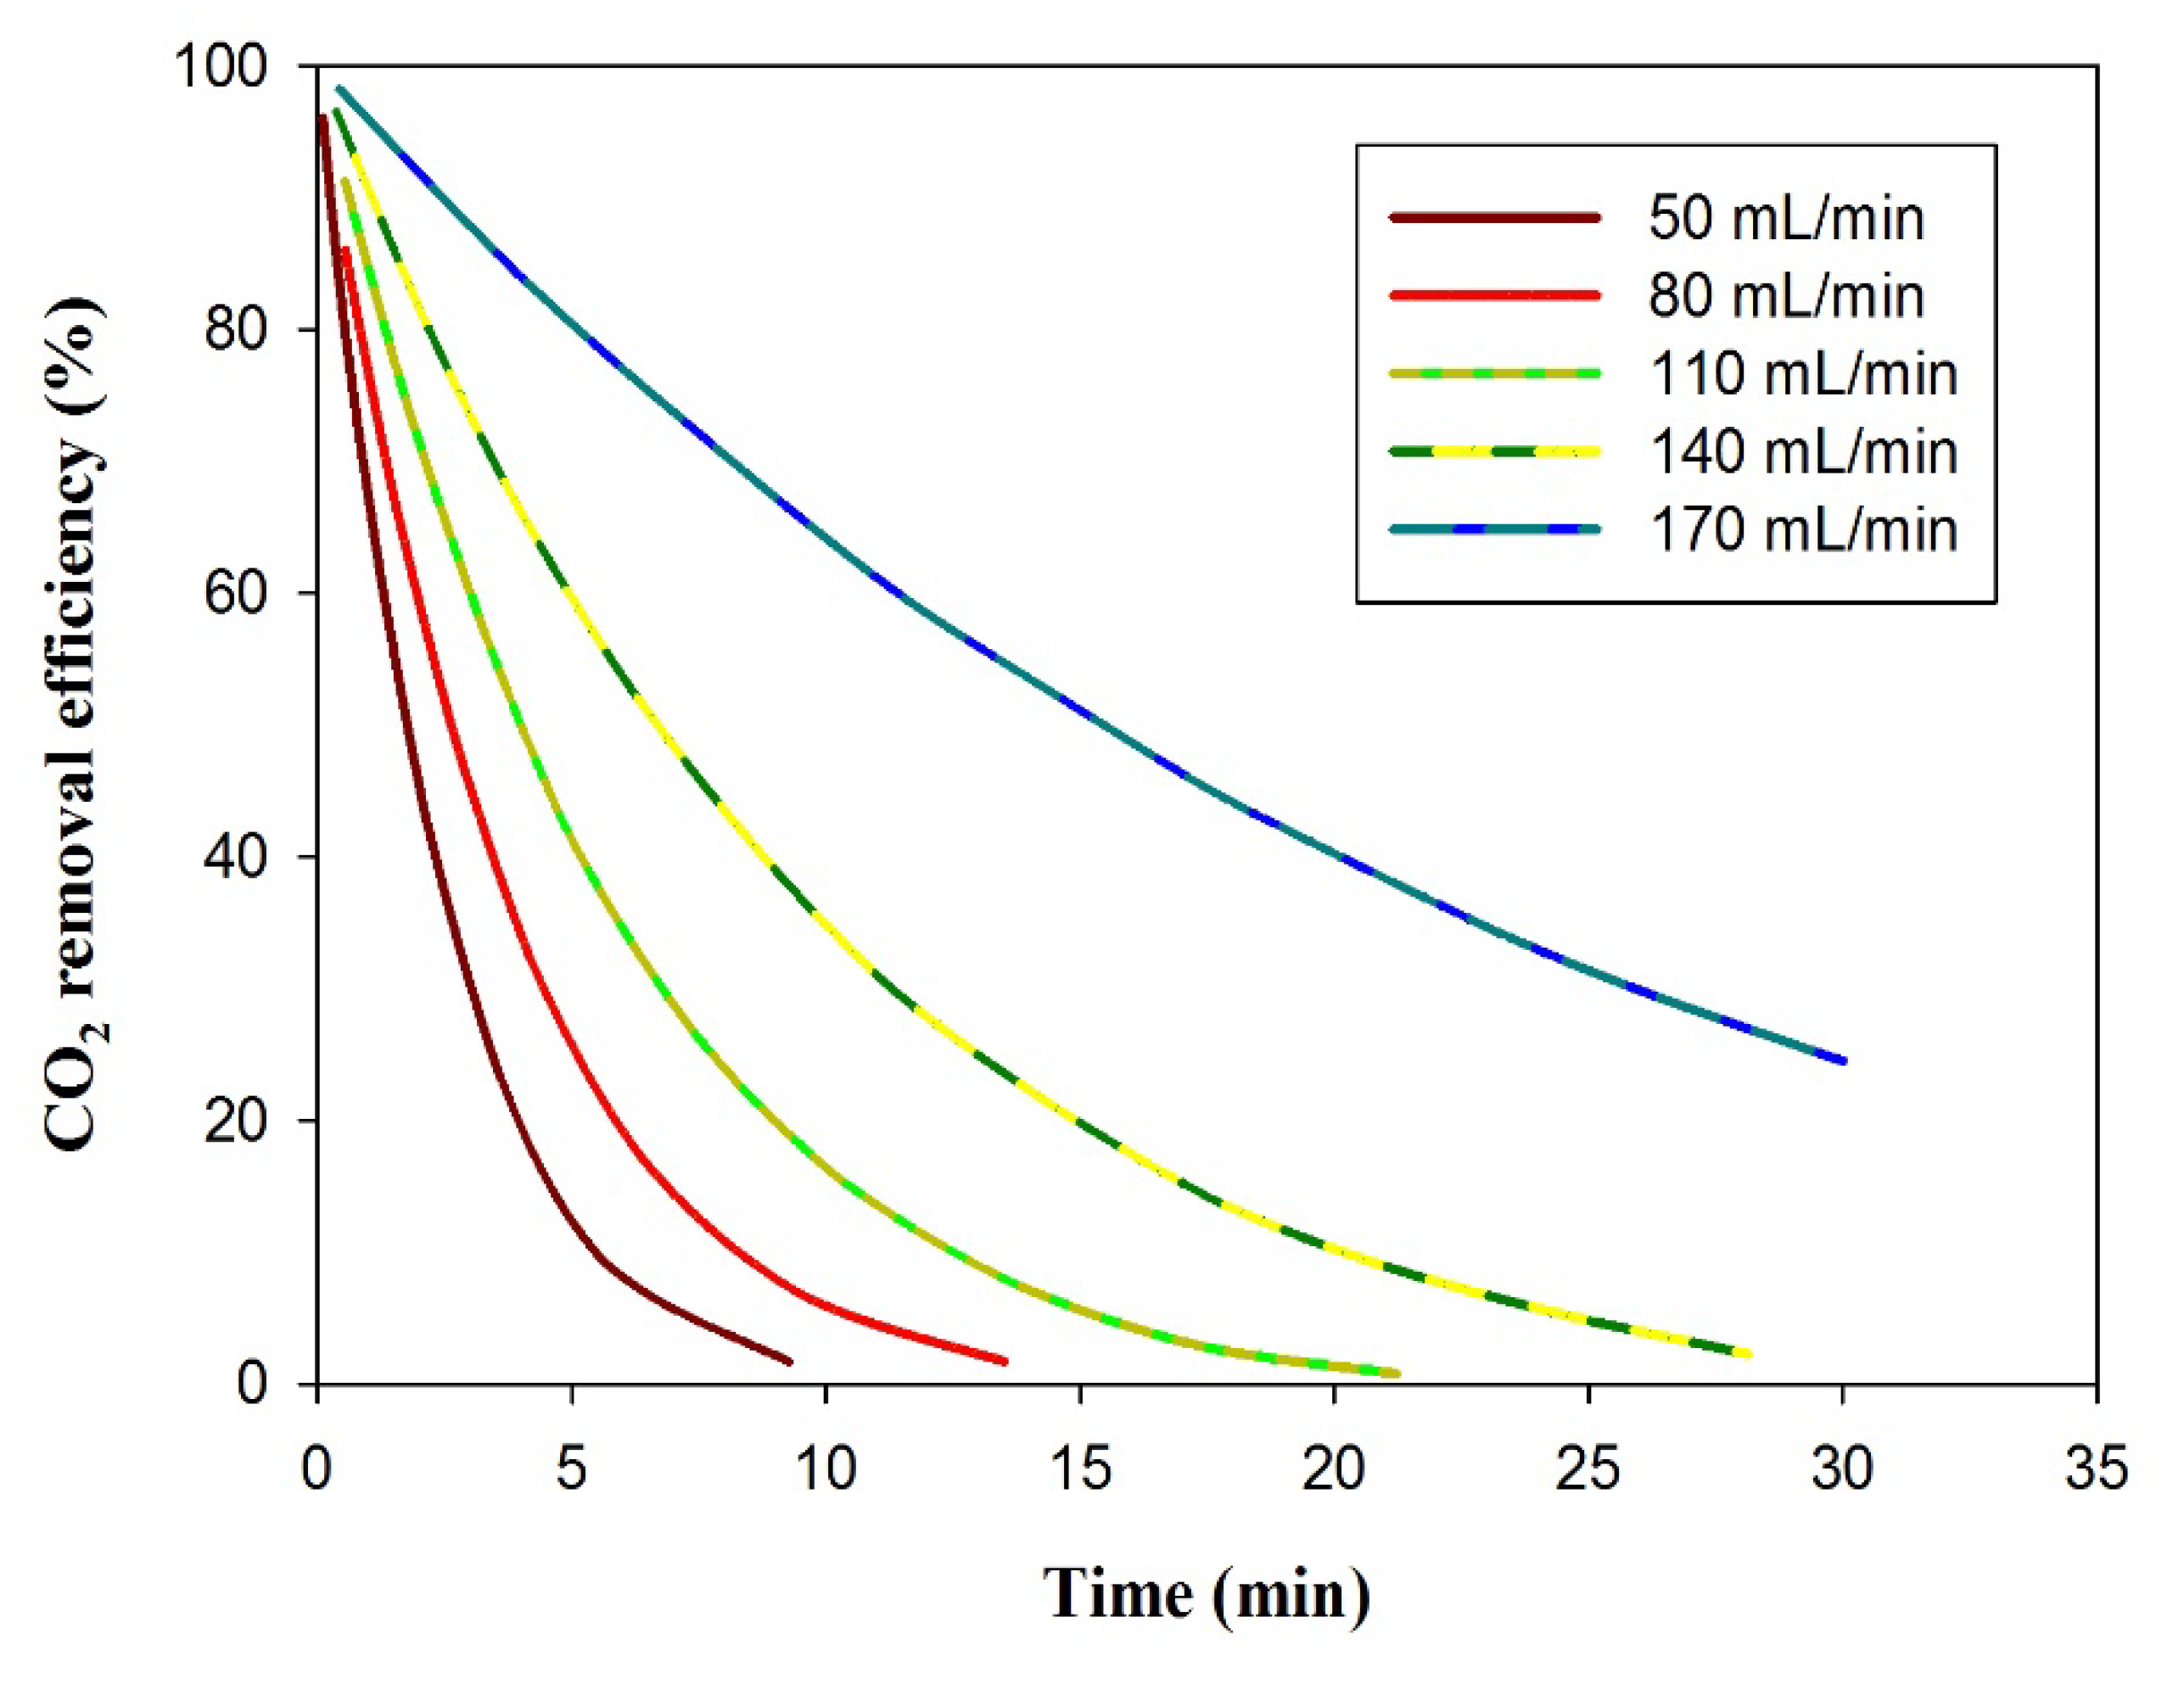
Figure 4 describes the effect of the solvent flow rate in the absorption unit with time. At a low liquid circulation rate (50 mL/min), no noticeable percentages of CO2 removal were observed after 10 min of operation due to the consumption of PG accessible for CO2 absorption. As the fresh solvent circulation rate increased to 110 mL/min, the reachable solvent to remove more CO2 increased. After 30 min of operation, and a solvent circulation rate of 170 mL/min, 30% CO2 removal efficiency was reached. This phenomenon is expected because when the solvent circulation amount increases, there is sufficient fresh solvent in the membrane to capture more CO2 gas.
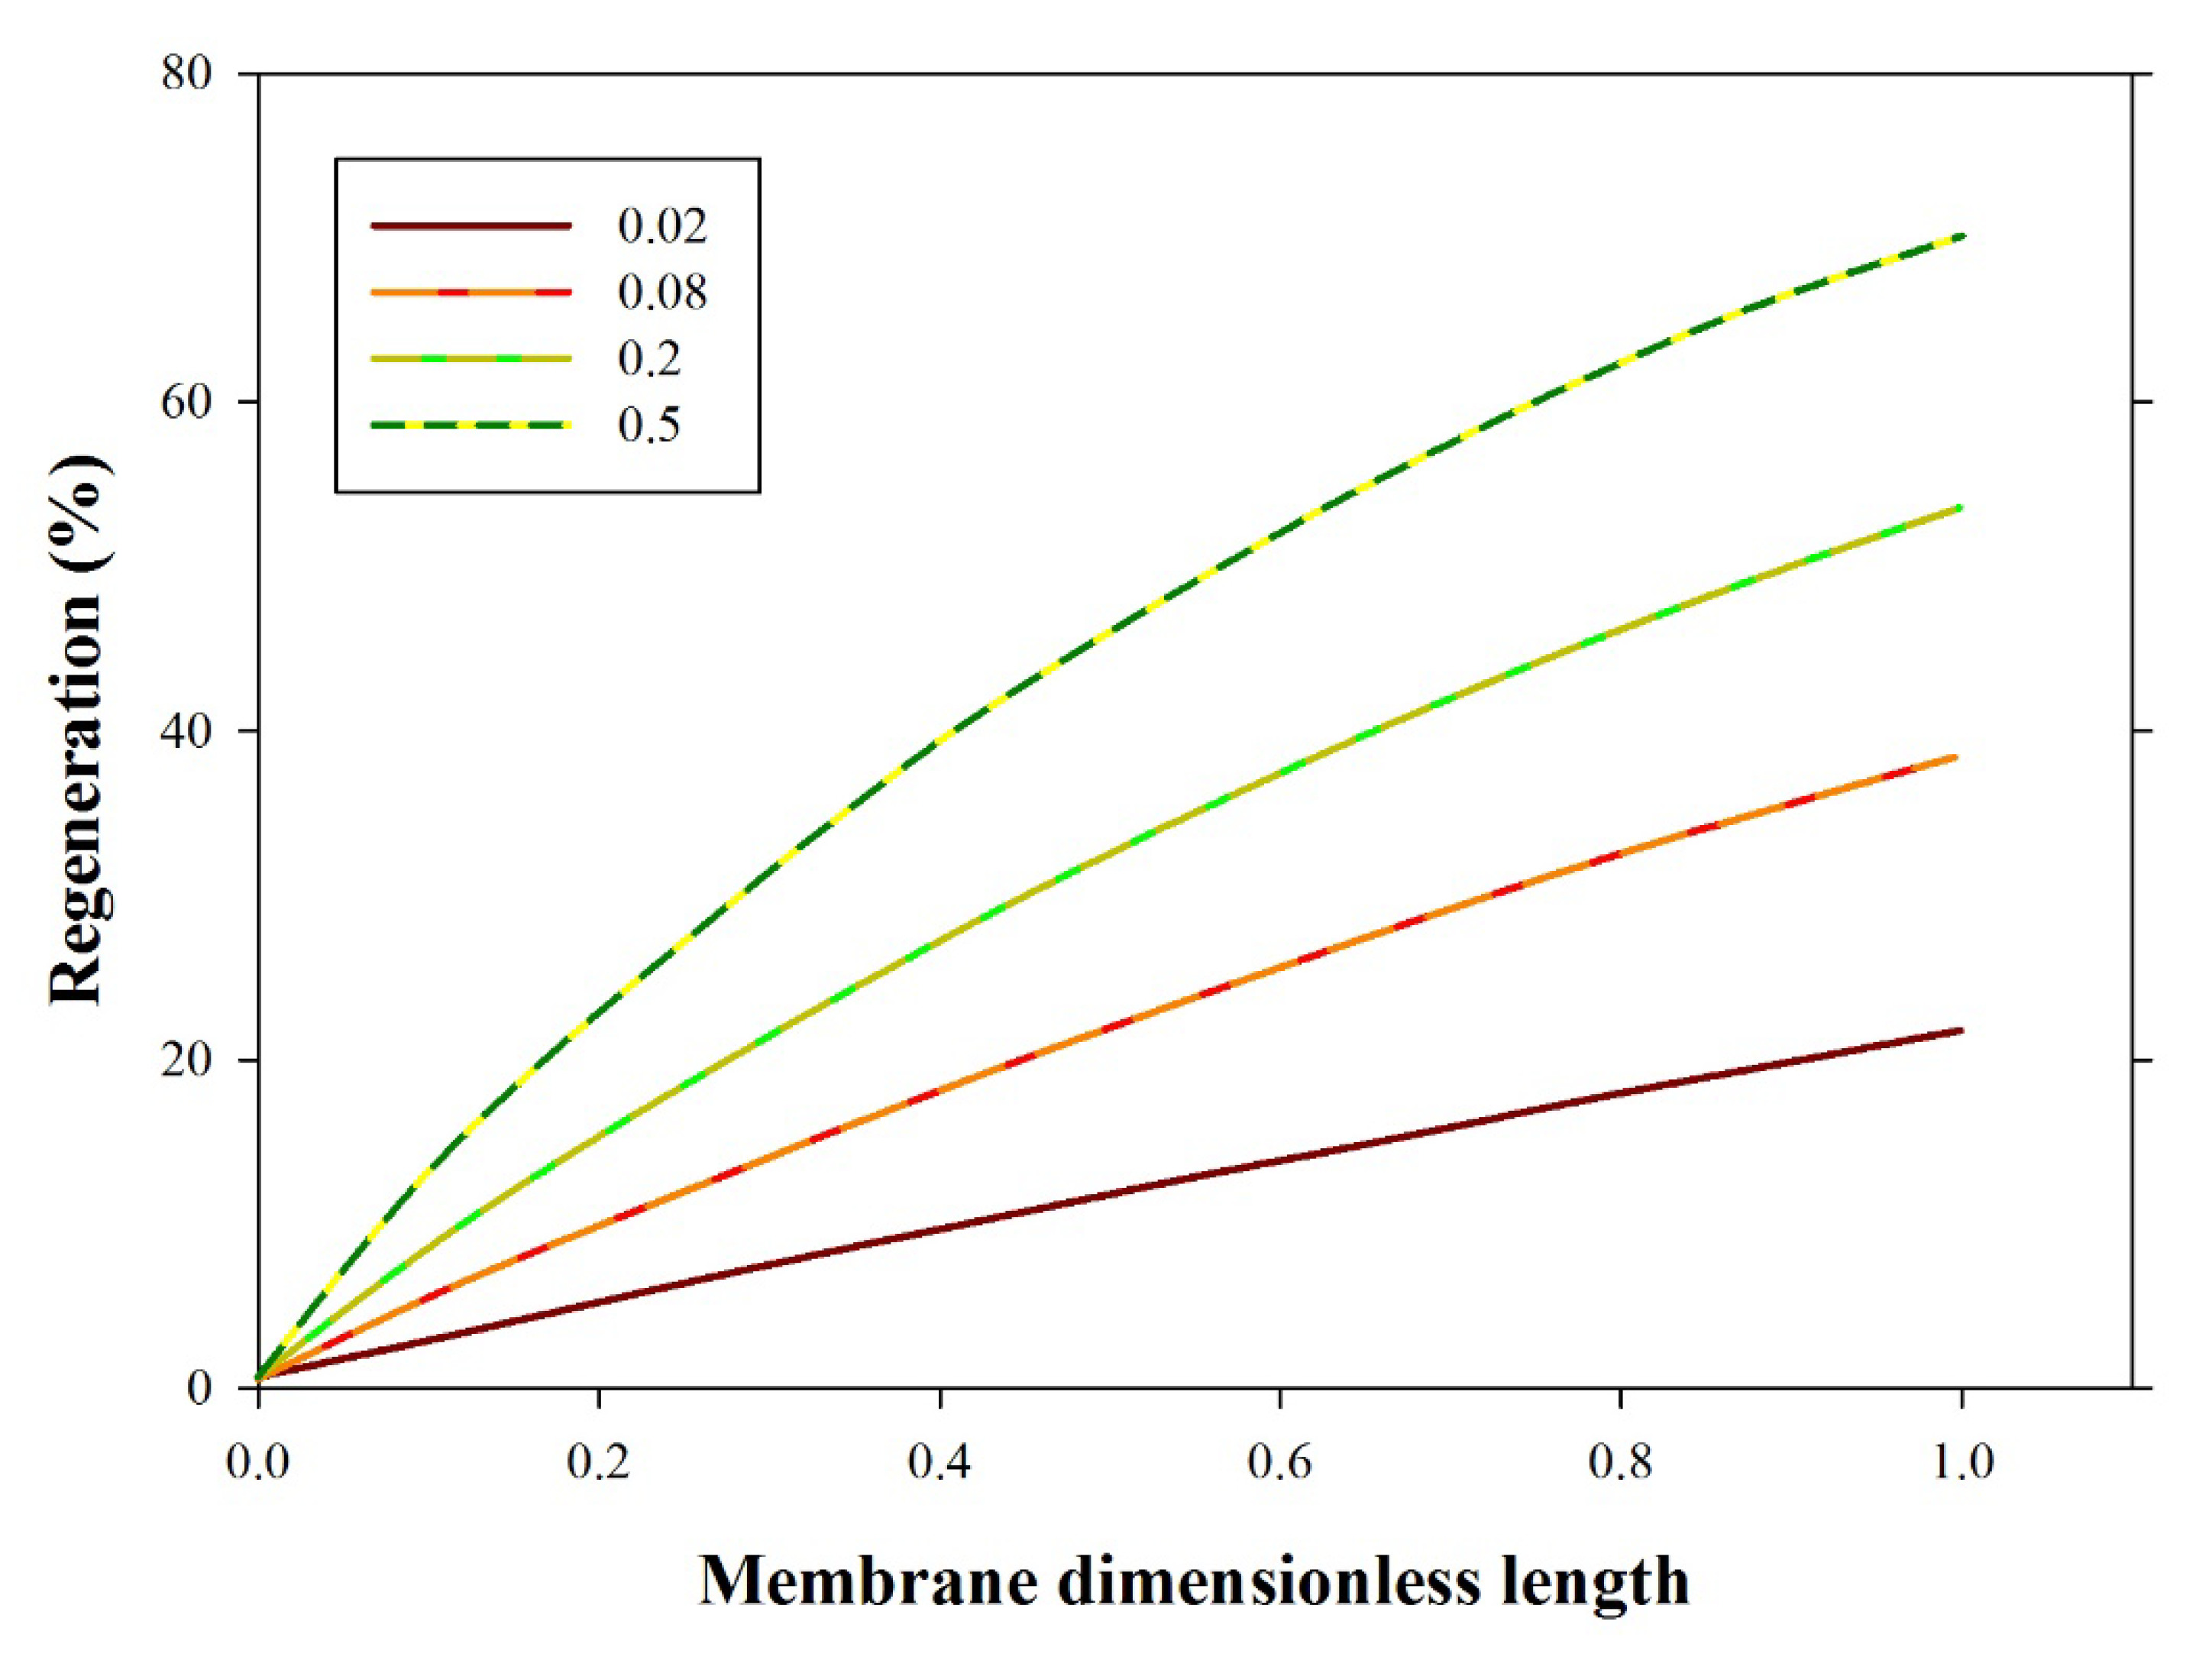
The stripping efficiency as a function of CO2 loading in aqueous PG is demonstrated in Figure 5. The results revealed that the stripping efficiency increased with CO2 loading. Regeneration efficiency increased with increased initial CO2 loading. That is attributed to an increased CO2 concentration gradient. Based on Fick’s first law, the molar flux is directly proportional to the gradient of the CO2 concentration. Accordingly, the increase in the initial concentration of CO2 in rich solvent increases regeneration efficiency; simulation predictions agree with previously published work [43,44,45,46].
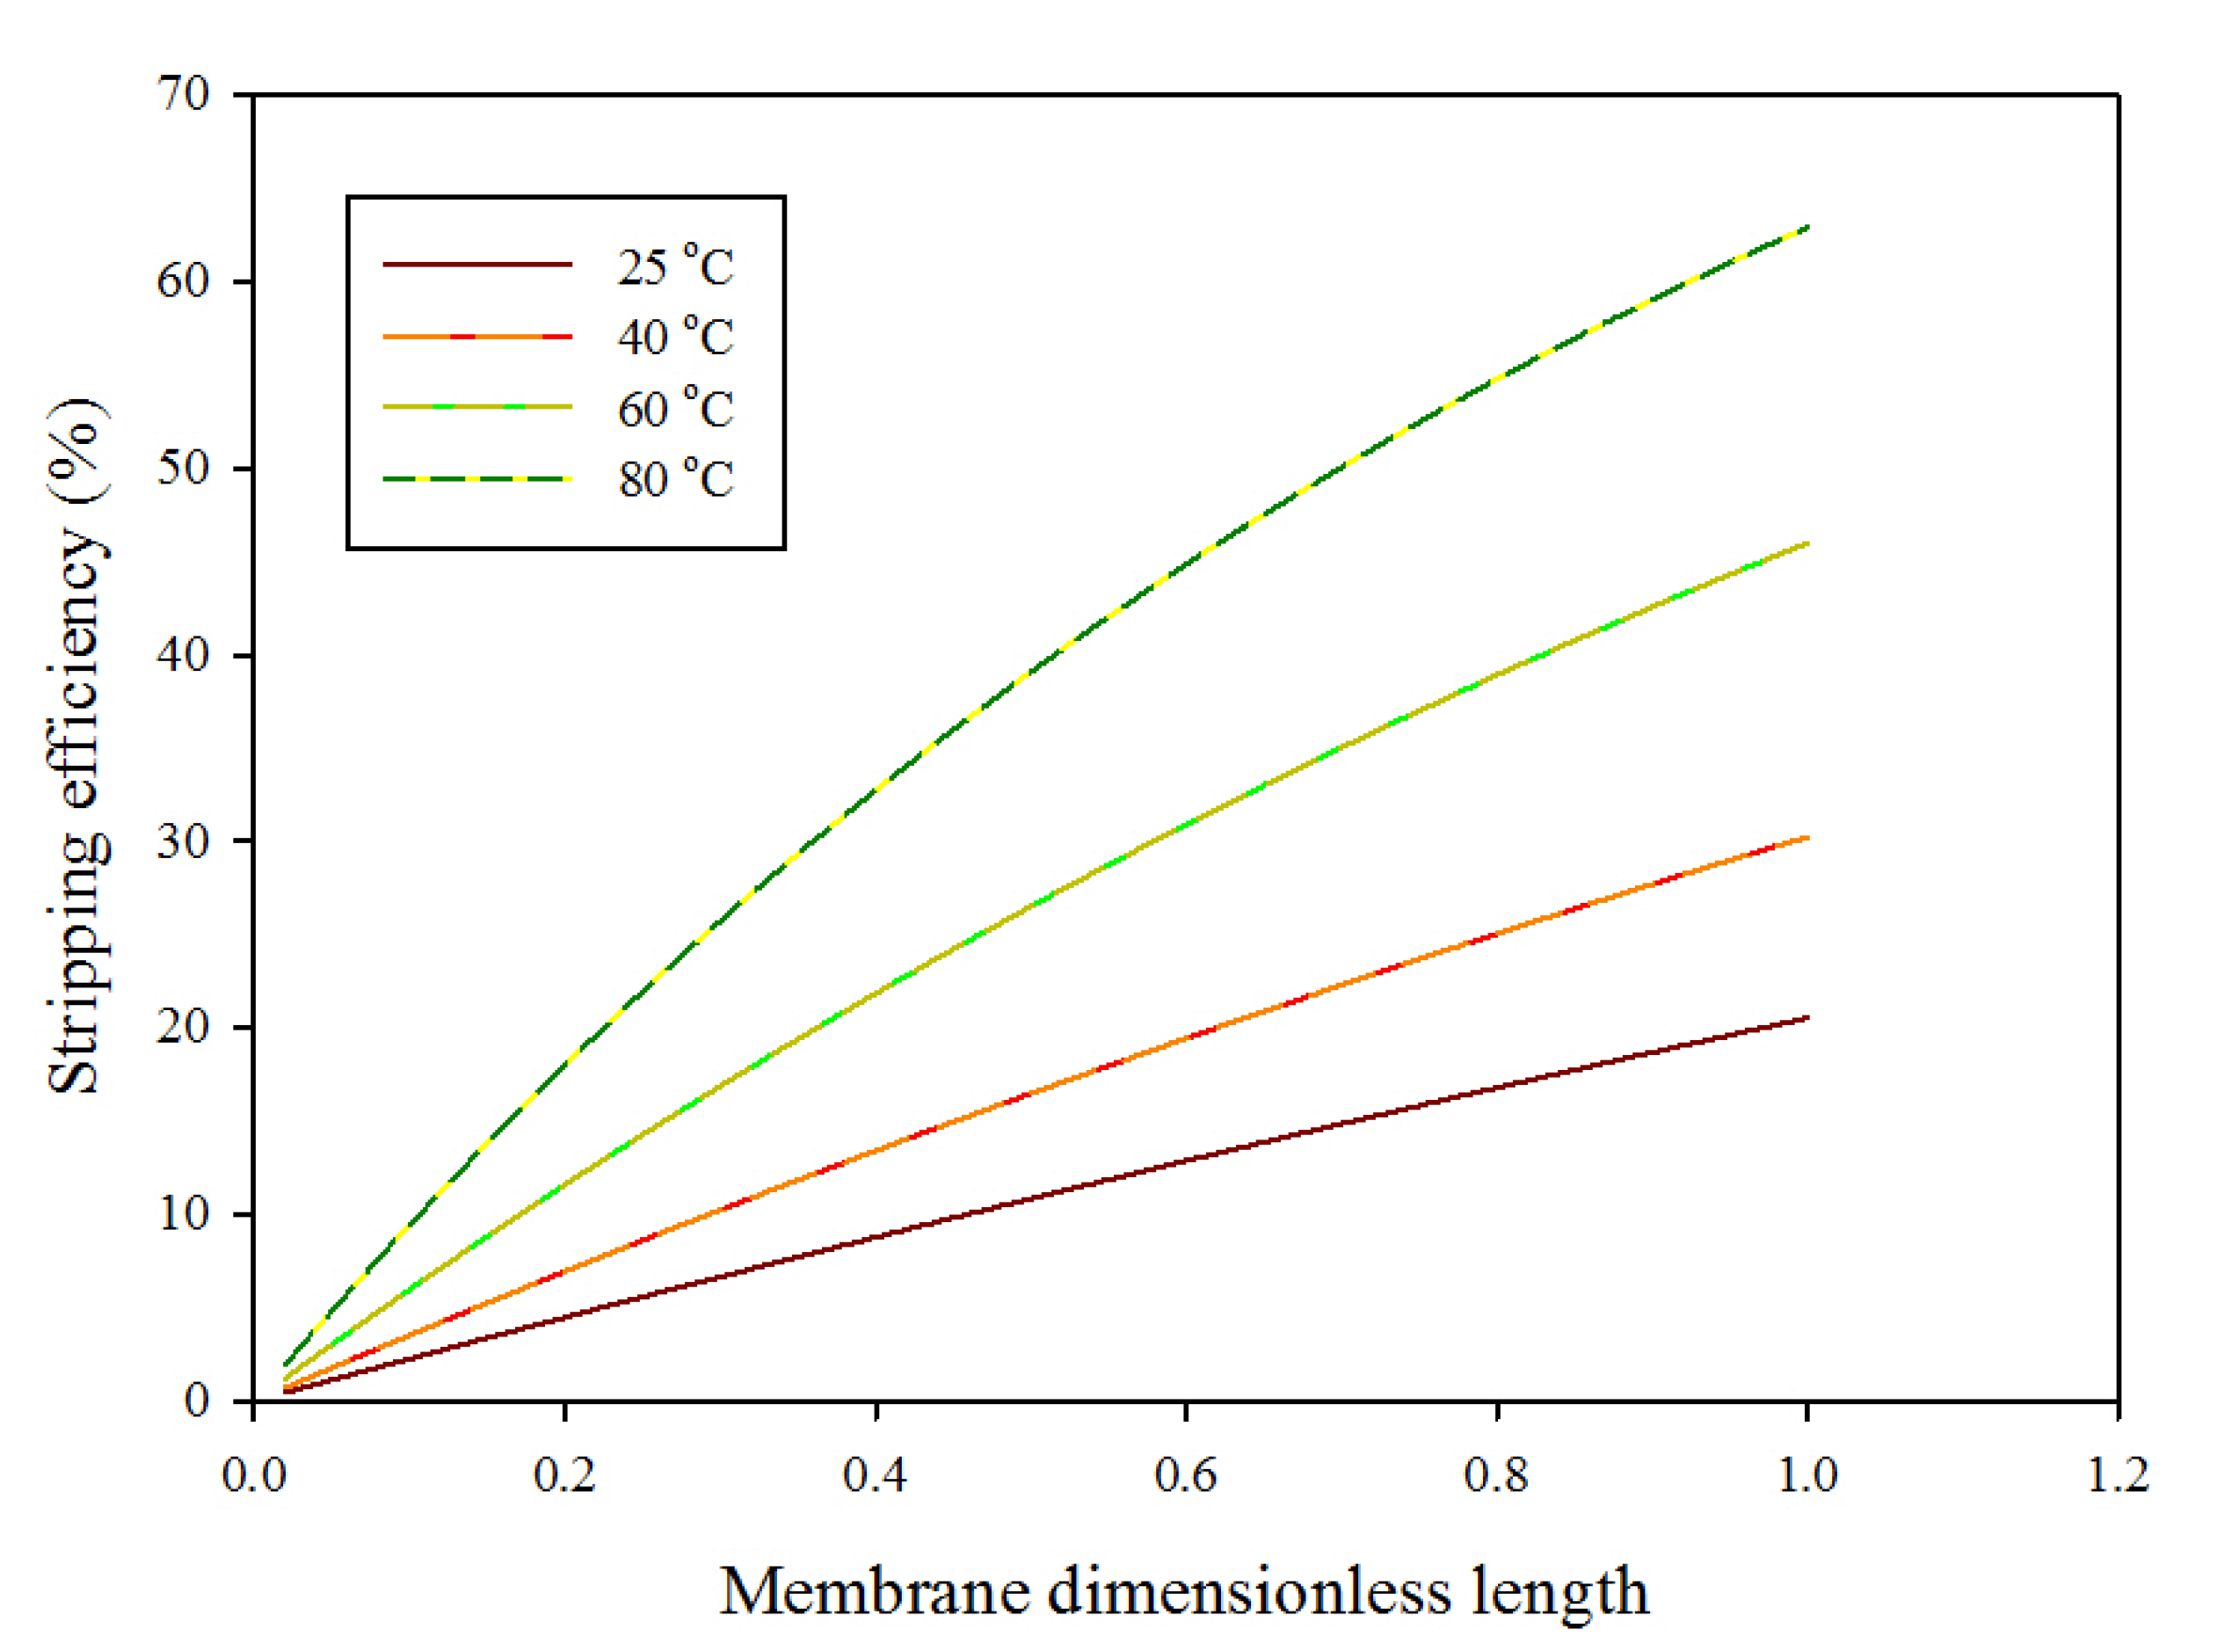
The influence of rich solvent inlet temperature on regeneration efficiency along membrane dimensionless length is illustrated in Figure 6. As the stripping temperature of rich solvent increases, stripping efficiency increases. That is accredited to the decrease of CO2 solubility in rich solvent with temperature; CO2 solubility is inversely proportional to the temperature of solvent. At high temperatures, the dissolved CO2 in the rich solvent escapes and increases the stripping driving force of CO2 mass transfer, and more CO2 released leads to higher CO2 stripping efficiency [1].
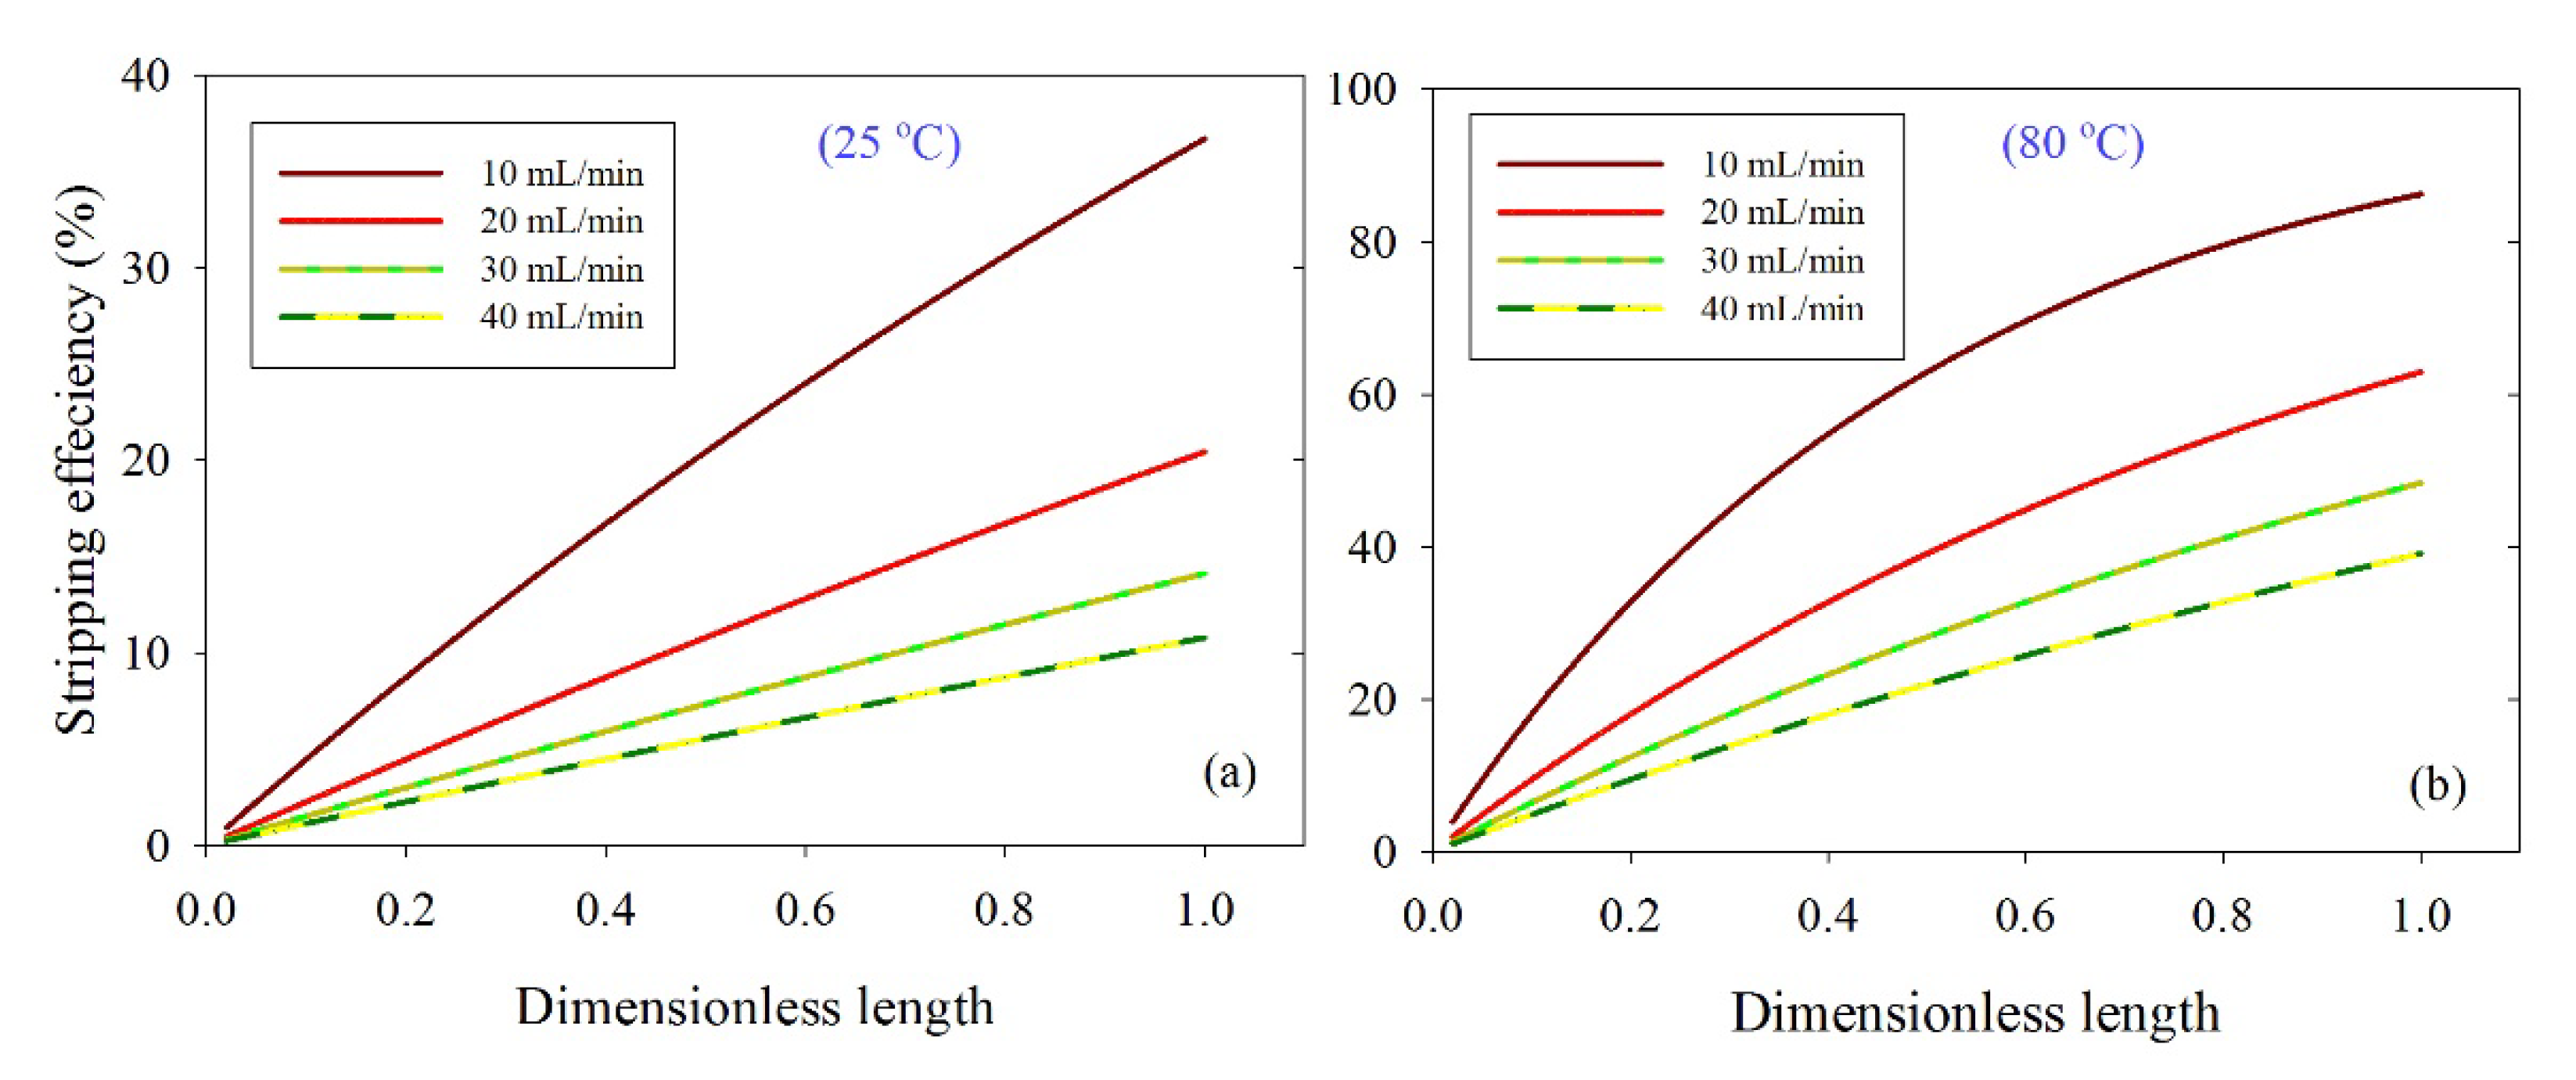
The effect of solvent liquid flow rate on stripping efficiency along the membrane dimensionless length at 25 and 80 °C is depicted in Figure 7. Results revealed that the increase in solvent flow rate at low temperature (25 °C) has an insignificant increase in the CO2 stripping efficiency; by contrast, at high temperatures, there is a significant increase in the stripping efficiency. That is attributed to the noteworthy impact of temperature on the CO2 solubility of absorbed CO2 in liquid solvents. As previously mentioned, the CO2 solubility is inversely proportional to temperature. Hence at high temperatures, the CO2 solubility decreases and CO2 escapes from the solvent and is brushed by nitrogen-sweeping gas.
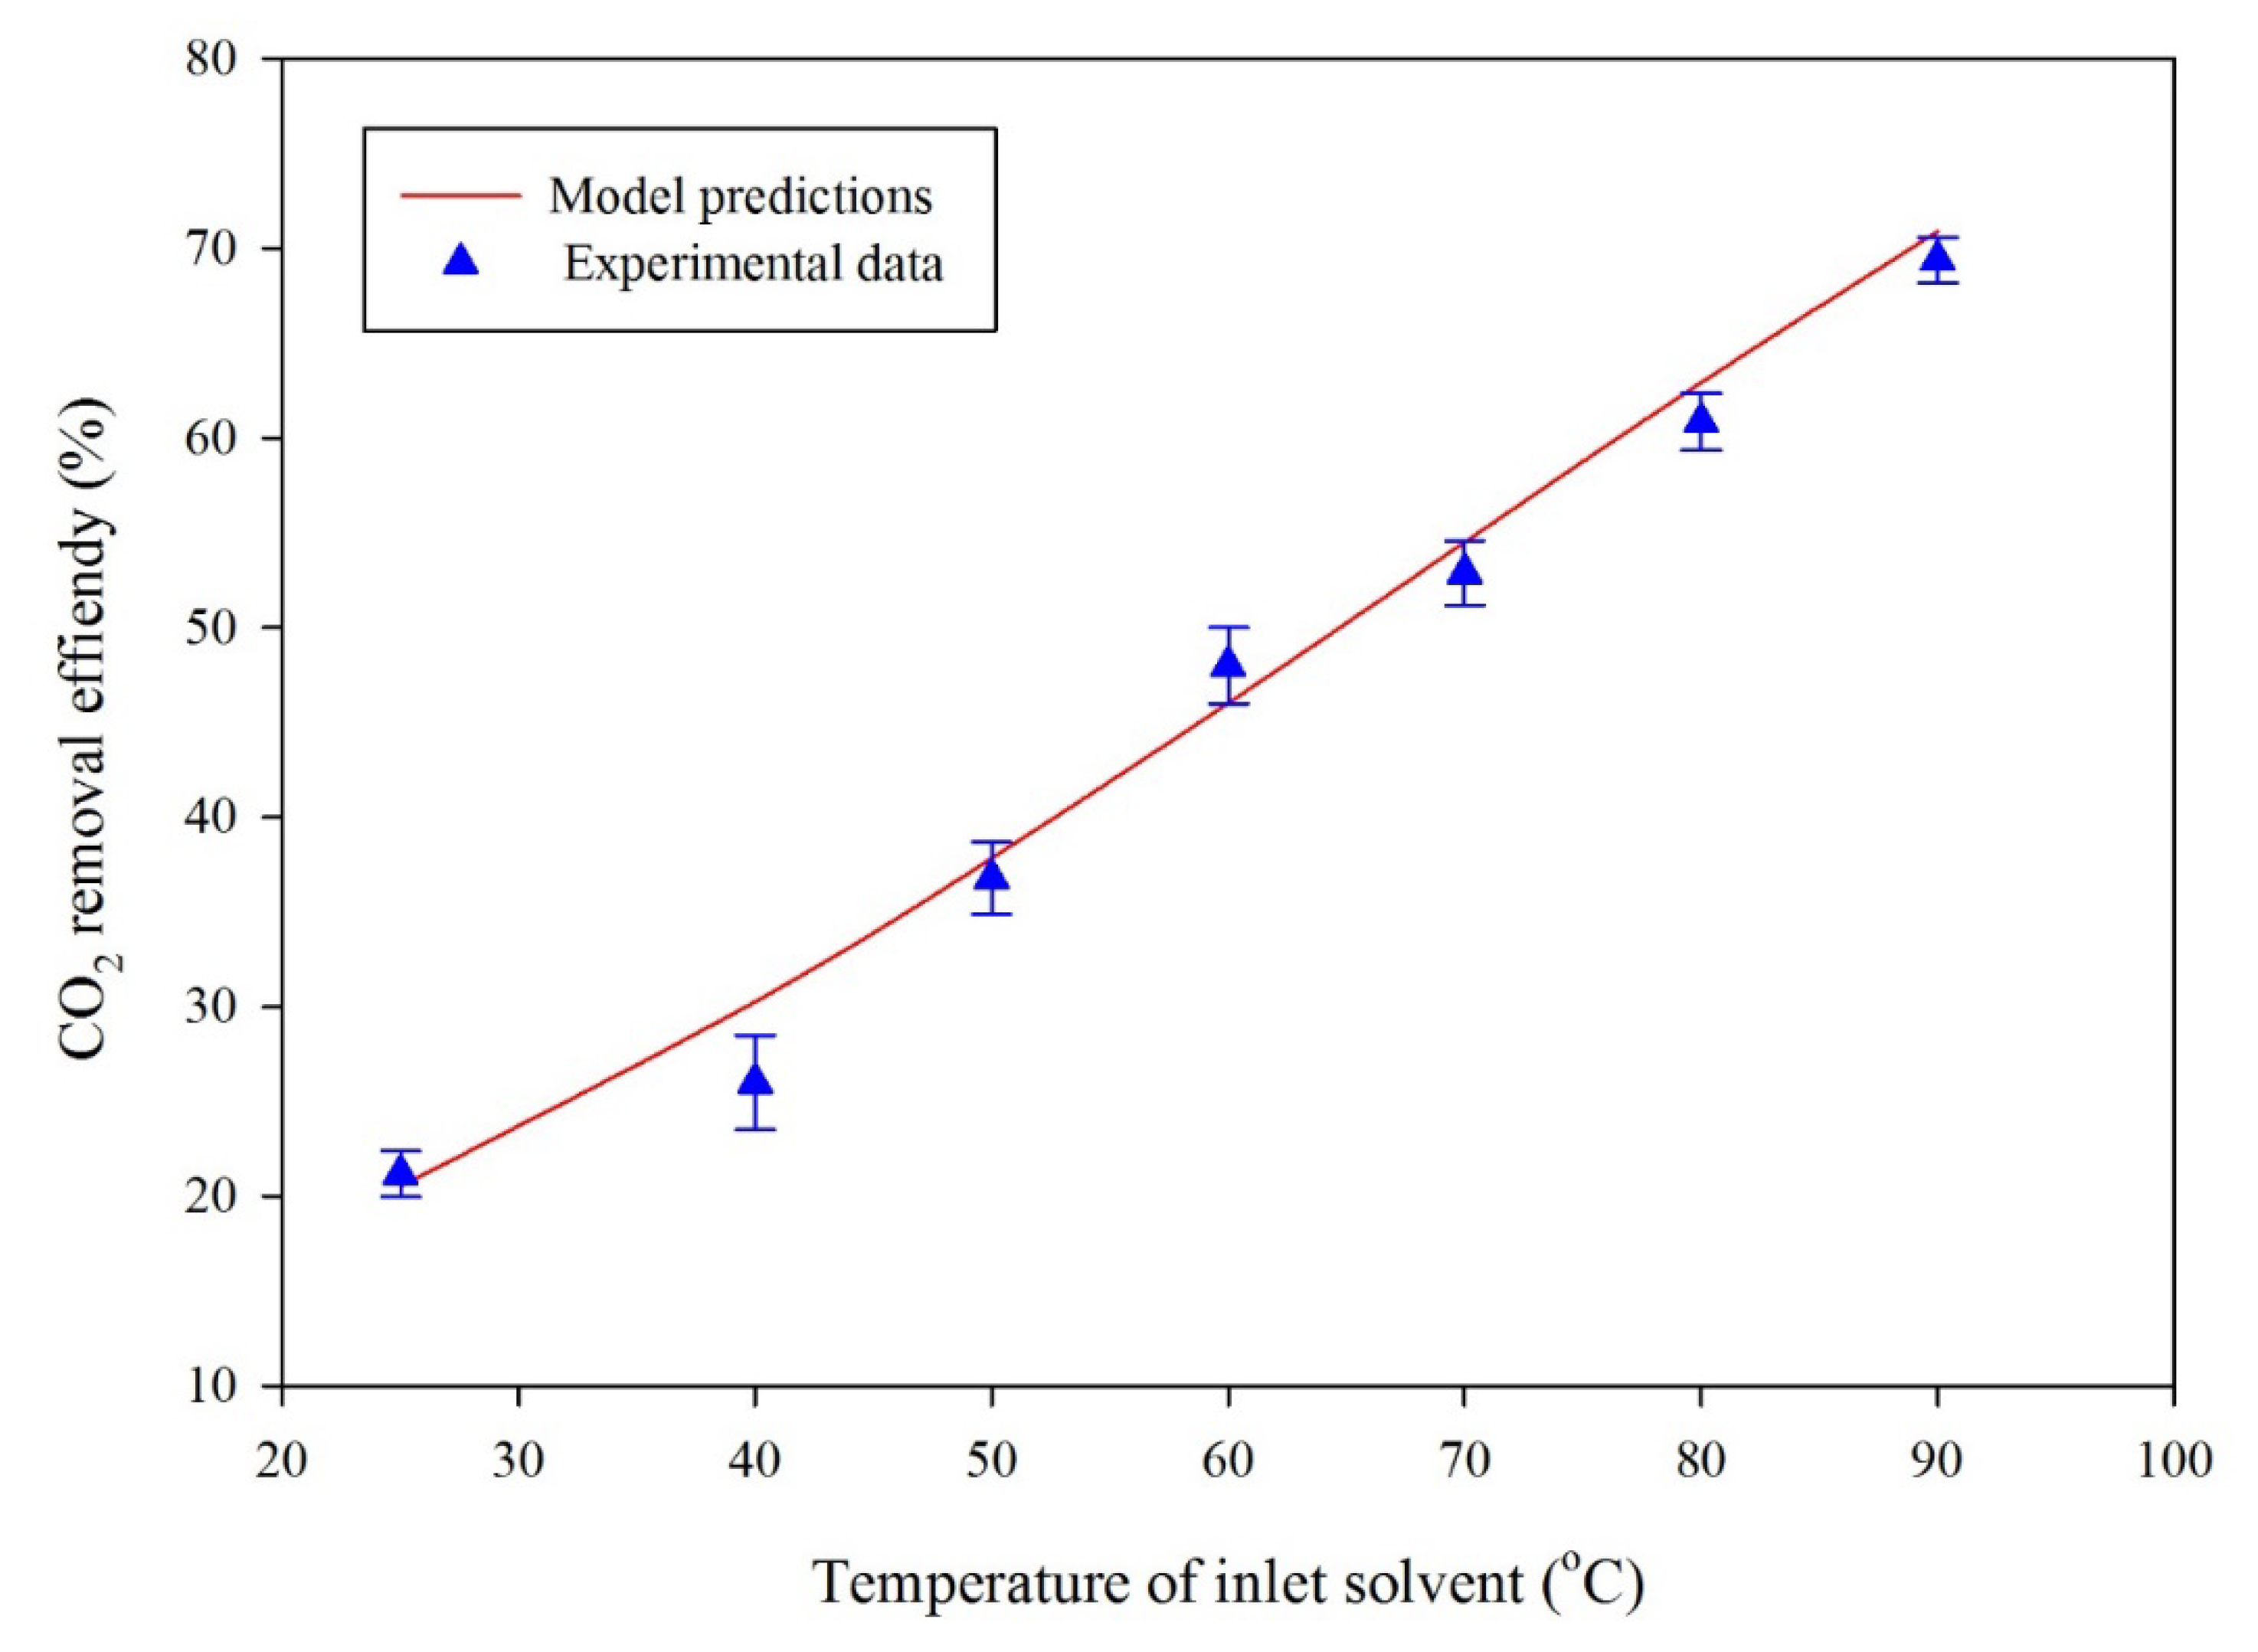
For the model validation, the experimental data of the CO2 percent removal efficiency as a function of temperature (Figure 8) and CO2 removal flux as a function of liquid feed flow rate (Figure 9) were plotted and compared with the simulation predictions. The experimental results are presented with standard error bars. Figure 8 illustrates the influence of rich solvent temperature on the percentage removal of CO2. The experimental results agreed with simulation predictions. As the PG rich solvent temperature increases, the removal percentage of CO2 increases due to decreasing CO2 solubility in liquid with temperature.
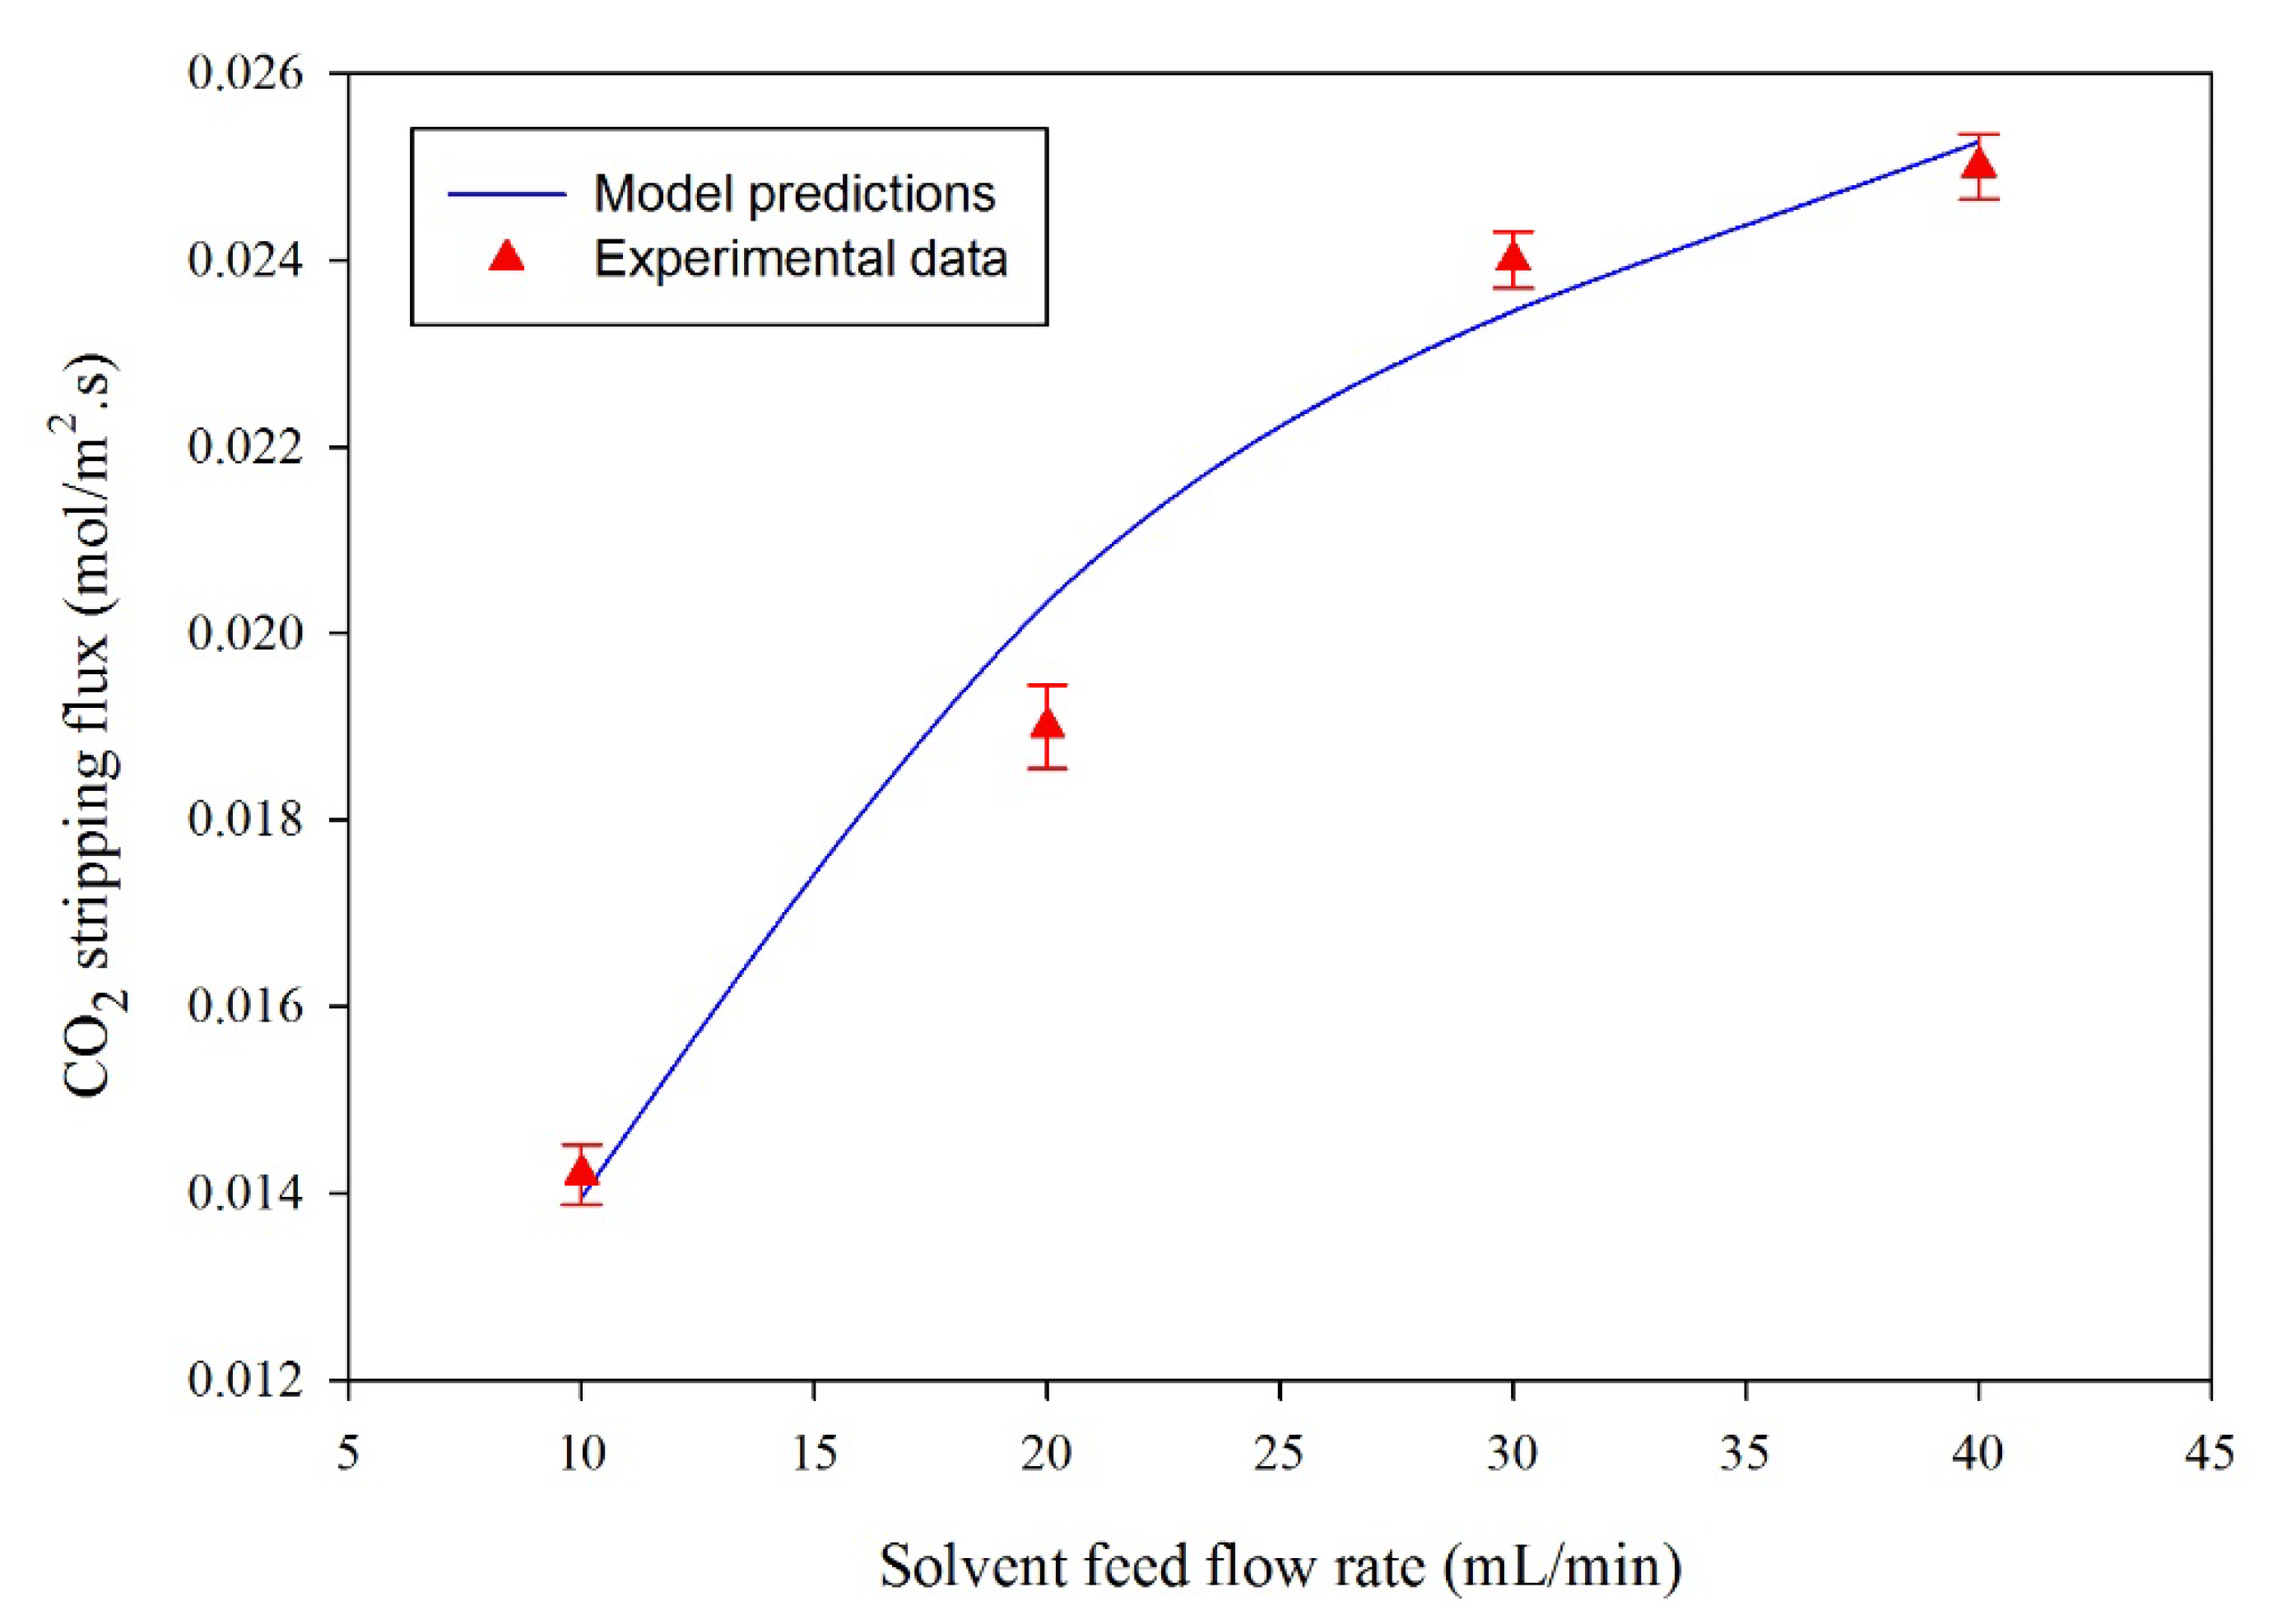
Figure 9 illustrates the comparison between experimental data and simulation results for the effect of the solvent circulation rate on CO2 stripping flux. The temperature and gas feed rate were kept constant at 80 °C and 100 mL/min, respectively. The experimental results were presented with standard error bars. Based on the experimental error bars in Figure 8 and Figure 9, the experimental results and simulation predictions were in good agreement between the experimental and simulation results. The percent efficiency was calculated as follows:
The CO2 stripping flux is calculated as per Equation (47):
where the is the inlet gas feed rate (m3/s), A is the total hollow fiber surface area
L is the length of the hollow fiber and n is the total number of fibers, and are the inlet and exit CO2 concentrations at experimental temperature and pressure in mol/m3.
4. Conclusions
The absorption of CO2 in lean aqueous PG and the stripping of CO2 from rich PG were simultaneous modeled and solved using COMSOL Multiphysics version 5.5. The trend of the model predictions were in good agreement with experimental data. Results revealed that the stripping efficiency was enhanced with increased solvent temperature, solvent circulation rate, and CO2 initial concentration in rich solvent. The effect of the solvent circulation rate on stripping efficiency at low temperature was insignificant; by contrast, there is ra emarkable increase in the stripping efficiency with the solvent circulation rate at high solvent temperature. A high solvent circulation rate increases the efficient stripping time of the absorption/stripping solvent–gas membrane contactor module.
Funding
This research received no external funding.
Conflicts of Interest
The authors declare no conflict of interest.
References
- Rahim, N.A.; Ghasem, N.; Al-Marzouqi, M. Stripping of CO2 from different aqueous solvents using PVDF hollow fiber membrane contacting process. J. Nat. Gas Sci. Eng. 2014, 21, 886–893. [Google Scholar] [CrossRef]
- Li, J.L.; Chen, B.H. Review of CO2 absorption using chemical solvents in hollow fiber membrane contactors. Sep. Purif. Technol. 2005, 41, 109–122. [Google Scholar] [CrossRef]
- Rahim, N.A.; Ghasem, N.; Al-Marzouqi, M. Absorption of CO2 from natural gas using different amino acid salt solutions and regeneration using hollow fiber membrane contactors. J. Nat. Gas Sci. Eng. 2015, 26, 108–117. [Google Scholar] [CrossRef]
- Chen, P.C.; Lin, S.Z. Optimization in the absorption and desorption of CO2 using sodium glycinate solution. Appl. Sci. 2018, 8, 2041. [Google Scholar] [CrossRef] [Green Version]
- Khalilpour, R.; Mumford, K.; Zhai, H.; Abbas, A.; Stevens, G.; Rubin, E.S. Membrane-based carbon capture from flue gas: a review. J Clean. Prod. 2015, 103, 286–300. [Google Scholar] [CrossRef]
- Van Holst, J.; Versteeg, G.F.; Brilman, D.W.F.; Hogendoorn, J.A. Kinetic study of CO2 with various amino acid salts in aqueous solution. Chem. Eng. Sci. 2009, 64, 59–68. [Google Scholar] [CrossRef]
- Paul, S.; Thomsen, K. Kinetics of absorption of carbon dioxide into aqueous potassium salt of proline. Int. J. Greenh. Gas Control 2012, 8, 169–179. [Google Scholar] [CrossRef]
- Shen, S.; Yang, Y.N.; Bian, Y.; Zhao, Y. Kinetics of CO2 Absorption into Aqueous Basic Amino Acid Salt: Potassium Salt of Lysine Solution. Environ. Sci. Technol. 2016, 50, 2054–2063. [Google Scholar] [CrossRef]
- Lee, S.; Song, H.J.; Maken, S.; Park, J.W. Kinetics of CO2 absorption in aqueous sodium glycinate solutions. Ind. Eng. Chem. Res. 2007, 46, 1578–1583. [Google Scholar] [CrossRef]
- Portugal, A.F.; Sousa, J.M.; Magalhães, F.D.; Mendes, A. Solubility of carbon dioxide in aqueous solutions of amino acid salts. Chem. Eng. Sci. 2009, 64, 1993–2002. [Google Scholar] [CrossRef]
- Mosadegh-Sedghi, S.; Rodrigue, D.; Brisson, J.; Iliuta, M.C.; Mavroudi, M.; Kaldis, S.P.; Sakellaropoulos, G.P.; Mosadegh-Sedghi, S.; Rodrigue, D.; Brisson, J.; et al. Wetting phenomenon in membrane contactors – Causes and prevention. J. Membr. Sci. 2014, 452, 332–353. [Google Scholar] [CrossRef]
- Shen, S.; Yang, Y.; Wang, Y.; Ren, S.; Han, J.; Chen, A. CO2 absorption into aqueous potassium salts of lysine and proline: Density, viscosity and solubility of CO2. Fluid Phase Equilibria 2015, 399, 40–49. [Google Scholar] [CrossRef]
- Mosadegh-Sedghi, S.; Félix, S.; Mendes, A. Determination of CO2 Absorption Kinetics in Amino Acid Salts Solutions Using Membrane Contactors. Int. J. Membr. Sci. Technol. 2017, 4, 8–18. [Google Scholar]
- Simons, K.; Brilman, W.; Mengers, H.; Nijmeijer, K.; Wessling, M. Kinetics of CO2 absorption in aqueous sarcosine salt solutions: Influence of concentration, temperature, and CO2 loading. Ind. Eng. Chem. Res. 2010, 49, 9693–9702. [Google Scholar] [CrossRef]
- Zanganeh, K.E.; Shafeen, A.; Salvador, C. CO2 Capture and Development of an Advanced Pilot-Scale Cryogenic Separation and Compression Unit. Energy Procedia 2009, 1, 247–252. [Google Scholar] [CrossRef] [Green Version]
- Nakhjiri, A.T.; Heydarinasab, A.; Bakhtiari, O.; Mohammadi, T. Modeling and simulation of CO2 separation from CO2/CH4 gaseous mixture using potassium glycinate, potassium argininate and sodium hydroxide liquid absorbents in the hollow fiber membrane contactor. J. Environ. Chem. Eng. 2018, 6, 1500–1511. [Google Scholar] [CrossRef]
- Demontigny, D.; Tontiwachwuthikul, P.; Chakma, A. Comparing the absorption performance of packed columns and membrane contactors. Ind. Eng. Chem. Res. 2005, 44, 5726–5732. [Google Scholar] [CrossRef]
- Karoor, S.; Sirkar, K.K. Gas Absorption Studies in Microporous Hollow Fiber Membrane Modules. Ind. Eng. Chem. Res. 1993, 32, 674–684. [Google Scholar] [CrossRef]
- Ghasem, N.; Al-Marzouqi, M. Modeling and experimental study of carbon dioxide absorption in a flat sheet membrane contactor. J. Membr. Sci. Res. 2017, 3, 57–63. [Google Scholar]
- Lu, J.G.; Hua, A.C.; Xu, Z.W.; Li, J.T.; Liu, S.Y.; Wang, Z.L.; Zhao, Y.L.; Pan, C. CO2 capture by membrane absorption coupling process: Experiments and coupling process evaluation. J. Membr. Sci. 2013, 431, 9–18. [Google Scholar] [CrossRef]
- Li, Y.; Wang, L.; Tan, Z.; Zhang, Z.; Hu, X. Experimental studies on carbon dioxide absorption using potassium carbonate solutions with amino acid salts. Sep. Purif. Technol. 2019, 219, 47–54. [Google Scholar] [CrossRef]
- Naim, R.; Khulbe, K.C.C.; Ismail, A.F.F.; Matsuura, T. Characterization of PVDF hollow fiber membrane for CO2 stripping by atomic force microscopy analysis. Sep. Purif. Technol. 2013, 109, 98–106. [Google Scholar] [CrossRef] [Green Version]
- Shen, S.; Zhao, Y.; Bian, Y.; Wang, Y.; Guo, H.; Li, H. CO2 absorption using aqueous potassium lysinate solutions: Vapor―Liquid equilibrium data and modelling. J. Chem. Thermodyn. 2017, 115, 209–220. [Google Scholar] [CrossRef]
- Mansourizadeh, A.; Ismail, A.F. CO2 stripping from water through porous PVDF hollow fiber membrane contactor. Desalination 2011, 273, 386–390. [Google Scholar] [CrossRef]
- Rahbari-Sisakht, M.; Rana, D.; Matsuura, T.; Emadzadeh, D.; Padaki, M.; Ismail, A.F. Study on CO2 stripping from water through novel surface modified PVDF hollow fiber membrane contactor. Chem. Eng. J. 2014, 246, 306–310. [Google Scholar] [CrossRef]
- Hashemifard, S.A.; Ahmadi, H.; Ismail, A.F.; Moarefian, A.; Abdullah, M.S. The effect of heat treatment on hollow fiber membrane contactor for CO2 stripping. Sep. Purif. Technol. 2019, 223, 186–195. [Google Scholar] [CrossRef]
- Masoumi, S.; Rahimpour, M.R.; Mehdipour, M. Removal of carbon dioxide by aqueous amino acid salts using hollow fiber membrane contactors. J. Co2 Util. 2016, 16, 42–49. [Google Scholar] [CrossRef]
- Salvinder, K.M.S.; Zabiri, H.; Taqvi, S.A.; Ramasamy, M.; Isa, F.; Rozali, N.E.M.; Suleman, H.; Maulud, A.; Shariff, A.M. An overview on control strategies for CO2 capture using absorption/stripping system. Chem. Eng. Res. Des. 2019, 147, 319–337. [Google Scholar] [CrossRef]
- Yan, S.; Cui, Q.; Xu, L.; Tu, T.; He, Q. Reducing CO2 regeneration heat requirement through waste heat recovery from hot stripping gas using nanoporous ceramic membrane. Int. J. Greenh. Gas Control 2019, 82, 269–280. [Google Scholar] [CrossRef]
- Seibert, F.; Wilson, I.; Lewis, C.; Rochelle, G. Effective Gas/Liquid Contact Area of Packing for CO2 absoprtion/stripping. In Greenhouse Gas Control Technologies; Elsevier Science Ltd.: Amsterdam, The Netherlands, 2005; ISBN 9780080447049. [Google Scholar]
- Naim, R.; Ismail, A.F. Effect of polymer concentration on the structure and performance of PEI hollow fiber membrane contactor for CO2 stripping. J. Hazard. Mater. 2013, 250–251, 354–361. [Google Scholar] [CrossRef]
- Bakeri, G.; Ismail, A.F.; Shariaty-Niassar, M.; Matsuura, T. Effect of polymer concentration on the structure and performance of polyetherimide hollow fiber membranes. J. Membr. Sci. 2010, 363, 103–111. [Google Scholar] [CrossRef]
- Yang, X.; Rees, R.J.; Conway, W.; Puxty, G.; Yang, Q.; Winkler, D.A. Computational Modeling and Simulation of CO2 Capture by Aqueous Amines. Chem. Rev. 2017, 117, 9524–9593. [Google Scholar] [CrossRef] [PubMed]
- Sohrabi, M.R.; Marjani, A.; Moradi, S.; Davallo, M.; Shirazian, S. Mathematical modeling and numerical simulation of CO2 transport through hollow-fiber membranes. Appl. Math. Model. 2011, 35, 174–188. [Google Scholar] [CrossRef]
- Valdés, F.J.; Hernández, M.R.; Catalá, L.; Marcilla, A. Estimation of CO2 stripping/CO2 microalgae consumption ratios in a bubble column photobioreactor using the analysis of the pH profiles. Application to Nannochloropsis oculata microalgae culture. Bioresour. Technol. 2012, 119, 1–6. [Google Scholar] [CrossRef]
- Eslami, S.; Mousavi, S.M.; Danesh, S.; Banazadeh, H. Modeling and simulation of CO2 removal from power plant flue gas by PG solution in a hollow fiber membrane contactor. Adv. Eng. Softw. 2011, 42, 612–620. [Google Scholar] [CrossRef]
- Muchan, P.; Narku-Tetteh, J.; Saiwan, C.; Idem, R.; Supap, T. Effect of number of amine groups in aqueous polyamine solution on carbon dioxide (CO2) capture activities. Sep. Purif. Technol. 2017, 184, 128–134. [Google Scholar] [CrossRef]
- Hajilary, N.; Rezakazemi, M. CFD modeling of CO2 capture by water-based nanofluids using hollow fiber membrane contactor. Int. J. Greenh. Gas Control 2018, 77, 88–95. [Google Scholar] [CrossRef]
- Happel, J. Viscous flow relative to arrays of cylinders. Aiche J. 1959, 5, 174–177. [Google Scholar] [CrossRef]
- Ghasem, N. Modeling and Simulation of the Absorption of CO2 and NO2 from a Gas Mixture in a Membrane Contactor. Processes 2019, 7, 441. [Google Scholar] [CrossRef] [Green Version]
- Qazi, S.; Gómez-Coma, L.; Albo, J.; Druon-Bocquet, S.; Irabien, A.; Sanchez-Marcano, J. CO2 capture in a hollow fiber membrane contactor coupled with ionic liquid: Influence of membrane wetting and process parameters. Sep. Purif. Technol. 2020, 233, 115986. [Google Scholar] [CrossRef]
- Ghasem, N. Chemical absorption of CO2 enhanced by nanoparticles using a membrane contactor: Modeling and simulation. Membranes 2019, 9, 150. [Google Scholar] [CrossRef] [PubMed] [Green Version]
- Fougerit, V.; Pozzobon, V.; Pareau, D.; Théoleyre, M.-A.; Stambouli, M. Experimental and numerical investigation binary mixture mass transfer in a gas―Liquid membrane contactor. J. Membr. Sci. 2019, 572, 1–11. [Google Scholar] [CrossRef]
- Zhang, Z.; Yan, Y.; Zhang, L.; Ju, S. Numerical simulation and analysis of CO2 removal in a polypropylene hollow fiber membrane contactor. Int. J. Chem. Eng. 2014, 2014, 256840. [Google Scholar] [CrossRef] [Green Version]
- Wickramasinghe, S.R.; Semmens, M.J.; Cussler, E.L. Mass transfer in various hollow fiber geometries. J. Membr. Sci. 1992, 69, 235–250. [Google Scholar] [CrossRef]
- Hoff, K.A.; Svendsen, H.F. CO2 absorption with membrane contactors vs. packed absorbers- Challenges and opportunities in post combustion capture and natural gas sweetening. Energy Procedia 2013, 37, 952–960. [Google Scholar] [CrossRef] [Green Version]
Figure 1.
Schematic of the absorption/stripping process using a gas–solvent membrane system.

Figure 2.
Schematic of the membrane module used in modeling the absorption/stripping system.

Figure 3.
Surface plot for the CO2 concentration across the membrane module (absorber/stripper) with time. Liquid feed rate 150 mL/min, gas flow rate 20 mL/min, temperature 80 °C.
Figure 3.
Surface plot for the CO2 concentration across the membrane module (absorber/stripper) with time. Liquid feed rate 150 mL/min, gas flow rate 20 mL/min, temperature 80 °C.

Figure 4.
Effect of solvent initial feed rate (50, 80, 110, 140, and 70 mL/min) at constant gas feed rate (10 mL/min) on the CO2 removal efficiency with time.
Figure 4.
Effect of solvent initial feed rate (50, 80, 110, 140, and 70 mL/min) at constant gas feed rate (10 mL/min) on the CO2 removal efficiency with time.

Figure 5.
Stripping efficiency versus membrane dimensionless length at variable CO2 loading in the initial solvent (0.02, 0.08, 0.2, and 0.5 mole CO2/mole PG), liquid flow rate = 10 mL/min, gas flow rate = 100 mL/min).
Figure 5.
Stripping efficiency versus membrane dimensionless length at variable CO2 loading in the initial solvent (0.02, 0.08, 0.2, and 0.5 mole CO2/mole PG), liquid flow rate = 10 mL/min, gas flow rate = 100 mL/min).

Figure 6.
Stripping efficiency versus membrane dimensionless length at variable liquid solvent temperatures (25, 40, 60, and 80 °C); inlet gas flow rate is 600 mL/min and flow rate of inlet solvent is 20 mL/min.
Figure 6.
Stripping efficiency versus membrane dimensionless length at variable liquid solvent temperatures (25, 40, 60, and 80 °C); inlet gas flow rate is 600 mL/min and flow rate of inlet solvent is 20 mL/min.

Figure 7.
Effect of solvent circulation rate versus module dimensionless length on solvent stripping efficiency at gas flow rate 100 mL/min, and solvent temperatures 25 °C (a) and 80 °C (b).
Figure 7.
Effect of solvent circulation rate versus module dimensionless length on solvent stripping efficiency at gas flow rate 100 mL/min, and solvent temperatures 25 °C (a) and 80 °C (b).

Figure 8.
Effect of solvent temperature on CO2 removal efficiency. Hollow fibers were made of 28% PVDF/72% Triacetin, module (length is 260 mm, inner diameter is 8 mm), hollow fibers (ID/OD: 0.42/1.1 mm), sweep gas is nitrogen. Initial CO2 concentration in rich PG is 0.54 mol/L. Liquid flow rate is 20 mL/min and gas flow rate is 600 mL/min. The experimental uncertainty of CO2 percent removal is ±1.57.

Figure 9.
Effect of solvent feed rate on the flux and CO2 removal flux. Fiber made of 28% PVDF, 72% triacetin, module (length is 260 mm, inner diameter is 8 mm), hollow fibers (ID/OD: 0.42/1.1 mm). Initial CO2 concentration in rich PG is 0.54 mol/L. Solvent feed temperature = 80 °C and gas feed flow rate is 100 mL/min. The experimental uncertainty of CO2 removal flux is ±0.0005.


Table 1.
Dimensions membrane module [1].
Table 1.
Dimensions membrane module [1].
| Property | Value |
|---|---|
| Inner hollow fiber diameter (mm) | 0.42 |
| Outer hollow fiber diameter (mm) | 1.10 |
| Number of fibers | 15 |
| Inner surface area (m2) | |
| Outer diameter of module (mm) | 8.0 |
| Effective length module (mm) | 260 |
Table 2.
Parameters of the process.
| Parameters | Value | Ref. |
| Reversible reaction rate constant, (1/s) | 3.4 × 10³exp(−2800/T) | calculated |
| Diffusivity of CO2 in shell side, (m2/s) | 8.3 × 10⁻¹⁰ × T1.75 | [40] |
| Diffusion of CO2 in tube side, (m2/s) | 1.5 × 10⁻⁶ × exp(−2119/T) | [36] |
| Diffusivity of CO2 in membrane, | × ε/τ | [41] |
| Porosity, ε | 0.4 | Measured |
| Tortuosity, τ | (2 − ε)/ε | [42] |
© 2020 by the author. Licensee MDPI, Basel, Switzerland. This article is an open access article distributed under the terms and conditions of the Creative Commons Attribution (CC BY) license (http://creativecommons.org/licenses/by/4.0/).
Share and Cite
MDPI and ACS Style
Ghasem, N. Modeling and Simulation of the Simultaneous Absorption/Stripping of CO2 with Potassium Glycinate Solution in Membrane Contactor. Membranes 2020, 10, 72. https://0-doi-org.brum.beds.ac.uk/10.3390/membranes10040072
AMA Style
Ghasem N. Modeling and Simulation of the Simultaneous Absorption/Stripping of CO2 with Potassium Glycinate Solution in Membrane Contactor. Membranes. 2020; 10(4):72. https://0-doi-org.brum.beds.ac.uk/10.3390/membranes10040072
Chicago/Turabian StyleGhasem, Nayef. 2020. "Modeling and Simulation of the Simultaneous Absorption/Stripping of CO2 with Potassium Glycinate Solution in Membrane Contactor" Membranes 10, no. 4: 72. https://0-doi-org.brum.beds.ac.uk/10.3390/membranes10040072
Note that from the first issue of 2016, this journal uses article numbers instead of page numbers. See further details here.