
Fabrication and Electrolyte Characterizations of Nanofiber Framework-Based Polymer Composite Membranes with Continuous Proton Conductive Pathways


Abstract
:1. Introduction
2. Materials and Methods
2.1. Materials
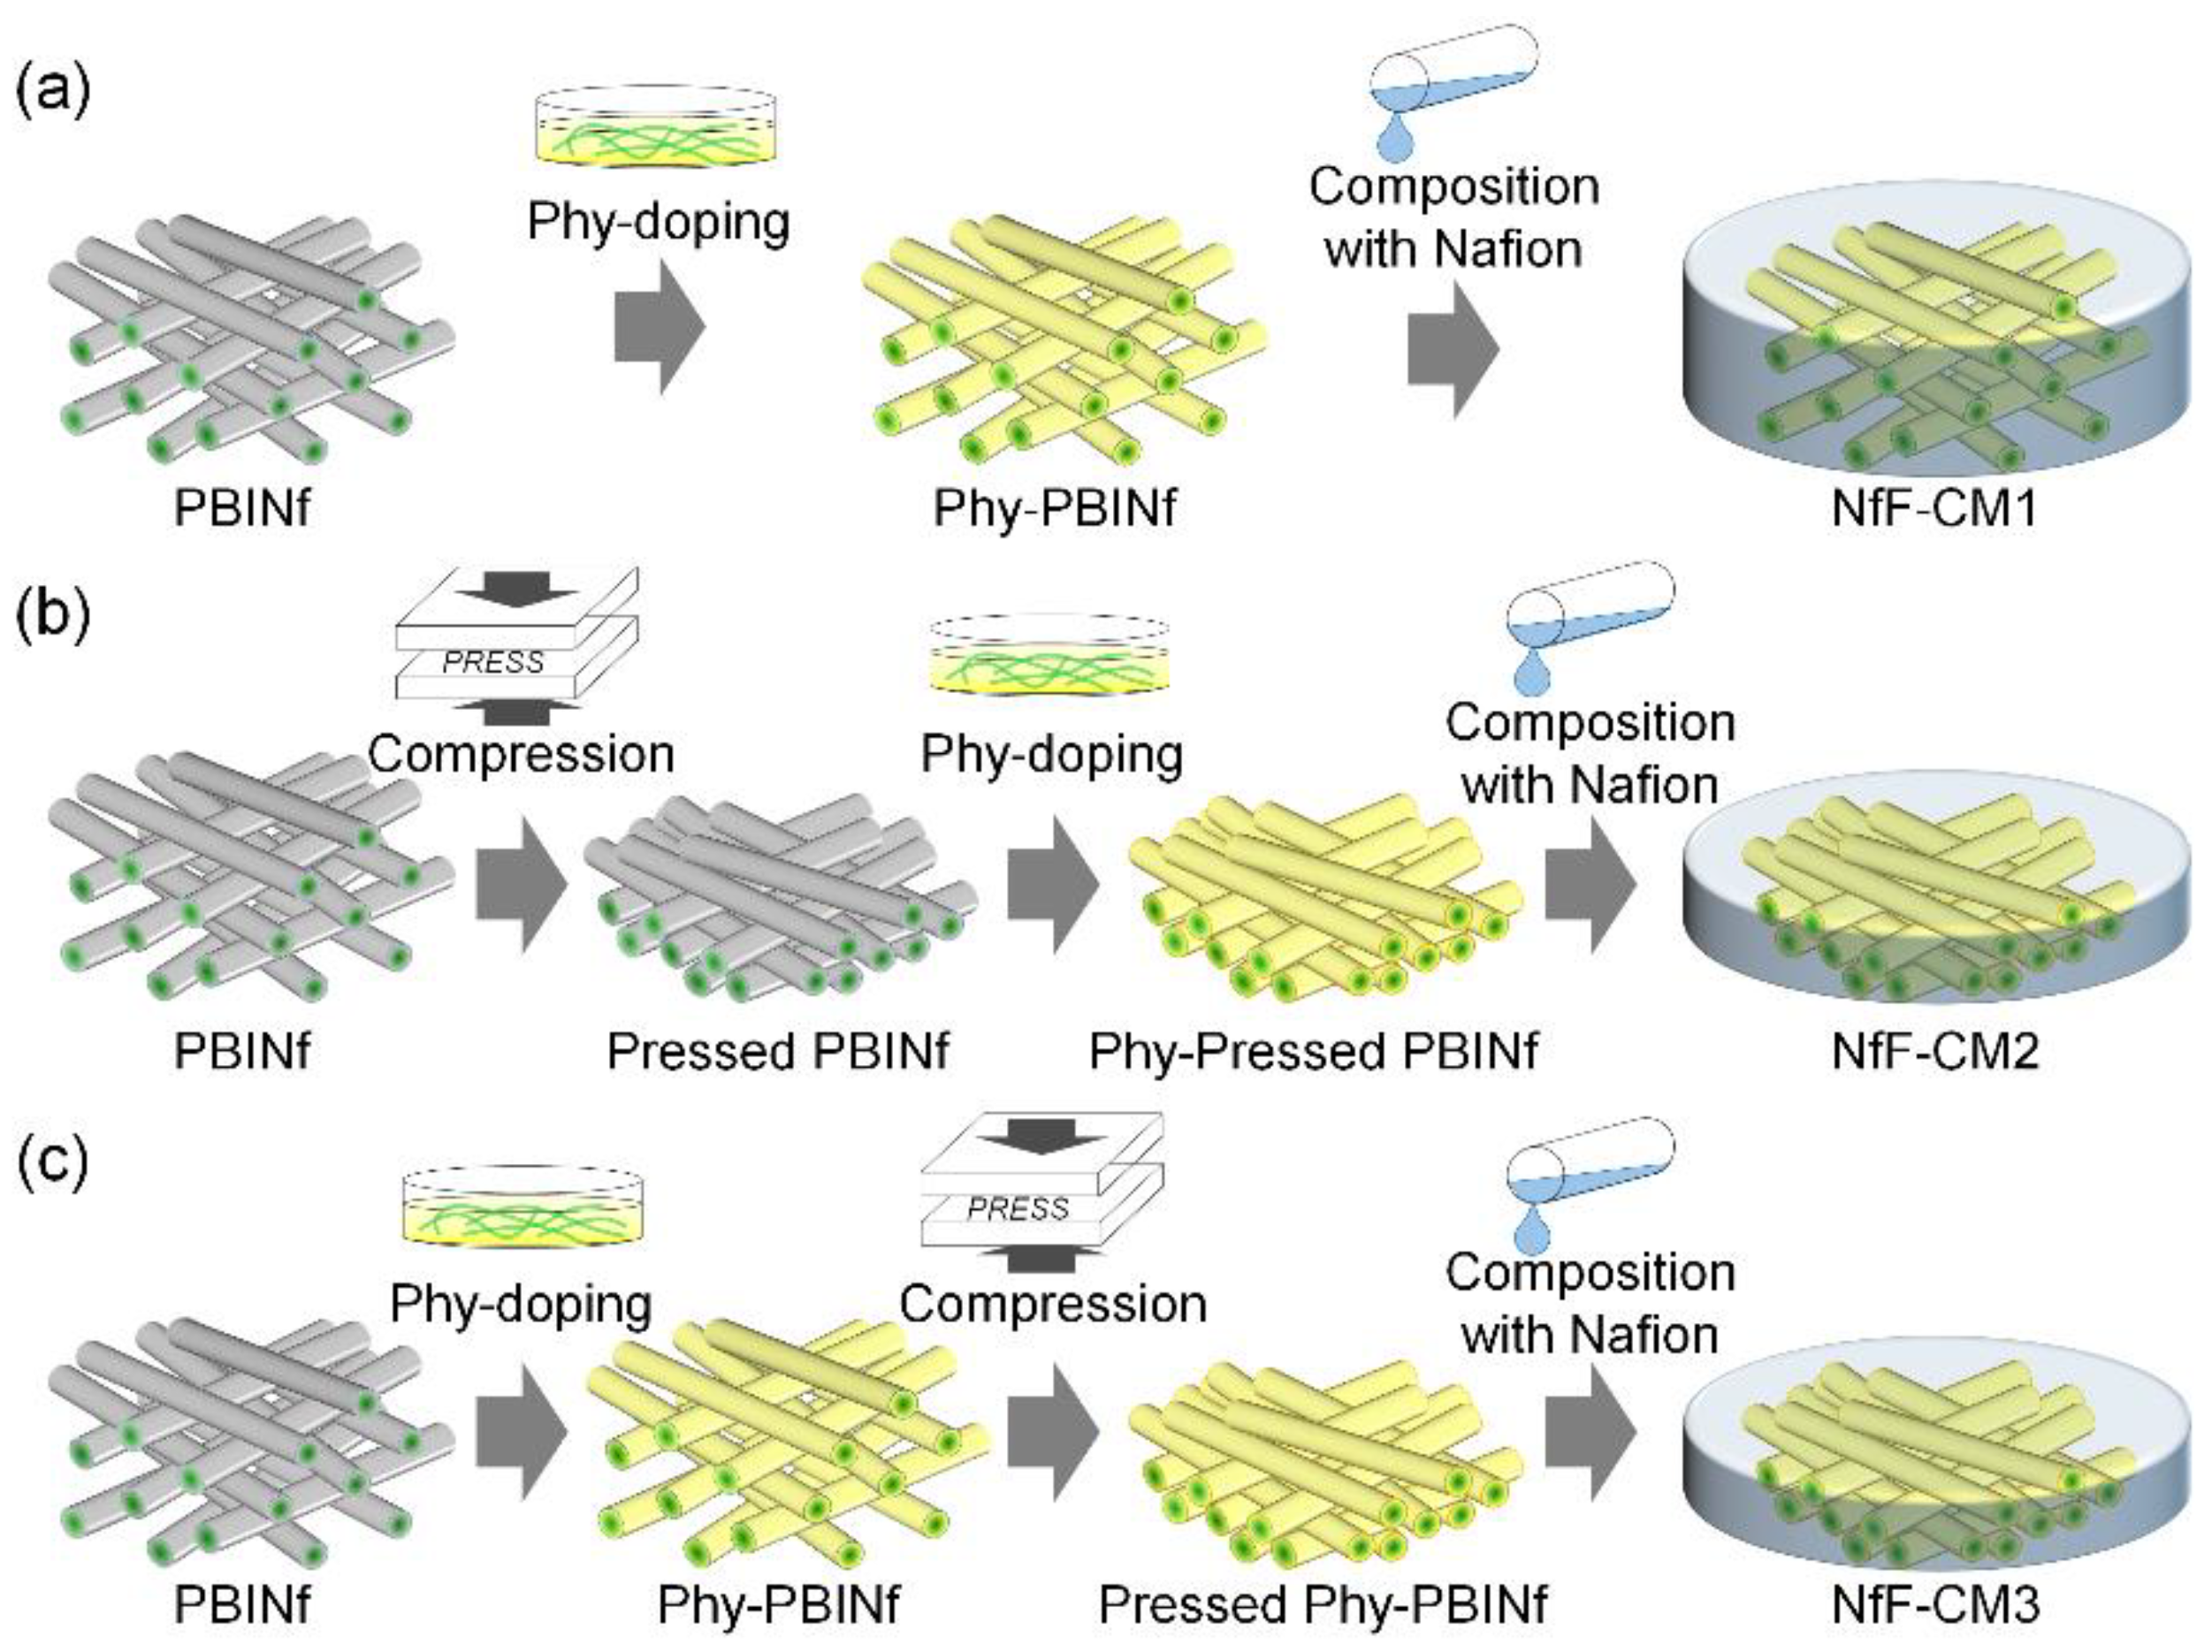
2.2. Fabrication of Nanofiber Framework-Based Composite Membranes (NfF-CMs)
2.3. Characterizations
3. Results and Discussion
3.1. Fabrication of NfF Composite Membranes
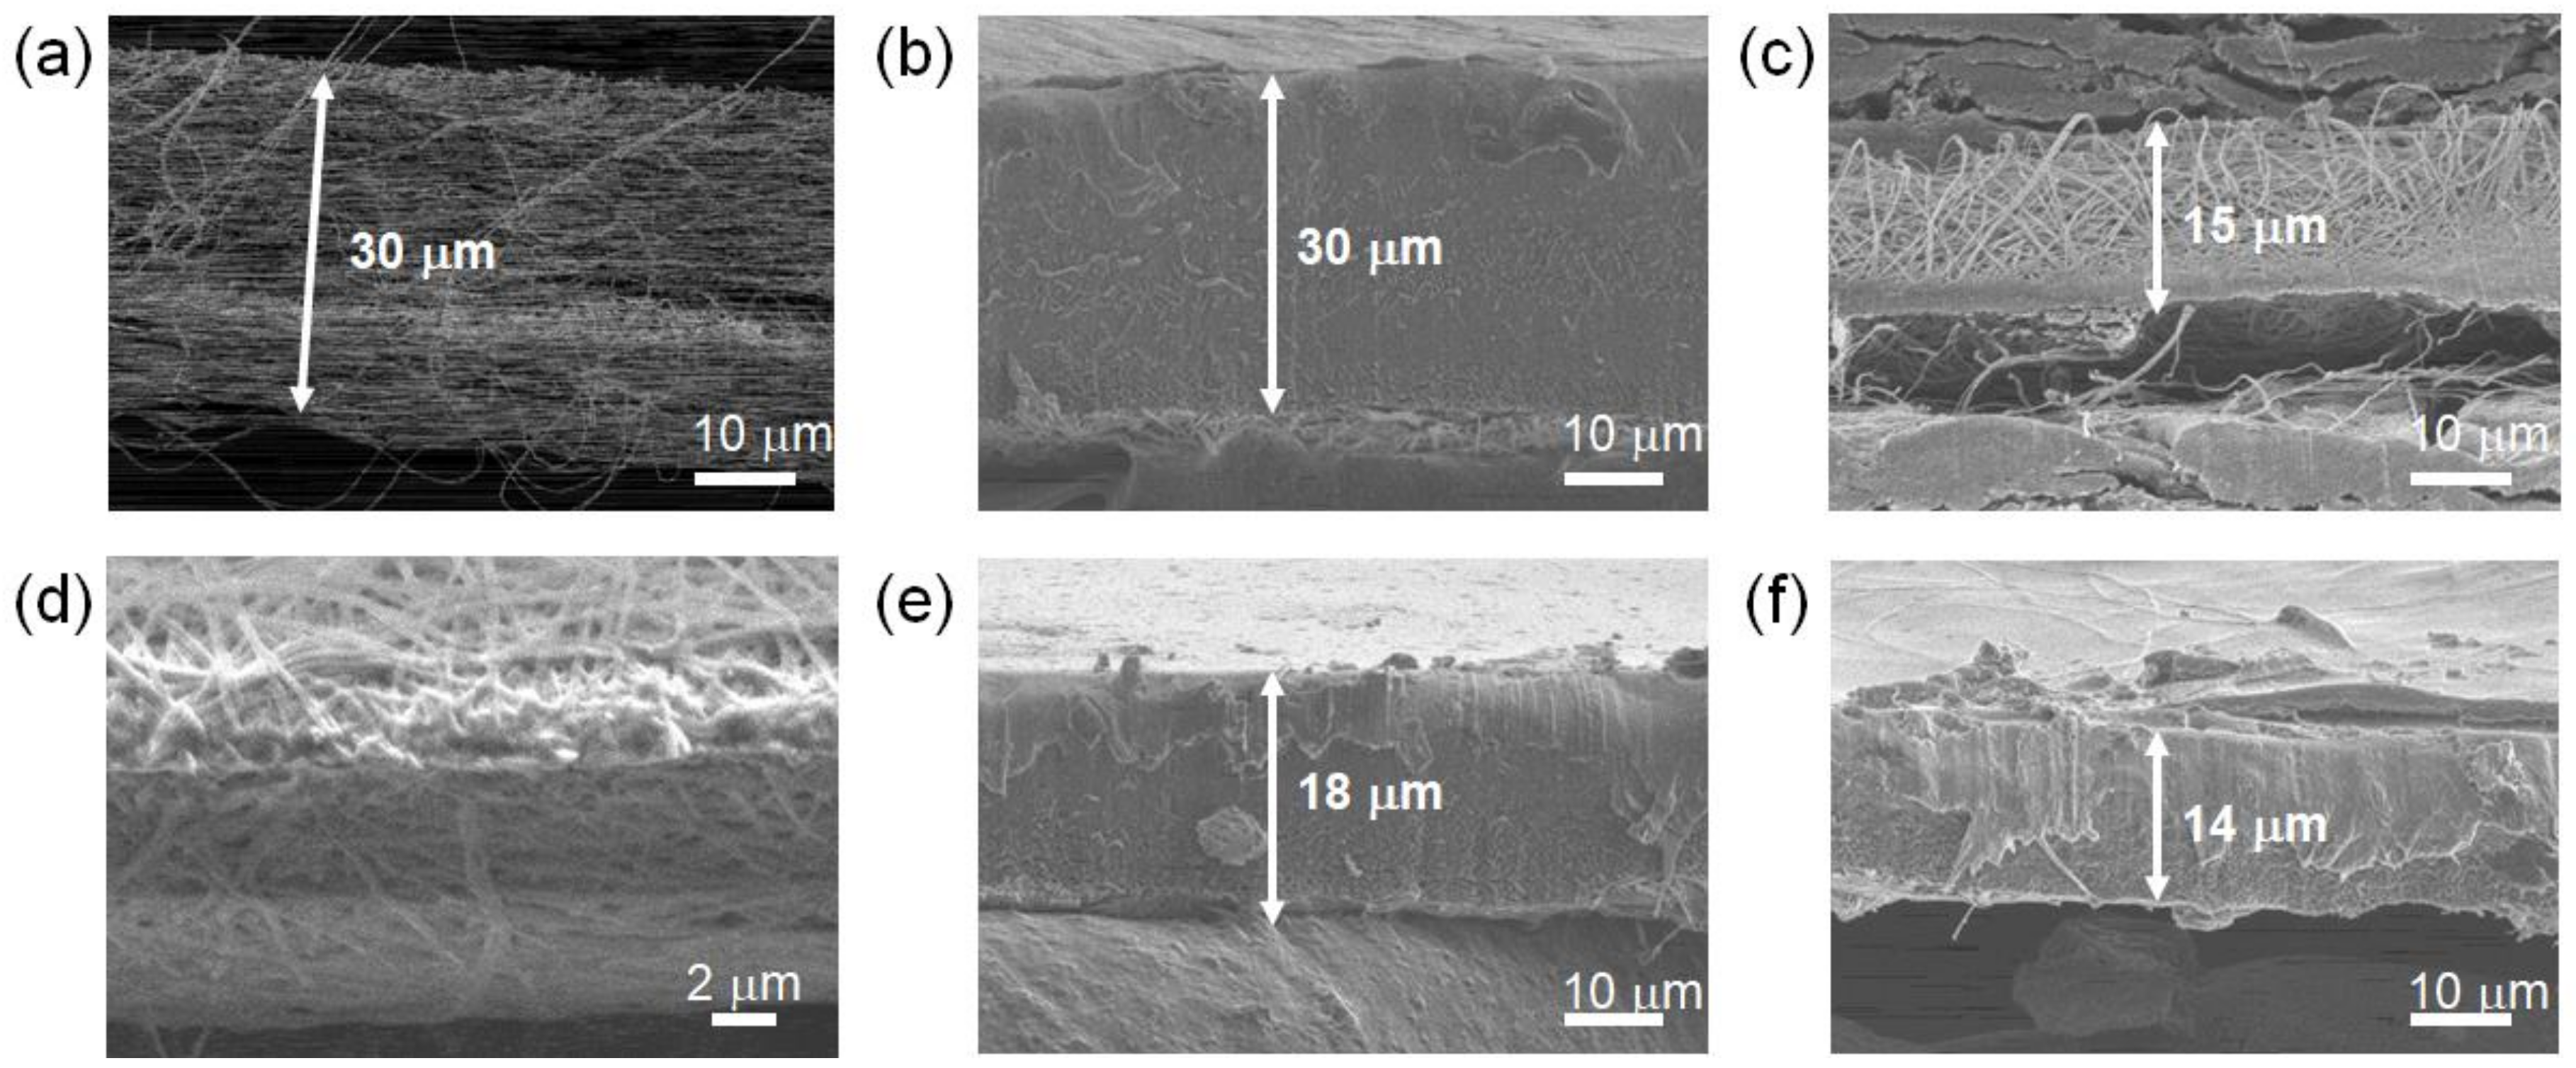
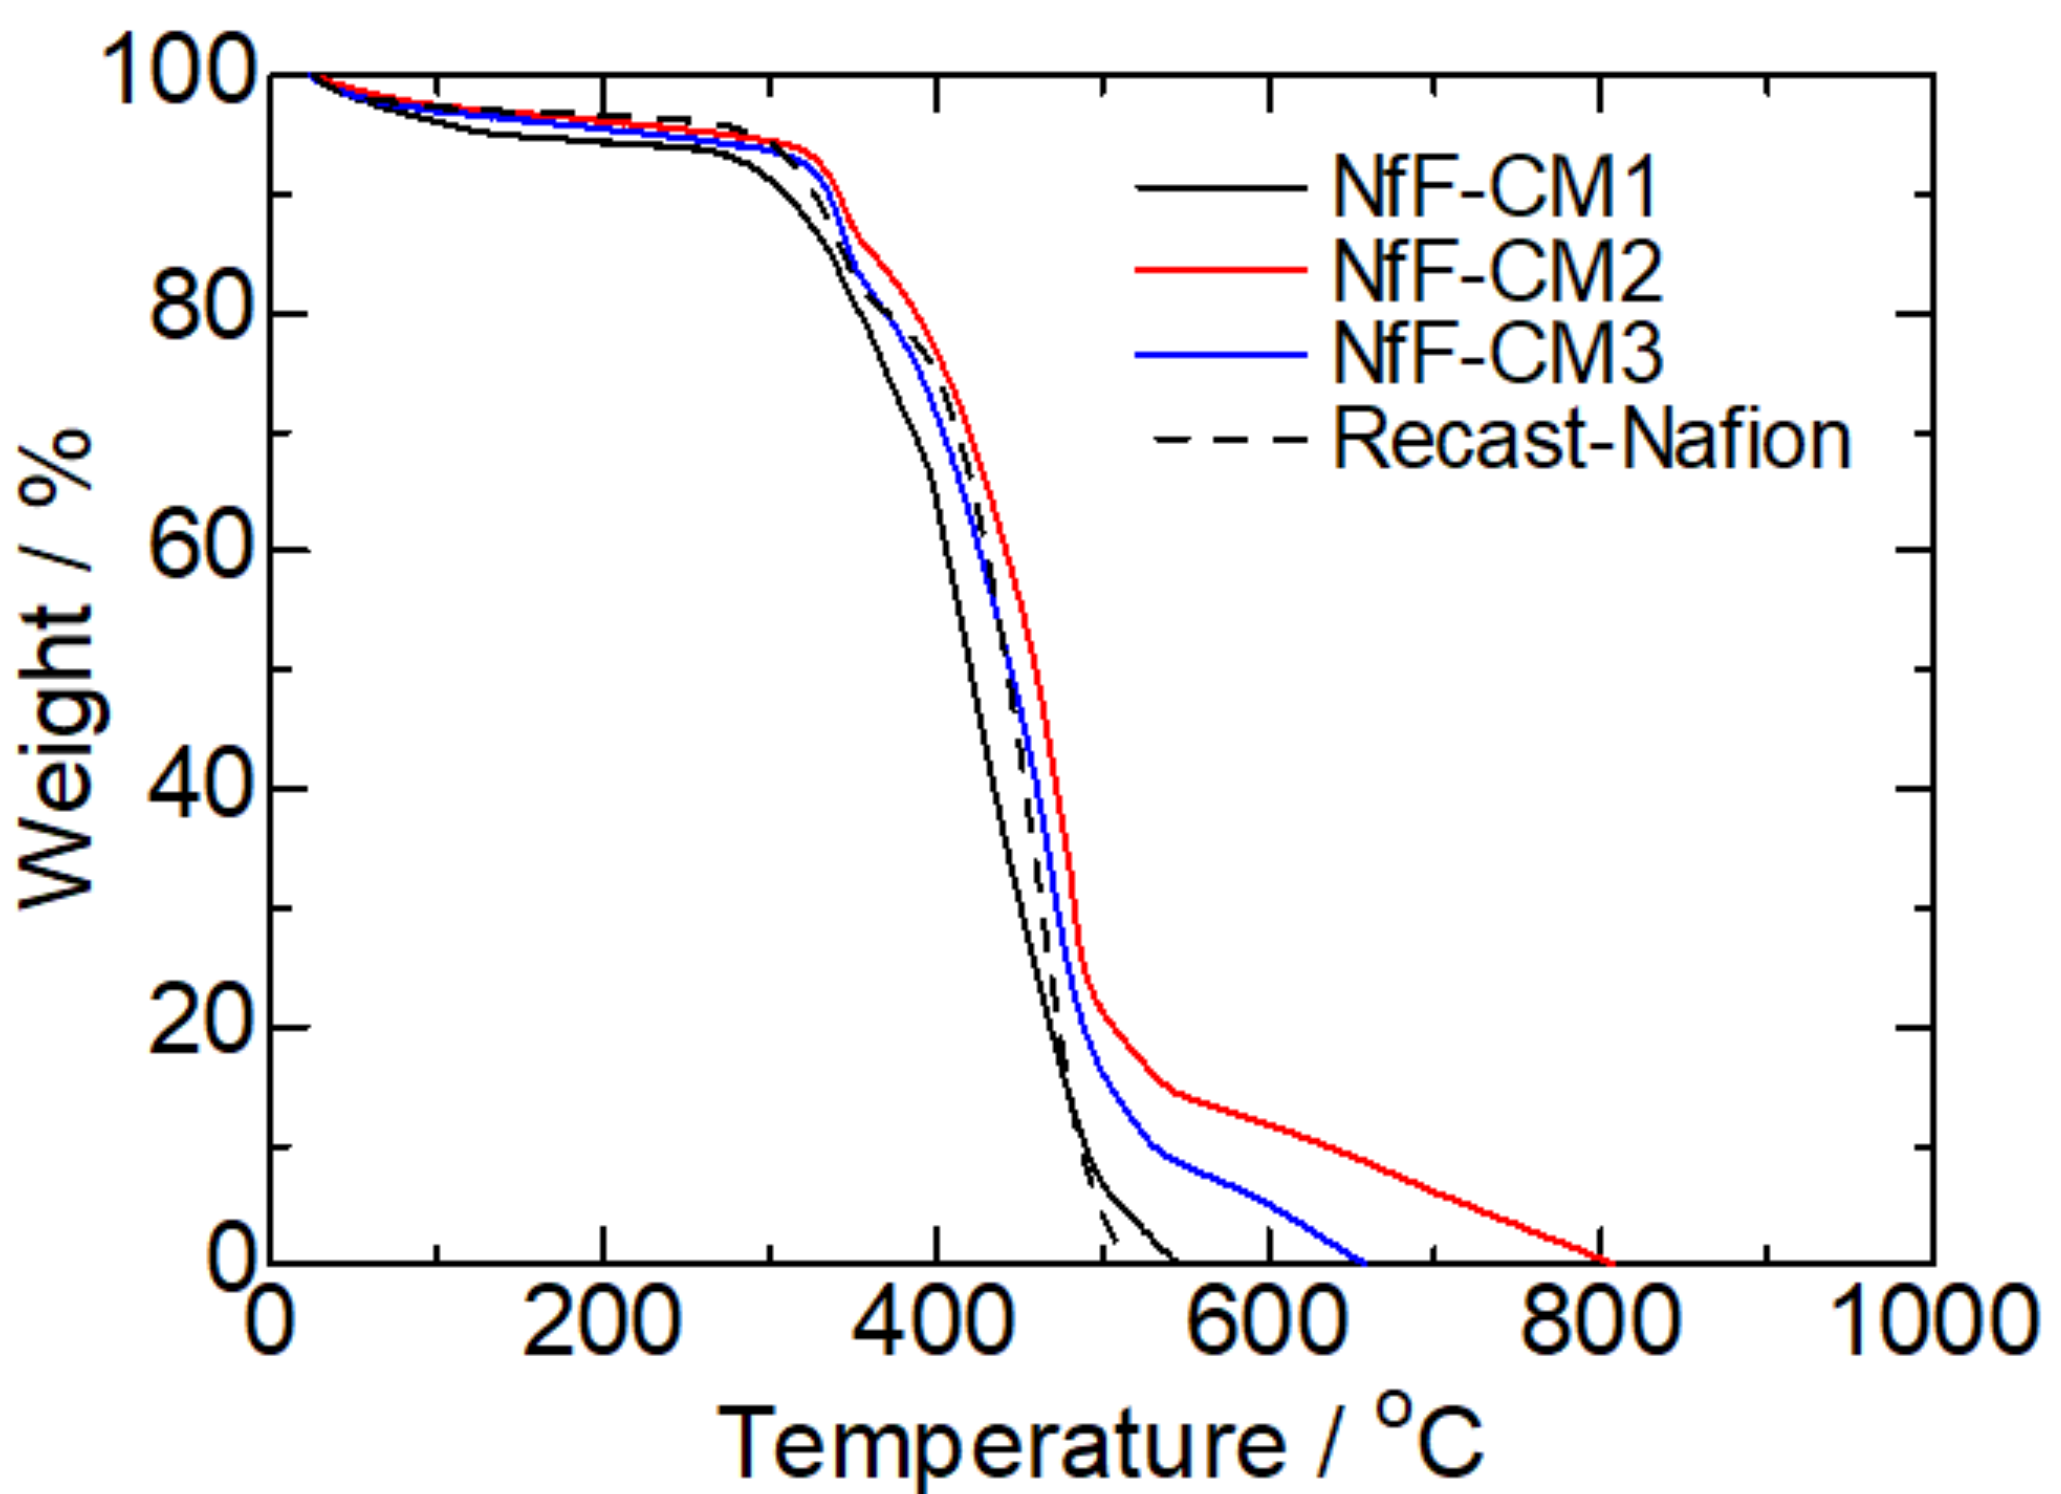
3.2. Characterizations of the NfF Composite Membranes
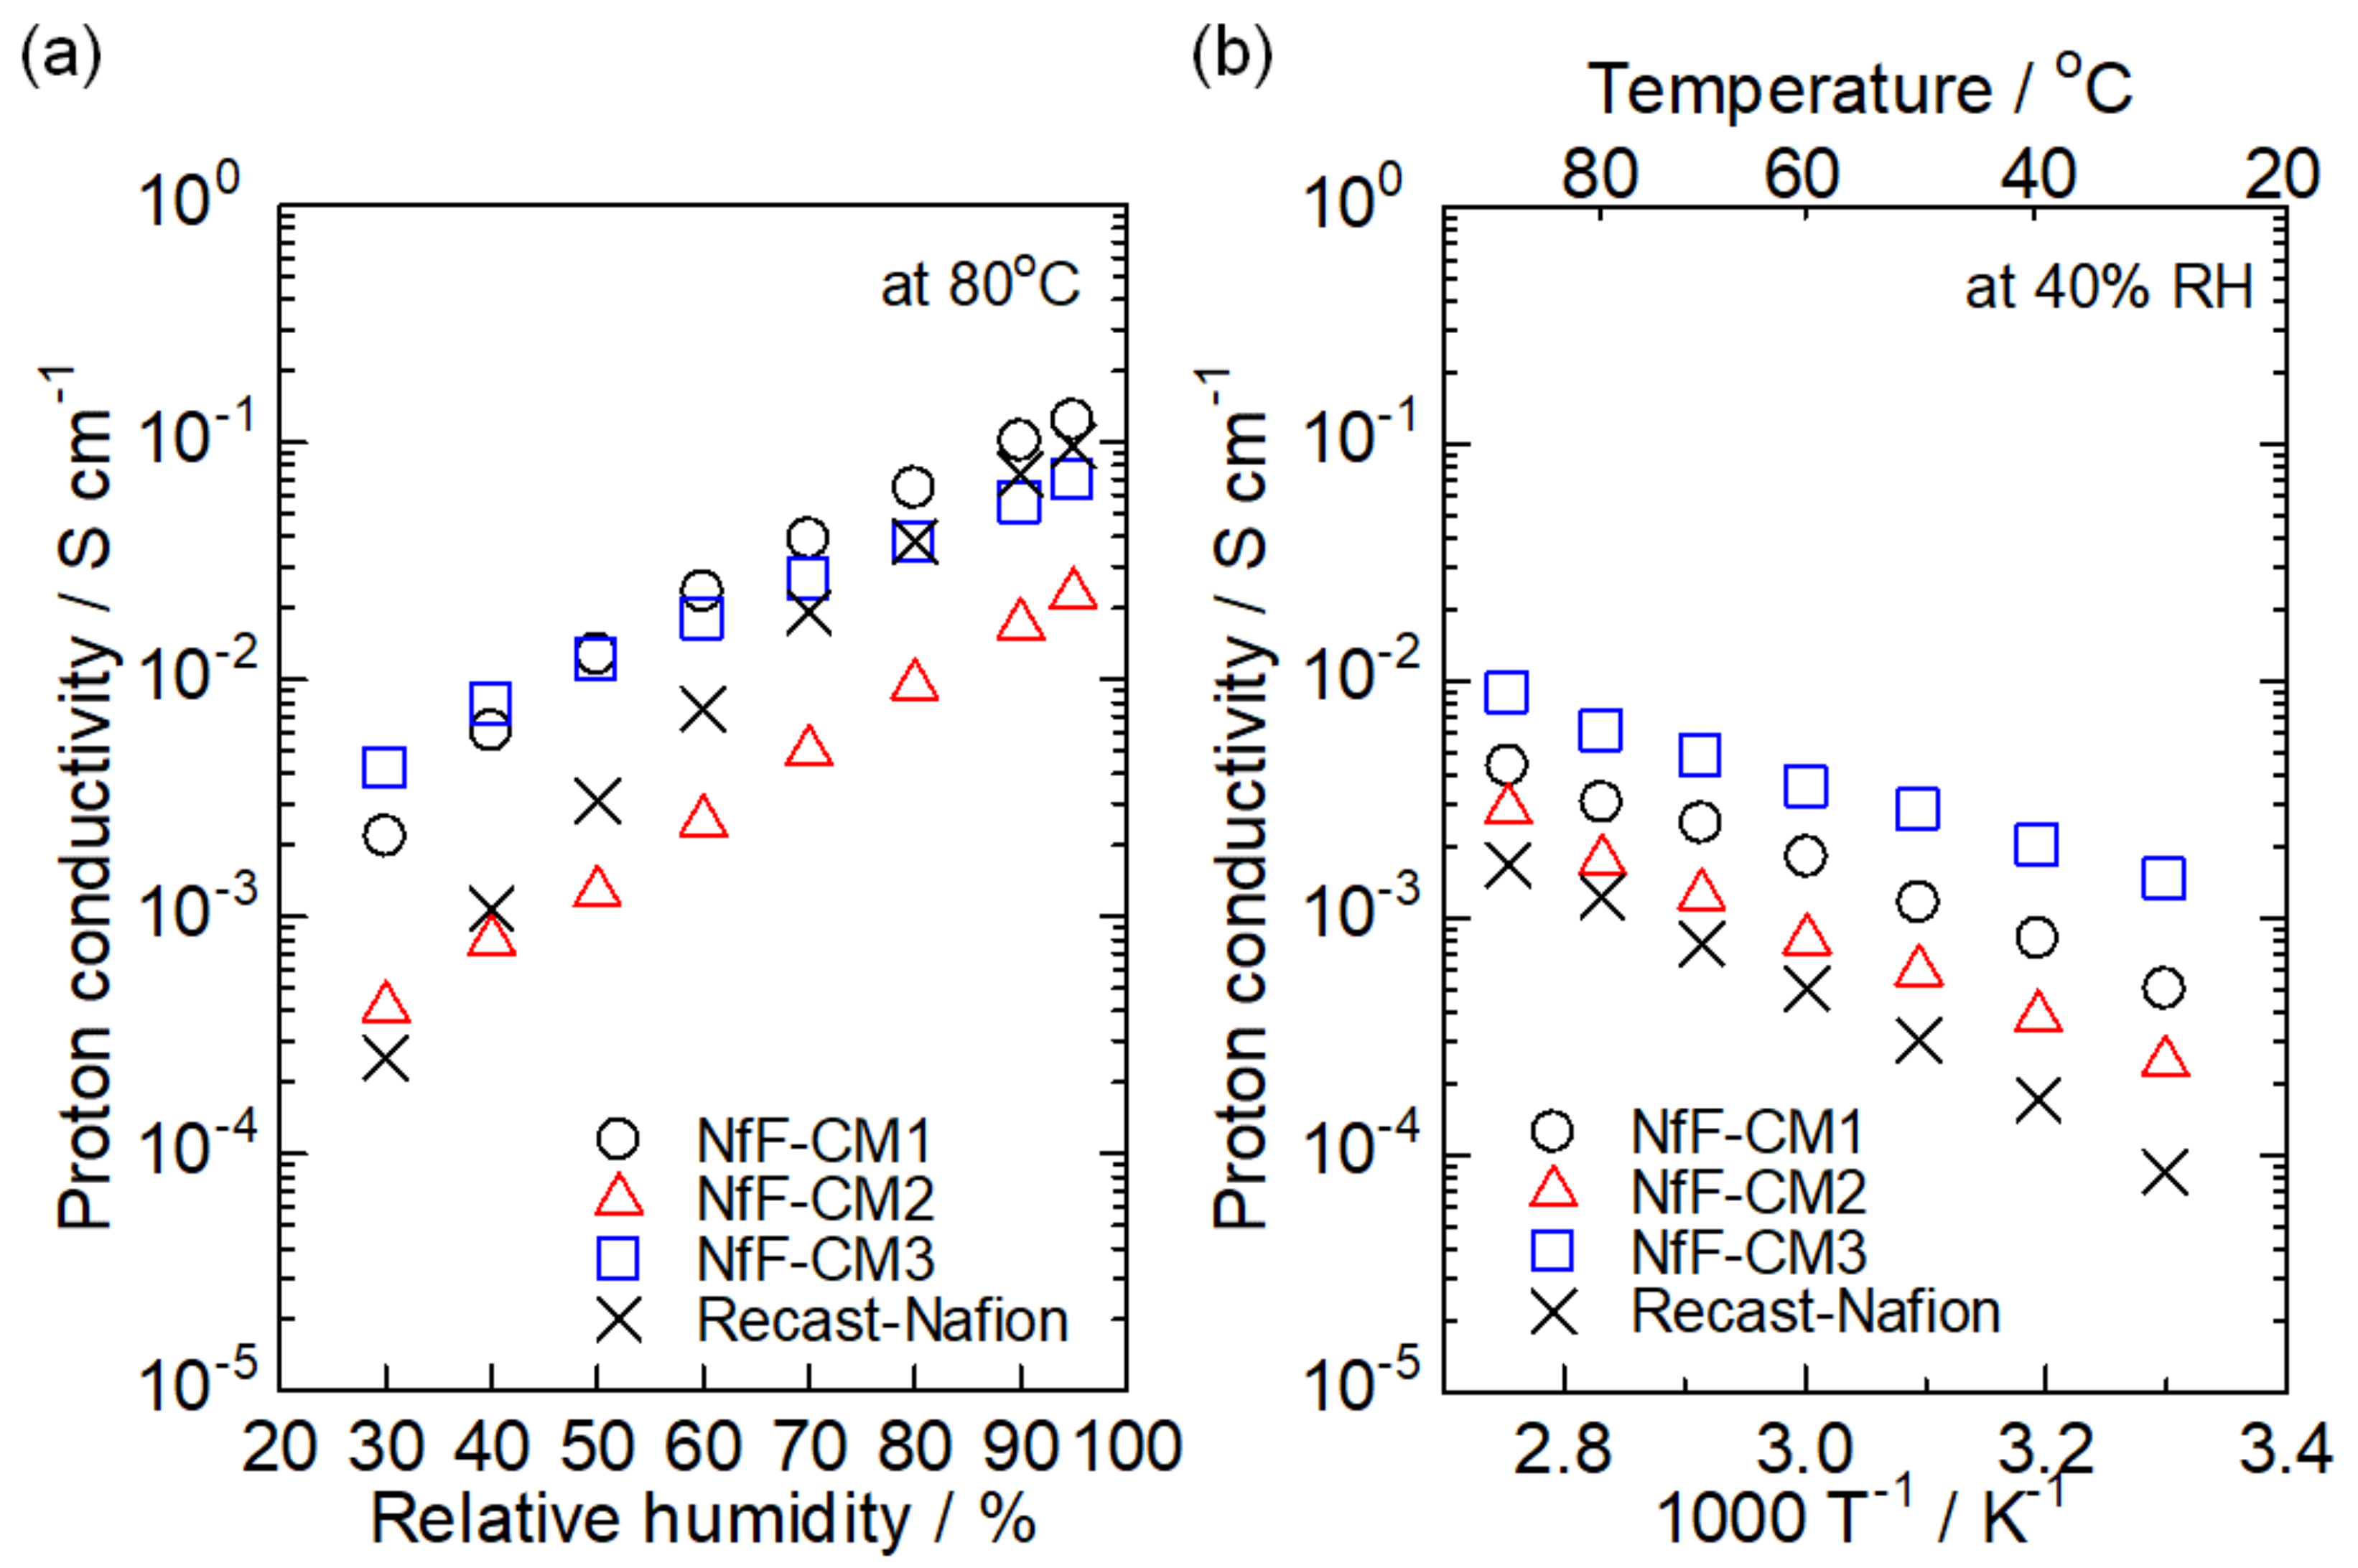
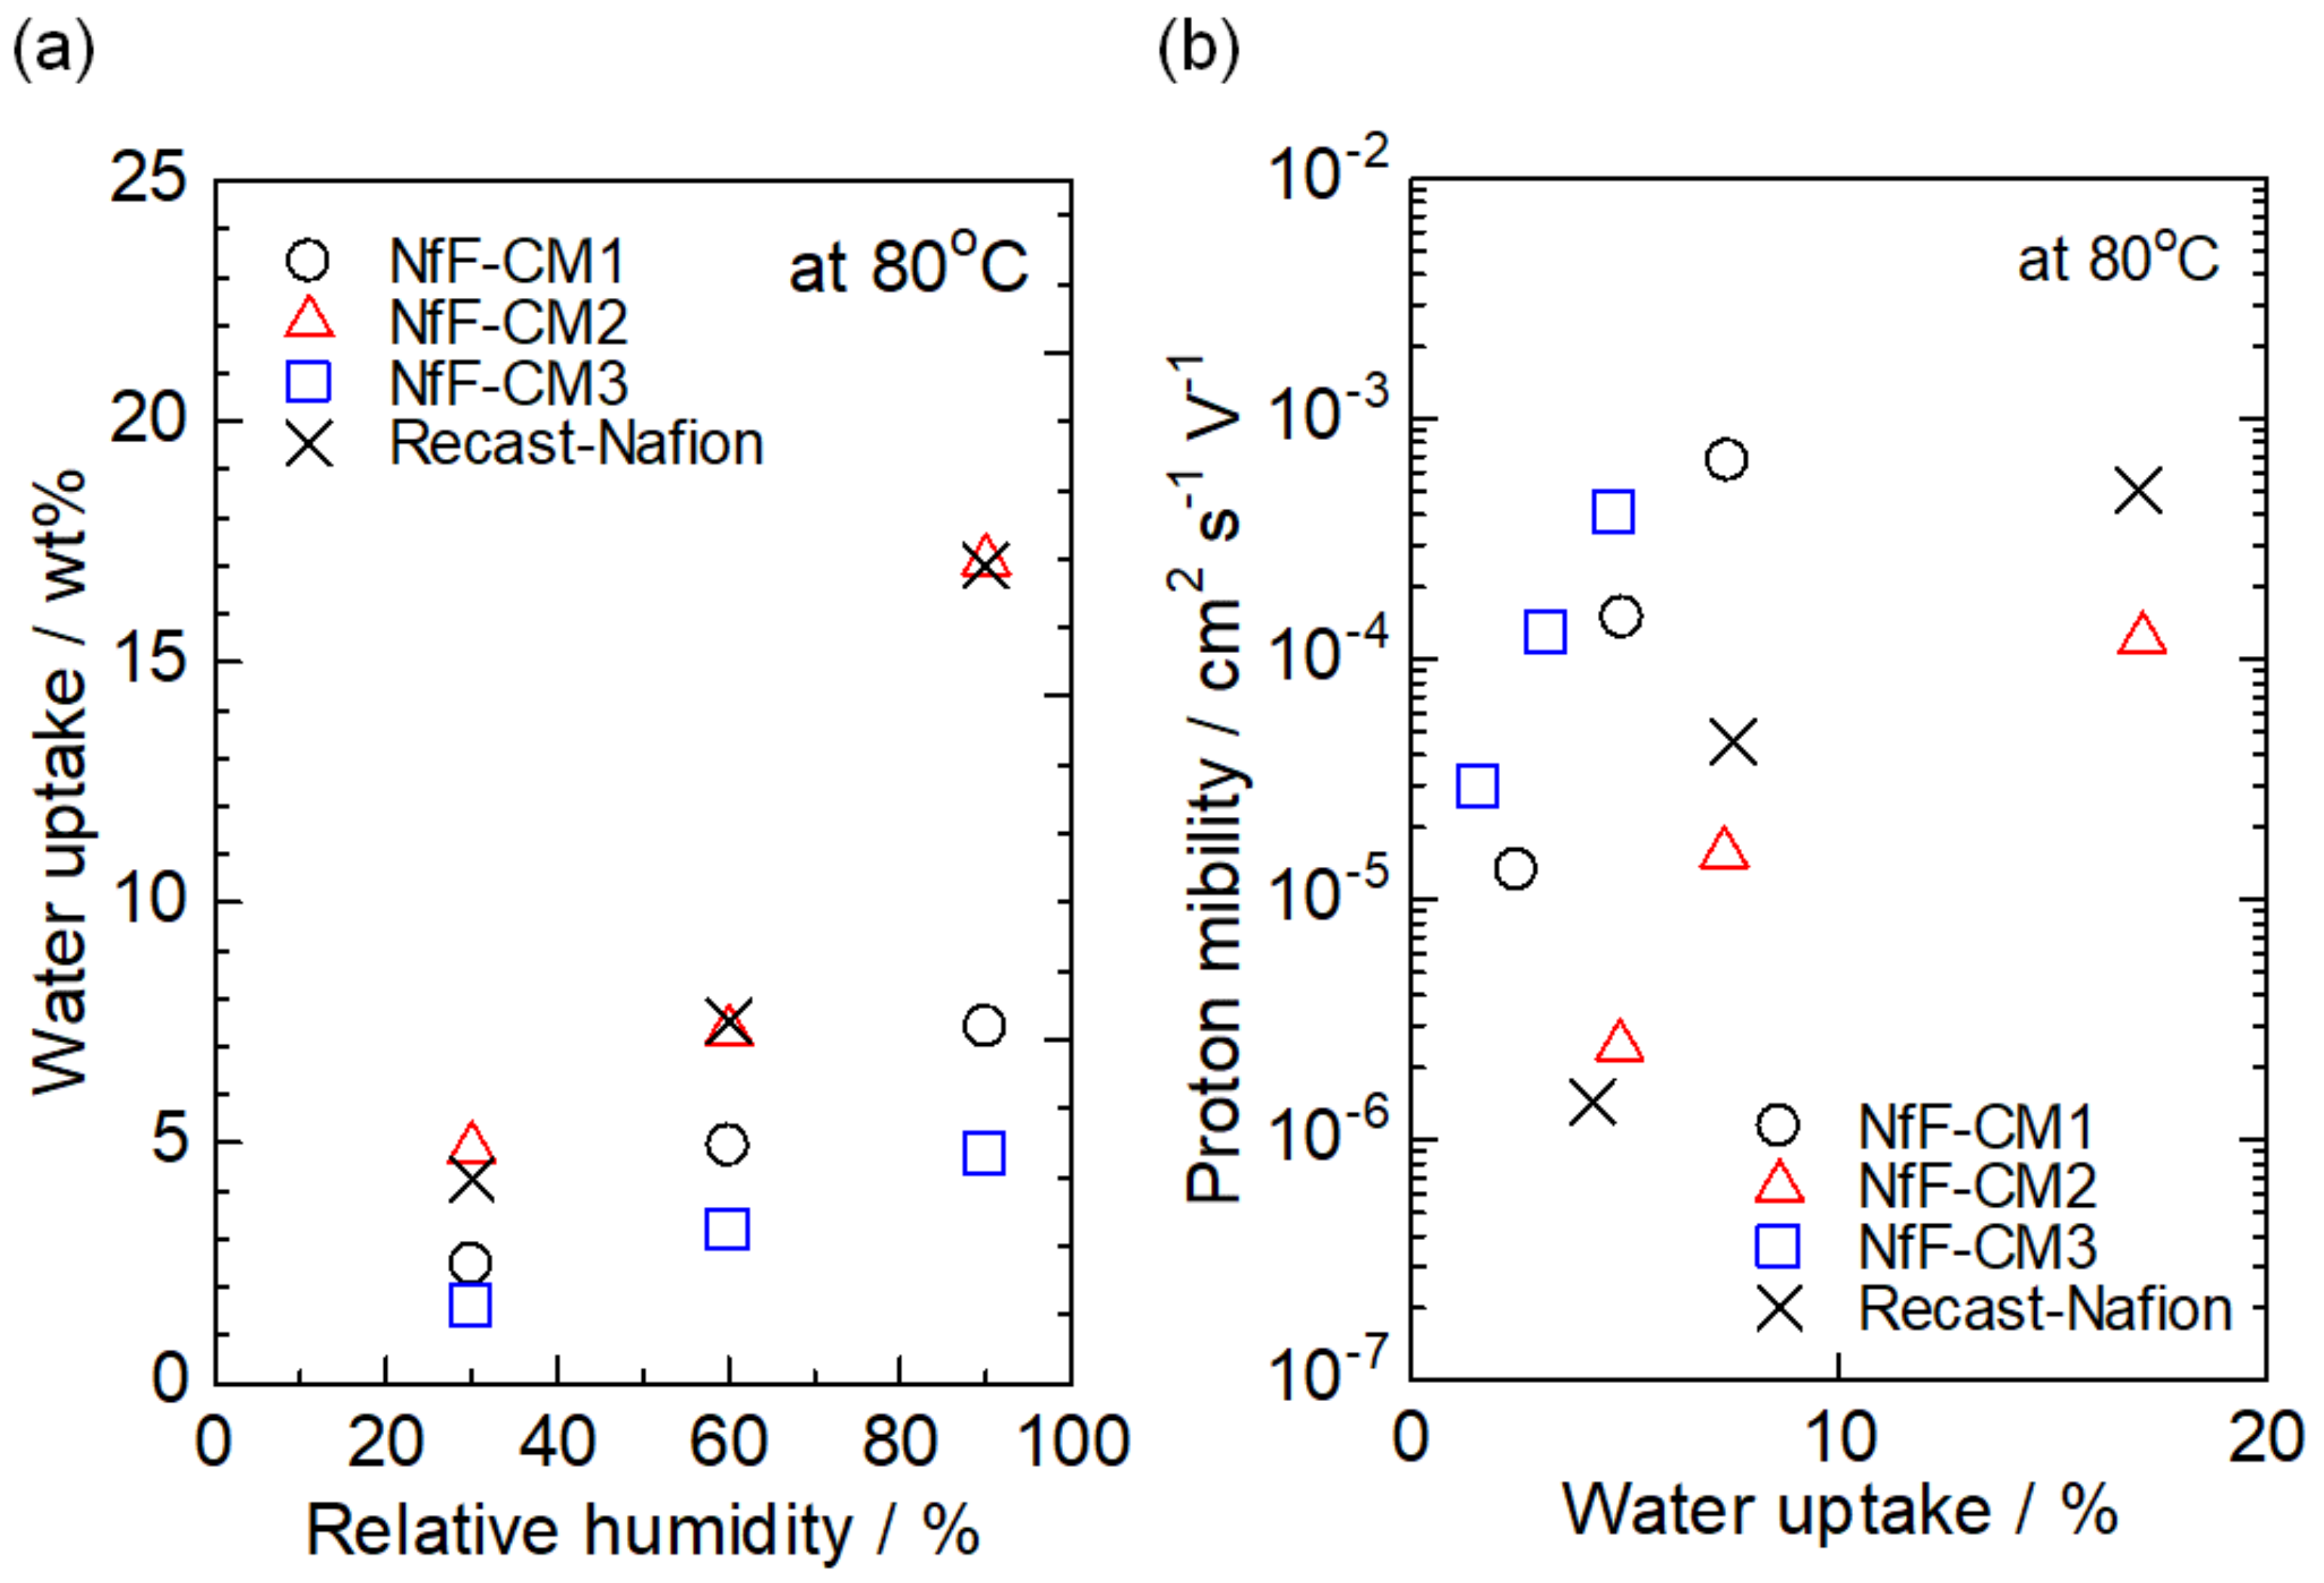
3.3. Proton Conductive Characteristics of the NfF Composite Membranes
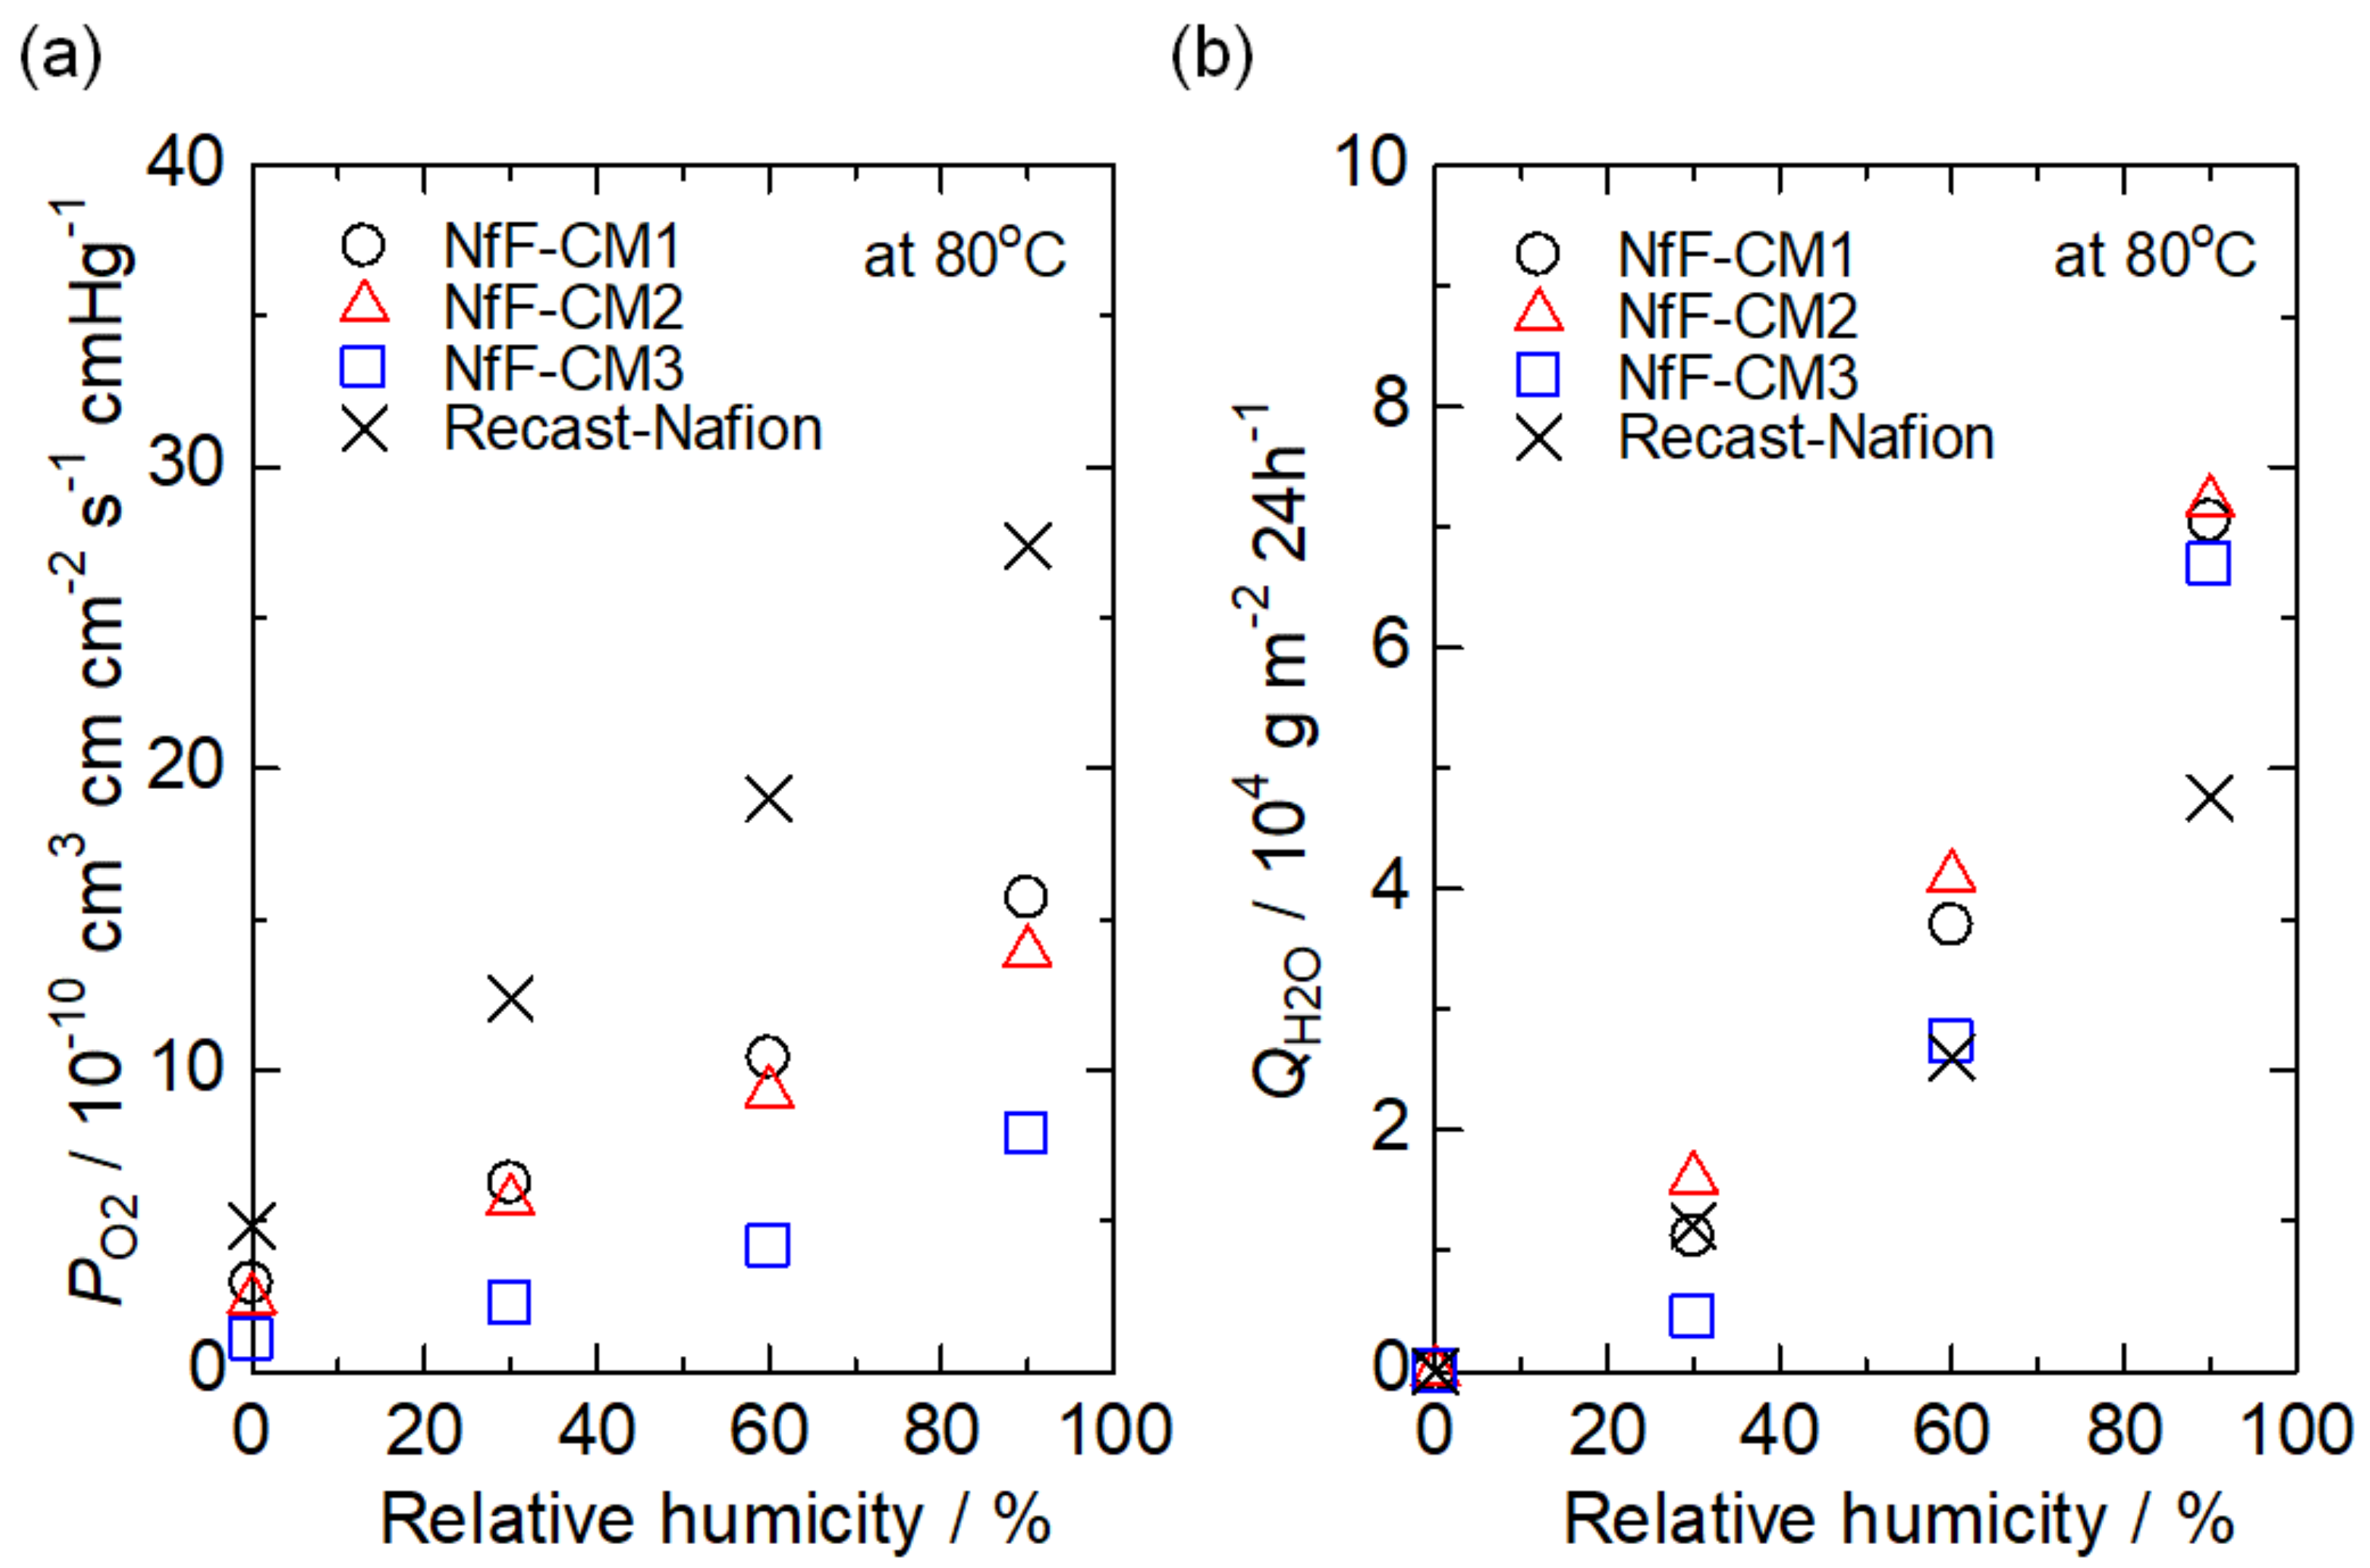
3.4. Gas and Water Vapor Permeability of the NfF Composite Membranes
4. Conclusions
Author Contributions
Funding
Institutional Review Board Statement
Informed Consent Statement
Data Availability Statement
Acknowledgments
Conflicts of Interest
References
- Lipman, T.E.; Weber, A.Z. Fuel Cells and Hydrogen Production; Springer: New York, NY, USA, 2018. [Google Scholar]
- Cano, Z.P.; Banham, D.; Ye, S.; Hintennach, A.; Lu, J.; Fowler, M.; Chen, Z. Batteries and fuel cells for emerging electric vehicle markets. Nat. Energy 2018, 3, 279–289. [Google Scholar] [CrossRef]
- Rath, R.; Kumar, P.; Mohanty, S.; Nayak, S.K. Recent advances, unsolved deficiencies, and future perspectives of hydrogen fuel cells in transportation and portable sectors. Int. J. Energy Res. 2019, 43, 8931–8955. [Google Scholar] [CrossRef]
- Manoharan, Y.; Hosseini, S.E.; Butler, B.; Alzhahrani, H.; Senior, B.T.F.; Ashuri, T.; Krohn, J. Hydrogen fuel cell vehicles; Current status and future prospect. Appl. Sci. 2019, 9, 2296. [Google Scholar] [CrossRef] [Green Version]
- Wang, Y.; Diaz, D.F.R.; Chen, K.S.; Wang, Z.; Adroher, X.C. Materials, technological status, and fundamentals of PEM fuel cells—A review. Mater. Today 2020, 32, 178–203. [Google Scholar] [CrossRef]
- Marcinkoski, J.; James, B.D.; Kalinoski, J.A.; Podolski, W.; Benjamin, T.; Kopasz, J. Manufacturing process assumptions used in fuel cell system cost analyses. J. Power Sources 2011, 196, 5282–5292. [Google Scholar] [CrossRef]
- Lochner, T.; Kluge, R.M.; Fichtner, J.; El-Sayed, H.A.; Garlyyev, B.; Bandarenka, A.S. Temperature Effects in Polymer Electrolyte Membrane Fuel Cells. ChemElectroChem 2020, 7, 3545–3568. [Google Scholar] [CrossRef]
- Kusoglu, A.; Weber, A.Z. New Insights into Perfluorinated Sulfonic-Acid Ionomers. Chem. Rev. 2017, 117, 987–1104. [Google Scholar] [CrossRef]
- Miyake, J.; Miyatake, K. Fluorine-free sulfonated aromatic polymers as proton exchange membranes. Polym. J. 2017, 49, 487–495. [Google Scholar] [CrossRef]
- Park, S.; Lee, H.; Shin, S.-H.; Kim, N.; Shin, D.; Bae, B. Increasing the Durability of Polymer Electrolyte Membranes Using Organic Additives. ACS Omega 2018, 3, 11262–11269. [Google Scholar] [CrossRef]
- Gagliardi, G.G.; Ibrahim, A.; Borello, D.; El-Kharouf, A. Composite Polymers Development and Application for Polymer Electrolyte Membrane Technologies—A Review. Molecules 2020, 25, 1712. [Google Scholar] [CrossRef] [Green Version]
- Tamura, T.; Kawakami, H. Aligned electrospun nanofiber composite membranes for fuel cell electrolytes. Nano Lett. 2010, 10, 1324–1328. [Google Scholar] [CrossRef] [PubMed]
- Tanaka, M. Development of ion conductive nanofibers for polymer electrolyte fuel cells. Polym. J. 2016, 48, 51–58. [Google Scholar] [CrossRef]
- Kallem, P.; Yanar, N.; Choi, H. Nanofiber-Based Proton Exchange Membranes: Development of Aligned Electrospun Nanofibers for Polymer Electrolyte Fuel Cell Applications. ACS Sustain. Chem. Eng. 2019, 7, 1808–1825. [Google Scholar] [CrossRef]
- Shaari, N.; Kamarudin, S.K. Recent advances in additive-enhanced polymer electrolyte membrane properties in fuel cell applications: An overview. Int. J. Energy Res. 2019, 43, 2756–2794. [Google Scholar] [CrossRef]
- Dong, B.; Gwee, L.; Salas-de la Cruz, D.; Winey, K.I.; Elabd, Y.A. Super Proton Conductive High-Purity Nafion Nanofibers. Nano Lett. 2010, 10, 3785–3790. [Google Scholar] [CrossRef]
- Takemori, R.; Ito, G.; Tanaka, M.; Kawakami, H. Ultra-high proton conduction in electrospun sulfonated polyimide nanofibers. RSC Adv. 2014, 4, 20005–20009. [Google Scholar] [CrossRef]
- Snyder, J.D.; Elabd, Y.A. Nafion® nanofibers and their effect on polymer electrolyte membrane fuel cell performance. J. Power Sources 2009, 186, 385–392. [Google Scholar] [CrossRef]
- Wang, H.; Tang, C.; Zhuang, X.; Cheng, B.; Wang, W.; Kang, W.; Li, H. Novel structure design of composite proton exchange membranes with continuous and through-membrane proton-conducting channels. J. Power Sources 2017, 365, 92–97. [Google Scholar] [CrossRef]
- Makinouchi, T.; Tanaka, M.; Kawakami, H. Improvement in characteristics of a Nafion membrane by proton conductive nanofibers for fuel cell applications. J. Membr. Sci. 2017, 530, 65–72. [Google Scholar] [CrossRef]
- Ito, G.; Tanaka, M.; Kawakami, H. Sulfonated polyimide nanofiber framework: Evaluation of intrinsic proton conductivity and application to composite membranes for fuel cells. Solid State Ion. 2018, 317, 244–255. [Google Scholar] [CrossRef]
- Vezzù, K.; Nawn, G.; Negro, E.; Crivellaro, G.; Park, J.W.; Wycisk, R.; Pintauro, P.N.; Di Noto, V. Electric Response and Conductivity Mechanism of Blended Polyvinylidene Fluoride/Nafion Electrospun Nanofibers. J. Am. Chem. Soc. 2020, 142, 801–814. [Google Scholar] [CrossRef] [PubMed]
- Sood, R.; Cavaliere, S.; Jones, D.J.; Rozière, J. Electrospun nanofiber composite polymer electrolyte fuel cell and electrolysis membranes. Nano Energy 2016, 26, 729–745. [Google Scholar] [CrossRef] [Green Version]
- Debora, J.; Rozière, J.; Cavaliere, S.; Subianto, S.; Burton, S. Membrane. WO2016/020668. 11 February 2016. [Google Scholar]
- Tanaka, M.; Takeda, Y.; Wakiya, T.; Wakamoto, Y.; Harigaya, K.; Ito, T.; Tarao, T.; Kawakami, H. Acid-doped polymer nanofiber framework: Three-dimensional proton conductive network for high-performance fuel cells. J. Power Sources 2017, 342, 125–134. [Google Scholar] [CrossRef]
- Suzuki, K.; Iizuka, Y.; Tanaka, M.; Kawakami, H. Phosphoric acid-doped sulfonated polyimide and polybenzimidazole blend membranes: High proton transport at wide temperatures under low humidity conditions due to new proton transport pathways. J. Mater. Chem. 2012, 22, 23767–23772. [Google Scholar] [CrossRef]
- Ibaraki, T.; Tanaka, M.; Kawakami, H. Fast surface proton conduction on acid-doped polymer nanofibers in polymer electrolyte composite membranes. Electrochim. Acta 2019, 296, 1042–1048. [Google Scholar] [CrossRef]


| Membranes | Porosity of NfF (%) | Target (Feed) Ratio of NfF/Nafion | Obtained (Estimated) Ratio of NfF/Nafion | Thickness (μm) | Phy Content (wt%) d | ||
|---|---|---|---|---|---|---|---|
| wt%/wt% a | vol%/vol% | wt%/wt% b | vol%/vol% c | ||||
| NfF-CM1 e | 90 | 9/91 | 10/90 | 9/91 | 11/89 | 30 | 2.0 |
| NfF-CM2 f | 75 | 19/81 | 25/75 | 25/75 | 25/58 + void | 18 | 5.0 |
| NfF-CM3 g | 75 | 18/82 | 25/75 | 19/81 | 24/76 | 14 | 3.0 |
| Recast-Nafion | − | 0/100 | 0/100 | 0/100 | 0/100 | 42 | − |
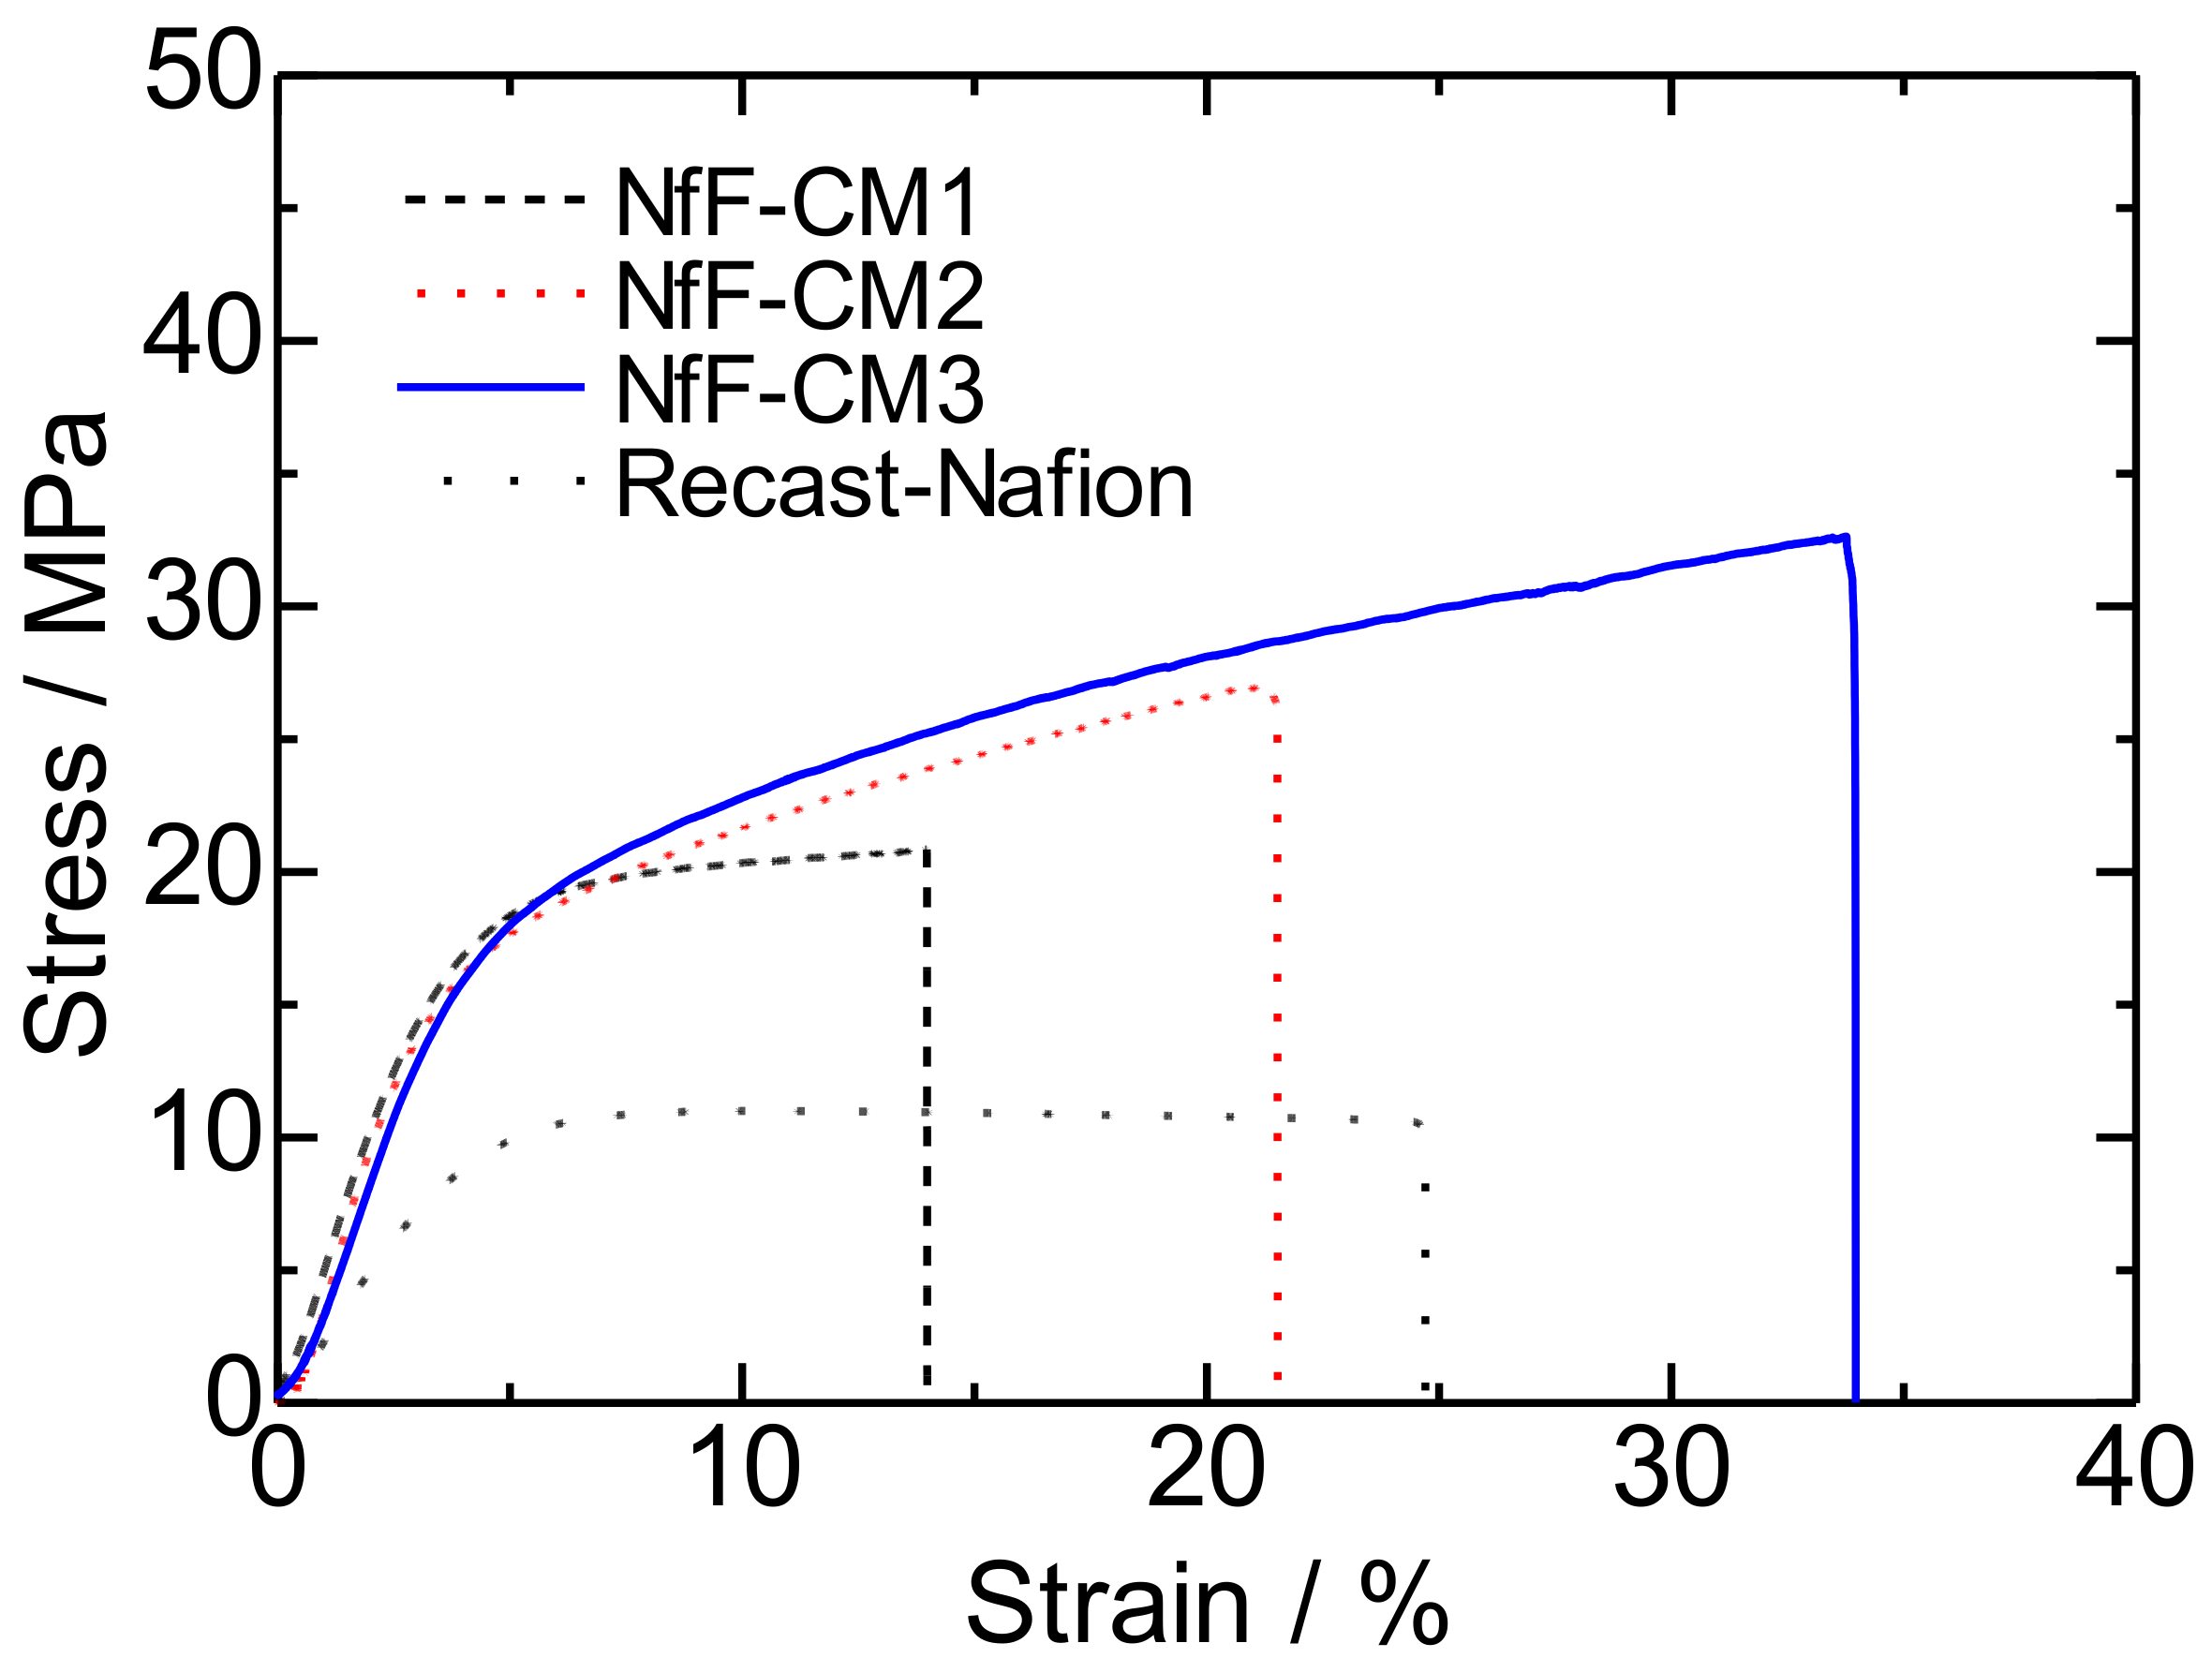
| Membranes | Expected IEC (meq g−1) a | IEC (meq g−1) b | Water Uptake (%) c | Mechanical Properties d | ||
|---|---|---|---|---|---|---|
| Maximum Stress (MPa) | Young modulus (MPa) | Toughness (MJ m−3) | ||||
| NfF-CM1 | 0.97–1.05 | 0.984 | 18 ± 2 | 19.6 | 519 | 2.20 |
| NfF-CM2 | 0.91–0.98 | 1.05 | 22 ± 5 | 26.7 | 564 | 4.09 |
| NfF-CM3 | 0.88–0.95 | 0.851 | 14 ± 2 | 32.6 | 460 | 7.59 |
| Recast-Nafion | 1.03–1.12 | 1.089 | 34 ± 5 | 11.0 | 233 | 2.24 |
Publisher’s Note: MDPI stays neutral with regard to jurisdictional claims in published maps and institutional affiliations. |
© 2021 by the authors. Licensee MDPI, Basel, Switzerland. This article is an open access article distributed under the terms and conditions of the Creative Commons Attribution (CC BY) license (http://creativecommons.org/licenses/by/4.0/).
Share and Cite
Wakiya, T.; Tanaka, M.; Kawakami, H. Fabrication and Electrolyte Characterizations of Nanofiber Framework-Based Polymer Composite Membranes with Continuous Proton Conductive Pathways. Membranes 2021, 11, 90. https://0-doi-org.brum.beds.ac.uk/10.3390/membranes11020090
Wakiya T, Tanaka M, Kawakami H. Fabrication and Electrolyte Characterizations of Nanofiber Framework-Based Polymer Composite Membranes with Continuous Proton Conductive Pathways. Membranes. 2021; 11(2):90. https://0-doi-org.brum.beds.ac.uk/10.3390/membranes11020090
Chicago/Turabian StyleWakiya, Takeru, Manabu Tanaka, and Hiroyoshi Kawakami. 2021. "Fabrication and Electrolyte Characterizations of Nanofiber Framework-Based Polymer Composite Membranes with Continuous Proton Conductive Pathways" Membranes 11, no. 2: 90. https://0-doi-org.brum.beds.ac.uk/10.3390/membranes11020090