
Improvement of Membrane Distillation Using PVDF Membrane Incorporated with TiO2 Modified by Silane and Optimization of Fabricating Conditions


Abstract
:
1. Introduction
2. Materials and Methods
2.1. Chemicals
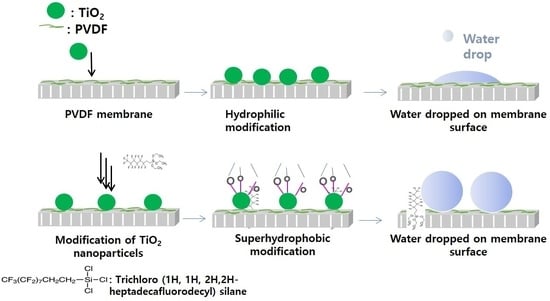
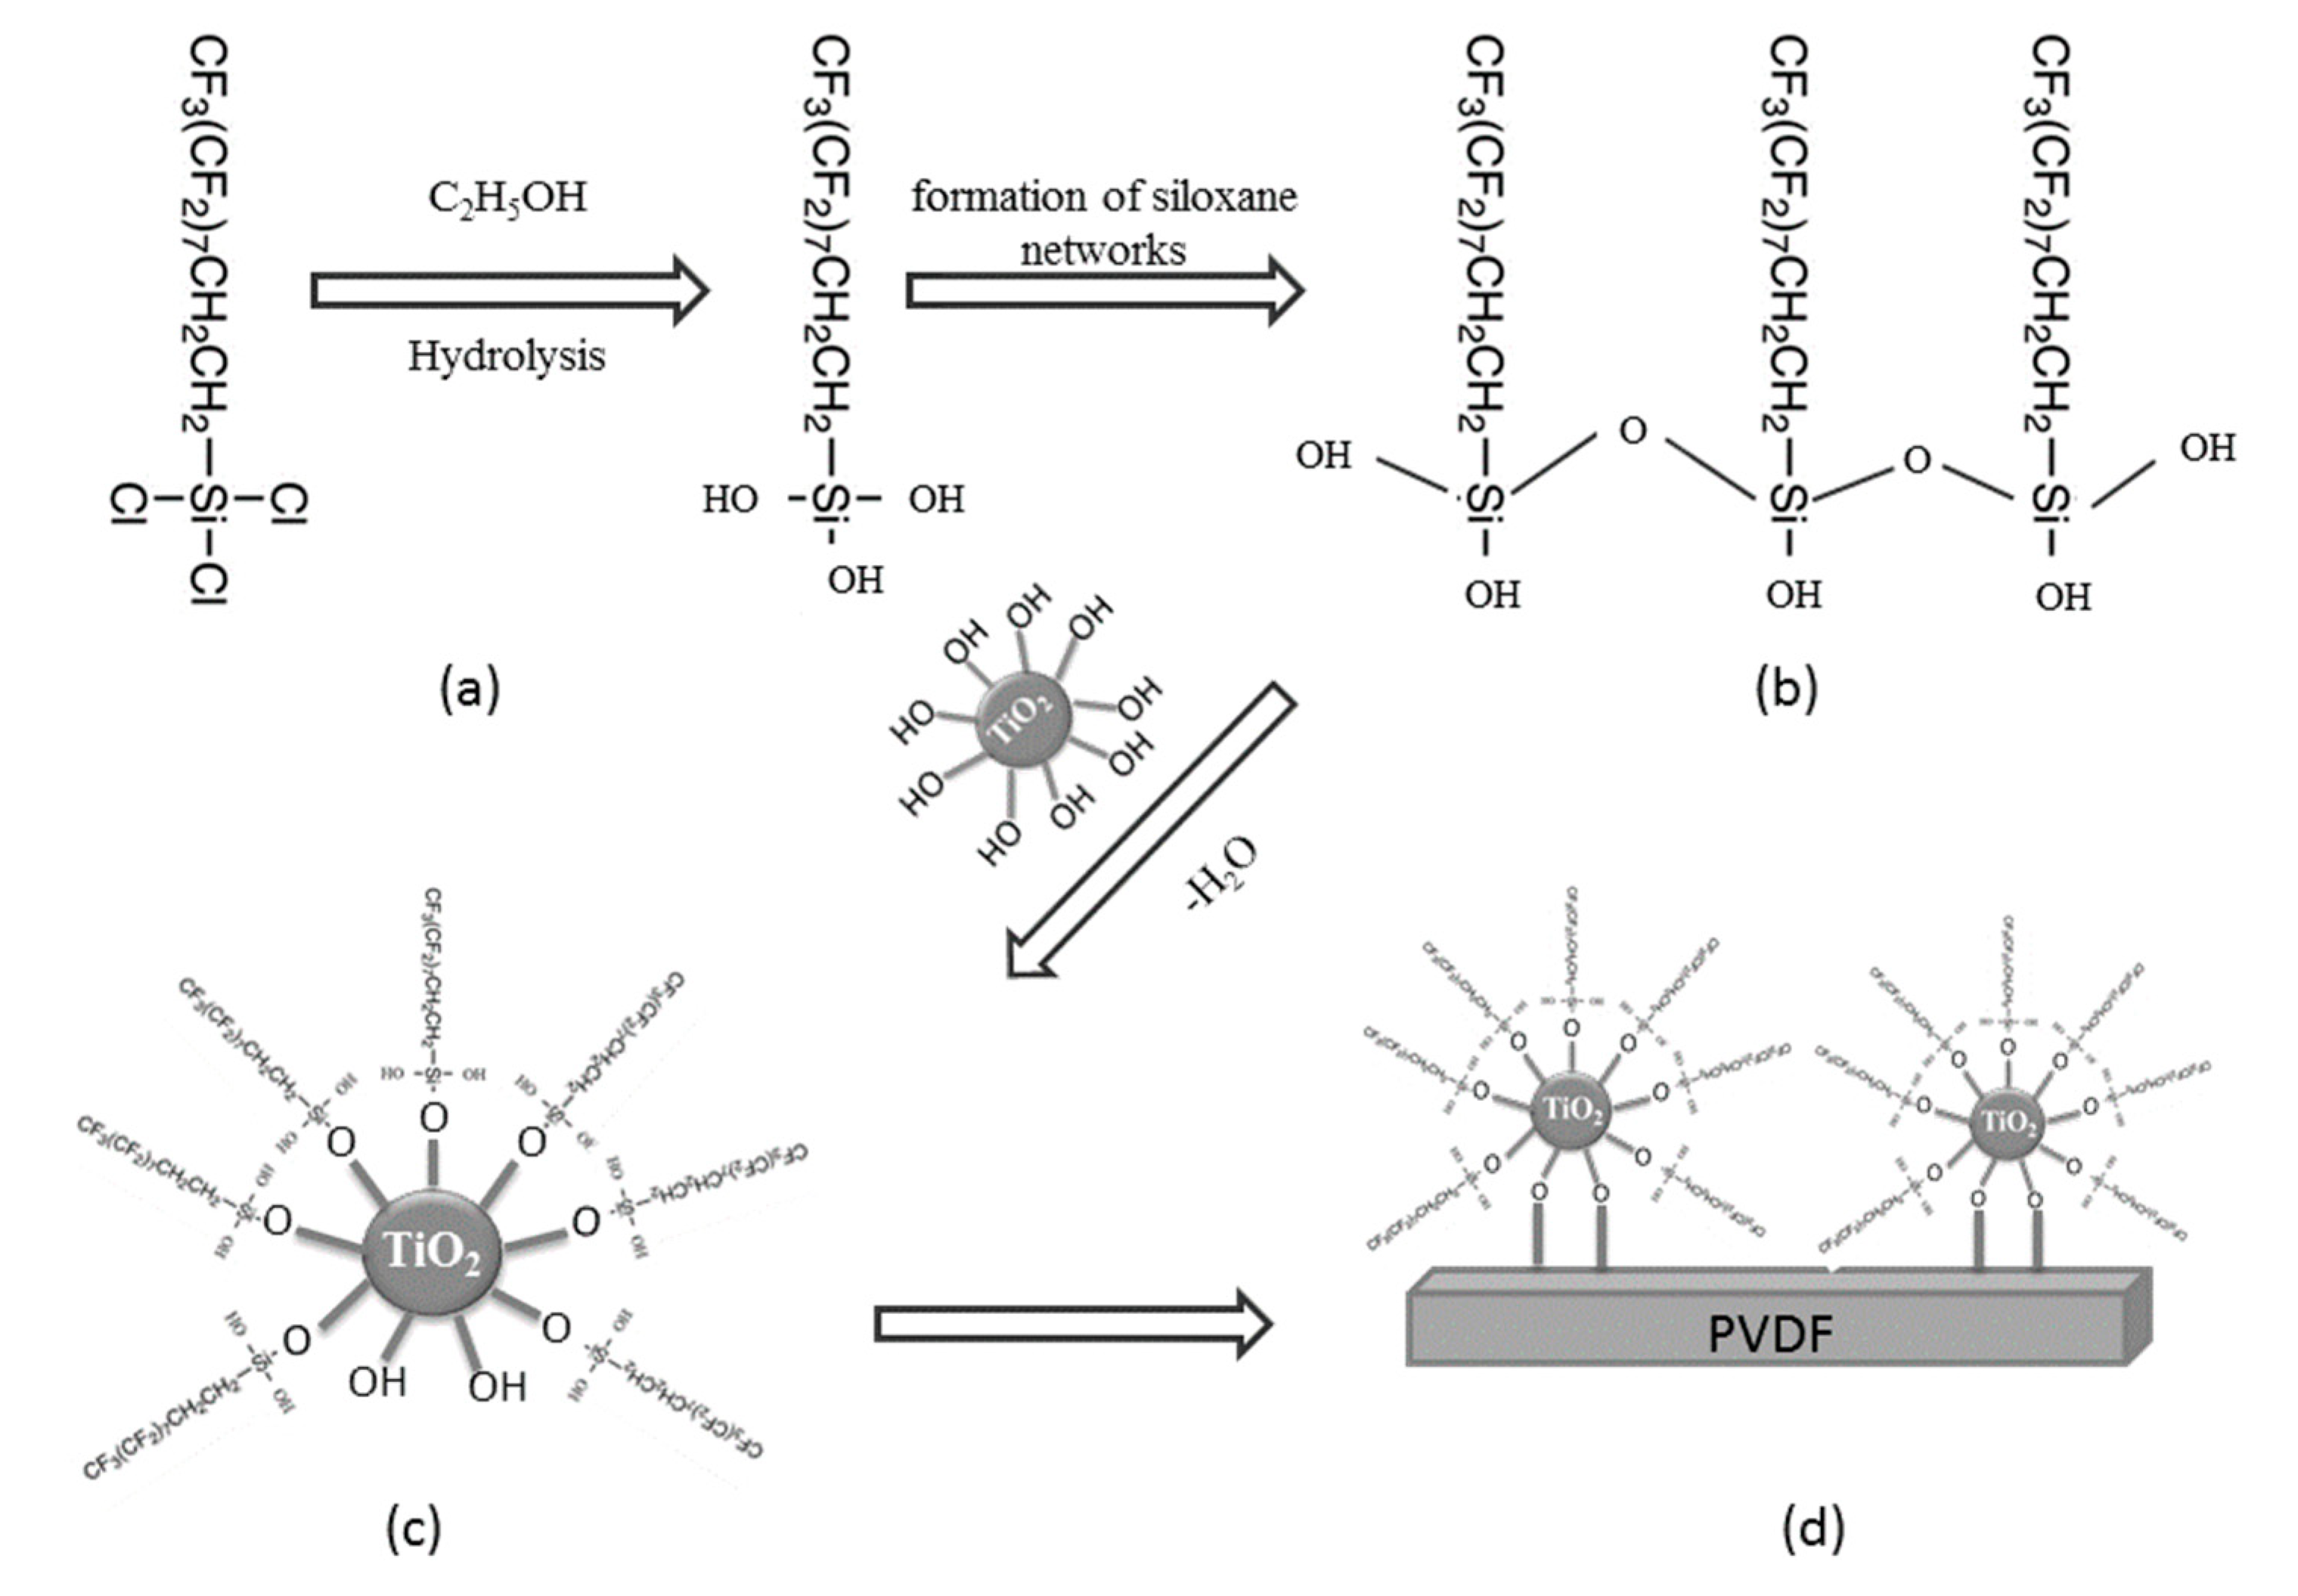
2.2. Synthesis and Modification of PVDF Membrane
2.3. Membrane Characterization
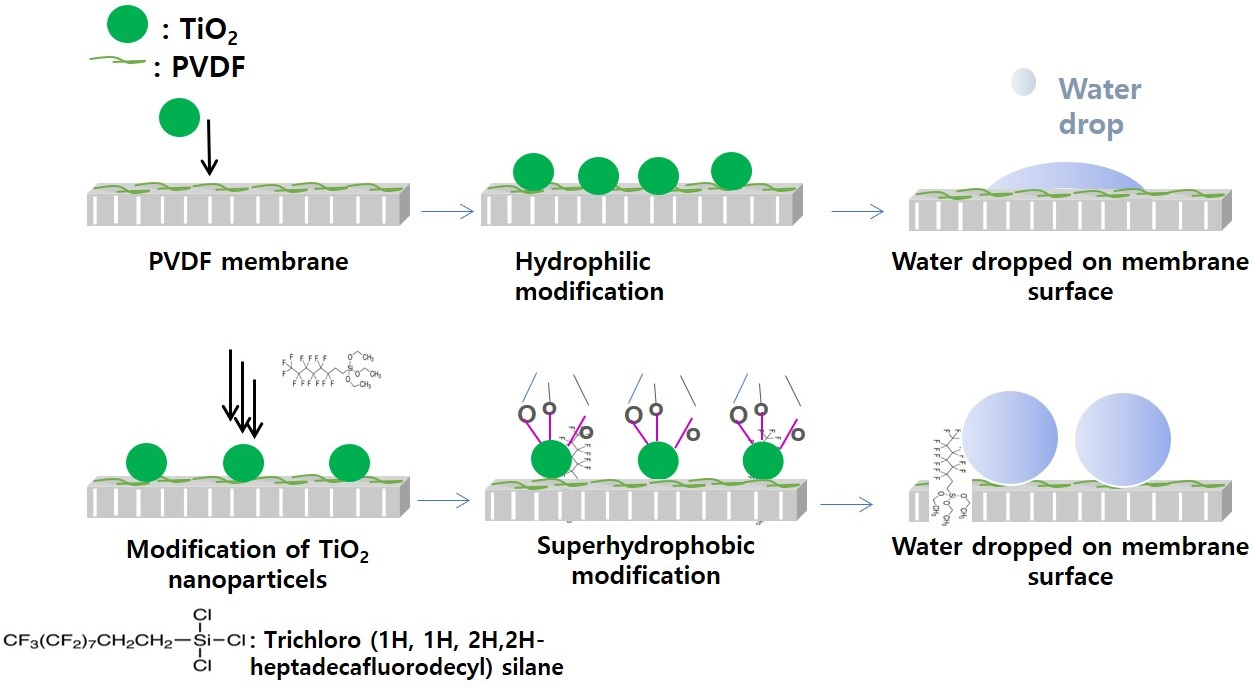
2.4. Experimental Set-Up ofDirect Contact Membrane Distillation
2.5. RSM for Experimental Design and Optimization
3. Results and Discussion
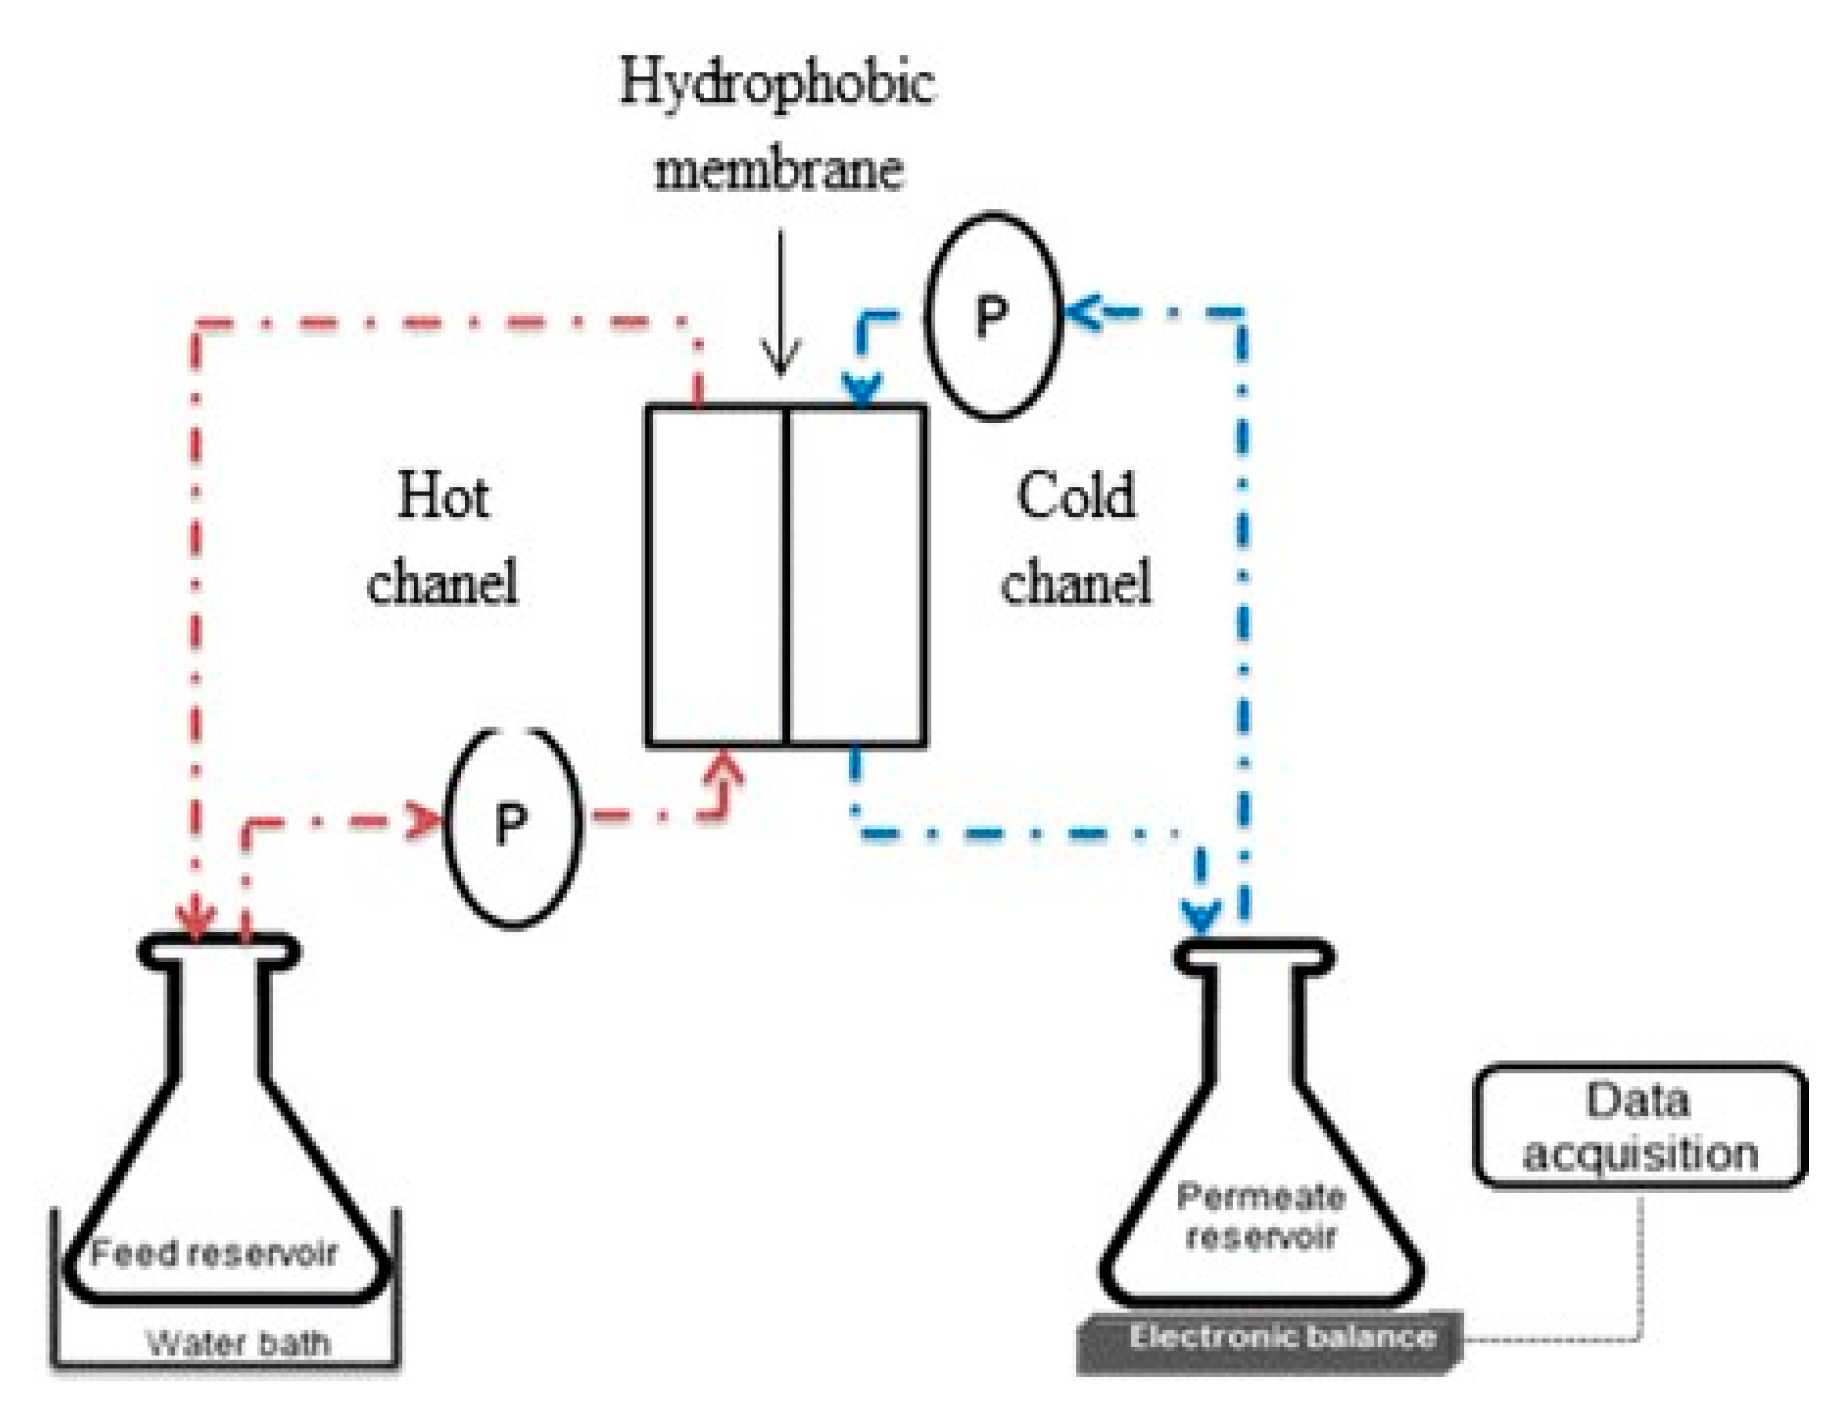
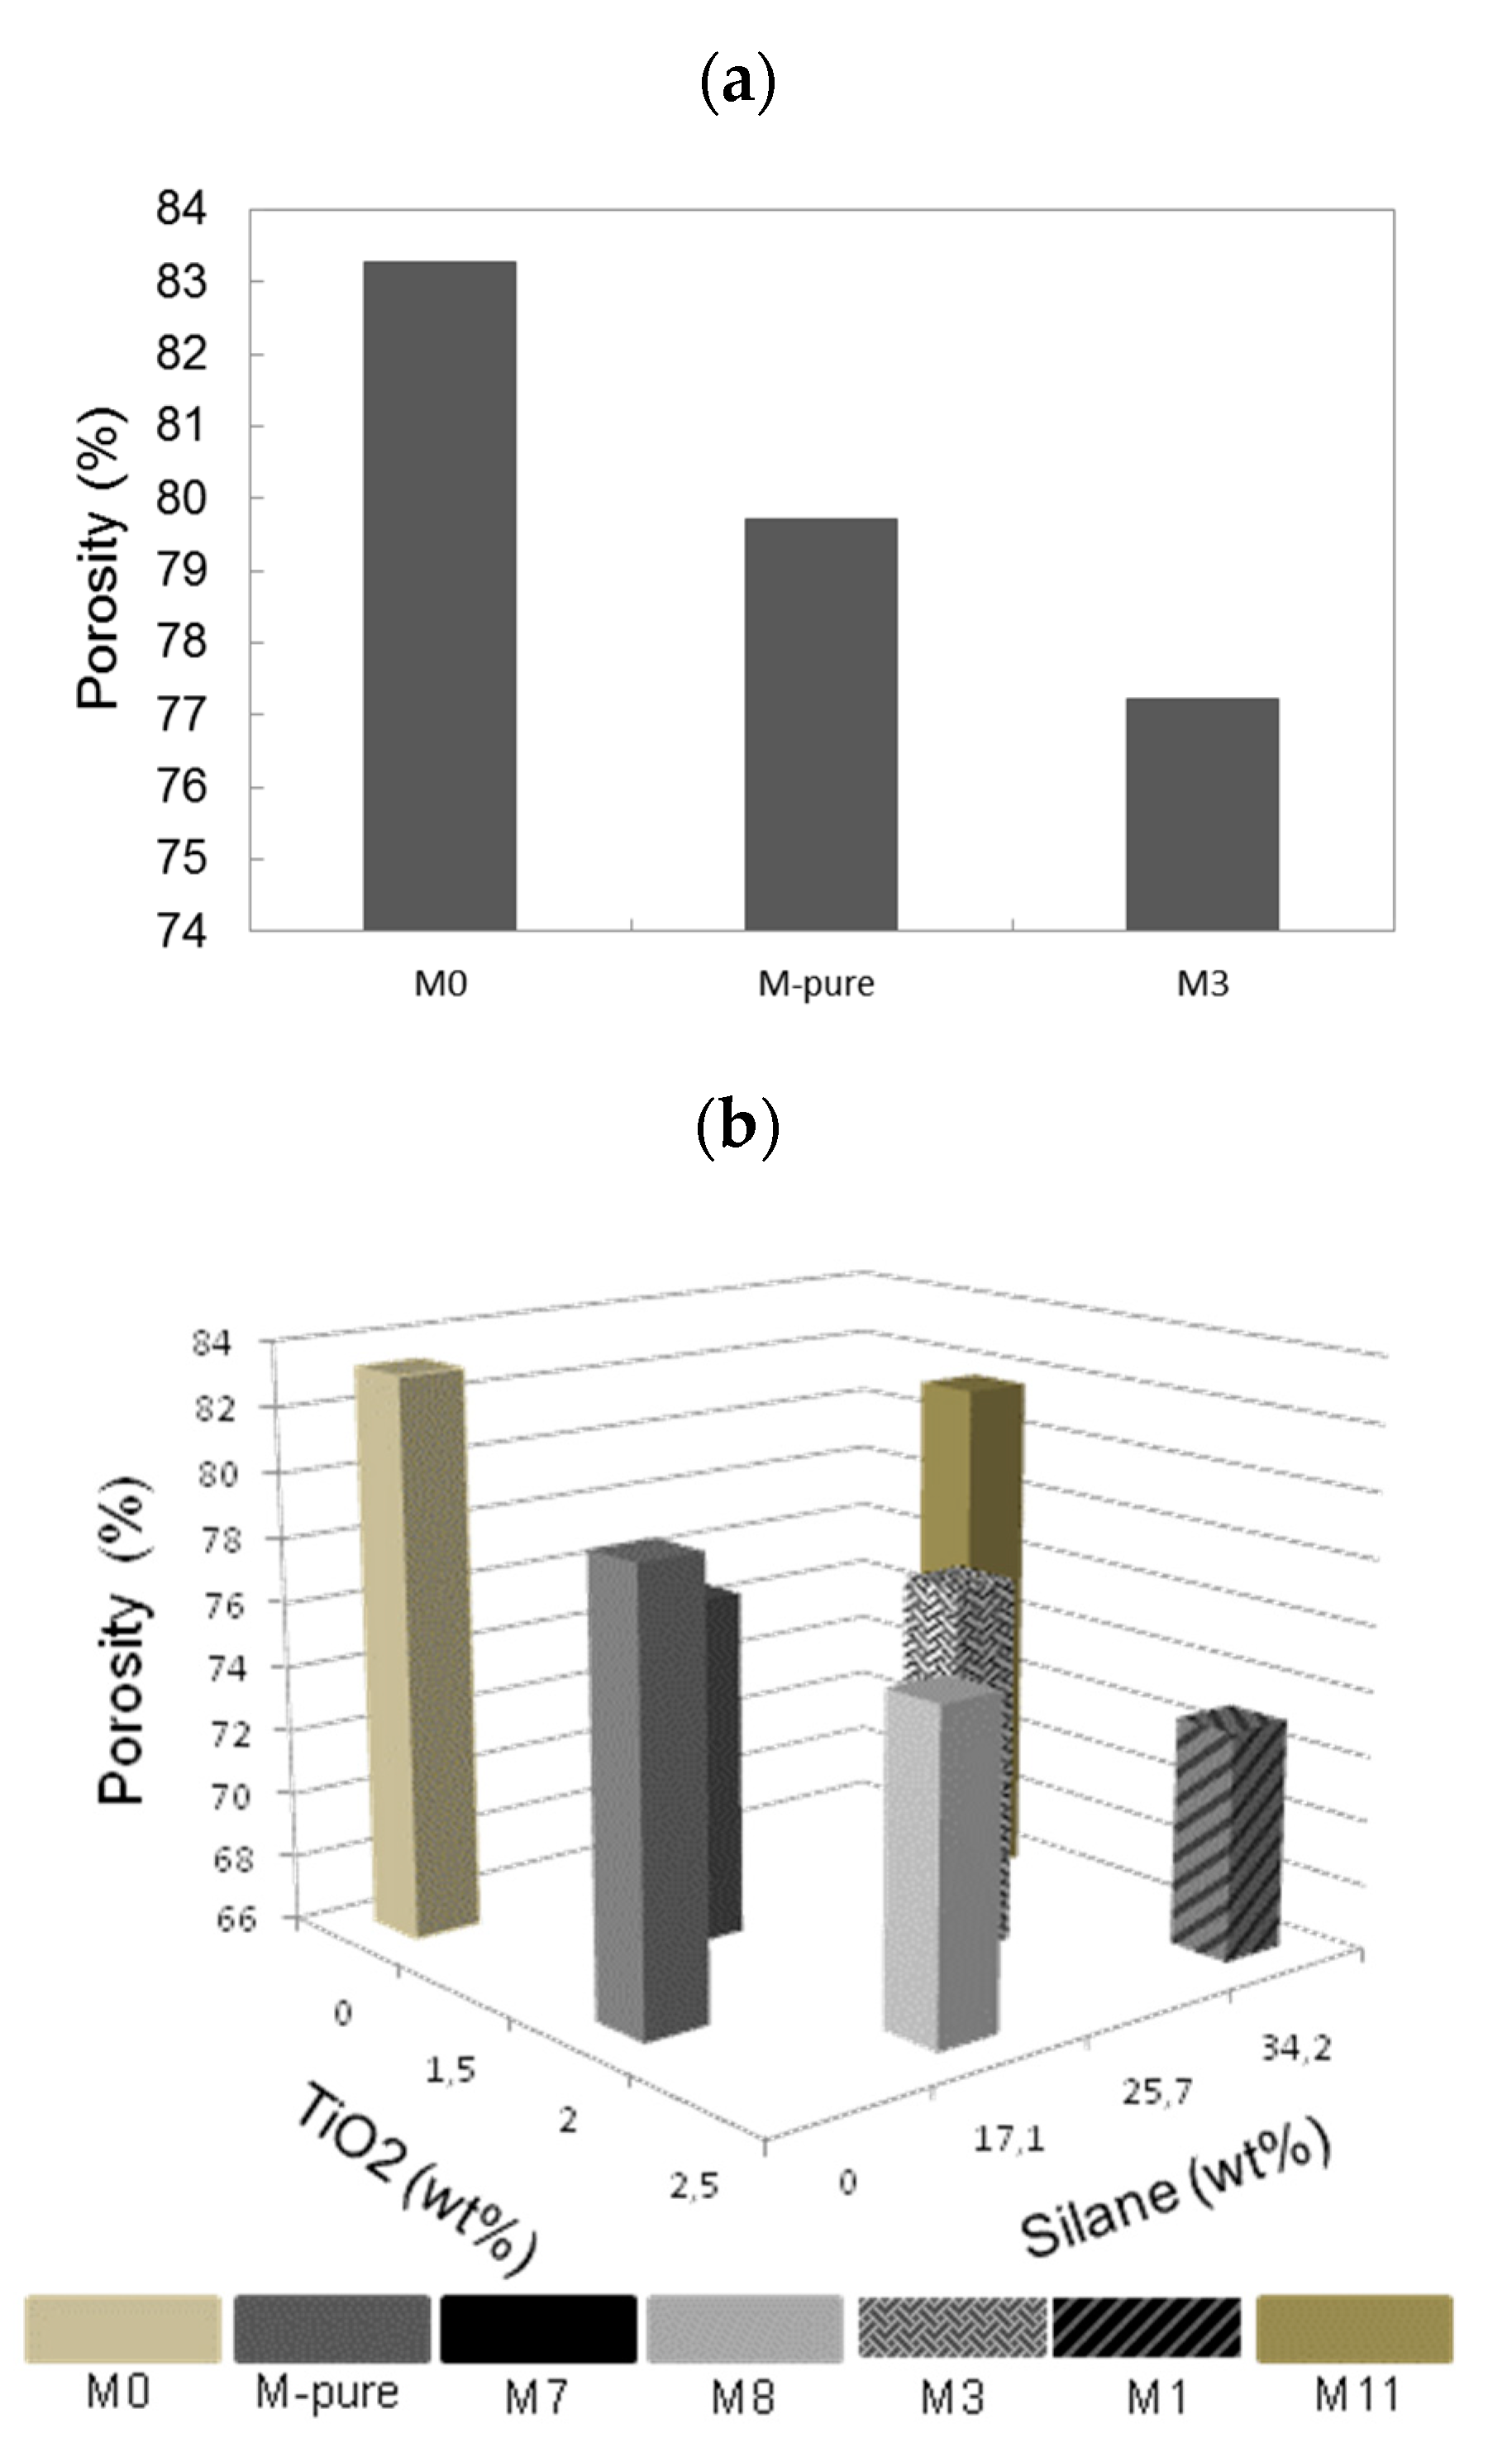
3.1. Membrane Porosity
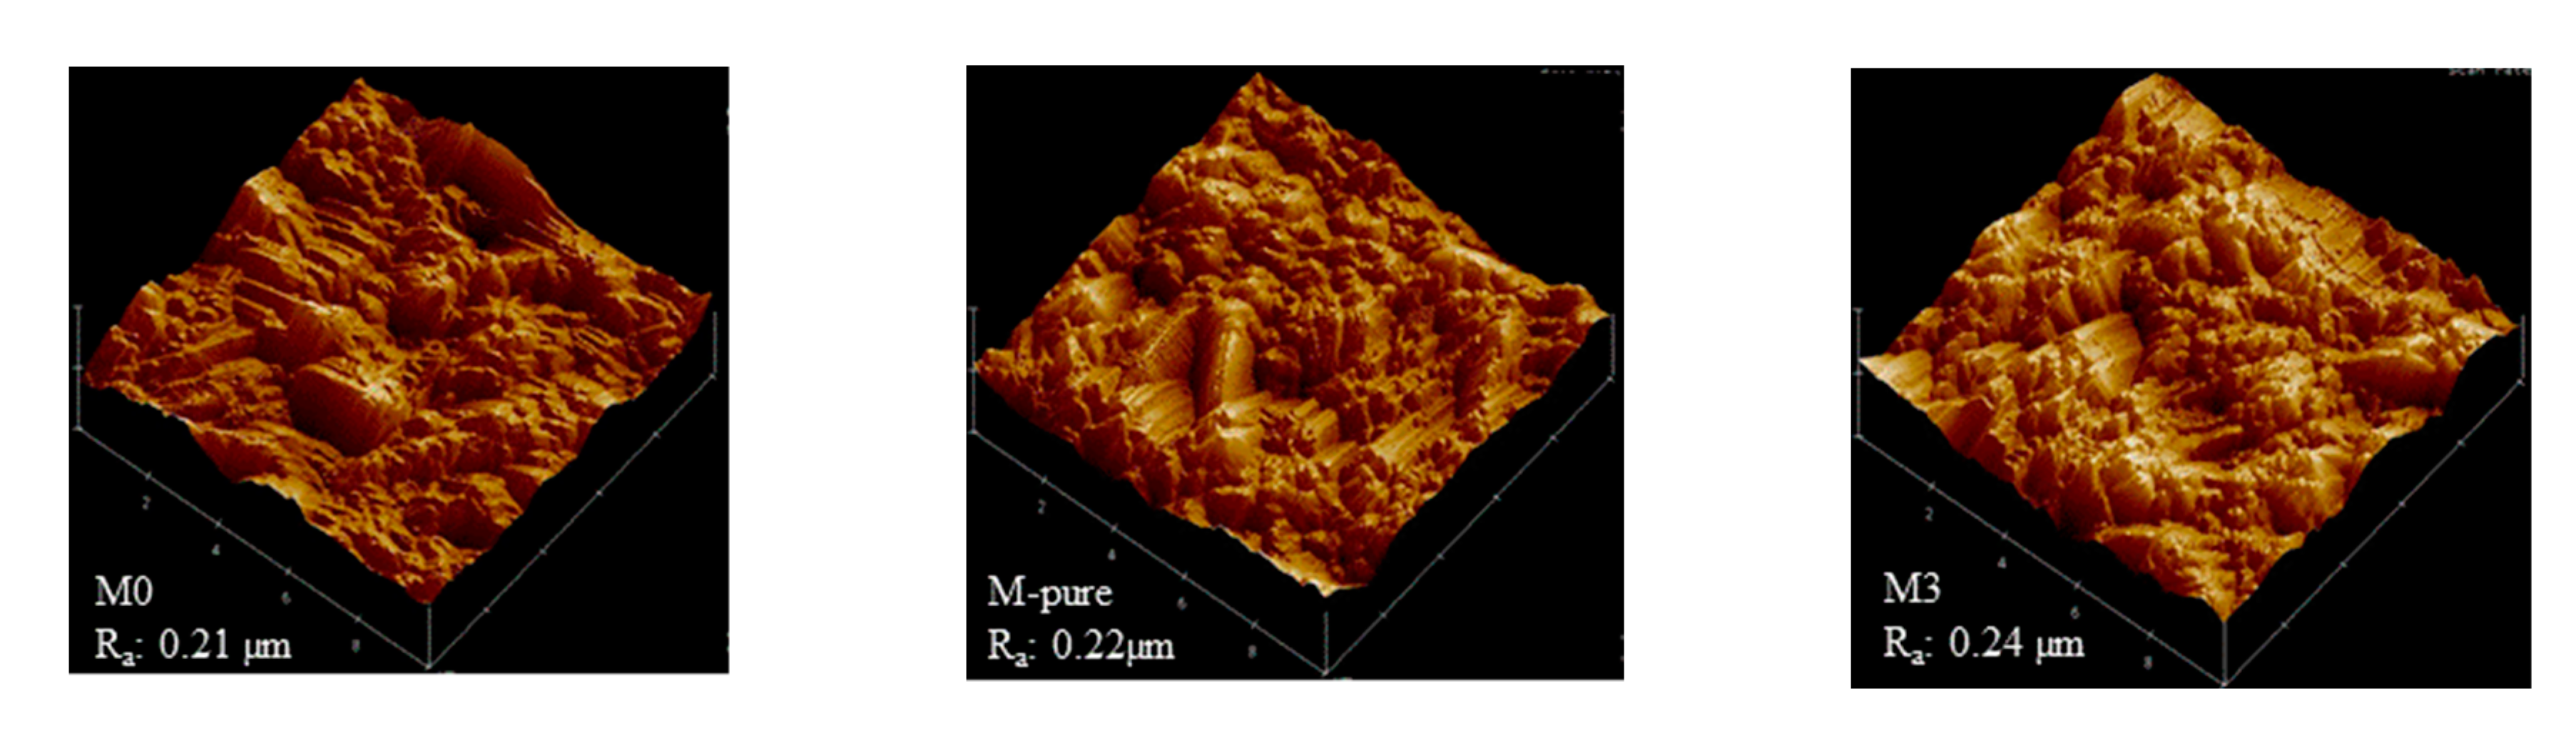
3.2. Membrane Hydrophobicity
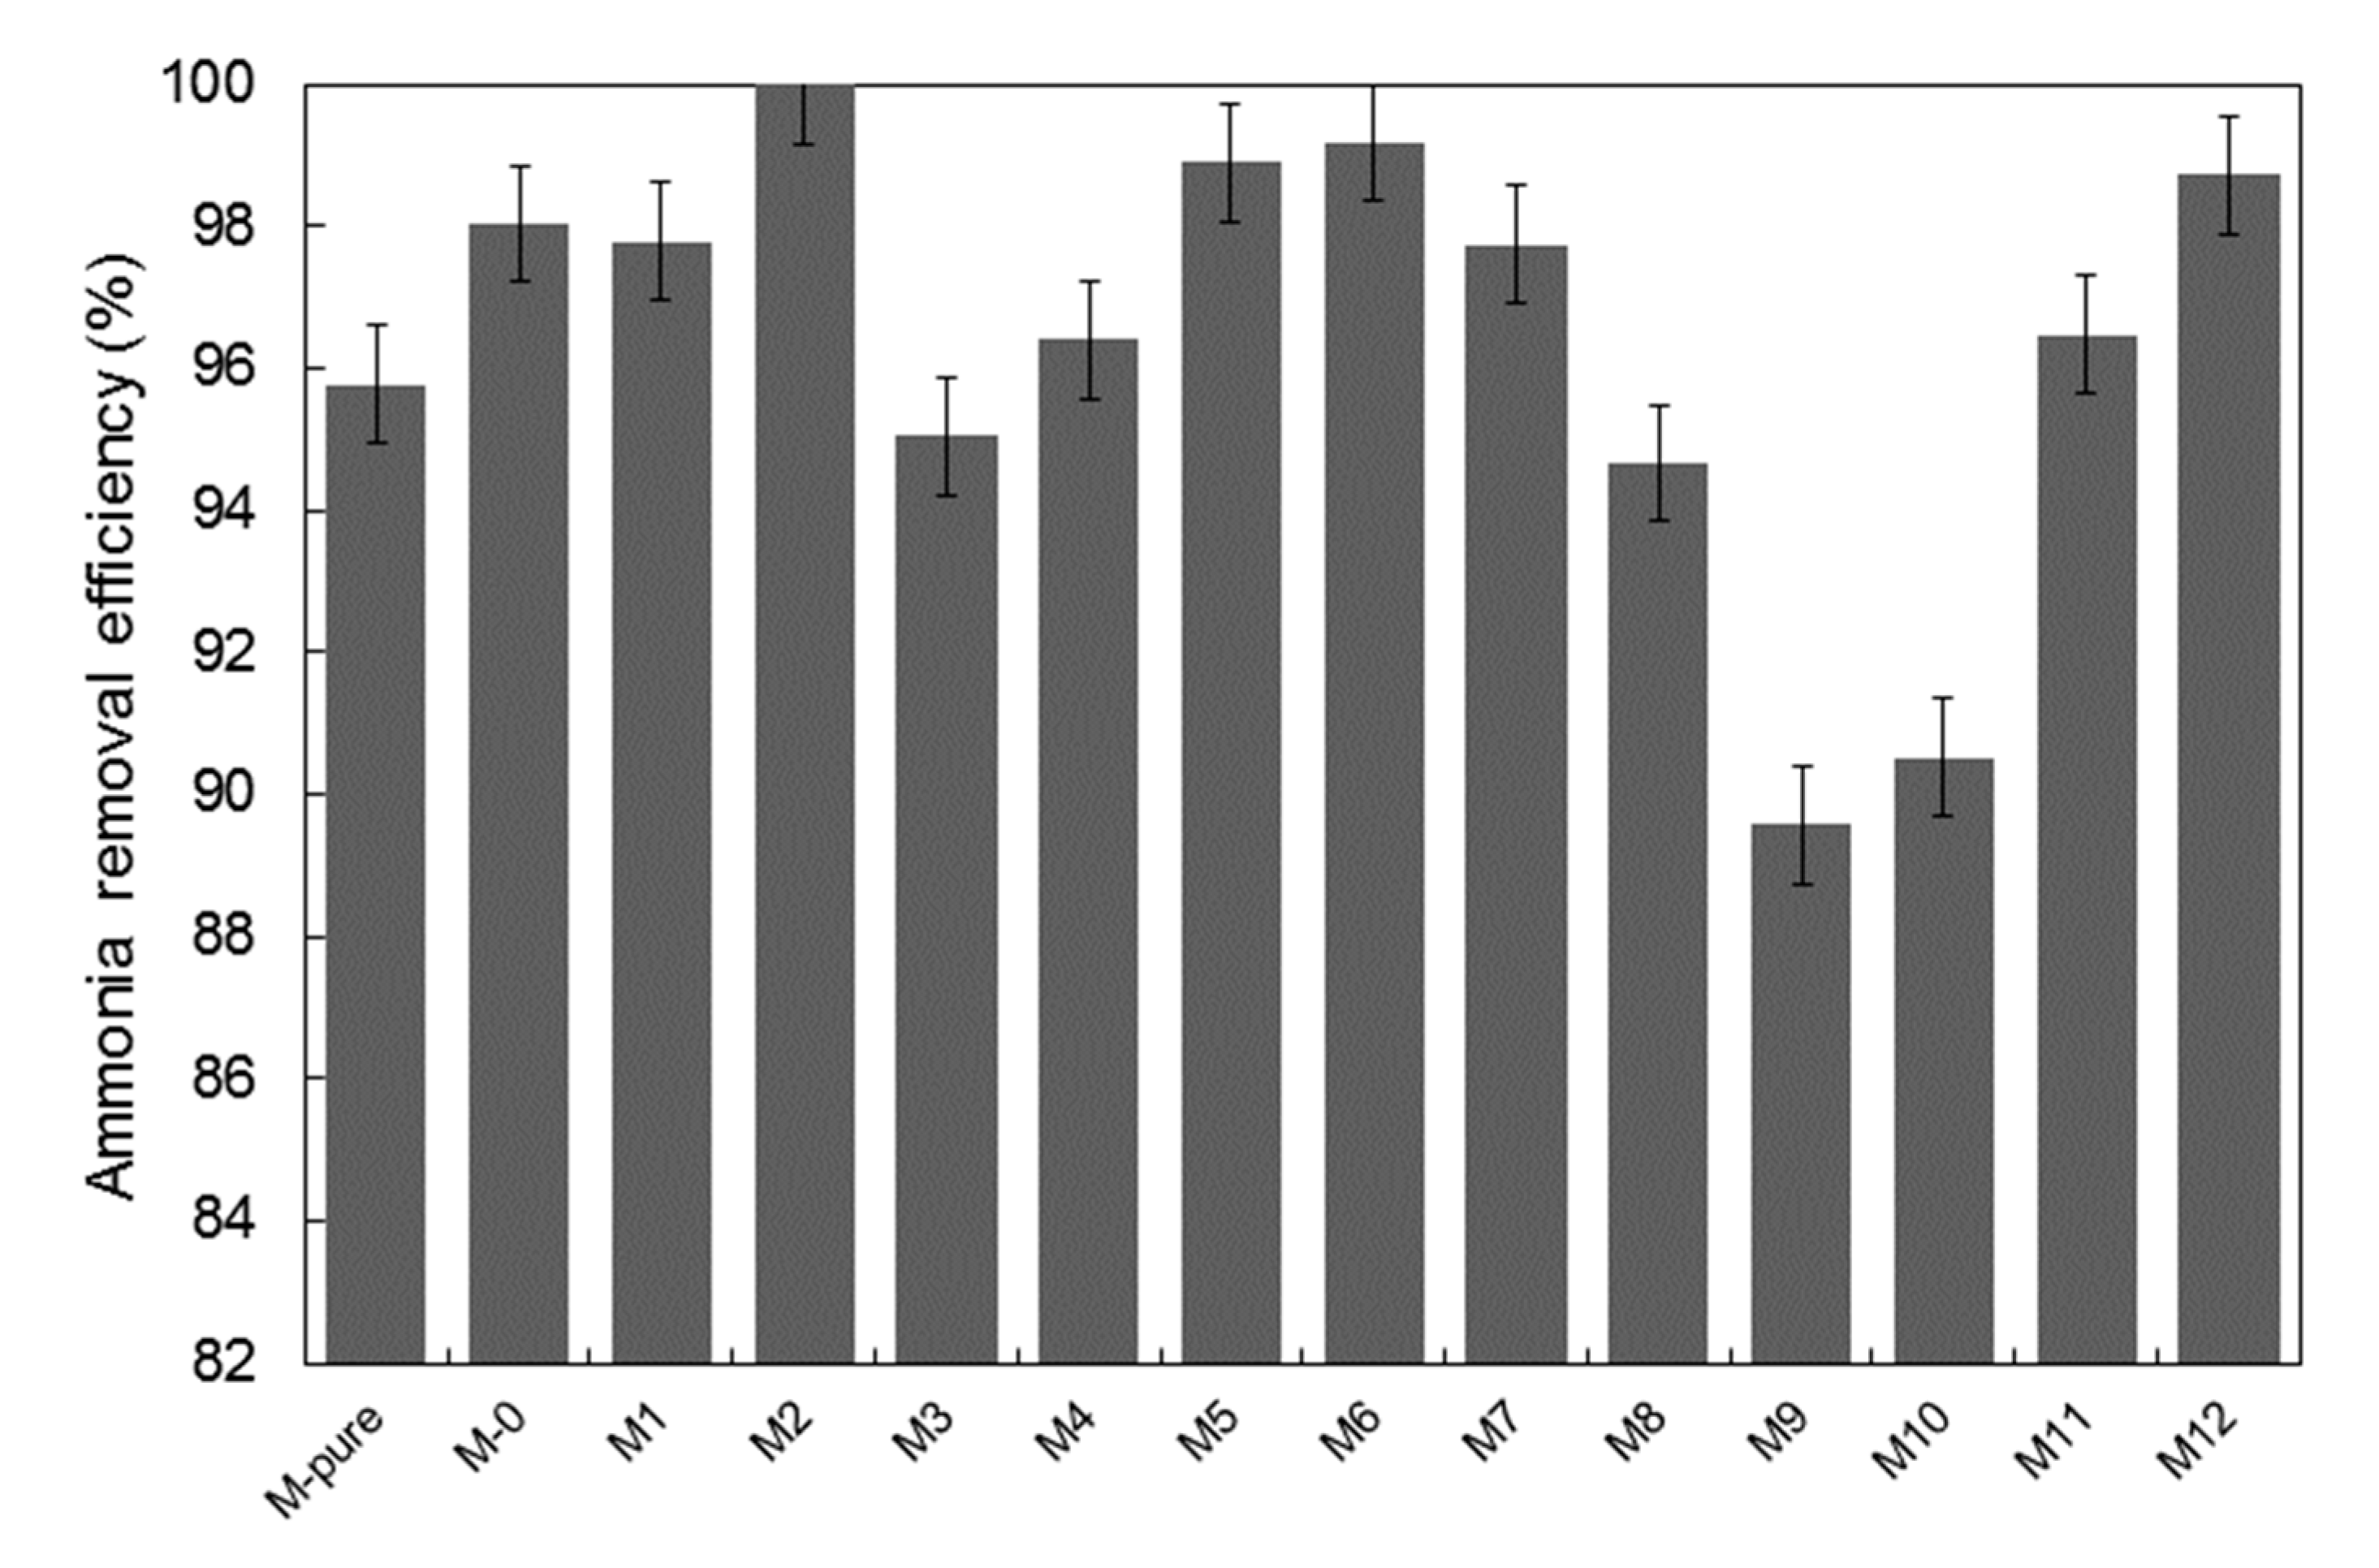
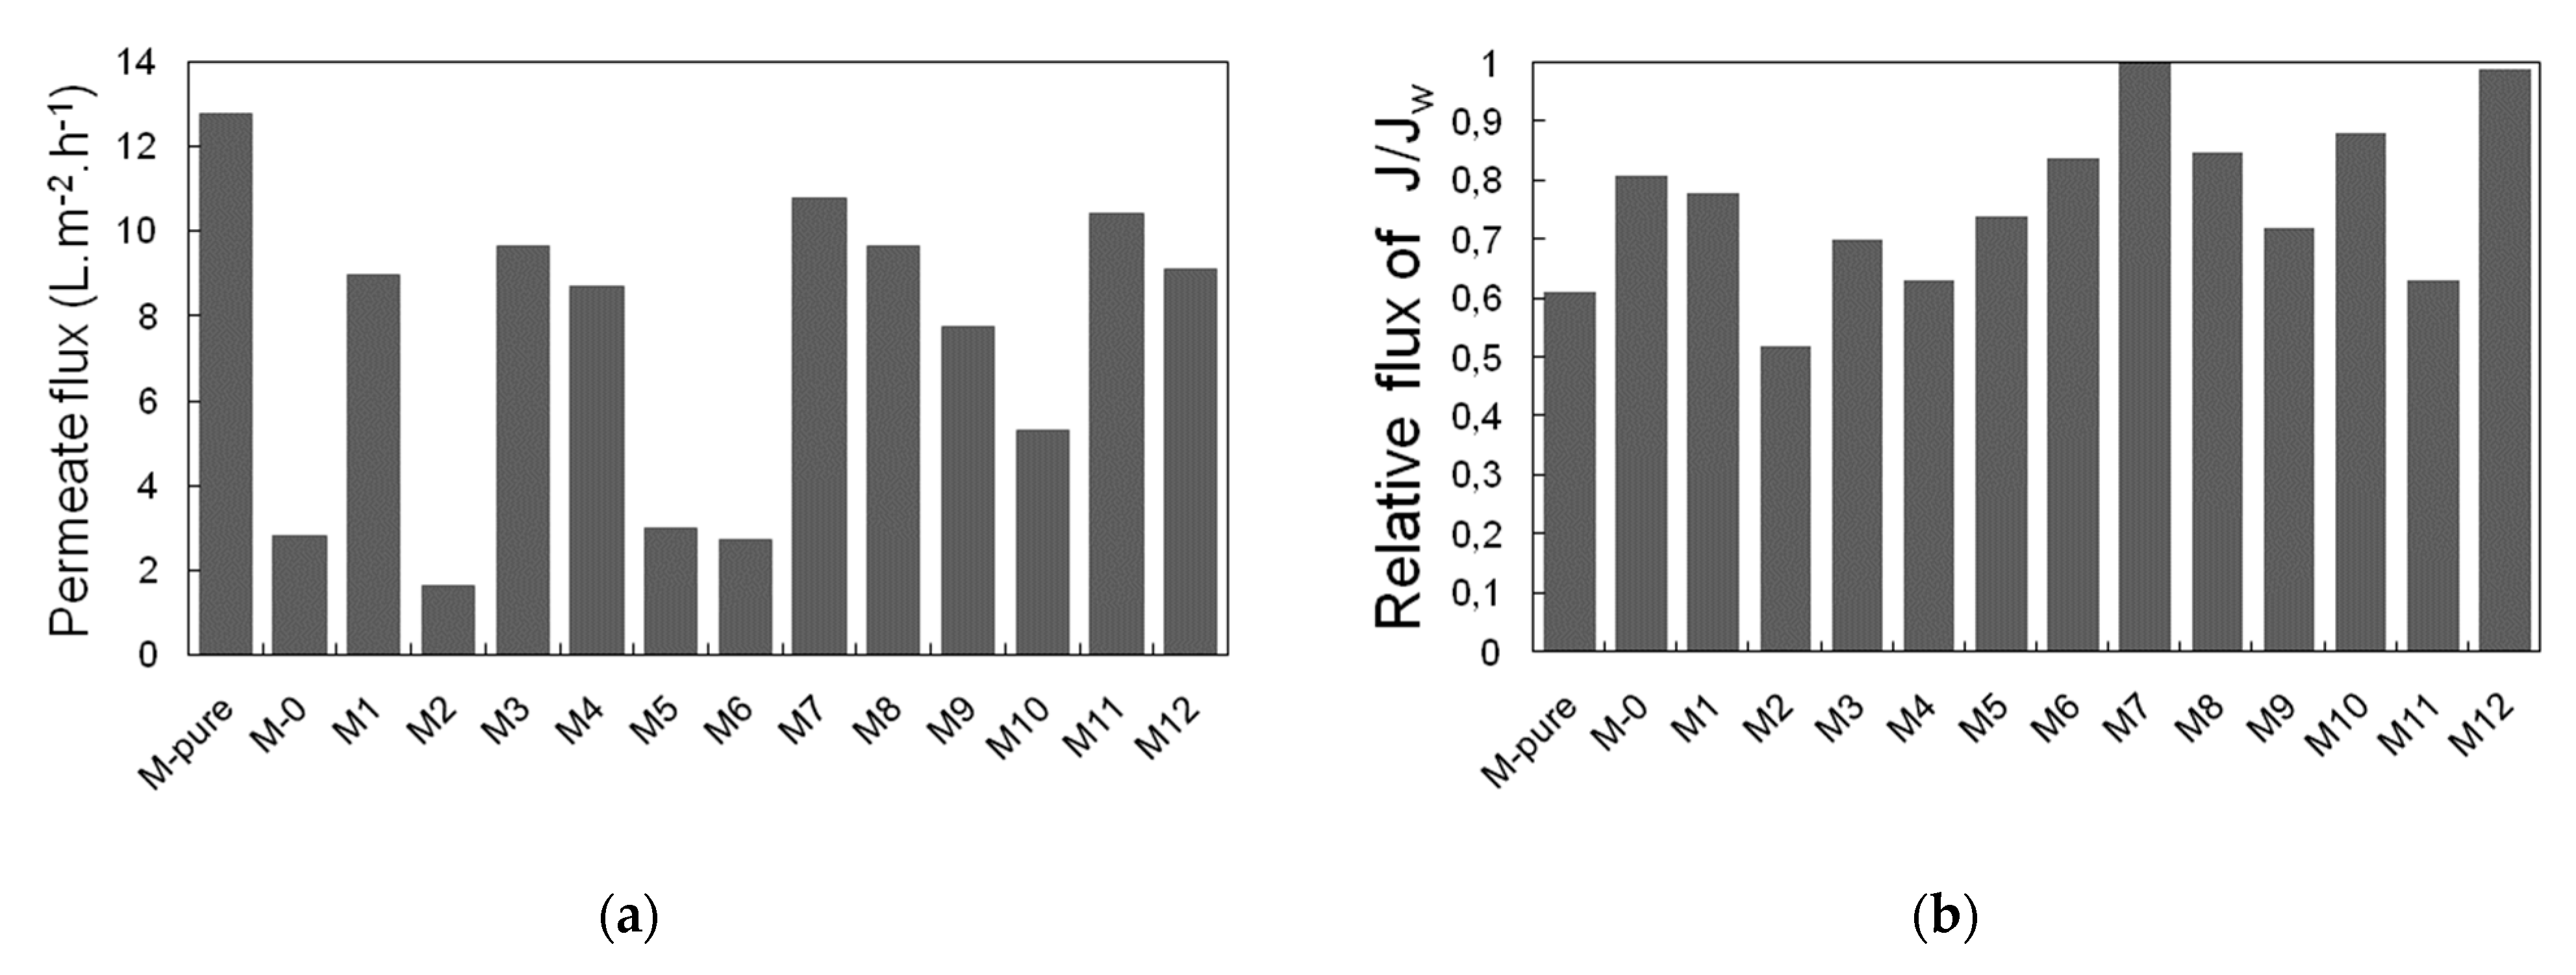
3.3. Permeate Flux and Ammonium Rejection
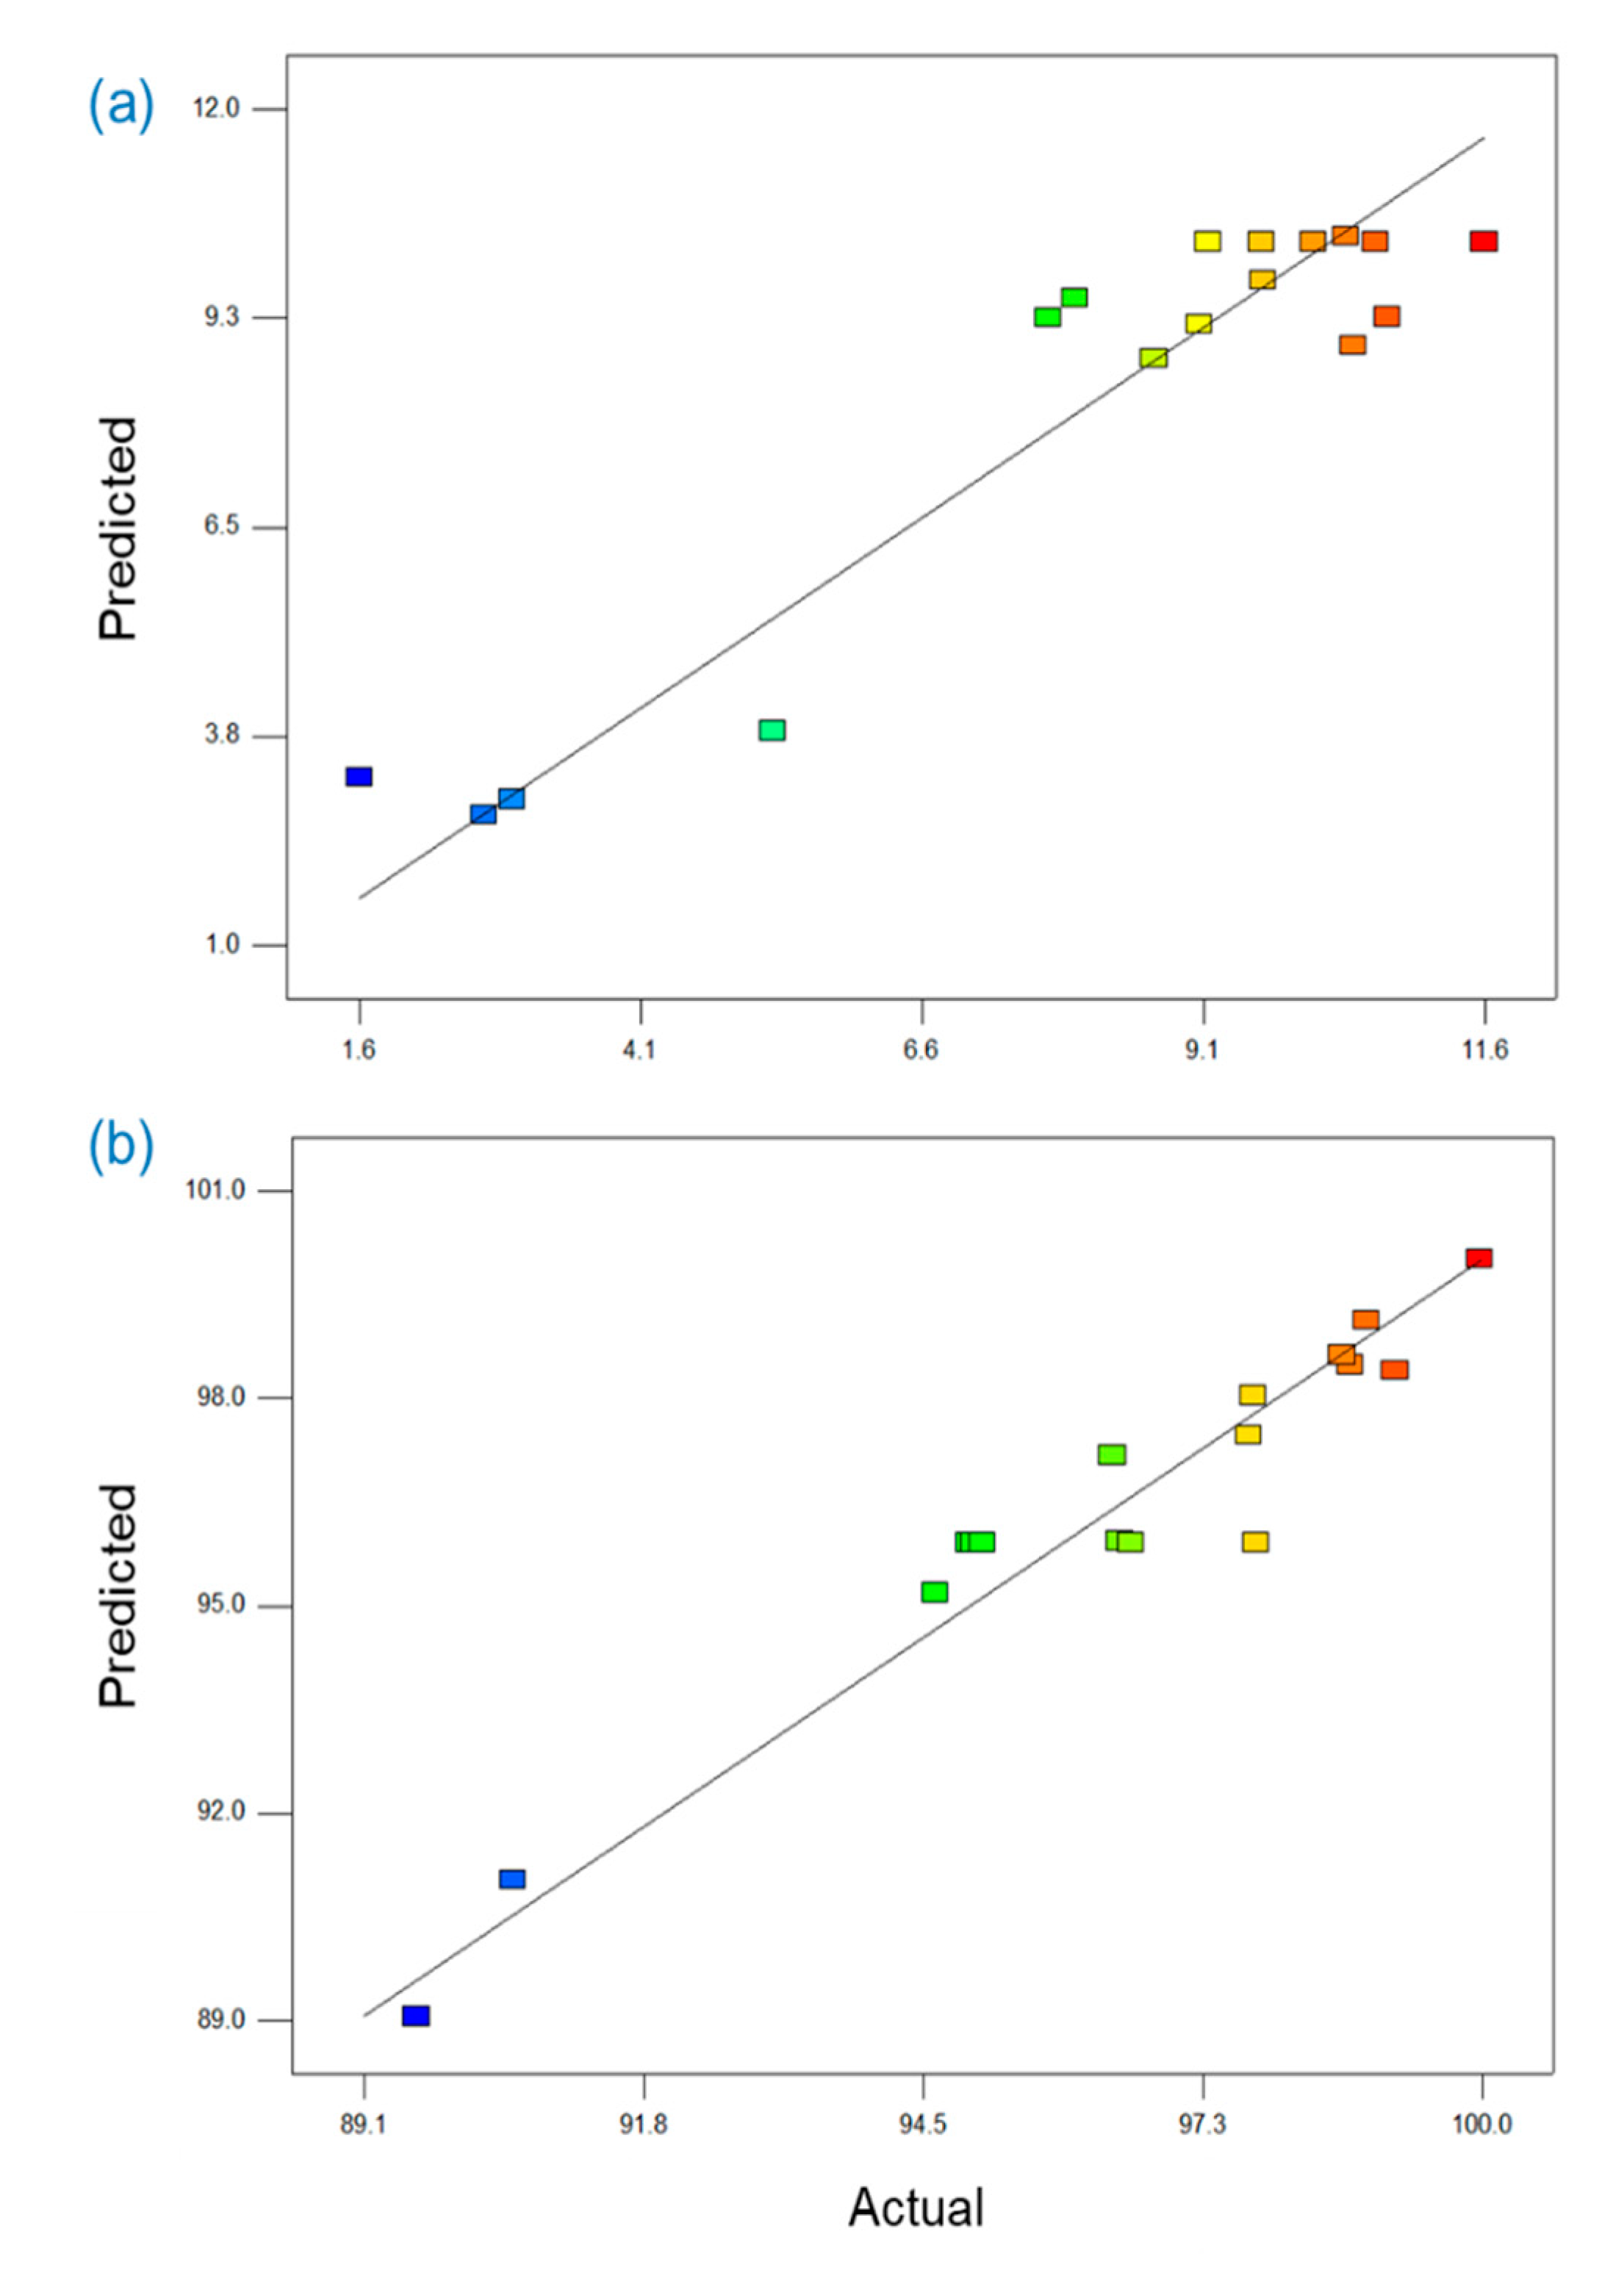
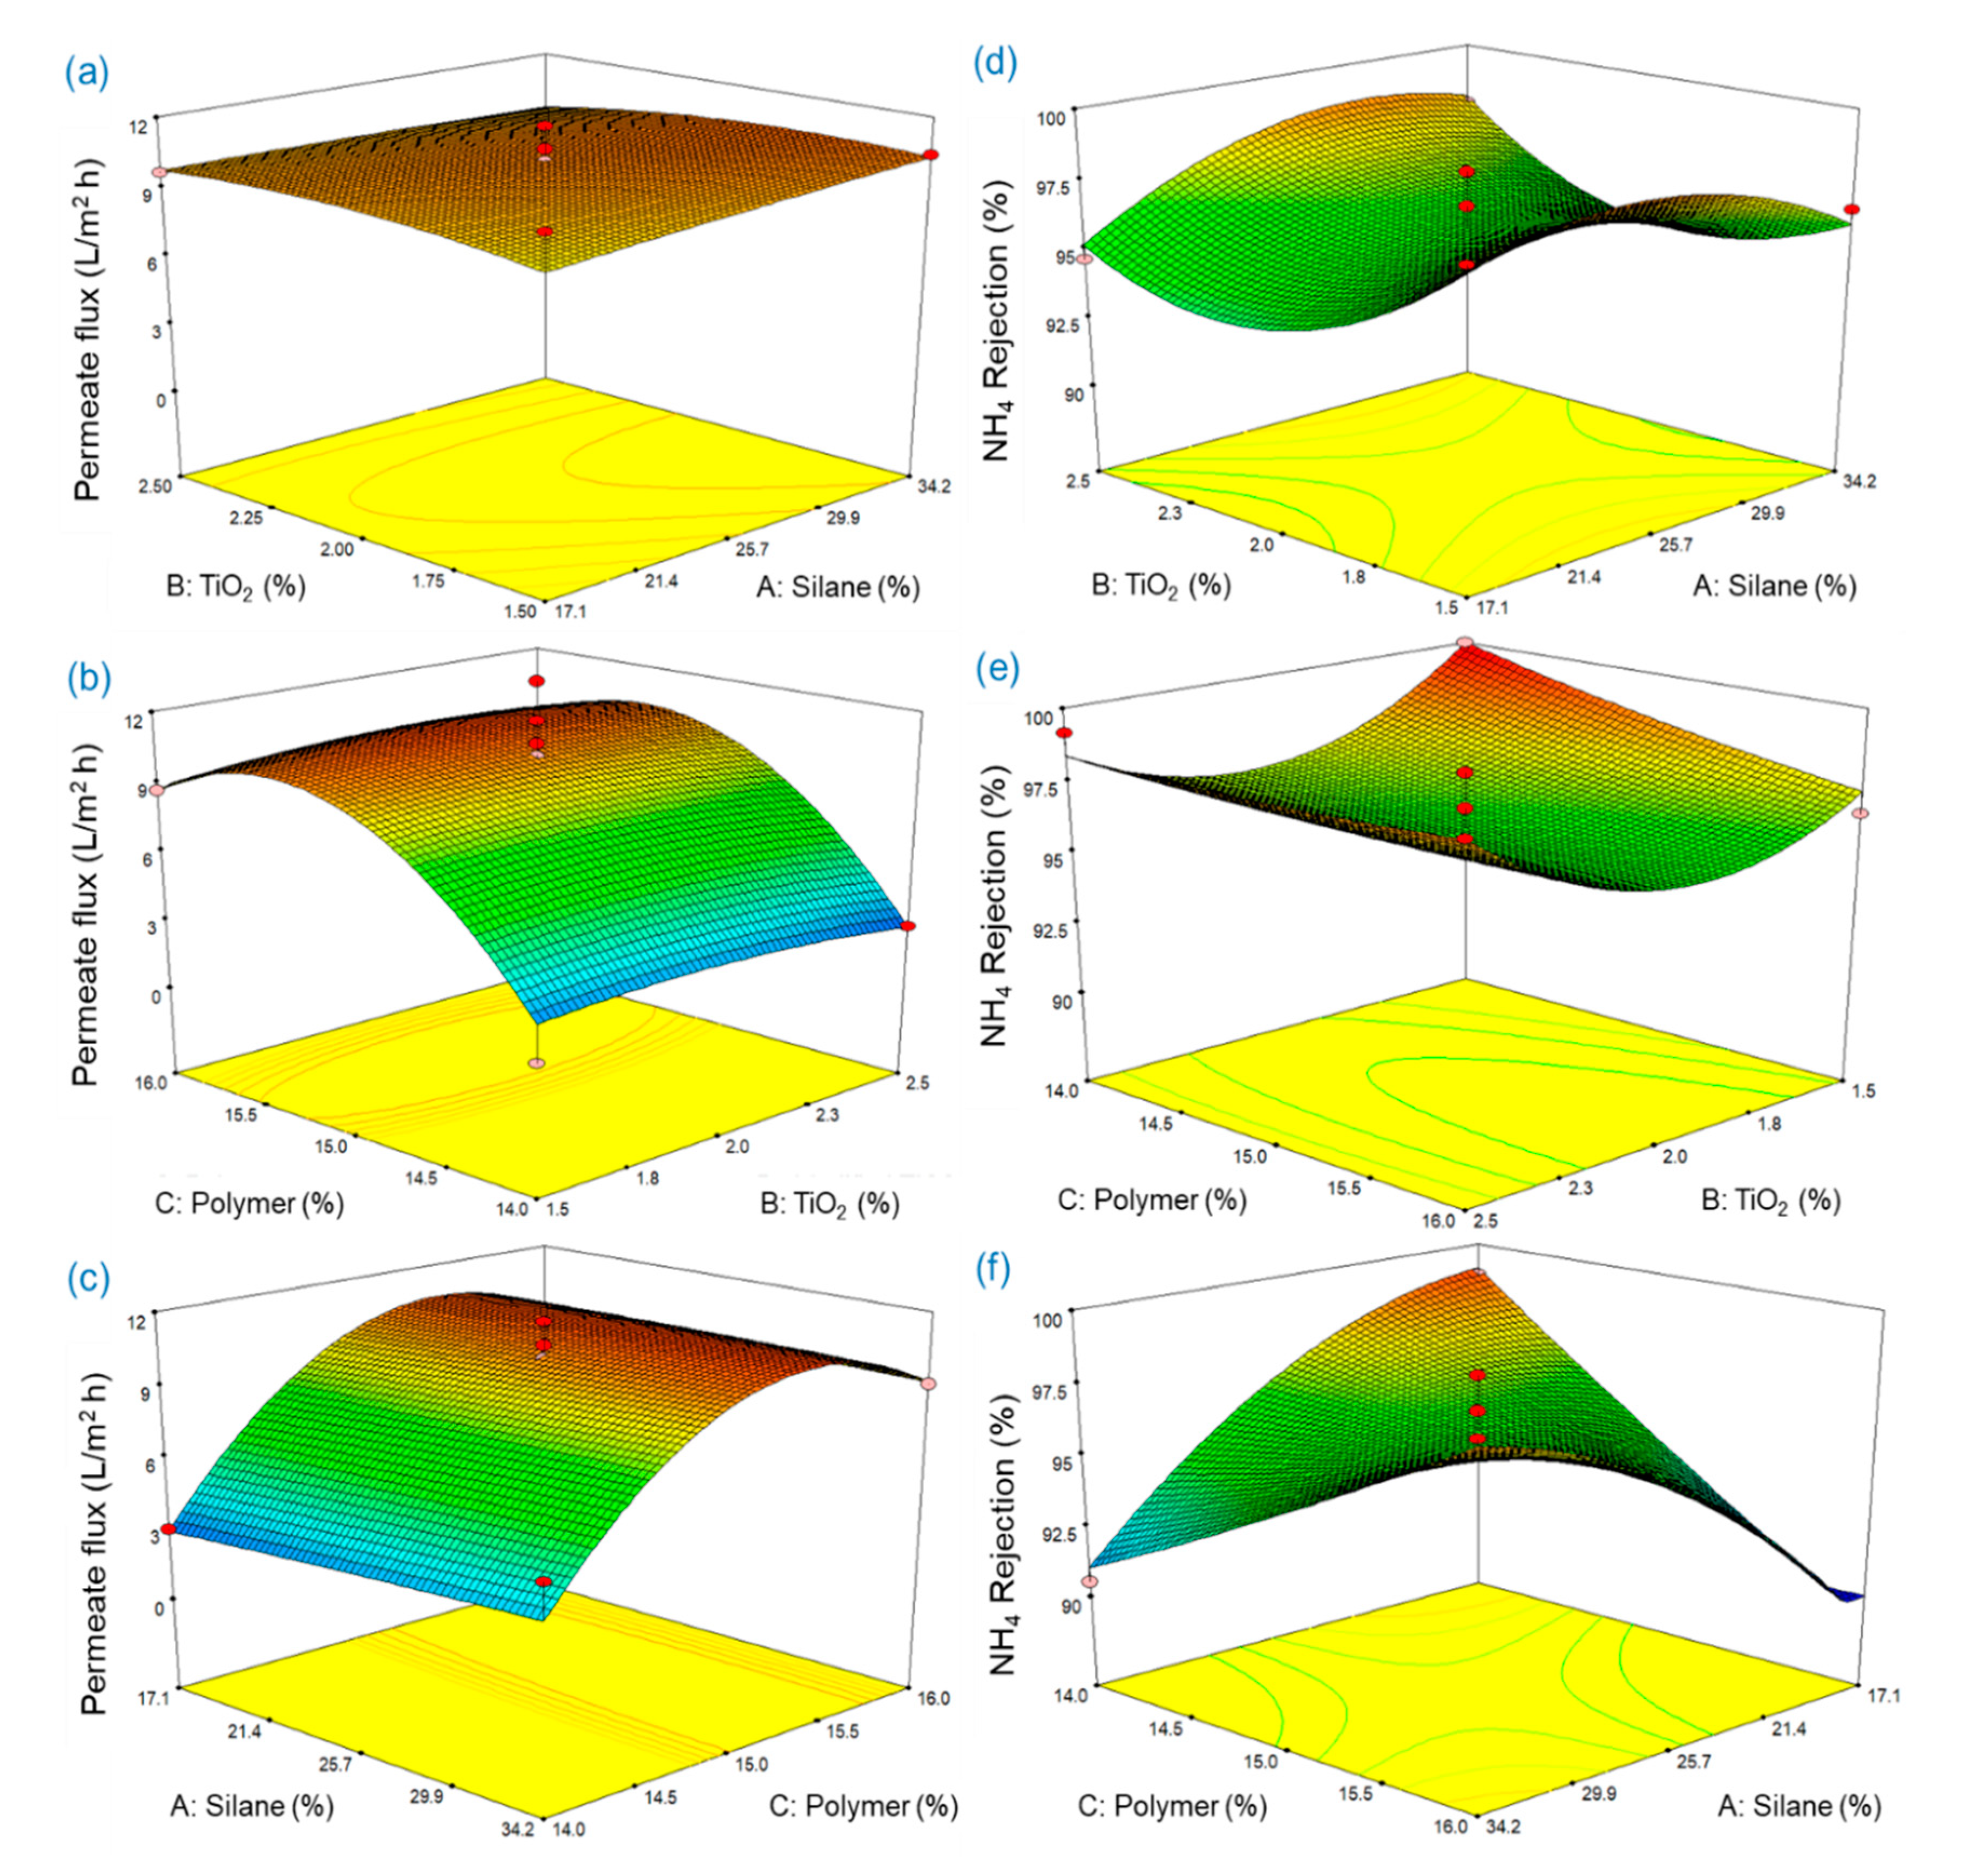
3.4. Application of Response Surface Methodology for Membrane Fabrication
4. Conclusions
Supplementary Materials
Author Contributions
Funding
Conflicts of Interest
References
- Bae, T.-H.; Tak, T.-M. Effect of TiO2 nanoparticles on fouling mitigation of ultrafiltration membranes for activated sludge filtration. J. Membr. Sci. 2005, 249, 1–8. [Google Scholar] [CrossRef]
- Cao, X.; Ma, J.; Shi, X.; Ren, Z. Effect of TiO2 nanoparticle size on the performance of PVDF membrane. Appl. Surf. Sci. 2006, 253, 2003–2010. [Google Scholar] [CrossRef]
- Diebold, U. The surface science of titanium dioxide. Surf. Sci. Rep. 2003, 48, 53–229. [Google Scholar] [CrossRef]
- Huo, R.; Gu, Z.; Zuo, K.; Zhao, G. Preparation and properties of PVDF-fabric composite membrane for membrane distillation. Desalination 2009, 249, 910–913. [Google Scholar] [CrossRef]
- Tang, Y.; Li, N.; Liu, A.; Ding, S.; Yi, C.; Liu, H. Effect of spinning conditions on the structure and performance of hydrophobic PVDF hollow fiber membranes for membrane distillation. Desalination 2012, 287, 326–339. [Google Scholar] [CrossRef]
- Meyer, E.E.; Rosenberg, K.J.; Israelachvili, J. Recent progress in understanding hydrophobic interactions. Proc. Natl. Acad. Sci. USA 2006, 103, 15739–15746. [Google Scholar] [CrossRef] [Green Version]
- Meng, S.; Ye, Y.; Mansouri, J.; Chen, V. Fouling and crystallisation behaviour of superhydrophobic nano-composite PVDF membranes in direct contact membrane distillation. J. Membr. Sci. 2014, 463, 102–112. [Google Scholar] [CrossRef]
- Zuo, G.; Wang, R. Novel membrane surface modification to enhance anti-oil fouling property for membrane distillation application. J. Membr. Sci. 2013, 447, 26–35. [Google Scholar] [CrossRef]
- Ou, J.; Hu, W.; Xue, M.; Wang, F.; Li, W. One-step solution immersion process to fabricate superhydrophobic surfaces on light alloys. ACS Appl. Mater. Interfaces 2013, 5, 9867–9871. [Google Scholar] [CrossRef]
- El-Abbassi, A.; Khayet, M.; Kiai, H.; Hafidi, A.; García-Payo, M.C. Treatment of crude olive mill wastewaters by osmotic distillation and osmotic membrane distillation. Sep. Purif. Technol. 2013, 104, 327–332. [Google Scholar] [CrossRef]
- El-Abbassi, A.; Hafidi, A.; Khayet, M.; García-Payo, M.C. Integrated direct contact membrane distillation for olive mill wastewater treatment. Desalination 2013, 323, 31–38. [Google Scholar] [CrossRef]
- Kiai, H.; García-Payo, M.; Hafidi, A.; Khayet, M. Application of membrane distillation technology in the treatment of table olive wastewaters for phenolic compounds concentration and high quality water production. Chem. Eng. Process. Process Intensif. 2014, 86, 153–161. [Google Scholar] [CrossRef]
- Tibi, F.; Guo, J.; Ahmad, R.; Lim, M.; Kim, M.; Kim, J. Membrane distillation as post-treatment for anaerobic fluidized bed membrane bioreactor for organic and nitrogen removal. Chemosphere 2019, 234, 756–762. [Google Scholar] [CrossRef]
- Lafuma, A.; Quéré, D. Superhydrophobic states. Nat. Mater. 2003, 2, 457–460. [Google Scholar] [CrossRef]
- Ma, J.; Wang, Z.; Pan, M.; Guo, Y. A study on the multifunction of ferrous chloride in the formation of poly (vinylidene fluoride) ultrafiltration membranes. J. Membr. Sci. 2009, 341, 214–224. [Google Scholar] [CrossRef]
- Razmjou, A.; Arifin, E.; Dong, G.; Mansouri, J.; Chen, V. Superhydrophobic modification of TiO2 nanocomposite PVDF membranes for applications in membrane distillation. J. Membr. Sci. 2012, 415, 850–863. [Google Scholar] [CrossRef]
- Hamzah, N.; Leo, C.P. Membrane distillation of saline with phenolic compound using superhydrophobic PVDF membrane incorporated with TiO2 nanoparticles: Separation, fouling and self-cleaning evaluation. Desalination 2017, 418, 79–88. [Google Scholar] [CrossRef]
- Khayet, M.; Seman, M.A.; Hilal, N. Response surface modeling and optimization of composite nanofiltration modified membranes. J. Membr. Sci. 2010, 349, 113–122. [Google Scholar]
- Park, S.-J.; An, H.-K. Optimization of fabrication parameters for nanofibrous composite membrane using response surface methodology. Desalination Water Treat. 2016, 57, 20188–20198. [Google Scholar] [CrossRef]
- Efome, J.E.; Rana, D.; Matsuura, T.; Lan, C.Q. Enhanced performance of PVDF nanocomposite membrane by nanofiber coating: A membrane for sustainable desalination through MD. Water Res. 2016, 89, 39–49. [Google Scholar] [CrossRef]
- Wu, C.; Tang, W.; Zhang, J.; Liu, S.; Wang, Z.; Wang, X.; Lu, X. Preparation of super-hydrophobic PVDF membrane for MD purpose via hydroxyl induced crystallization-phase inversion. J. Membr. Sci. 2017, 543, 288–300. [Google Scholar] [CrossRef]
- Xu, Z.; Liu, Z.; Song, P.; Xiao, C. Fabrication of super-hydrophobic polypropylene hollow fiber membrane and its application in membrane distillation. Desalination 2017, 414, 10–17. [Google Scholar] [CrossRef]
- Hamzah, N.; Leo, C.P. Fouling prevention in the membrane distillation of phenolic-rich solution using superhydrophobic PVDF membrane incorporated with TiO2 nanoparticles. Sep. Purif. Technol. 2016, 167, 79–87. [Google Scholar] [CrossRef]
- Zuo, J.; Bonyadi, S.; Chung, T.-S. Exploring the potential of commercial polyethylene membranes for desalination by membrane distillation. J. Membr. Sci. 2016, 497, 239–247. [Google Scholar] [CrossRef]
- Pu, W.; He, X.; Wang, L.; Jiang, C.; Wan, C. Preparation of PVDF–HFP microporous membrane for Li-ion batteries by phase inversion. J. Membr. Sci. 2006, 272, 11–14. [Google Scholar] [CrossRef]
- Freger, V.; Gilron, J.; Belfer, S. TFC polyamide membranes modified by grafting of hydrophilic polymers: An FT-IR/AFM/TEM study. J. Membr. Sci. 2002, 209, 283–292. [Google Scholar] [CrossRef]
- Rezaei, M.; Ismail, A.; Bakeri, G.; Hashemifard, S.; Matsuura, T. Effect of general montmorillonite and Cloisite 15A on structural parameters and performance of mixed matrix membranes contactor for CO2 absorption. Chem. Eng. J. 2015, 260, 875–885. [Google Scholar] [CrossRef]
- Zhang, J.; Song, Z.; Li, B.; Wang, Q.; Wang, S. Fabrication and characterization of superhydrophobic poly (vinylidene fluoride) membrane for direct contact membrane distillation. Desalination 2013, 324, 1–9. [Google Scholar] [CrossRef]
- Cruz, N.K.O.; Semblante, G.U.; Senoro, D.B.; You, S.-J.; Lu, S.-C. Dye degradation and antifouling properties of polyvinylidene fluoride/titanium oxide membrane prepared by sol–gel method. J. Taiwan Inst. Chem. Eng. 2014, 45, 192–201. [Google Scholar] [CrossRef]
- Hou, D.; Fan, H.; Jiang, Q.; Wang, J.; Zhang, X. Preparation and characterization of PVDF flat-sheet membranes for direct contact membrane distillation. Sep. Purif. Technol. 2014, 135, 211–222. [Google Scholar] [CrossRef]
- Fadhil, S.; Marino, T.; Makki, H.F.; Alsalhy, Q.F.; Blefari, S.; Macedonio, F.; Nicolò, E.D.; Giorno, L.; Drioli, E.; Figoli, A. Novel PVDF-HFP flat sheet membranes prepared by triethyl phosphate (TEP) solvent for direct contact membrane distillation. Chem. Eng. Process. Process Intensif. 2016, 102, 16–26. [Google Scholar] [CrossRef]
- Yang, C.; Li, X.-M.; Gilron, J.; Kong, D.-f.; Yin, Y.; Oren, Y.; Linder, C.; He, T. CF4 plasma-modified superhydrophobic PVDF membranes for direct contact membrane distillation. J. Membr. Sci. 2014, 456, 155–161. [Google Scholar] [CrossRef]
- García-Payo, M.C.; Izquierdo-Gil, M.A.; Fernández-Pineda, C. Wetting Study of Hydrophobic Membranes via Liquid Entry Pressure Measurements with Aqueous Alcohol Solutions. J. Colloid Interface Sci. 2000, 230, 420–431. [Google Scholar] [CrossRef] [PubMed]
- Lin, C.-H.; Wong, D.S.-H.; Lu, S.-Y. Layered Protonated Titanate Nanosheets Synthesized with a Simple One-Step, Low-Temperature, Urea-Modulated Method as an Effective Pollutant Adsorbent. ACS Appl. Mater. Interfaces 2014, 6, 16669–16678. [Google Scholar] [CrossRef]
- Liu, W.; Sun, W.; Han, Y.; Ahmad, M.; Ni, J. Adsorption of Cu(II) and Cd(II) on titanate nanomaterials synthesized via hydrothermal method under different NaOH concentrations: Role of sodium content. Colloids Surf. A Physicochem. Eng. Asp. 2014, 452, 138–147. [Google Scholar] [CrossRef]
- Ye, M.; Lu, Z.; Hu, Y.; Zhang, Q.; Yin, Y. Mesoporous titanate-based cation exchanger for efficient removal of metal cations. J. Mater. Chem. 2013, 1, 5097–5104. [Google Scholar] [CrossRef]
- Wei, Y.; Chu, H.-Q.; Dong, B.-Z.; Li, X.; Xia, S.-J.; Qiang, Z.-M. Effect of TiO2 nanowire addition on PVDF ultrafiltration membrane performance. Desalination 2011, 272, 90–97. [Google Scholar] [CrossRef]
- Kim, H.; Noh, K.; Choi, C.; Khamwannah, J.; Villwock, D.; Jin, S. Extreme Superomniphobicity of Multiwalled 8 nm TiO2 Nanotubes. Langmuir 2011, 27, 10191–10196. [Google Scholar] [CrossRef]
- Bakeri, G.; Matsuura, T.; Ismail, A.F.; Rana, D. A novel surface modified polyetherimide hollow fiber membrane for gas–liquid contacting processes. Sep. Purif. Technol. 2012, 89, 160–170. [Google Scholar] [CrossRef]
- Nemeth, M.A. Response Surface Methodology: Process and Product Optimization Using Designed Experiments. J. Qual. Technol. 2003, 35, 428–429. [Google Scholar] [CrossRef]


| Membrane | Properties | Processing Parameters | Preparation | Ref |
|---|---|---|---|---|
| PVDF membrane with superhydrophobic TiO2 | θ:160 ε:38–46; d:0.34–0.44 | Feed: 100 g/LGA + 50 g/L NaCl; Tf: 40 °C, Tp: 20°C, Q: 300 mL/min | Phase Inversion | [17] |
| PVDF membrane with superhydrophobic SiO2 | θ:139 ± 5 d:0.45 | Feed: 3.5 wt%NaCl Tf: 27.5°C, Tp:15°C, Q: 2000 mL/min | Electrospinning | [20] |
| PVDF membrane with SiO2 | θ:153 ε:79.24; d:0.1 | Feed: 3.5 wt%NaCl Tf: 70 °C, Tp: 15 °C; Q: 3000 mL/min | Phase Inversion | [21] |
| PP membrane with SiO2 | θ:157 ε:47.63 | Feed: 3.5 wt%NaCl; Tf: 80 °C | Phase Inversion | [22] |
| PVDFmembranewith superhydrophobic TiO2 | θ:151.9 ± 1.5 ε:30.3 ± 3.9; d:0.37 | Feed: 100 g/LGA + 50 g/L NaCl; Tf: 40 °C, Tp: 20; Q: 300 mL/min | Phase Inversion | [23] |
| PVDF membrane with superhydrophobic TiO2 | θ:140 ± 2° ε:73% | Feed: 35 mg/L NH4Cl; Tf: 60 °C, Tp: 25 °C; Q: 500 mL/min | Phase Inversion | This study |
| Commercial PE membrane | θ: 108.3 ± 3 ε: 66.1 ± 7.2; d: 0.2 | Feed: 3.5 wt% NaCl; Tf: 80 °C, Tp:17 °C;Q: 400 mL/min | Phase Inversion by TIPS | [24] |
| Commercial PVDF membrane | θ:111 d:0.22 | Feed: AFMBR permeate (35 mg/L TN + 27 mg/L COD) Tf: 60 °C, Tp: 25 °C; Q: 500 mL/min | [13] |
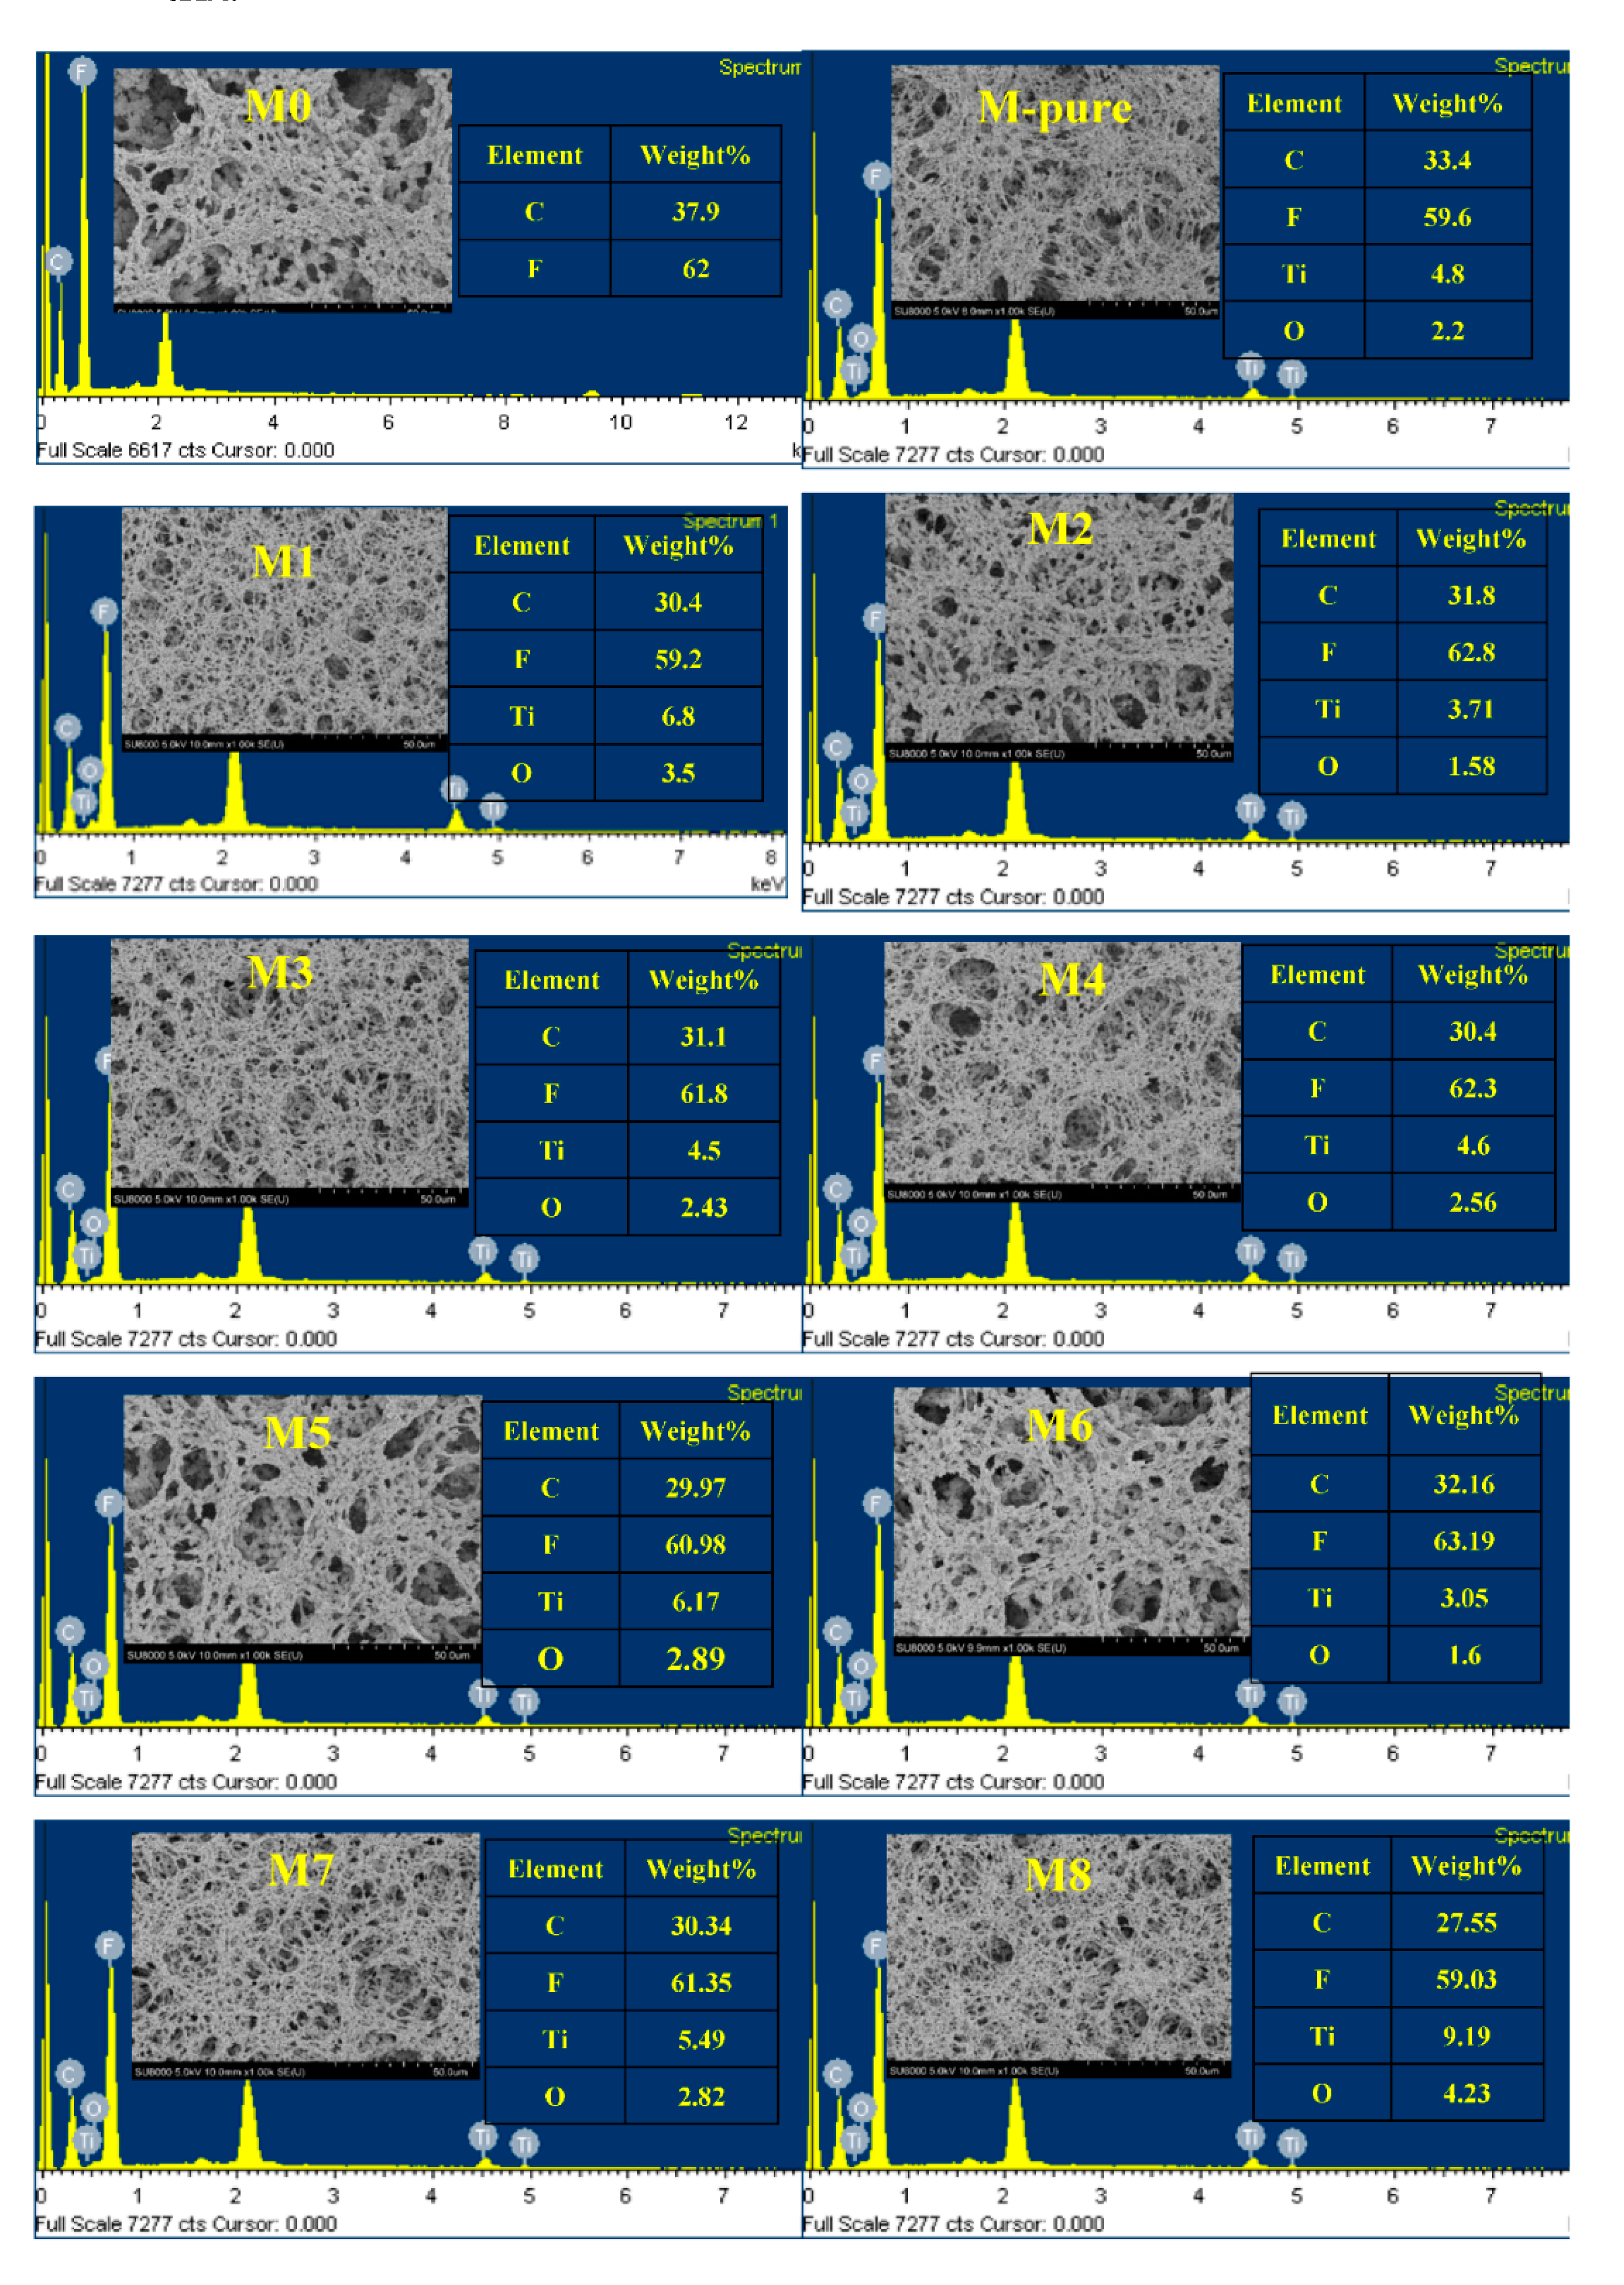
| Membranes | Silane (w/w%) | TiO2 (wt%) | PVDF (wt%) | Porosity (%) | Contact Angle (°) | Thickness (µm) |
|---|---|---|---|---|---|---|
| M-pure | 0 | 2 | 15 | 79.7 | 84.2 | 159.0 |
| M0 | 0 | 0 | 15 | 83.2 | 97.9 | 153.0 |
| M1 | 34.2 | 2.5 | 15 | 73.0 | 140.0 | 155.0 |
| M2 | 25.65 | 1.5 | 14 | 62.1 | 144.6 | 159.3 |
| M3 | 25.65 | 2 | 15 | 77.2 | 118.2 | 173.5 |
| M4 | 25.65 | 1.5 | 16 | 66.8 | 143.8 | 164.0 |
| M5 | 17.1 | 2 | 14 | 67.8 | 111.4 | 156.5 |
| M6 | 25.65 | 2.5 | 14 | 66.3 | 145.4 | 146.3 |
| M7 | 17.1 | 1.5 | 15 | 76.6 | 108.4 | 155.0 |
| M8 | 17.1 | 2.5 | 15 | 75.9 | 138.5 | 149.3 |
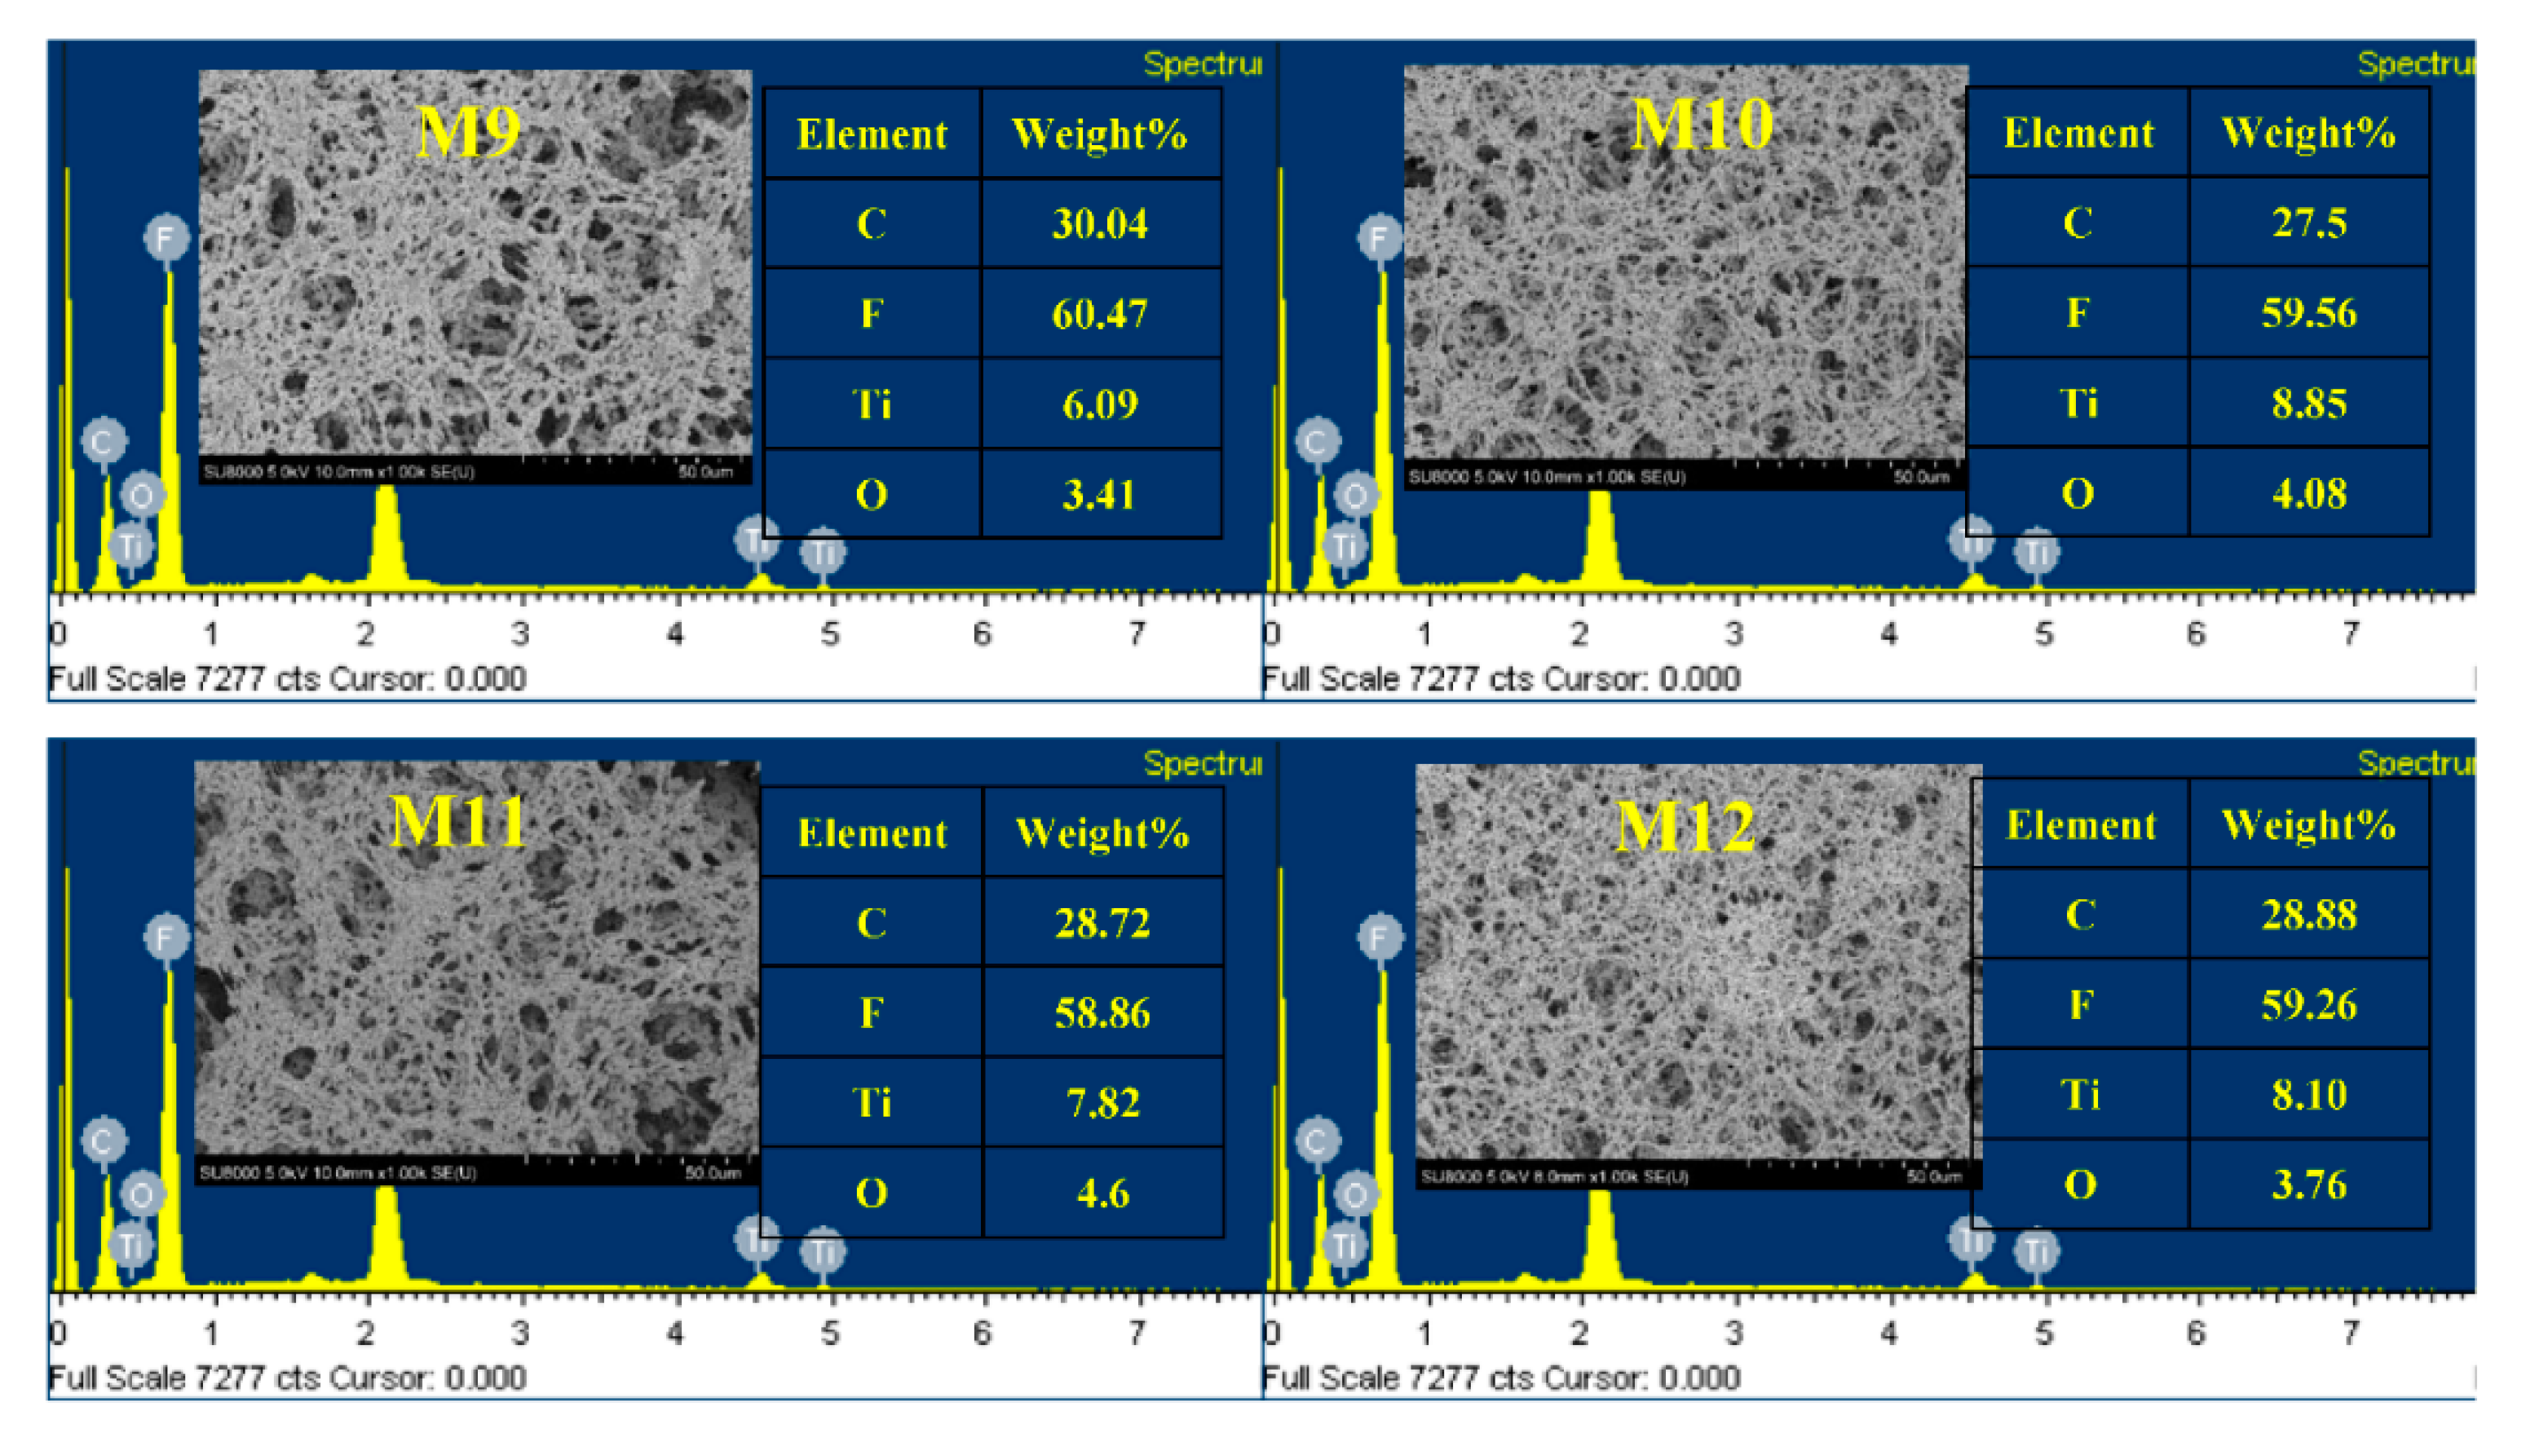
| M9 | 17.1 | 2 | 16 | 52.1 | 102.8 | 170.3 |
| M10 | 34.2 | 2 | 14 | 64.4 | 130.7 | 154.6 |
| M11 | 34.2 | 1.5 | 15 | 81.7 | 130.5 | 159.3 |
| M12 | 34.2 | 2 | 16 | 63.8 | 137.0 | 171.0 |
| Variables | Symbol | Coded Factor Level | ||
|---|---|---|---|---|
| −1 | 0 | 1 | ||
| Silane (wt%) | A | 17.1 | 25.65 | 34.2 |
| TiO2 (wt%) | B | 1.5 | 2.0 | 2.5 |
| Polymer (wt%) | C | 14 | 15 | 16 |
| Source | Permeate Flux | Ammonium Rejection | ||||||||
|---|---|---|---|---|---|---|---|---|---|---|
| Sum of Squares | df | Mean Square | F Value | p-Value Prob > F | Sum of Squares | df | Mean Square | F Value | p-Value Prob > F | |
| Model | 135.65 | 9 | 15.07 | 5.972 | 0.0140 | 123.89 | 9 | 13.77 | 10.94 | 0.0023 |
| A-Silane | 0.33 | 1 | 0.33 | 0.130 | 0.7291 | 0.88 | 1 | 0.88 | 0.70 | 0.4312 |
| B-TiO2 | 0.05 | 1 | 0.05 | 0.020 | 0.8908 | 0.01 | 1 | 0.01 | 0.01 | 0.9177 |
| C-Polymer | 68.21 | 1 | 68.21 | 27.027 | 0.0013 | 3.42 | 1 | 3.42 | 2.72 | 0.1433 |
| AB | 0.42 | 1 | 0.42 | 0.167 | 0.6947 | 4.80 | 1 | 4.80 | 3.81 | 0.0918 |
| AC | 0.24 | 1 | 0.24 | 0.095 | 0.7667 | 76.83 | 1 | 76.83 | 61.06 | 0.0001 |
| BC | 0.11 | 1 | 0.11 | 0.043 | 0.8414 | 2.37 | 1 | 2.37 | 1.88 | 0.2121 |
| A2 | 0.02 | 1 | 0.02 | 0.007 | 0.9335 | 12.01 | 1 | 12.01 | 9.54 | 0.0176 |
| B2 | 0.94 | 1 | 0.94 | 0.372 | 0.5614 | 25.04 | 1 | 25.04 | 19.90 | 0.0029 |
| C2 | 63.94 | 1 | 63.94 | 25.336 | 0.0015 | 0.18 | 1 | 0.18 | 0.14 | 0.7171 |
| Residual | 17.67 | 7 | 2.52 | 8.81 | 7 | 1.26 | ||||
| Lack-of-fit | 14.05 | 3 | 4.68 | 5.177 | 0.0731 | 2.54 | 3 | 0.85 | 0.54 | 0.6799 |
| Pure Error | 3.62 | 4 | 0.90 | 6.27 | 4 | 1.57 | ||||
| Cor Total | 153.31 | 16 | 132.69 | 16 | ||||||
Publisher’s Note: MDPI stays neutral with regard to jurisdictional claims in published maps and institutional affiliations. |
© 2021 by the authors. Licensee MDPI, Basel, Switzerland. This article is an open access article distributed under the terms and conditions of the Creative Commons Attribution (CC BY) license (http://creativecommons.org/licenses/by/4.0/).
Share and Cite
Tibi, F.; Park, S.-J.; Kim, J. Improvement of Membrane Distillation Using PVDF Membrane Incorporated with TiO2 Modified by Silane and Optimization of Fabricating Conditions. Membranes 2021, 11, 95. https://0-doi-org.brum.beds.ac.uk/10.3390/membranes11020095
Tibi F, Park S-J, Kim J. Improvement of Membrane Distillation Using PVDF Membrane Incorporated with TiO2 Modified by Silane and Optimization of Fabricating Conditions. Membranes. 2021; 11(2):95. https://0-doi-org.brum.beds.ac.uk/10.3390/membranes11020095
Chicago/Turabian StyleTibi, Fida, Seong-Jik Park, and Jeonghwan Kim. 2021. "Improvement of Membrane Distillation Using PVDF Membrane Incorporated with TiO2 Modified by Silane and Optimization of Fabricating Conditions" Membranes 11, no. 2: 95. https://0-doi-org.brum.beds.ac.uk/10.3390/membranes11020095