
Scale-Up and Long-Term Study of Electrodialysis with Ultrafiltration Membrane for the Separation of a Herring Milt Hydrolysate


Abstract
:1. Introduction
2. Materials and Methods
2.1. Materials
2.1.1. Chemicals
2.1.2. Herring Milt Hydrolysate
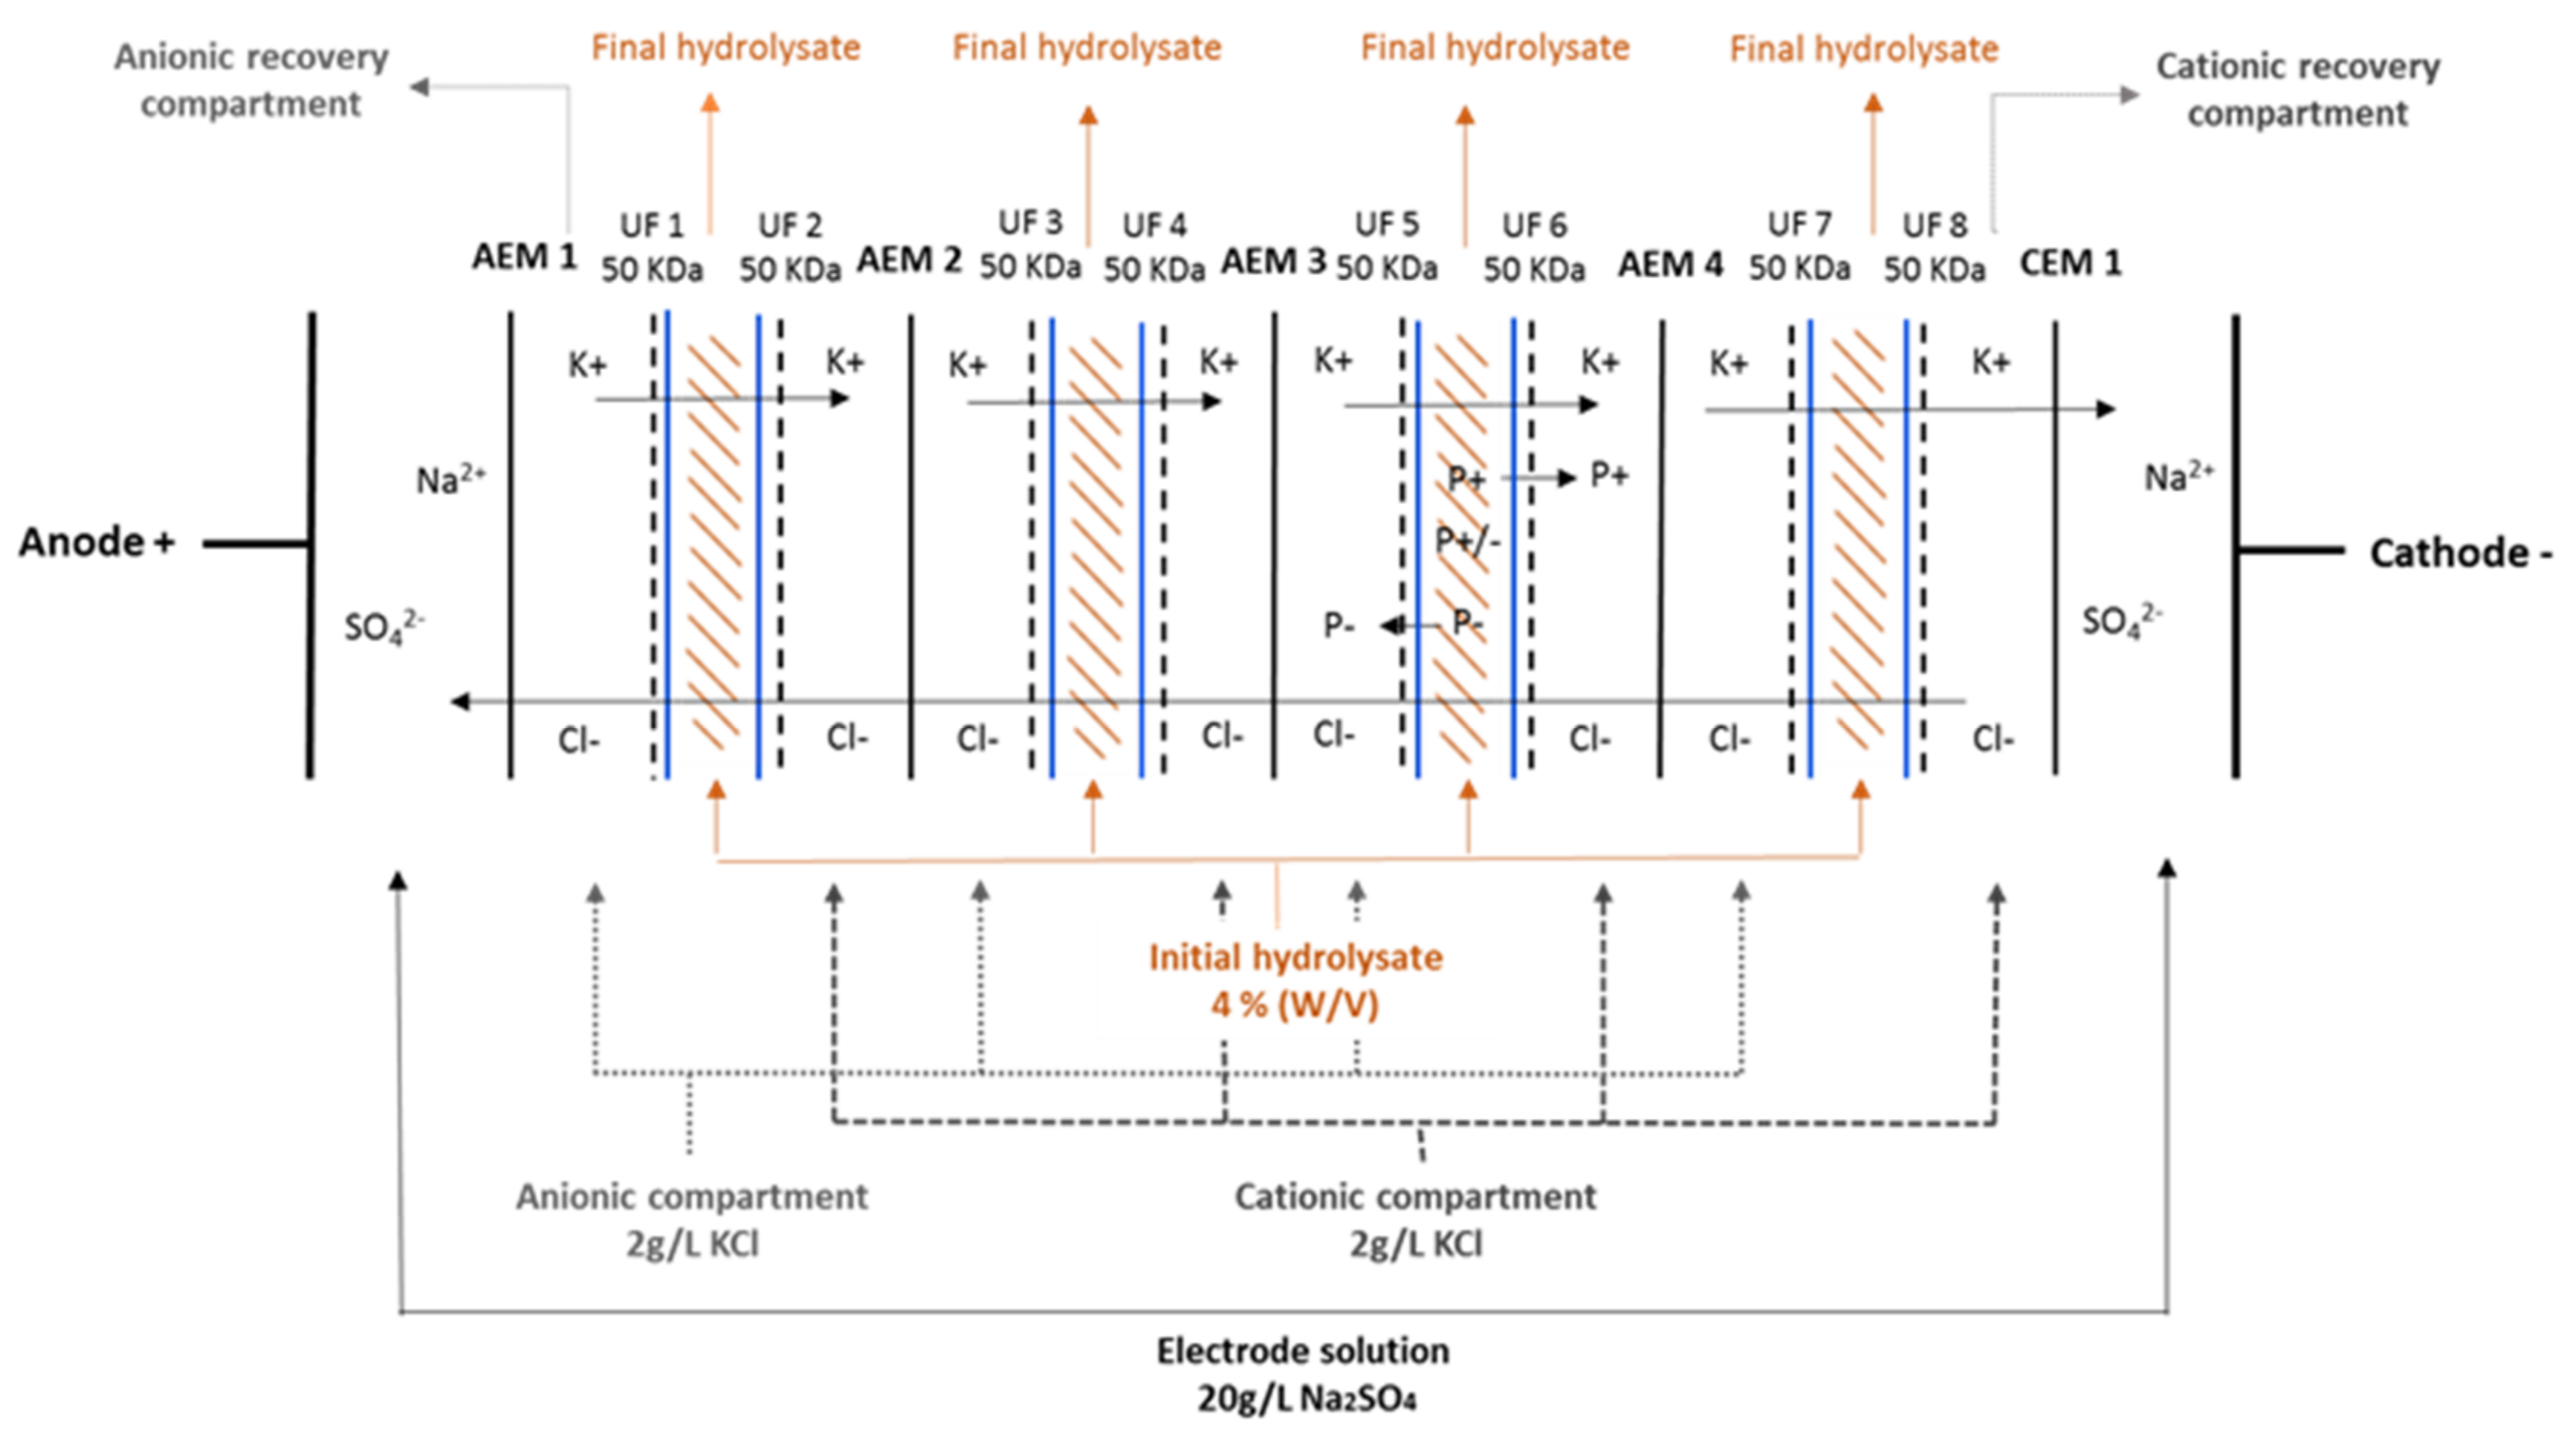
2.2. Electrodialysis System and Working Parameters
2.3. Methods
2.3.1. pH
2.3.2. Conductivity
2.3.3. Peptide Migration in Recovery Compartments and Final Migration Rate
2.3.4. Identification of Peptides in Recovery Compartments
2.3.5. Areal System Resistance and Relative Energy Consumption
2.3.6. Membrane Thickness
2.3.7. Membrane Electrical Conductivity
2.3.8. Statistical Analyses
3. Results and Discussion
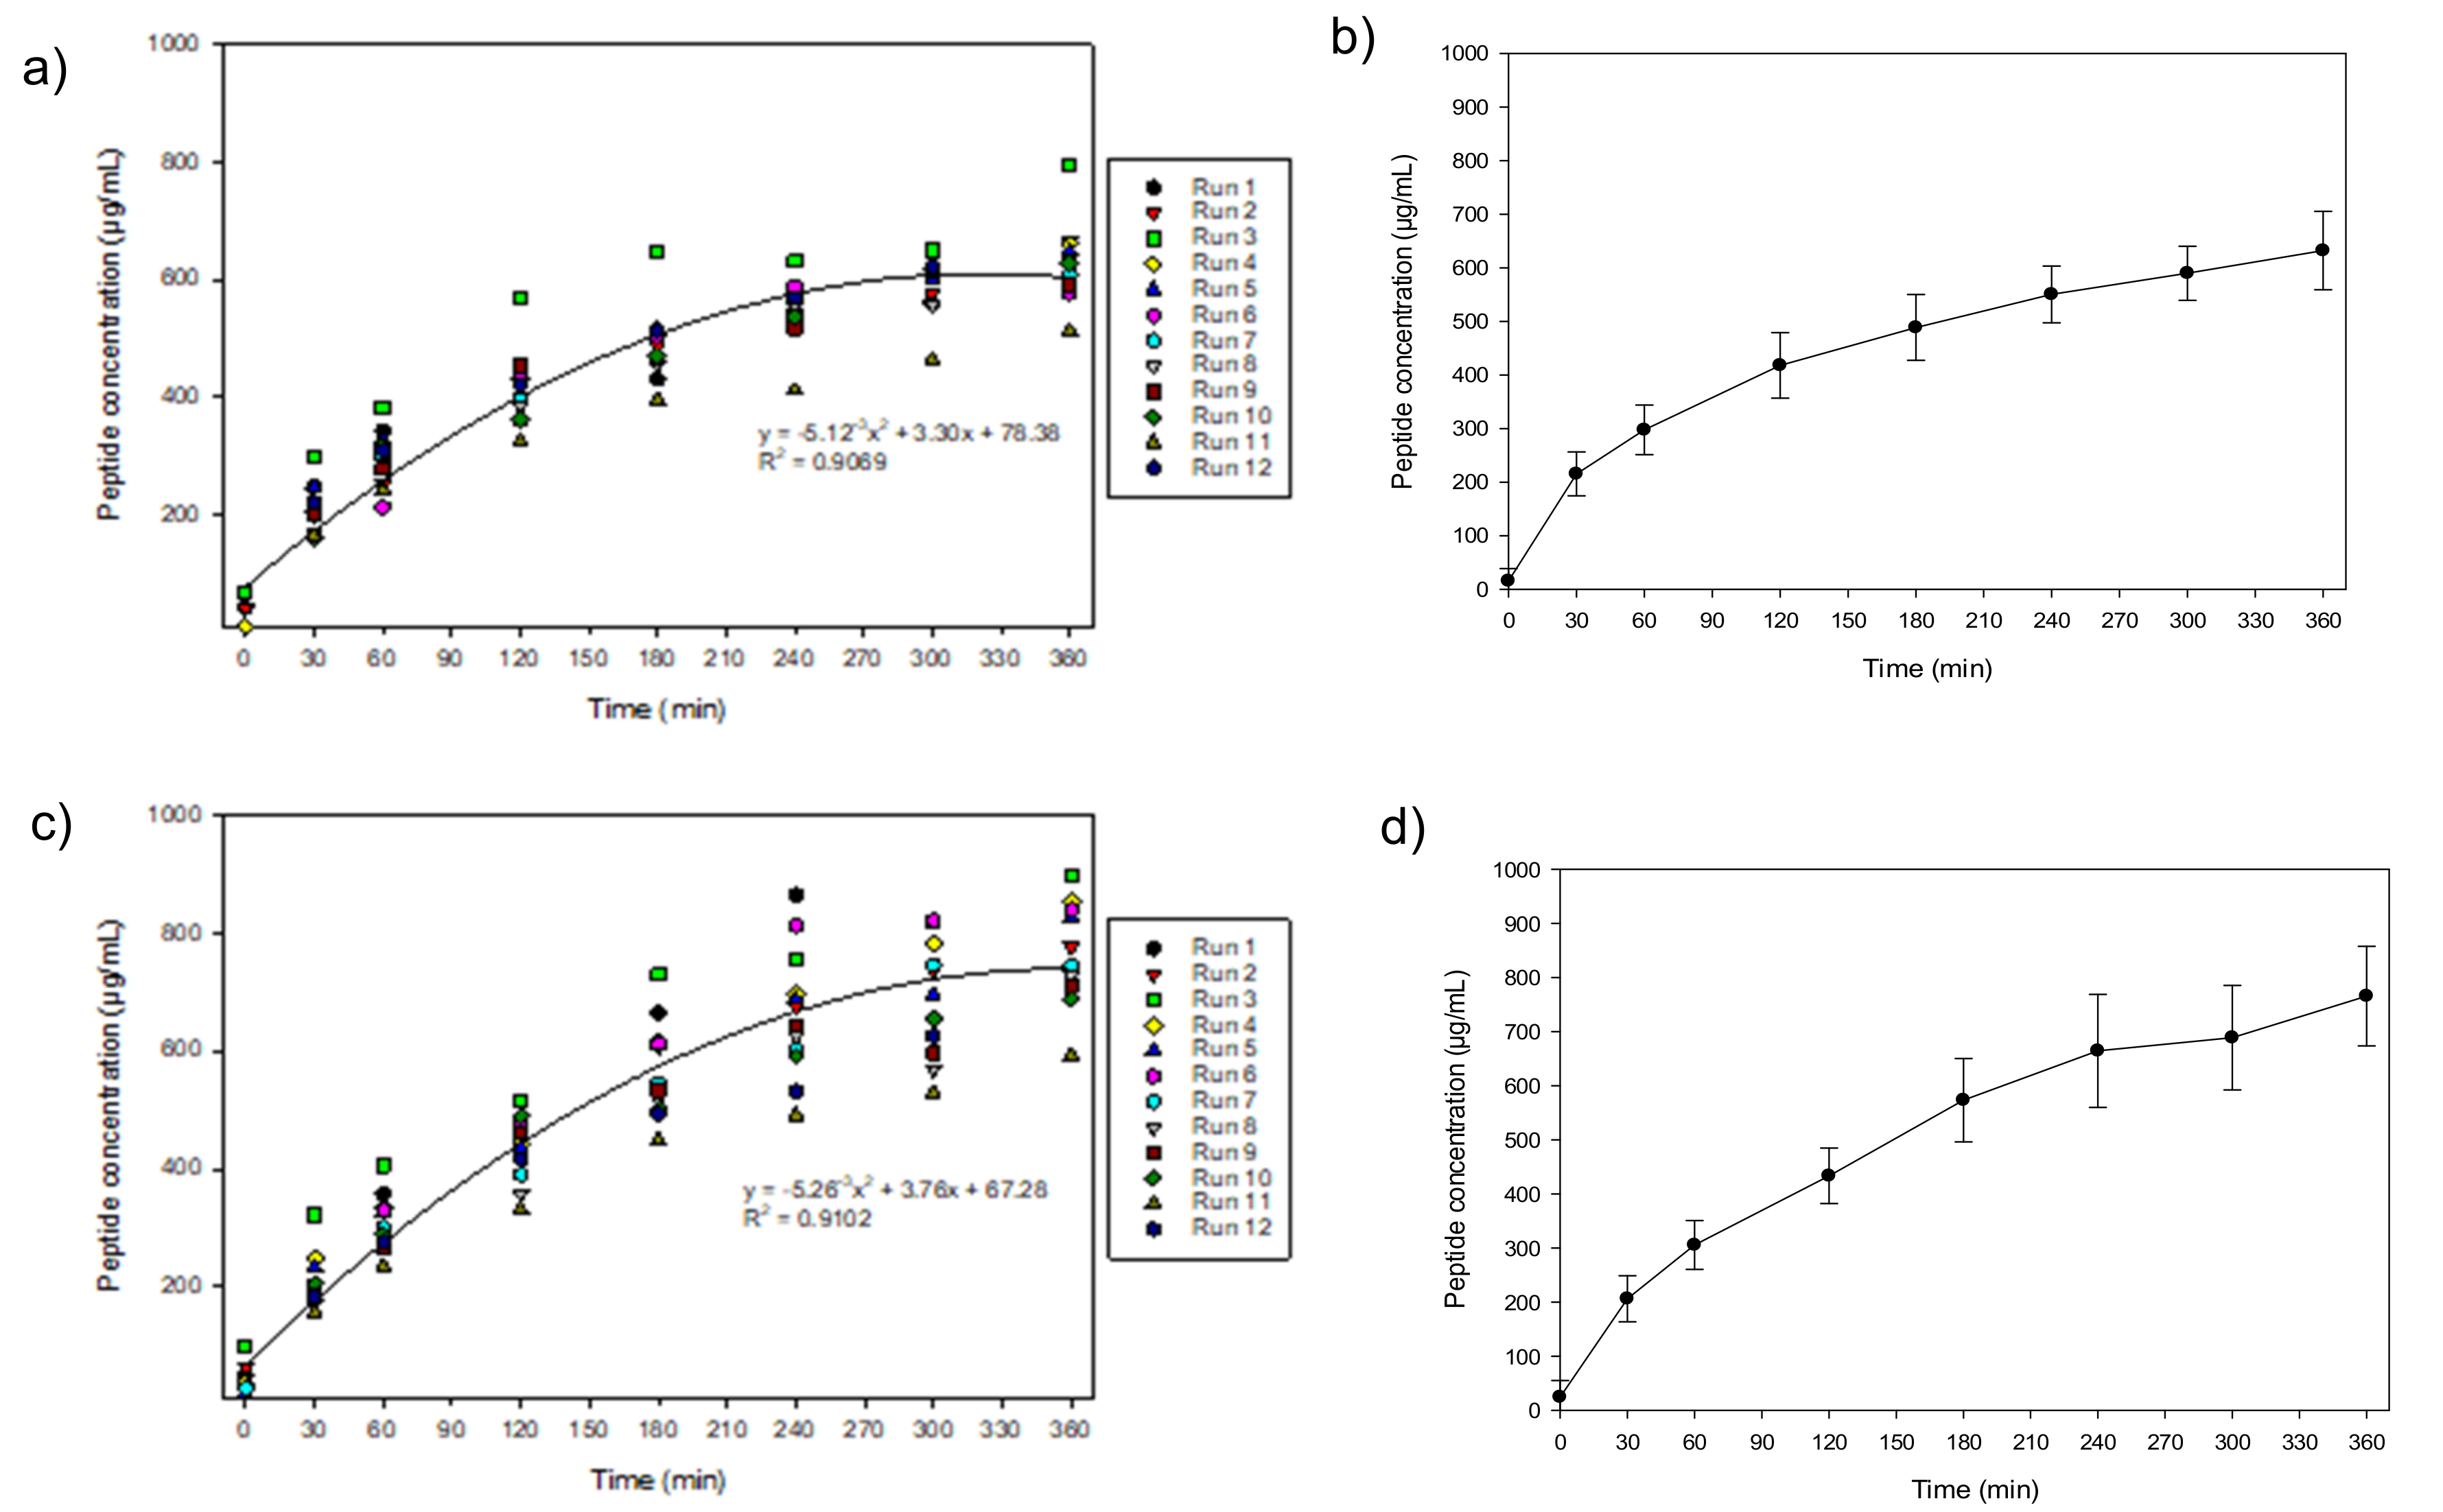
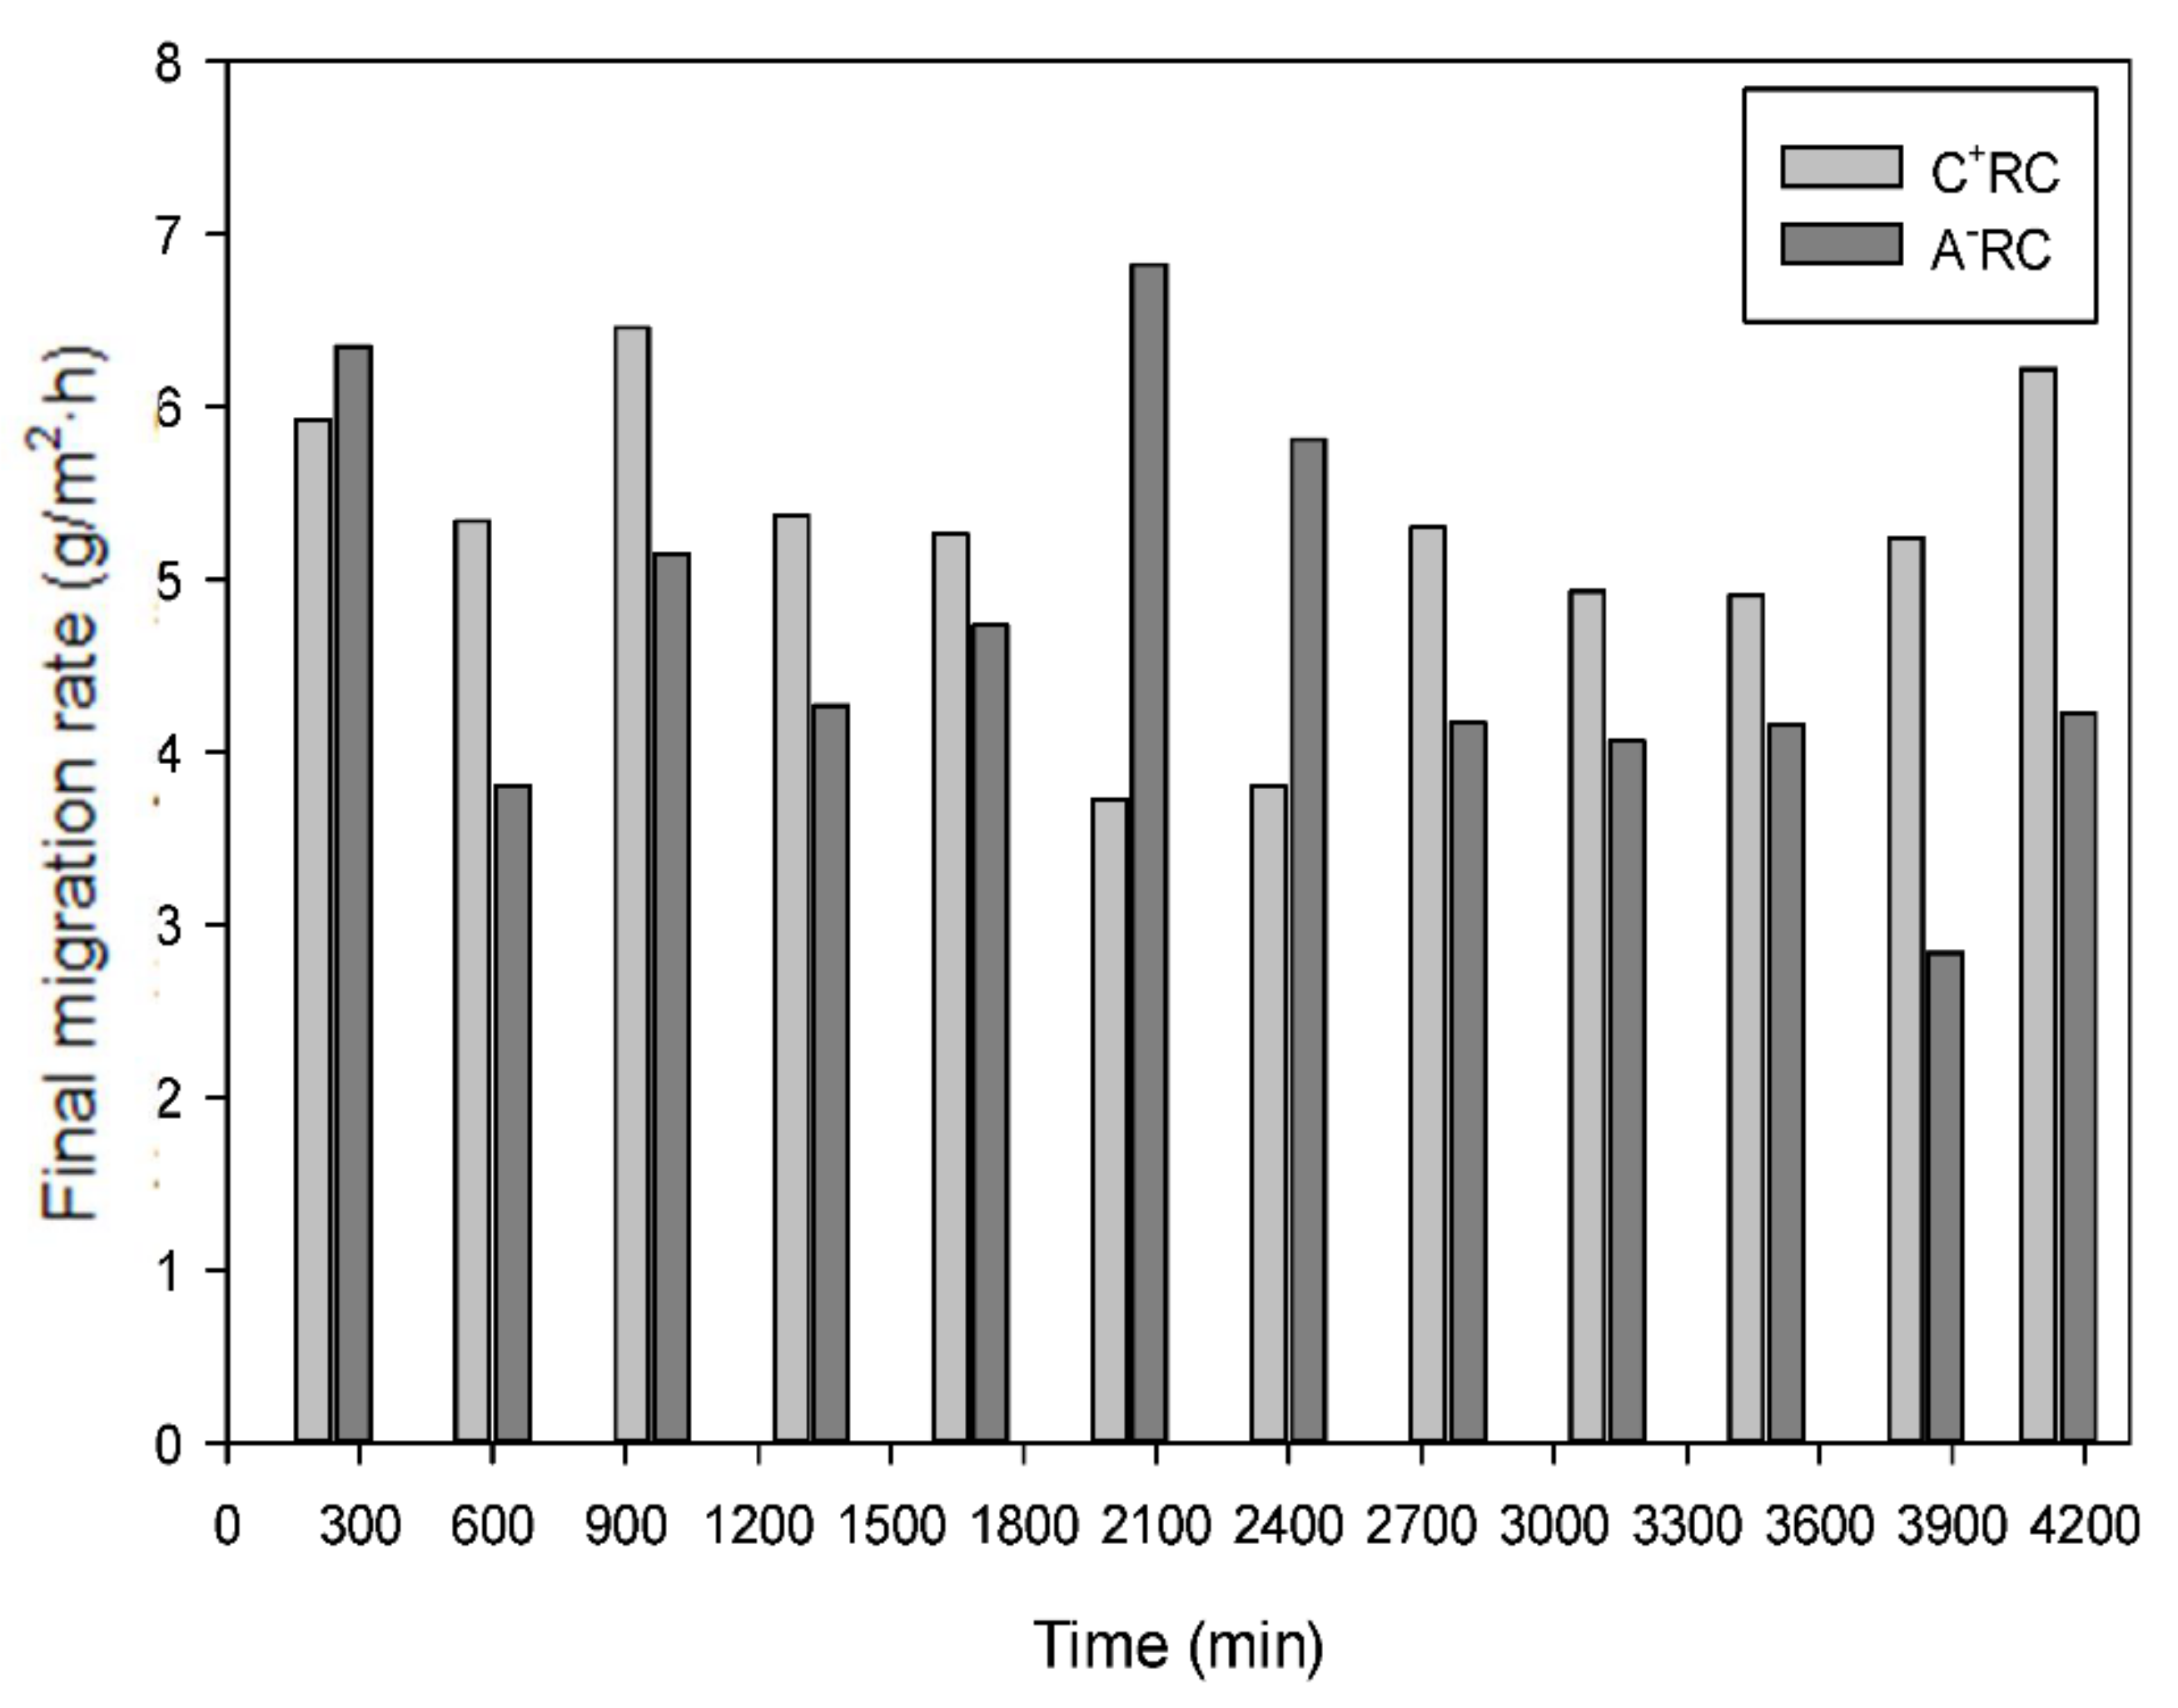
3.1. Peptide Migration in Recovery Compartments and Final Migration Rate
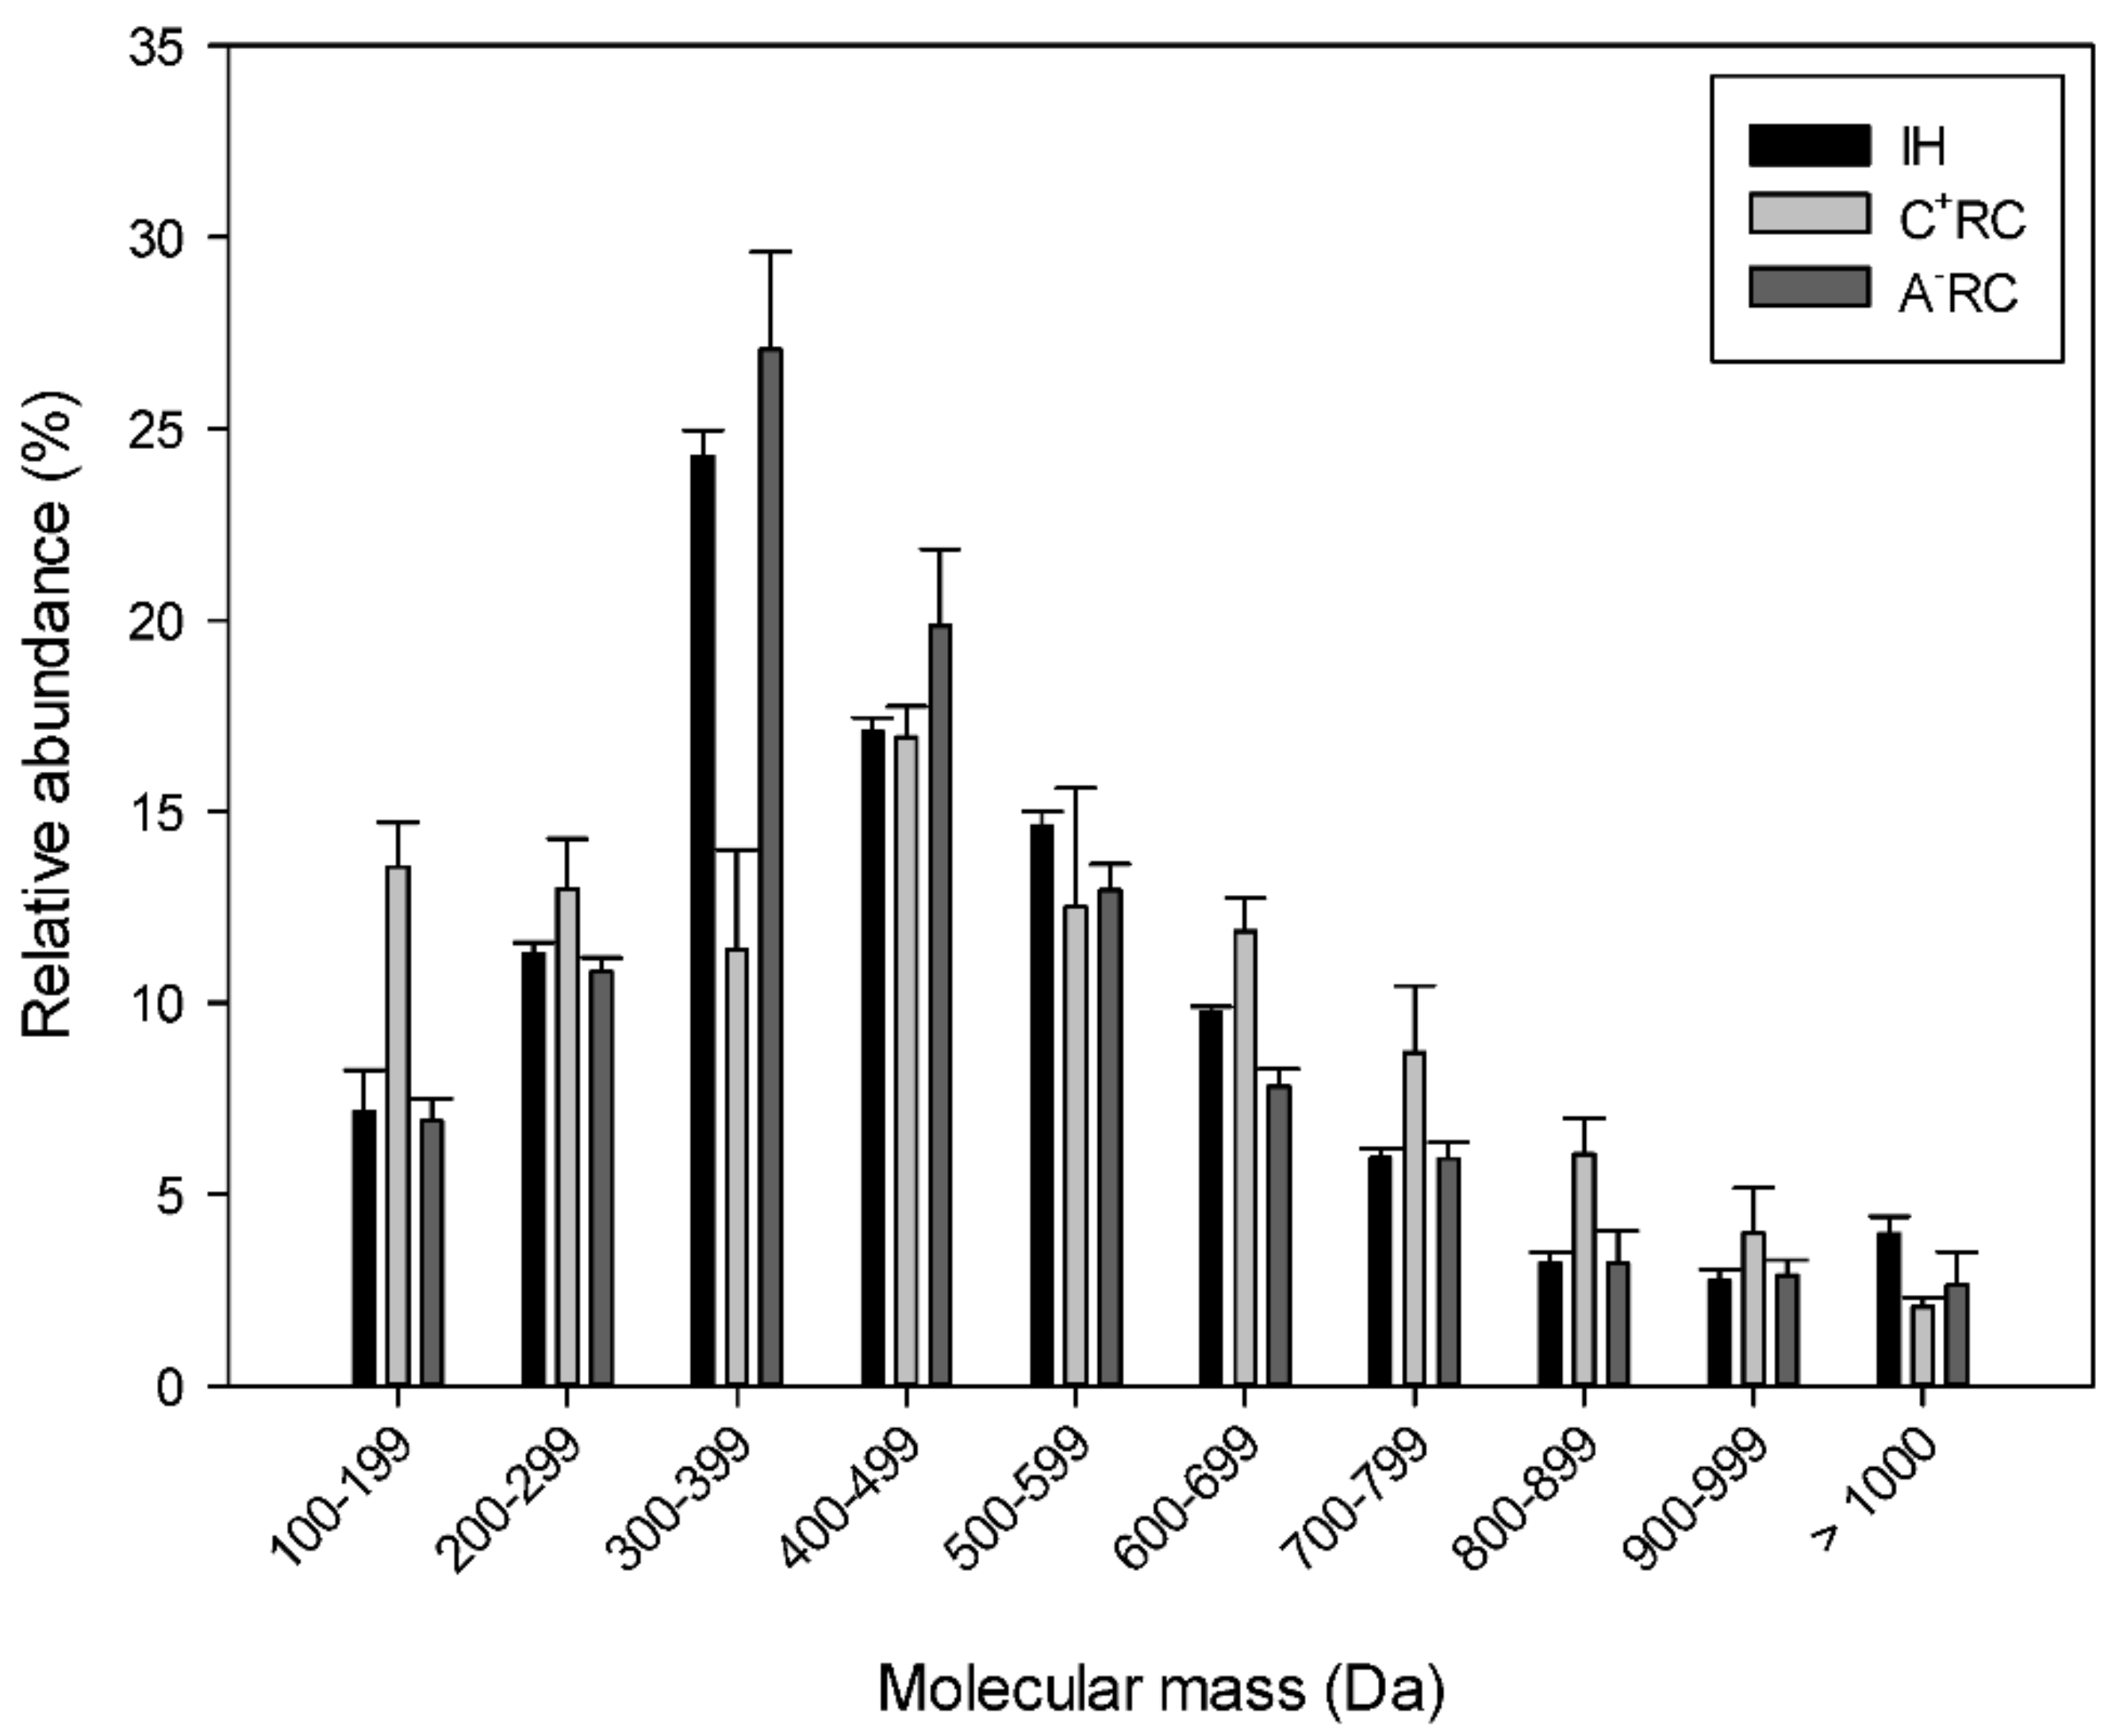
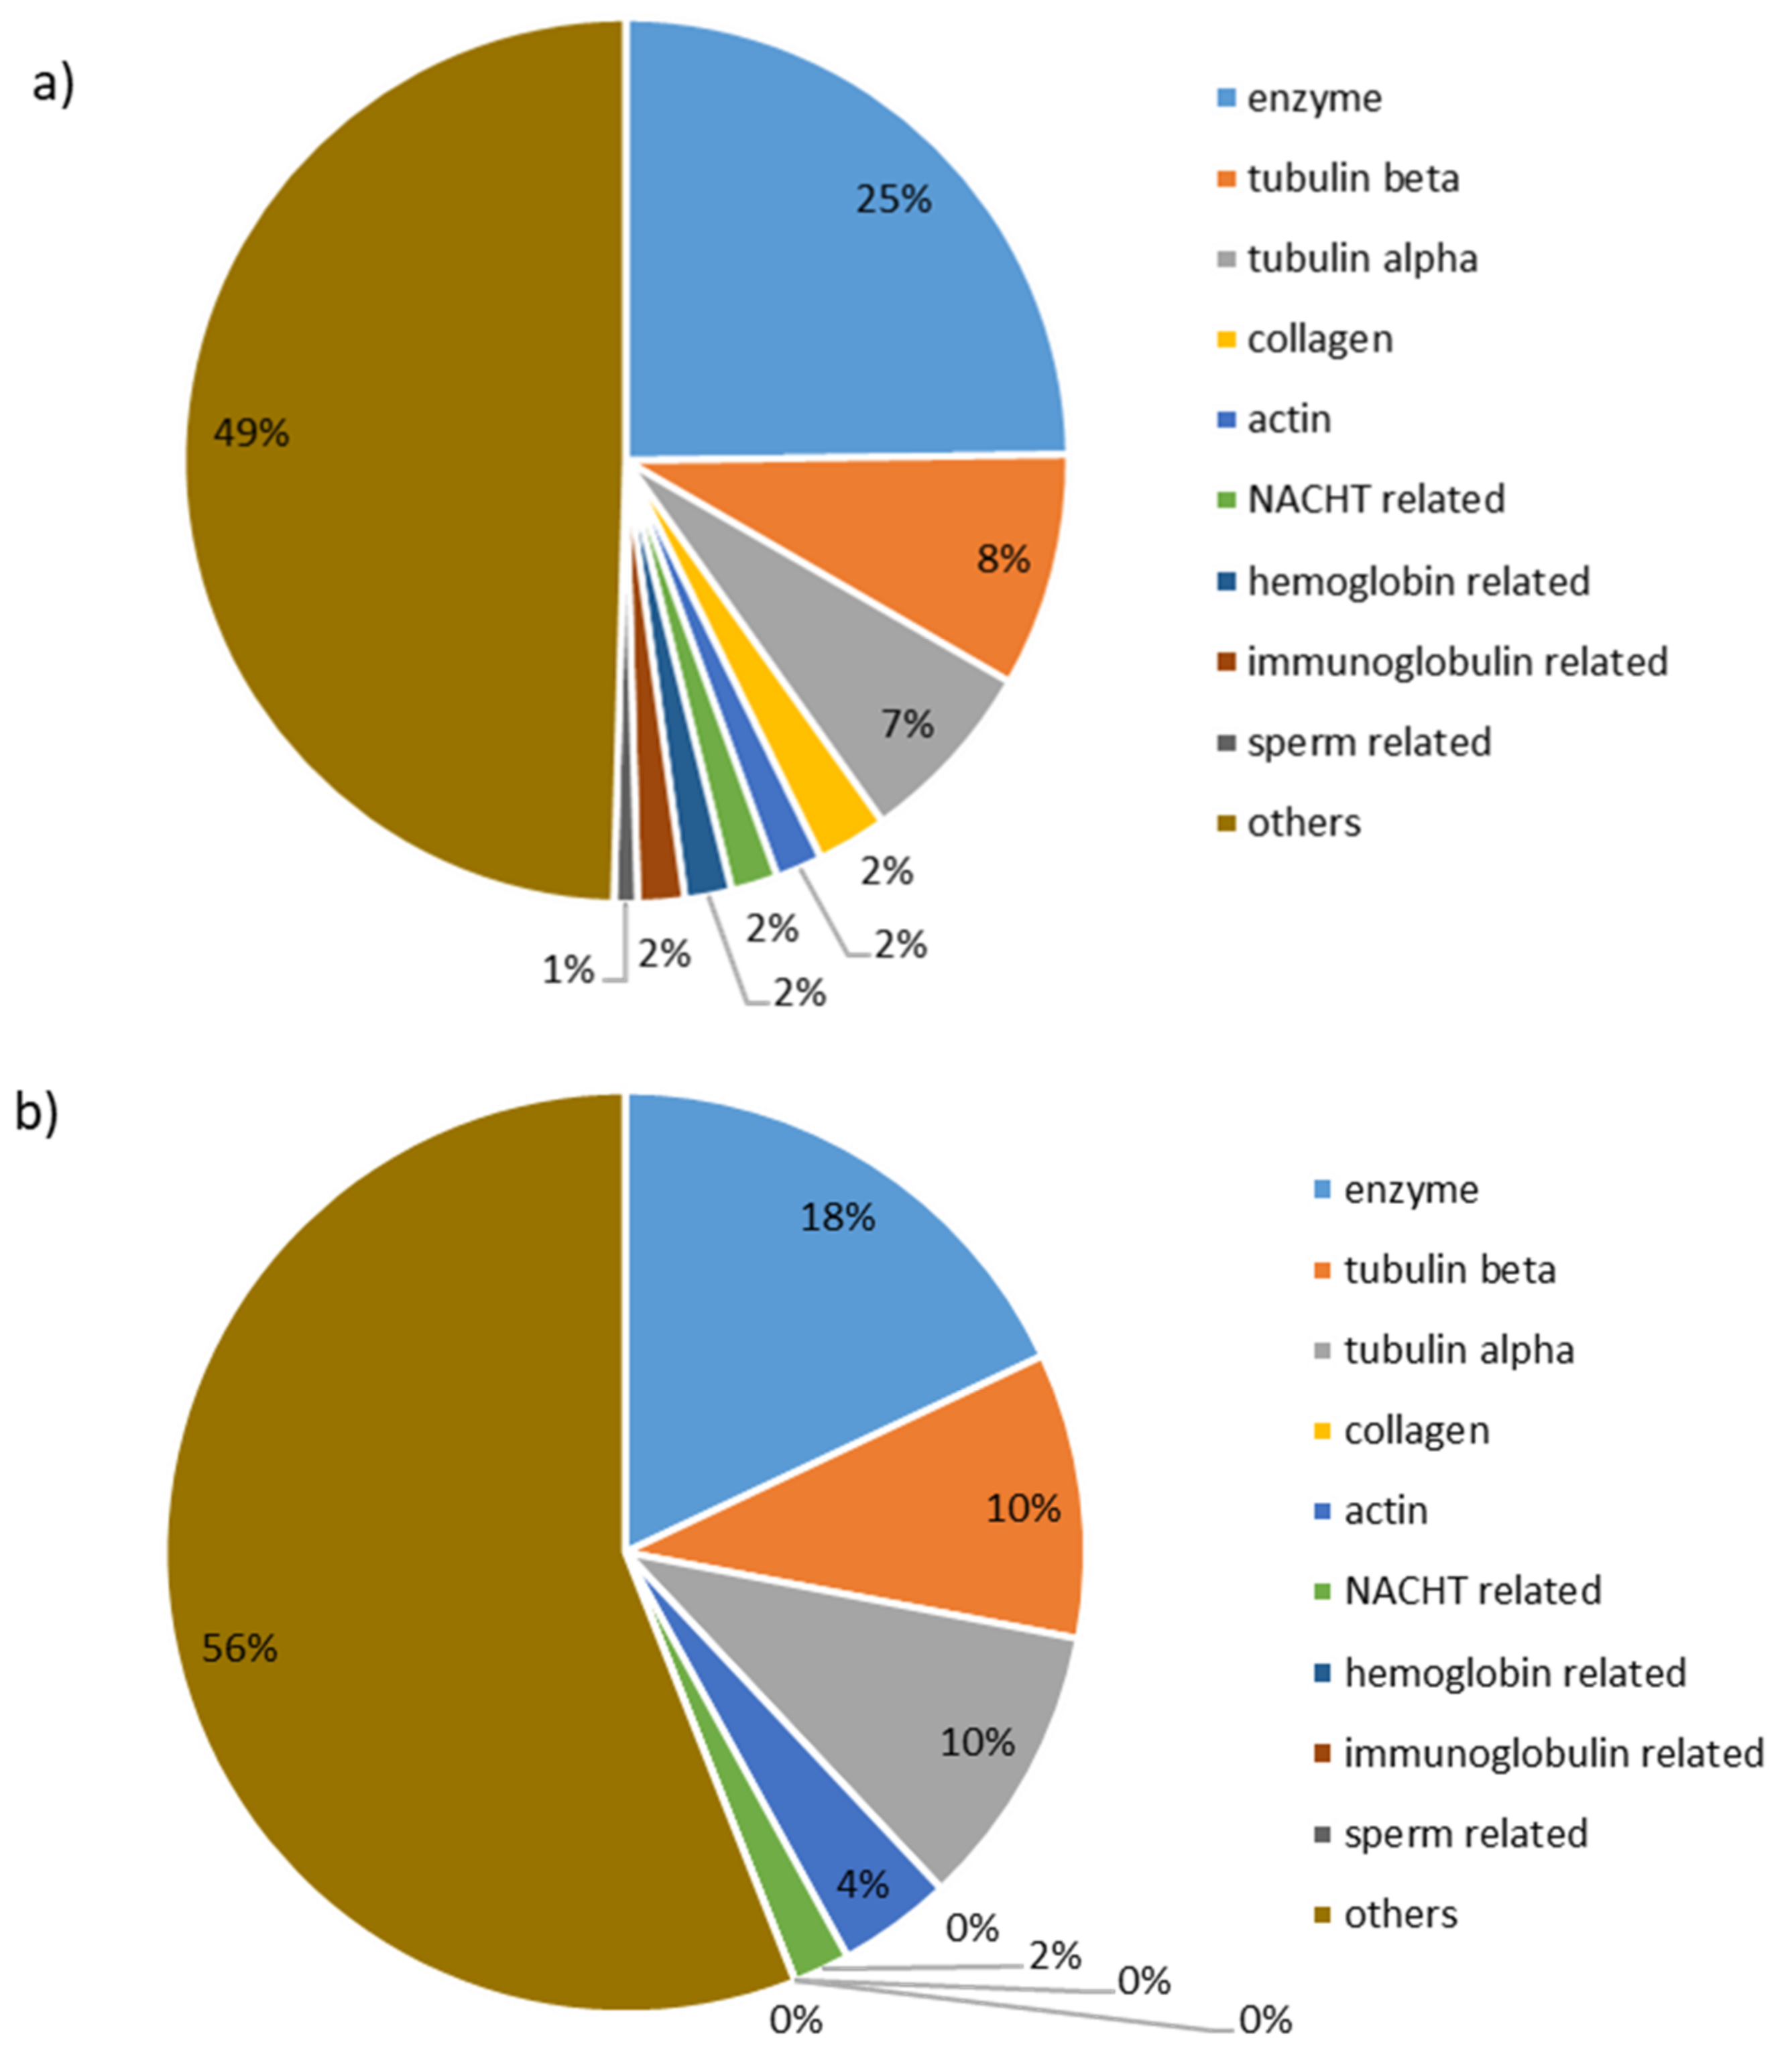
3.2. Molecular Mass Distribution and Identification of Peptides in Recovery Compartments
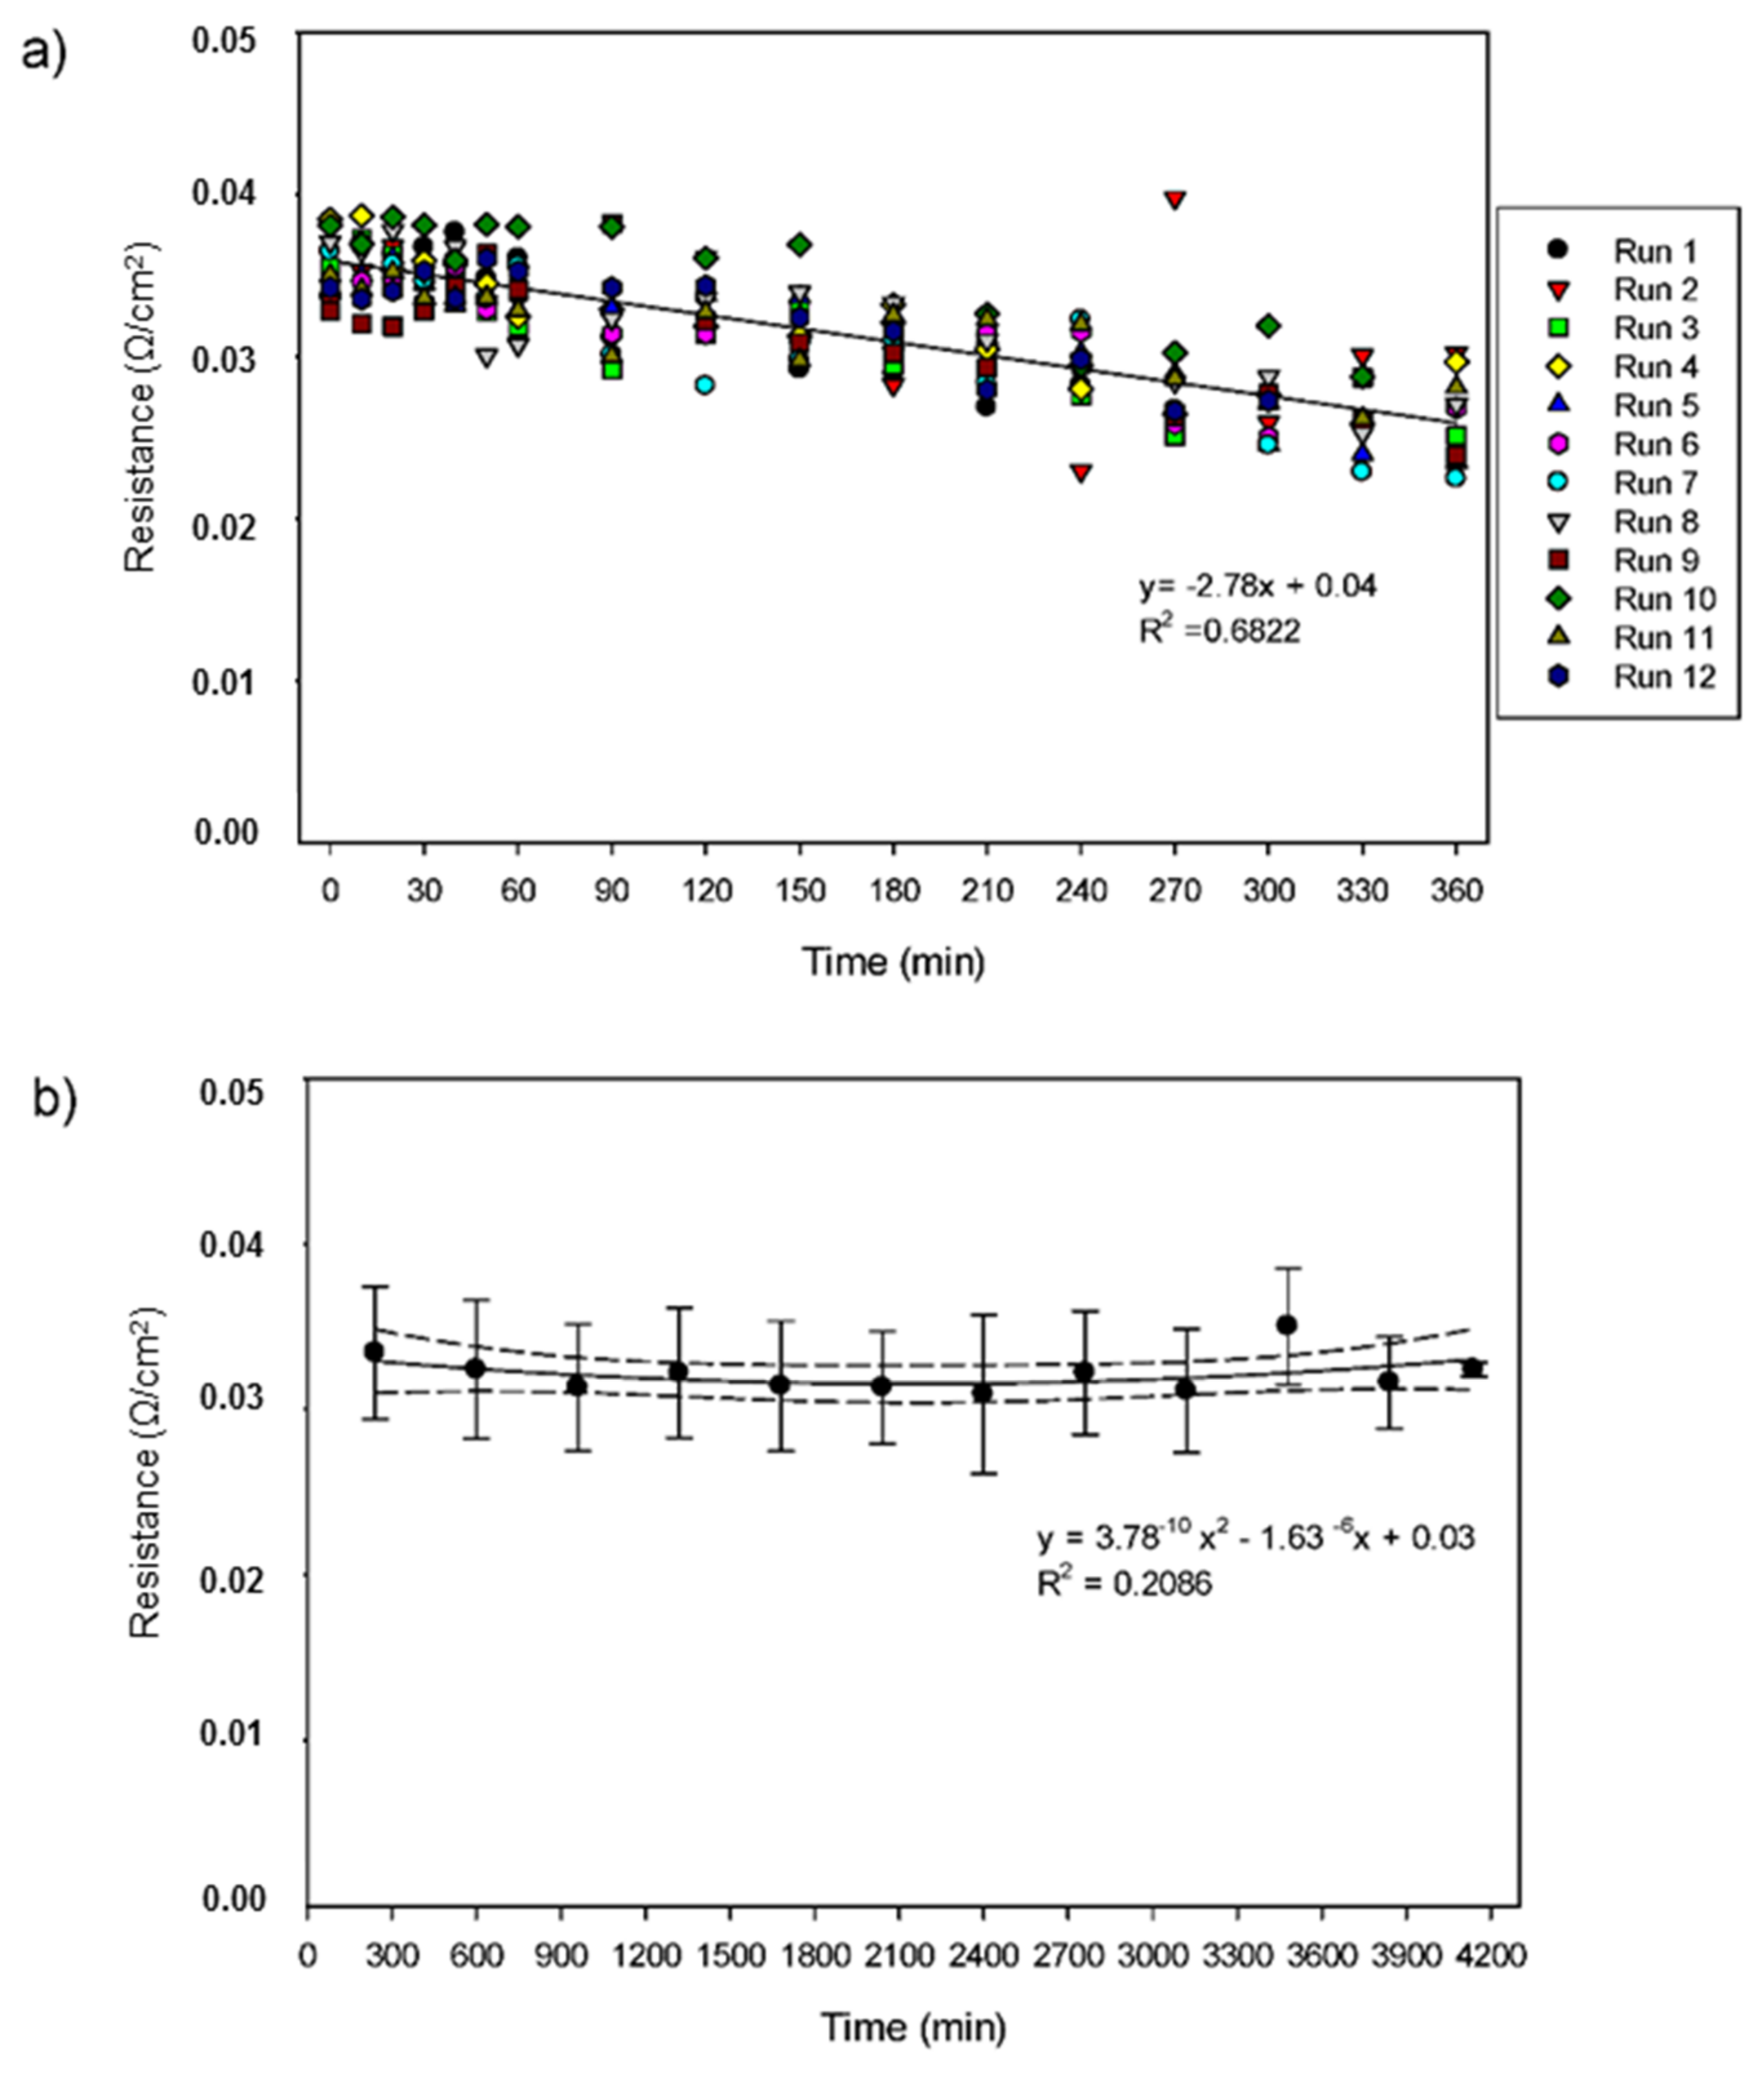
3.3. Areal System Resistance
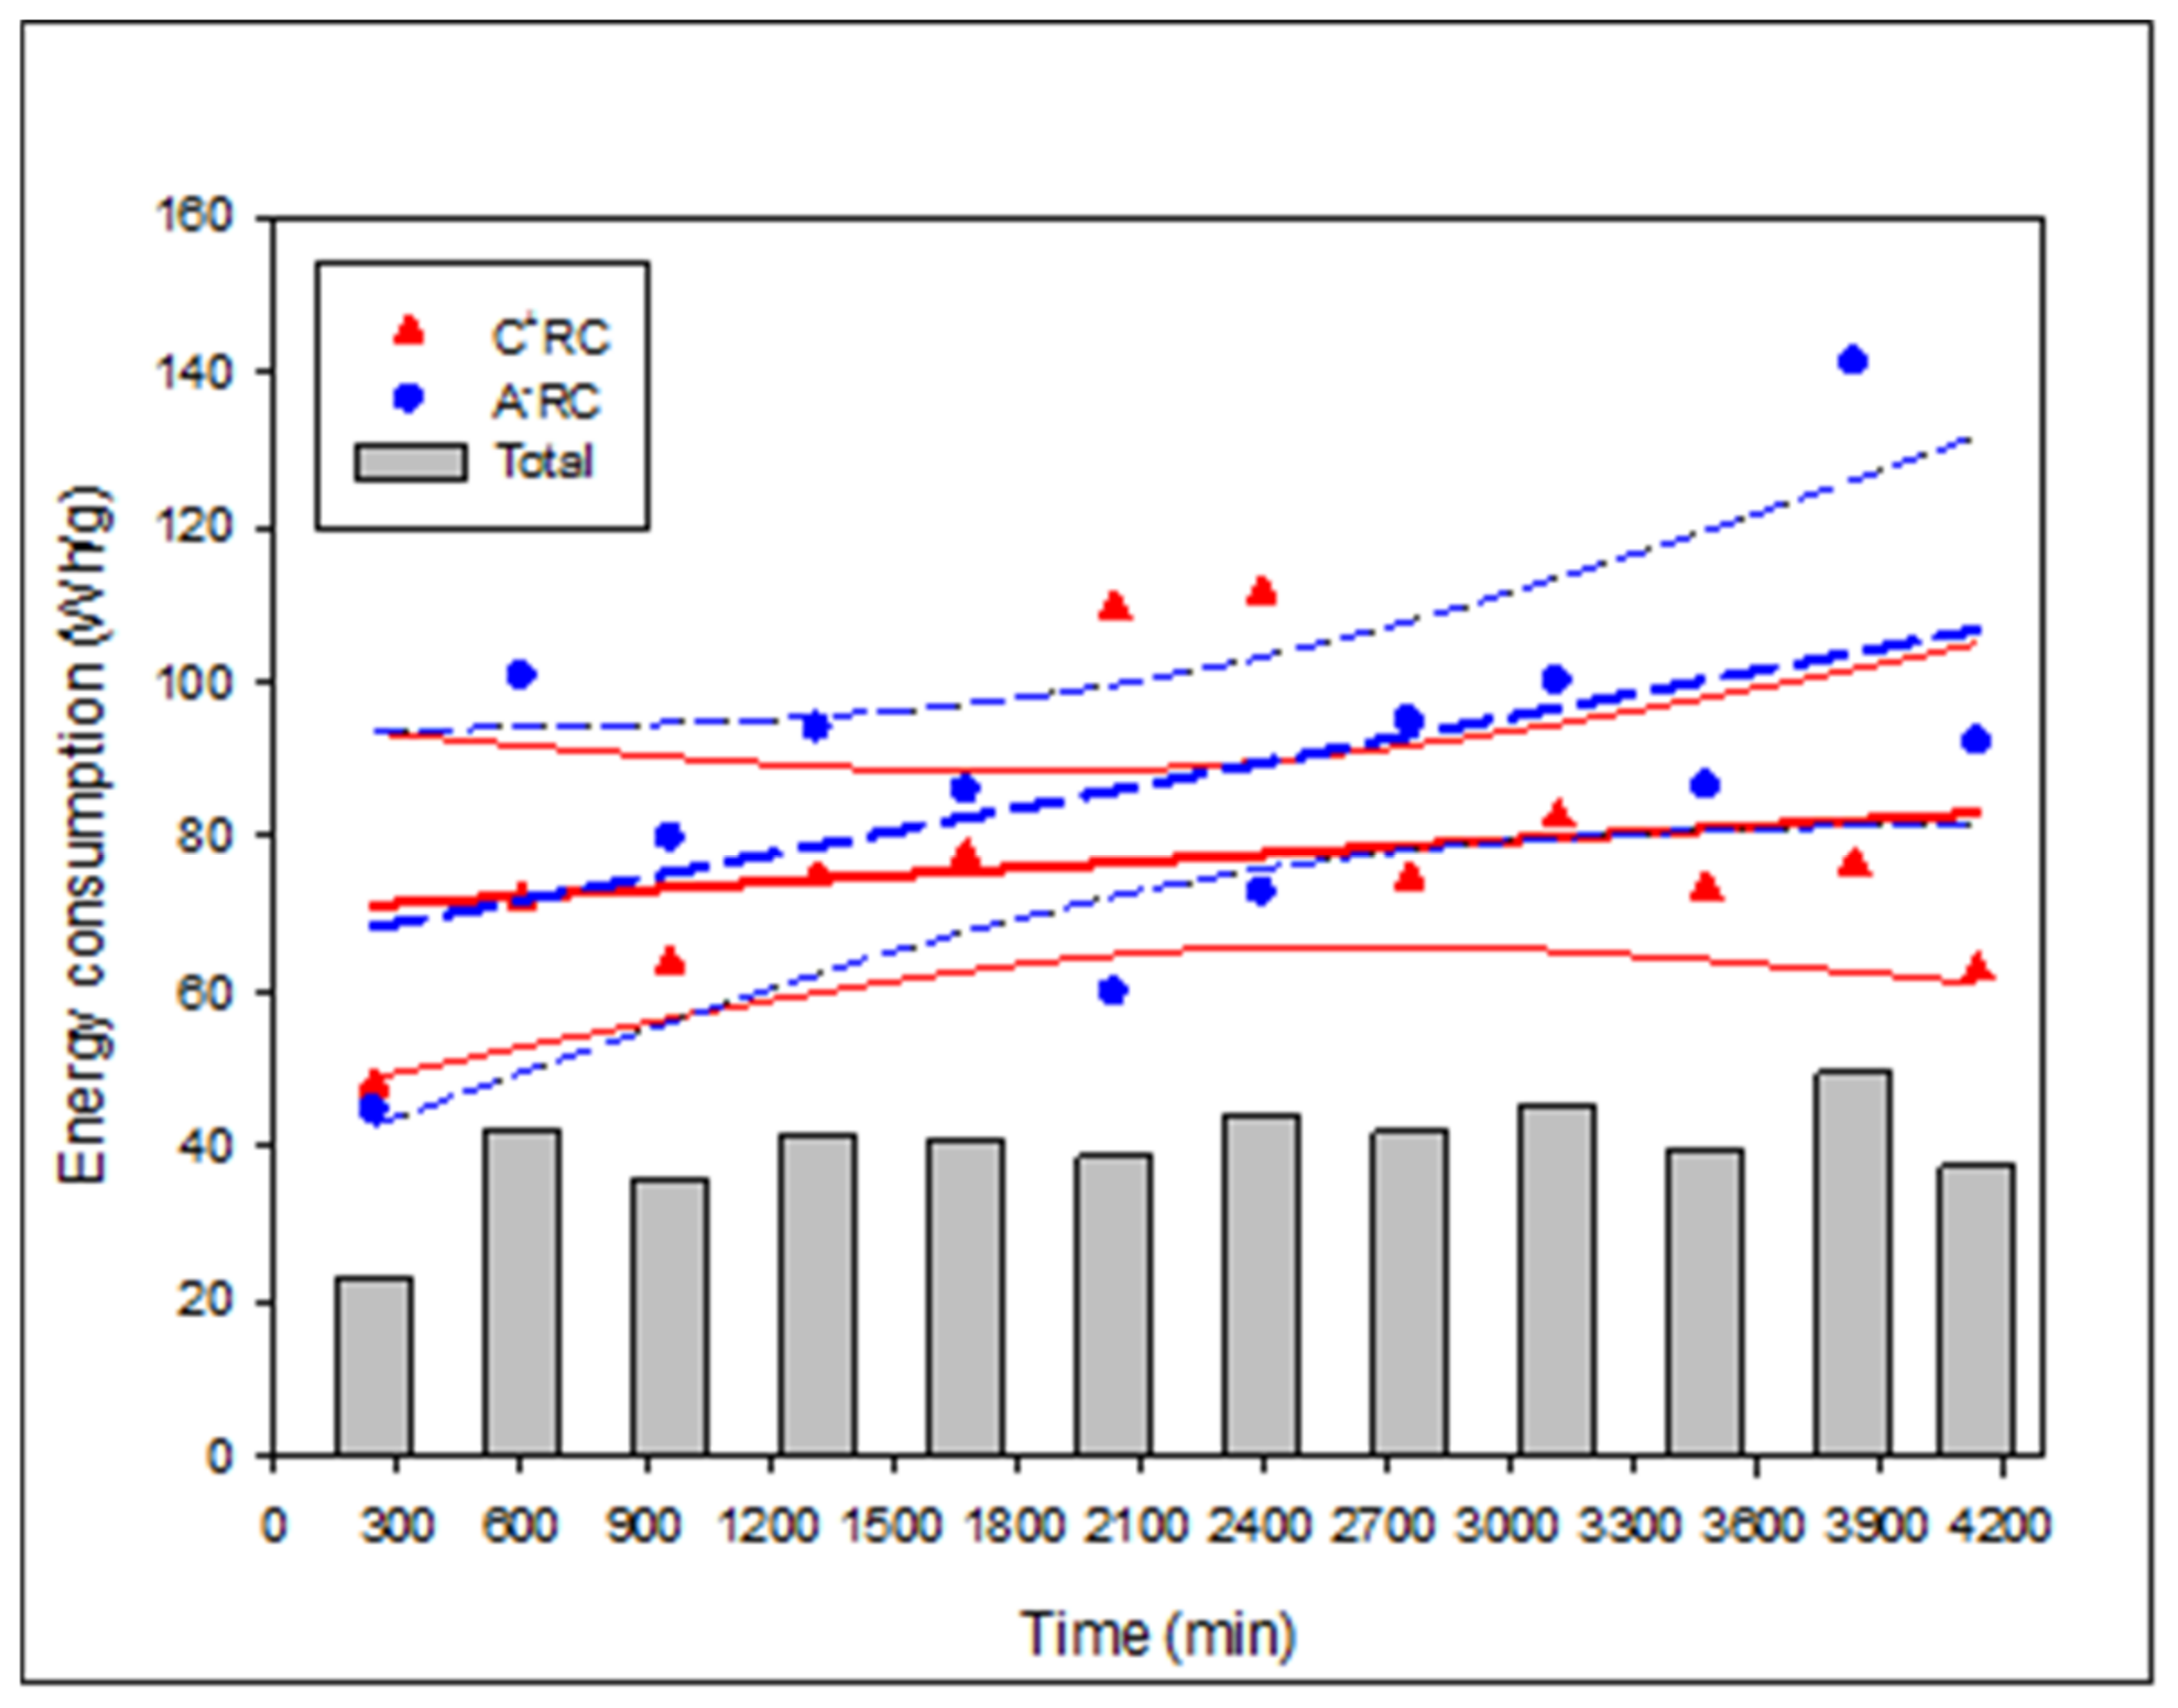
3.4. Relative Energy Consumption
3.5. Membrane Characterization
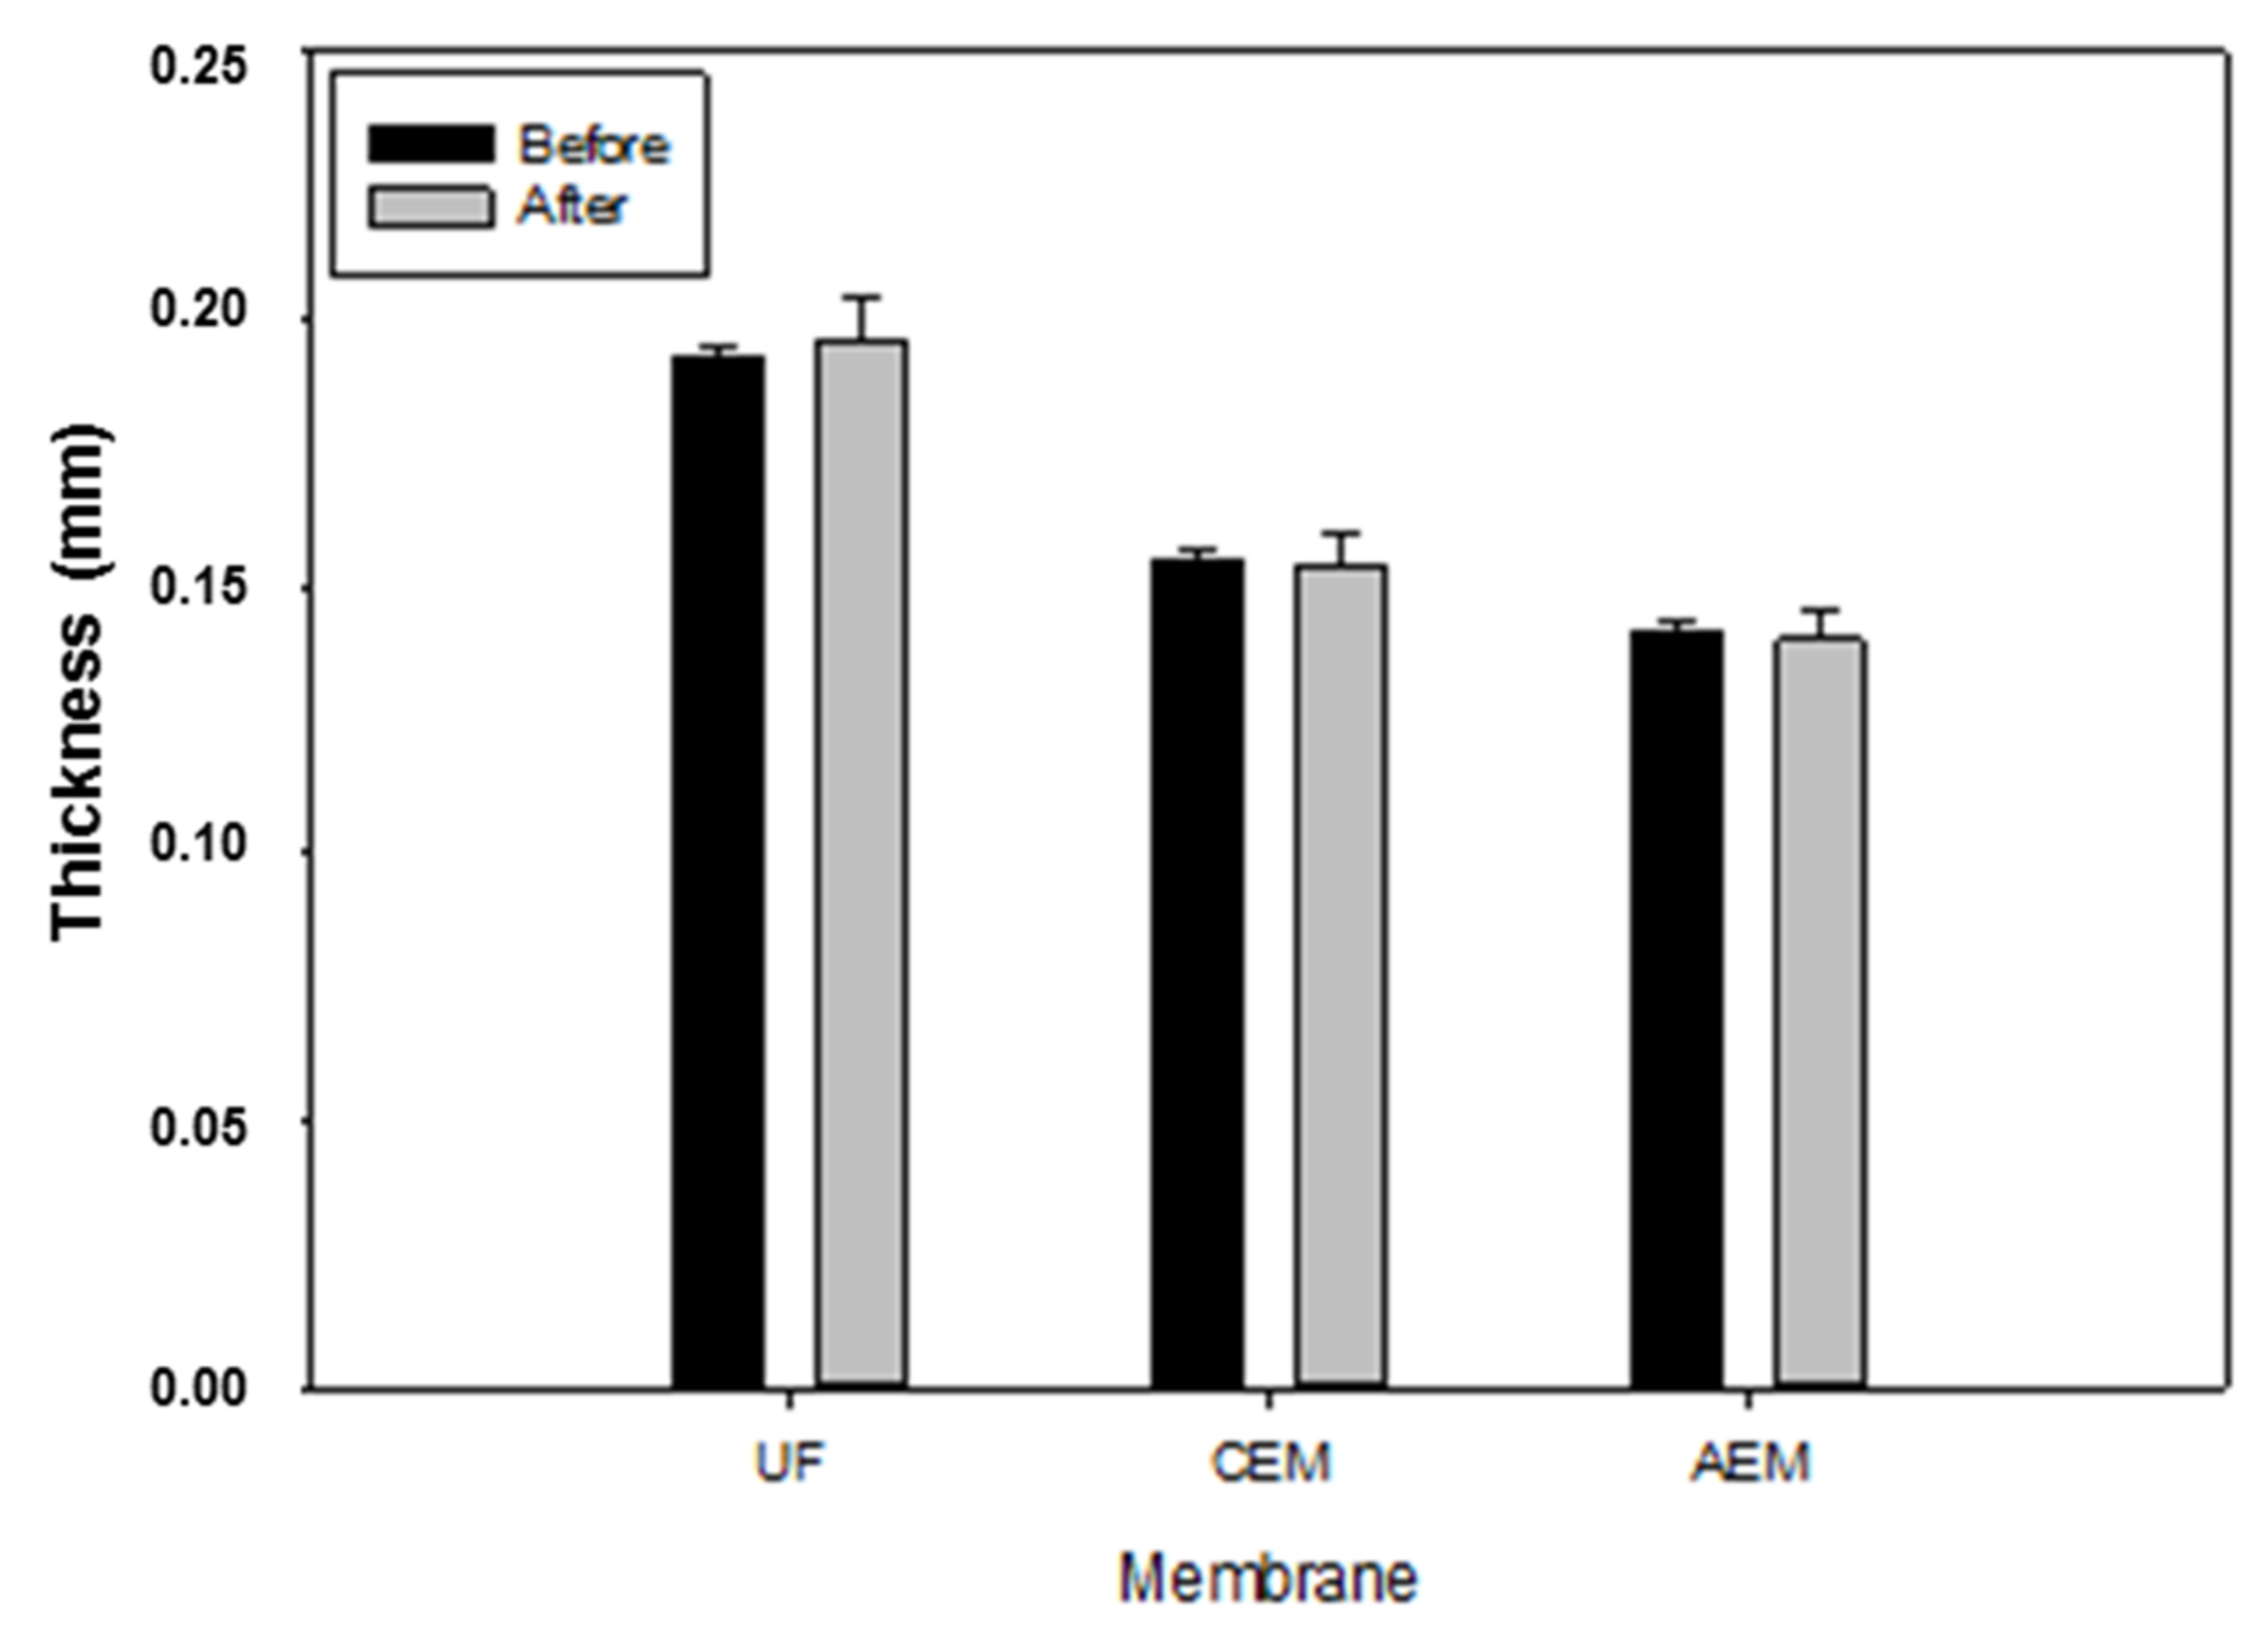
3.5.1. Thickness
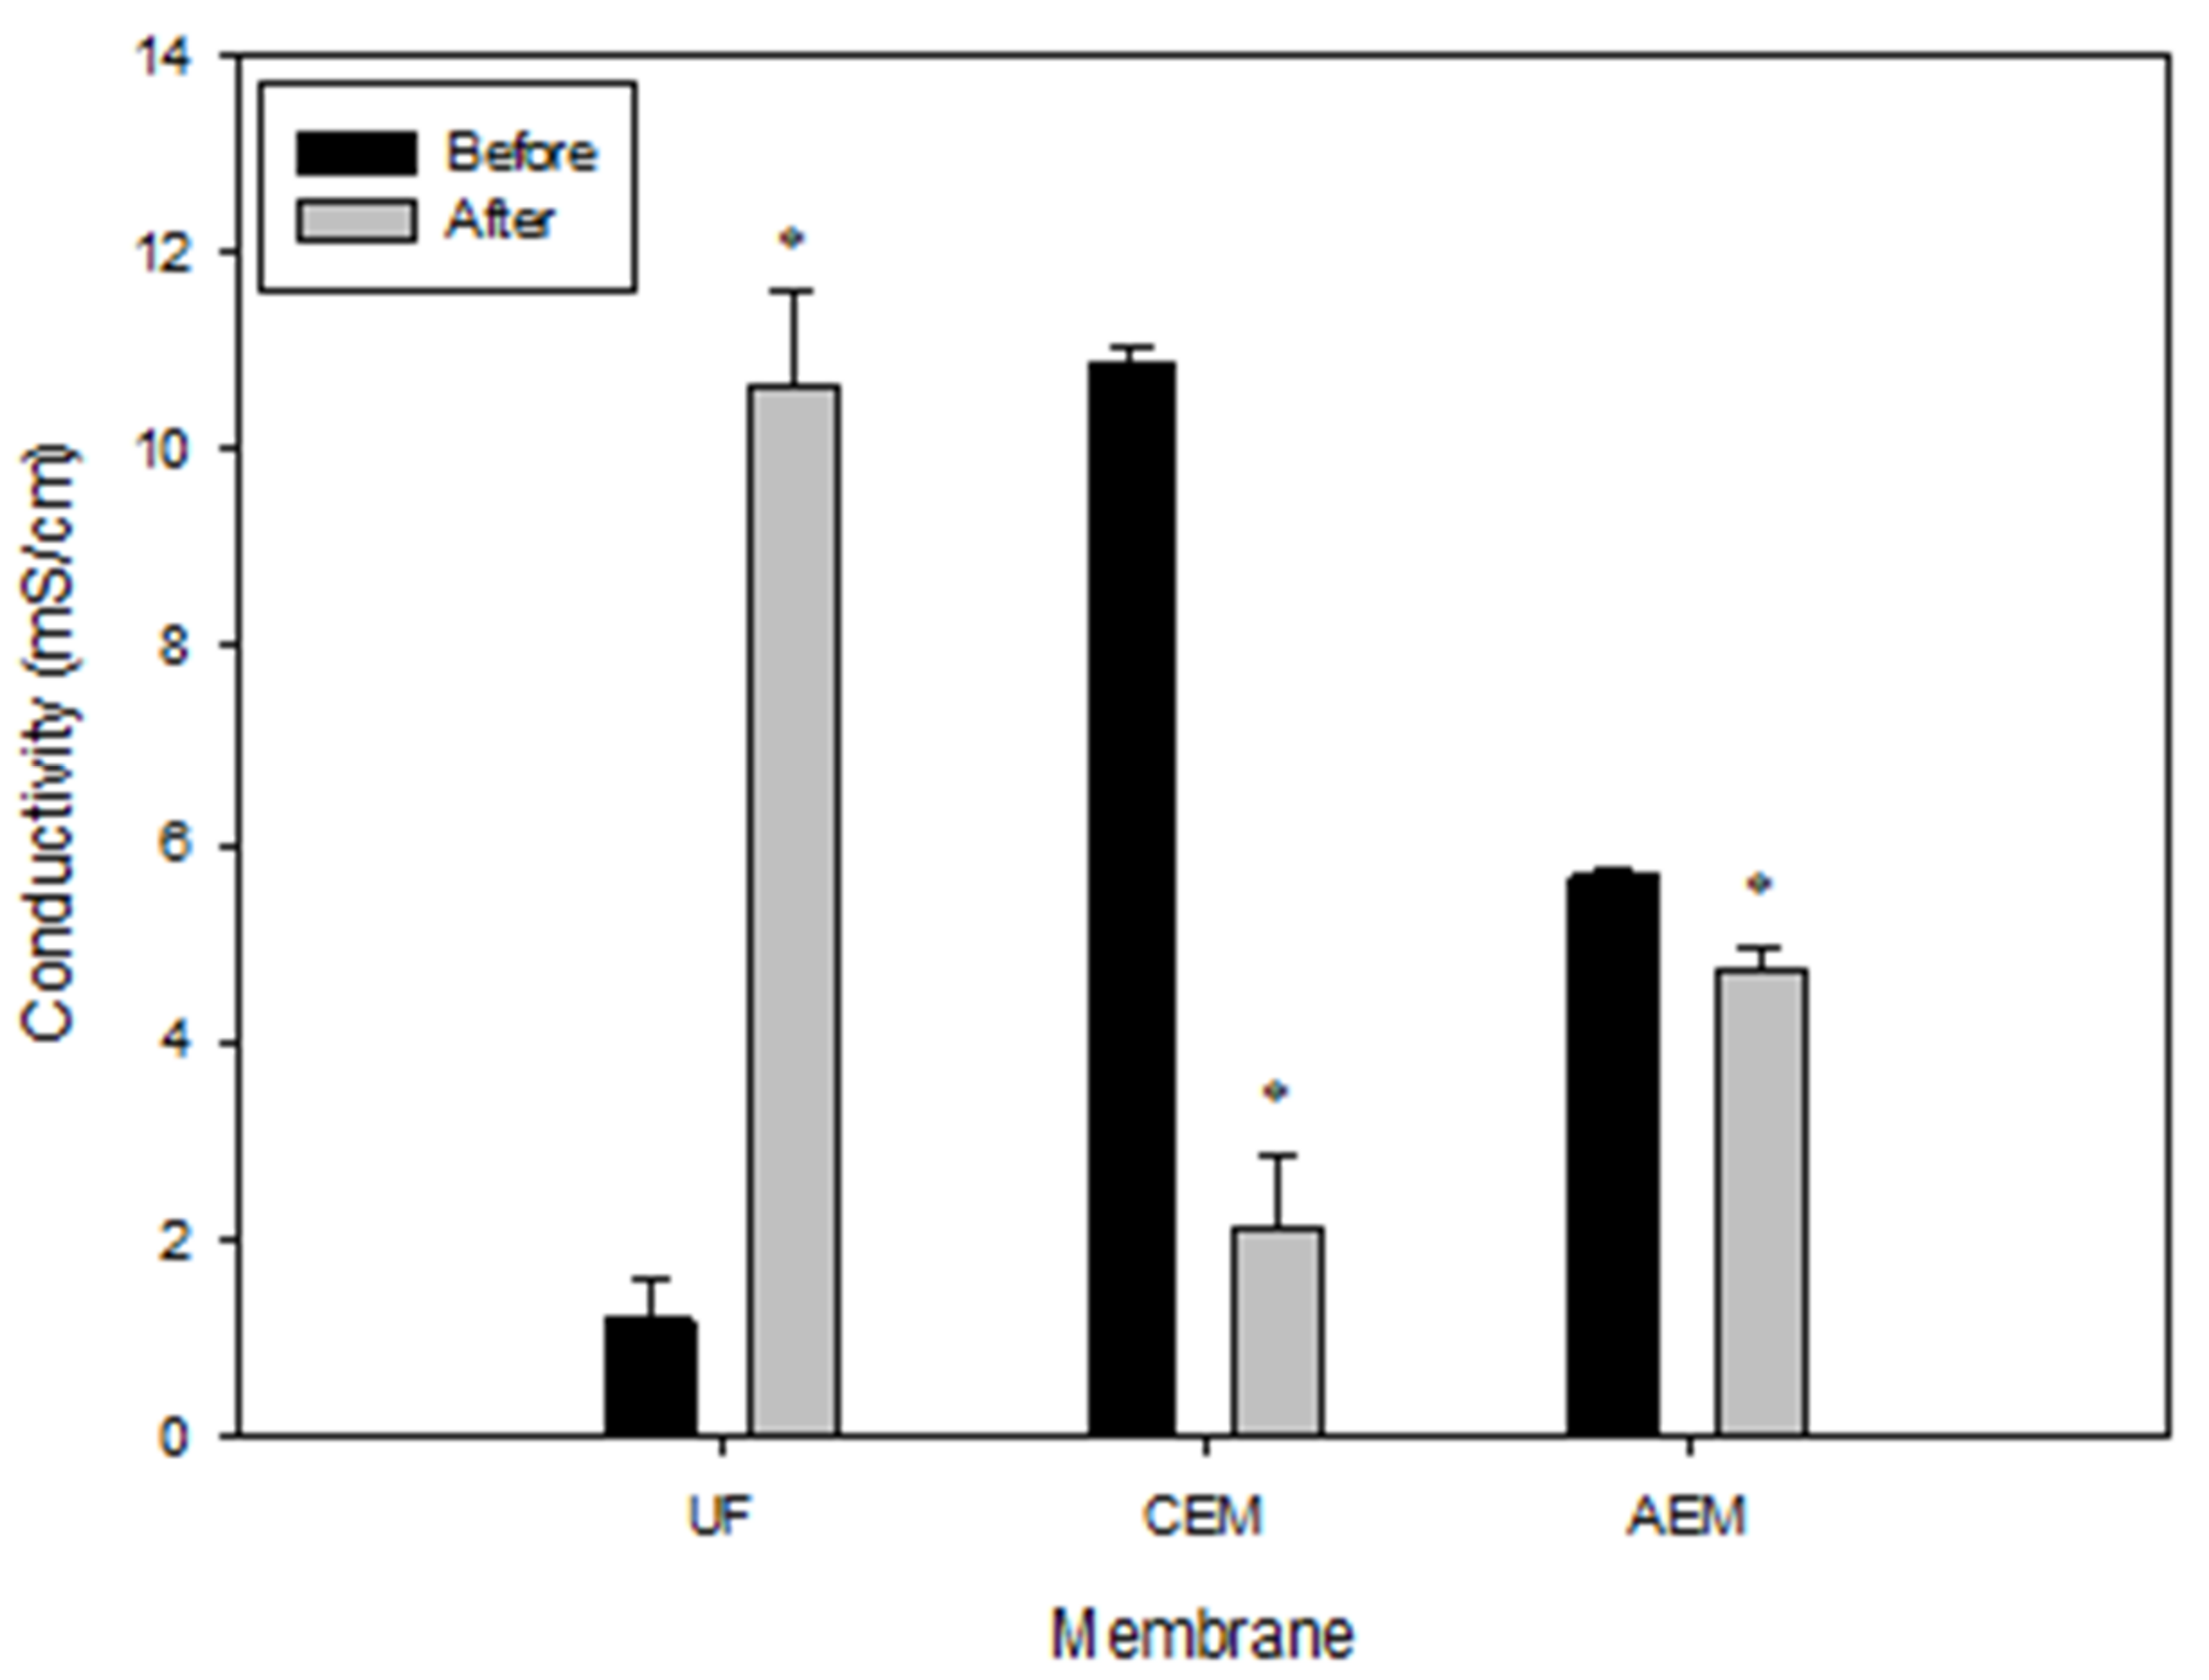
3.5.2. Conductivity
4. Conclusions
Supplementary Materials
Author Contributions
Funding
Institutional Review Board Statement
Informed Consent Statement
Data Availability Statement
Acknowledgments
Conflicts of Interest
References
- Fidaleo, M.; Moresi, M. Electrodialysis applications in the food industry. Adv. Food Nutr. Res. 2006, 51, 265–360. [Google Scholar]
- Suwal, S.; Ketnawa, S.; Liceaga, A.M.; Huang, J.-Y. Electro-membrane fractionation of antioxidant peptides from protein hydrolysates of rainbow trout (Oncorhynchus mykiss) byproducts. Innov. Food Sci. Emerg. Technol. 2018, 45, 122–131. [Google Scholar] [CrossRef]
- Kotsanopoulos, K.V.; Arvanitoyannis, I.S. Membrane processing technology in the food industry: Food processing, wastewater treatment, and effects on physical, microbiological, organoleptic, and nutritional properties of foods. Crit. Rev. Food Sci. Nutr. 2015, 55, 1147–1175. [Google Scholar] [CrossRef]
- Bazinet, L.; Geoffroy, T.R. Electrodialytic Processes: Market Overview, Membrane Phenomena, Recent Developments and Sustainable Strategies. Membranes 2020, 10, 221. [Google Scholar] [CrossRef]
- Dlask, O.; Václavíková, N. Electrodialysis with ultrafiltration membranes for peptide separation. Chem. Pap. 2018, 72, 261–271. [Google Scholar] [CrossRef]
- Vollet Marson, G.; Belleville, M.-P.; Lacour, S.; Dupas Hubinger, M. Membrane Fractionation of Protein Hydrolysates from By-Products: Recovery of Valuable Compounds from Spent Yeasts. Membranes 2021, 11, 23. [Google Scholar] [CrossRef] [PubMed]
- Sun, L.; Chen, Q.; Lu, H.; Wang, J.; Zhao, J.; Li, P. Electrodialysis with porous membrane for bioproduct separation: Technology, features, and progress. Food Res. Int. 2020, 137, 109343. [Google Scholar] [CrossRef] [PubMed]
- Poulin, J.-F.; Amiot, J.; Bazinet, L. Improved peptide fractionation by electrodialysis with ultrafiltration membrane: Influence of ultrafiltration membrane stacking and electrical field strength. J. Membr. Sci. 2007, 299, 83–90. [Google Scholar] [CrossRef]
- Suwal, S.; Roblet, C.; Doyen, A.; Amiot, J.; Beaulieu, L.; Legault, J.; Bazinet, L. Electrodialytic separation of peptides from snow crab by-product hydrolysate: Effect of cell configuration on peptide selectivity and local electric field. Sep. Purif. Technol. 2014, 127, 29–38. [Google Scholar] [CrossRef]
- Henaux, L.; Thibodeau, J.; Pilon, G.; Gill, T.; Marette, A.; Bazinet, L. How Charge and Triple Size-Selective Membrane Separation of Peptides from Salmon Protein Hydrolysate Orientate their Biological Response on Glucose Uptake. Int. J. Mol. Sci. 2019, 20, 1939. [Google Scholar] [CrossRef] [Green Version]
- Durand, R.; Pellerin, G.; Thibodeau, J.; Fraboulet, E.; Marette, A.; Bazinet, L. Screening for metabolic syndrome application of a herring by-product hydrolysate after its separation by electrodialysis with ultrafiltration membrane and identification of novel anti-inflammatory peptides. Sep. Purif. Technol. 2020, 235, 116205. [Google Scholar] [CrossRef]
- Durand, R.; Fraboulet, E.; Marette, A.; Bazinet, L. Simultaneous double cationic and anionic molecule separation from herring milt hydrolysate and impact on resulting fraction bioactivities. Sep. Purif. Technol. 2019, 210, 431–441. [Google Scholar] [CrossRef]
- Firdaous, L.; Dhulster, P.; Amiot, J.; Doyen, A.; Lutin, F.; Vézina, L.-P.; Bazinet, L. Investigation of the large-scale bioseparation of an antihypertensive peptide from alfalfa white protein hydrolysate by an electromembrane process. J. Membr. Sci. 2010, 355, 175–181. [Google Scholar] [CrossRef]
- Doyen, A.; Roblet, C.; Beaulieu, L.; Saucier, L.; Pouliot, Y.; Bazinet, L. Impact of water splitting phenomenon during electrodialysis with ultrafiltration membranes on peptide selectivity and migration. J. Membr. Sci. 2013, 428, 349–356. [Google Scholar] [CrossRef]
- Langevin, M.-E.; Roblet, C.; Moresoli, C.; Ramassamy, C.; Bazinet, L. Comparative application of pressure- and electrically-driven membrane processes for isolation of bioactive peptides from soy protein hydrolysate. J. Membr. Sci. 2012, 403–404, 15–24. [Google Scholar] [CrossRef]
- Roblet, C.; Doyen, A.; Amiot, J.; Bazinet, L. Impact of pH on ultrafiltration membrane selectivity during electrodialysis with ultrafiltration membrane (EDUF) purification of soy peptides from a complex matrix. J. Membr. Sci. 2013, 435, 207–217. [Google Scholar] [CrossRef]
- Persico, M.; Mikhaylin, S.; Doyen, A.; Firdaous, L.; Hammami, R.; Bazinet, L. How peptide physicochemical and structural characteristics affect anion-exchange membranes fouling by a tryptic whey protein hydrolysate. J. Membr. Sci. 2016, 520, 914–923. [Google Scholar] [CrossRef]
- Persico, M.; Dhulster, P.; Bazinet, L. Redundancy analysis for determination of the main physicochemical characteristics of filtration membranes explaining their fouling by peptides. J. Membr. Sci. 2018, 563, 708–717. [Google Scholar] [CrossRef]
- Lteif, R.; Dammak, L.; Larchet, C.; Auclair, B. Conductivité électrique membranaire: Étude de l’effet de la concentration, de la nature de l’électrolyte et de la structure membranaire. Eur. Polym. J. 1999, 35, 1187–1195. [Google Scholar] [CrossRef]
- Lebrun, L.; Da Silva, E.; Pourcelly, G.; Métayer, M. Elaboration and characterisation of ion-exchange films used in the fabrication of bipolar membranes. J. Membr. Sci. 2003, 227, 95–111. [Google Scholar] [CrossRef]
- Kadel, S.; Daigle, G.; Thibodeau, J.; Perreault, V.; Pellerin, G.; Lainé, C.; Bazinet, L. How physicochemical properties of filtration membranes impact peptide migration and selectivity during electrodialysis with filtration membranes: Development of predictive statistical models and understanding of mechanisms involved. J. Membr. Sci. 2021, 619, 118175. [Google Scholar] [CrossRef]
- MacRae, T.H.; Langdon, C.M. Tubulin synthesis, structure, and function: What are the relationships? Biochem. Cell Biol. 1989, 67, 770–790. [Google Scholar] [CrossRef]
- Firat-Karalar, E.N.; Welch, M.D. New mechanisms and functions of actin nucleation. Curr. Opin. Cell Biol. 2011, 23, 4–13. [Google Scholar] [CrossRef] [Green Version]
- Gelse, K.; Pöschl, E.; Aigner, T. Collagens—Structure, function, and biosynthesis. Adv. Drug Deliv. Rev. 2003, 55, 1531–1546. [Google Scholar] [CrossRef] [Green Version]
- Koumfieg Noudou, V.Y.; Suwal, S.; Amiot, J.; Mikhaylin, S.; Beaulieu, L.; Bazinet, L. Simultaneous electroseparation of anionic and cationic peptides: Impact of feed peptide concentration on migration rate, selectivity and relative energy consumption. Sep. Purif. Technol. 2016, 157, 53–59. [Google Scholar] [CrossRef]
- Kadel, S.; Pellerin, G.; Thibodeau, J.; Perreault, V.; Lainé, C.; Bazinet, L. How Molecular Weight Cut-Offs and Physicochemical Properties of Polyether Sulfone Membranes Affect Peptide Migration and Selectivity during Electrodialysis with Filtration Membranes. Membranes 2019, 9, 153. [Google Scholar] [CrossRef] [Green Version]
- Doyen, A.; Beaulieu, L.; Saucier, L.; Pouliot, Y.; Bazinet, L. Demonstration of in vitro anticancer properties of peptide fractions from a snow crab by-products hydrolysate after separation by electrodialysis with ultrafiltration membranes. Sep. Purif. Technol. 2011, 78, 321–329. [Google Scholar] [CrossRef]
- Suwal, S.; Roblet, C.; Amiot, J.; Bazinet, L. Presence of free amino acids in protein hydrolysate during electroseparation of peptides: Impact on system efficiency and membrane physicochemical properties. Sep. Purif. Technol. 2015, 147, 227–236. [Google Scholar] [CrossRef]
- Bazinet, L.; Poulin, J.-F.; Amiot, J. Effect of Conditioning Ultrafiltration Membranes on their Performances in Electrodialysis with Ultrafiltration Membrane. Sep. Sci. Technol. 2007, 42, 2501–2518. [Google Scholar] [CrossRef]
- Garcia-Vasquez, W.; Dammak, L.; Larchet, C.; Nikonenko, V.; Pismenskaya, N.; Grande, D. Evolution of anion-exchange membrane properties in a full scale electrodialysis stack. J. Membr. Sci. 2013, 446, 255–265. [Google Scholar] [CrossRef]
- Ping, Q.; Cohen, B.; Dosoretz, C.; He, Z. Long-term investigation of fouling of cation and anion exchange membranes in microbial desalination cells. Desalination 2013, 325, 48–55. [Google Scholar] [CrossRef]
- Langevin, M.-E.; Bazinet, L. Ion-exchange membrane fouling by peptides: A phenomenon governed by electrostatic interactions. J. Membr. Sci. 2011, 369, 359–366. [Google Scholar] [CrossRef]
- Persico, M.; Mikhaylin, S.; Doyen, A.; Firdaous, L.; Hammami, R.; Chevalier, M.; Flahaut, C.; Dhulster, P.; Bazinet, L. Formation of peptide layers and adsorption mechanisms on a negatively charged cation-exchange membrane. J. Colloid Interface Sci. 2017, 508, 488–499. [Google Scholar] [CrossRef] [PubMed]
- Sandeaux, J.; Fares, A.; Sandeaux, R.; Gavach, C. Transport properties of electrodialysis membranes in the presence of arginine I. Equilibrium properties of a cation exchange membrane in an aqueous solution of arginine chlorhydrate and sodium chloride. J. Membr. Sci. 1994, 89, 73–81. [Google Scholar] [CrossRef]


| Reference | Hydrolysate; Concentration; pH; Volume | # of UF Membrane; Membrane Surface | Membrane Type | Number of Experiments | Duration of Experiments/ Total Time | ED Parameters | Final Migration Rate (g/m2·h) | Cleaning |
|---|---|---|---|---|---|---|---|---|
| Firdaous et al. [13] | Alfalfa white; 0.5% (w/v); pH 3 and 9; 3 L | 6 UF total; 0.12 m2 | PES 10 kDa | 3 P− and 3 P+ | 120 min/ 720 min | 8 V | P−: 5.3 P+: 8.7 | CIP of the system only, not stack, with alkaline and acid solutions |
| Langevin et al. [15] | Soy; 0.1% (w/v); pH 3, 6, 9; 1.5 L | 8 UF total; 0.08 m2/RC | PES 10 kDa | 3 simultaneous P− and P+ for each pH | 180 min/ 1620 min | 8 V | P−: pH 3 = 0.109 pH 9 = 0.165 P+: pH 3 = 0.238 pH 9 = 0.097 | n/m |
| Doyen et al. [14] | Snow crab; 1% (w/v); pH 9; 2.5 L | 6 UF total; 0.06 m2/RC | PES 20 kDa | 4 simultaneous P− and P+ for each voltage | 60 min/ 960 min | 2, 4, 6 and 8 V | 6.67 | CIP after each run with Ecolab cleaning solutions *, then stack dismantled |
| Roblet et al. [16] | Soy; 2.4% (w/v); pH 3, 6, 9; 2 L | 6 UF total; 0.06 m2/RC | PES 10 kDa | 3 simultaneous P− and P+ for each pH | 240 min/ 2160 min | 5 V | P−: 1.3 P+: 2.4 | CIP after each run with Ecolab cleaning solutions *, then stack dismantled |
| This study | Herring milt; 4% (w/v); pH 7; 3 L | 8 UF total; 0.08 m2/RC | PES 50 kDa | 12 simultaneous P− and P+ | 240–360 min/ 4140 min | 14 V | P−: 4.7 P+: 5.2 | Sodium chloride (NaCl) 2% solution |
Publisher’s Note: MDPI stays neutral with regard to jurisdictional claims in published maps and institutional affiliations. |
© 2021 by the authors. Licensee MDPI, Basel, Switzerland. This article is an open access article distributed under the terms and conditions of the Creative Commons Attribution (CC BY) license (https://creativecommons.org/licenses/by/4.0/).
Share and Cite
Thibodeau, J.; Benoit, N.; Perreault, V.; Bazinet, L. Scale-Up and Long-Term Study of Electrodialysis with Ultrafiltration Membrane for the Separation of a Herring Milt Hydrolysate. Membranes 2021, 11, 558. https://0-doi-org.brum.beds.ac.uk/10.3390/membranes11080558
Thibodeau J, Benoit N, Perreault V, Bazinet L. Scale-Up and Long-Term Study of Electrodialysis with Ultrafiltration Membrane for the Separation of a Herring Milt Hydrolysate. Membranes. 2021; 11(8):558. https://0-doi-org.brum.beds.ac.uk/10.3390/membranes11080558
Chicago/Turabian StyleThibodeau, Jacinthe, Noémie Benoit, Véronique Perreault, and Laurent Bazinet. 2021. "Scale-Up and Long-Term Study of Electrodialysis with Ultrafiltration Membrane for the Separation of a Herring Milt Hydrolysate" Membranes 11, no. 8: 558. https://0-doi-org.brum.beds.ac.uk/10.3390/membranes11080558