
Design Strategies for Alkaline Exchange Membrane–Electrode Assemblies: Optimization for Fuel Cells and Electrolyzers

Abstract
:
1. Introduction
2. Materials and Methods
2.1. Materials
2.2. Amination and Crosslinking
2.3. Catalyst Ink Preparation
2.4. Cell Production
2.5. Interlayers
2.6. Membrane Casting
2.7. Ion Exchange Capacity Measurement
2.8. Fuel Cell Tests
2.9. Electrolyzer Tests
2.10. Hydrogen Crossover Tests
2.11. Conductivity Measurements
2.12. HR-SEM Imaging
3. Results
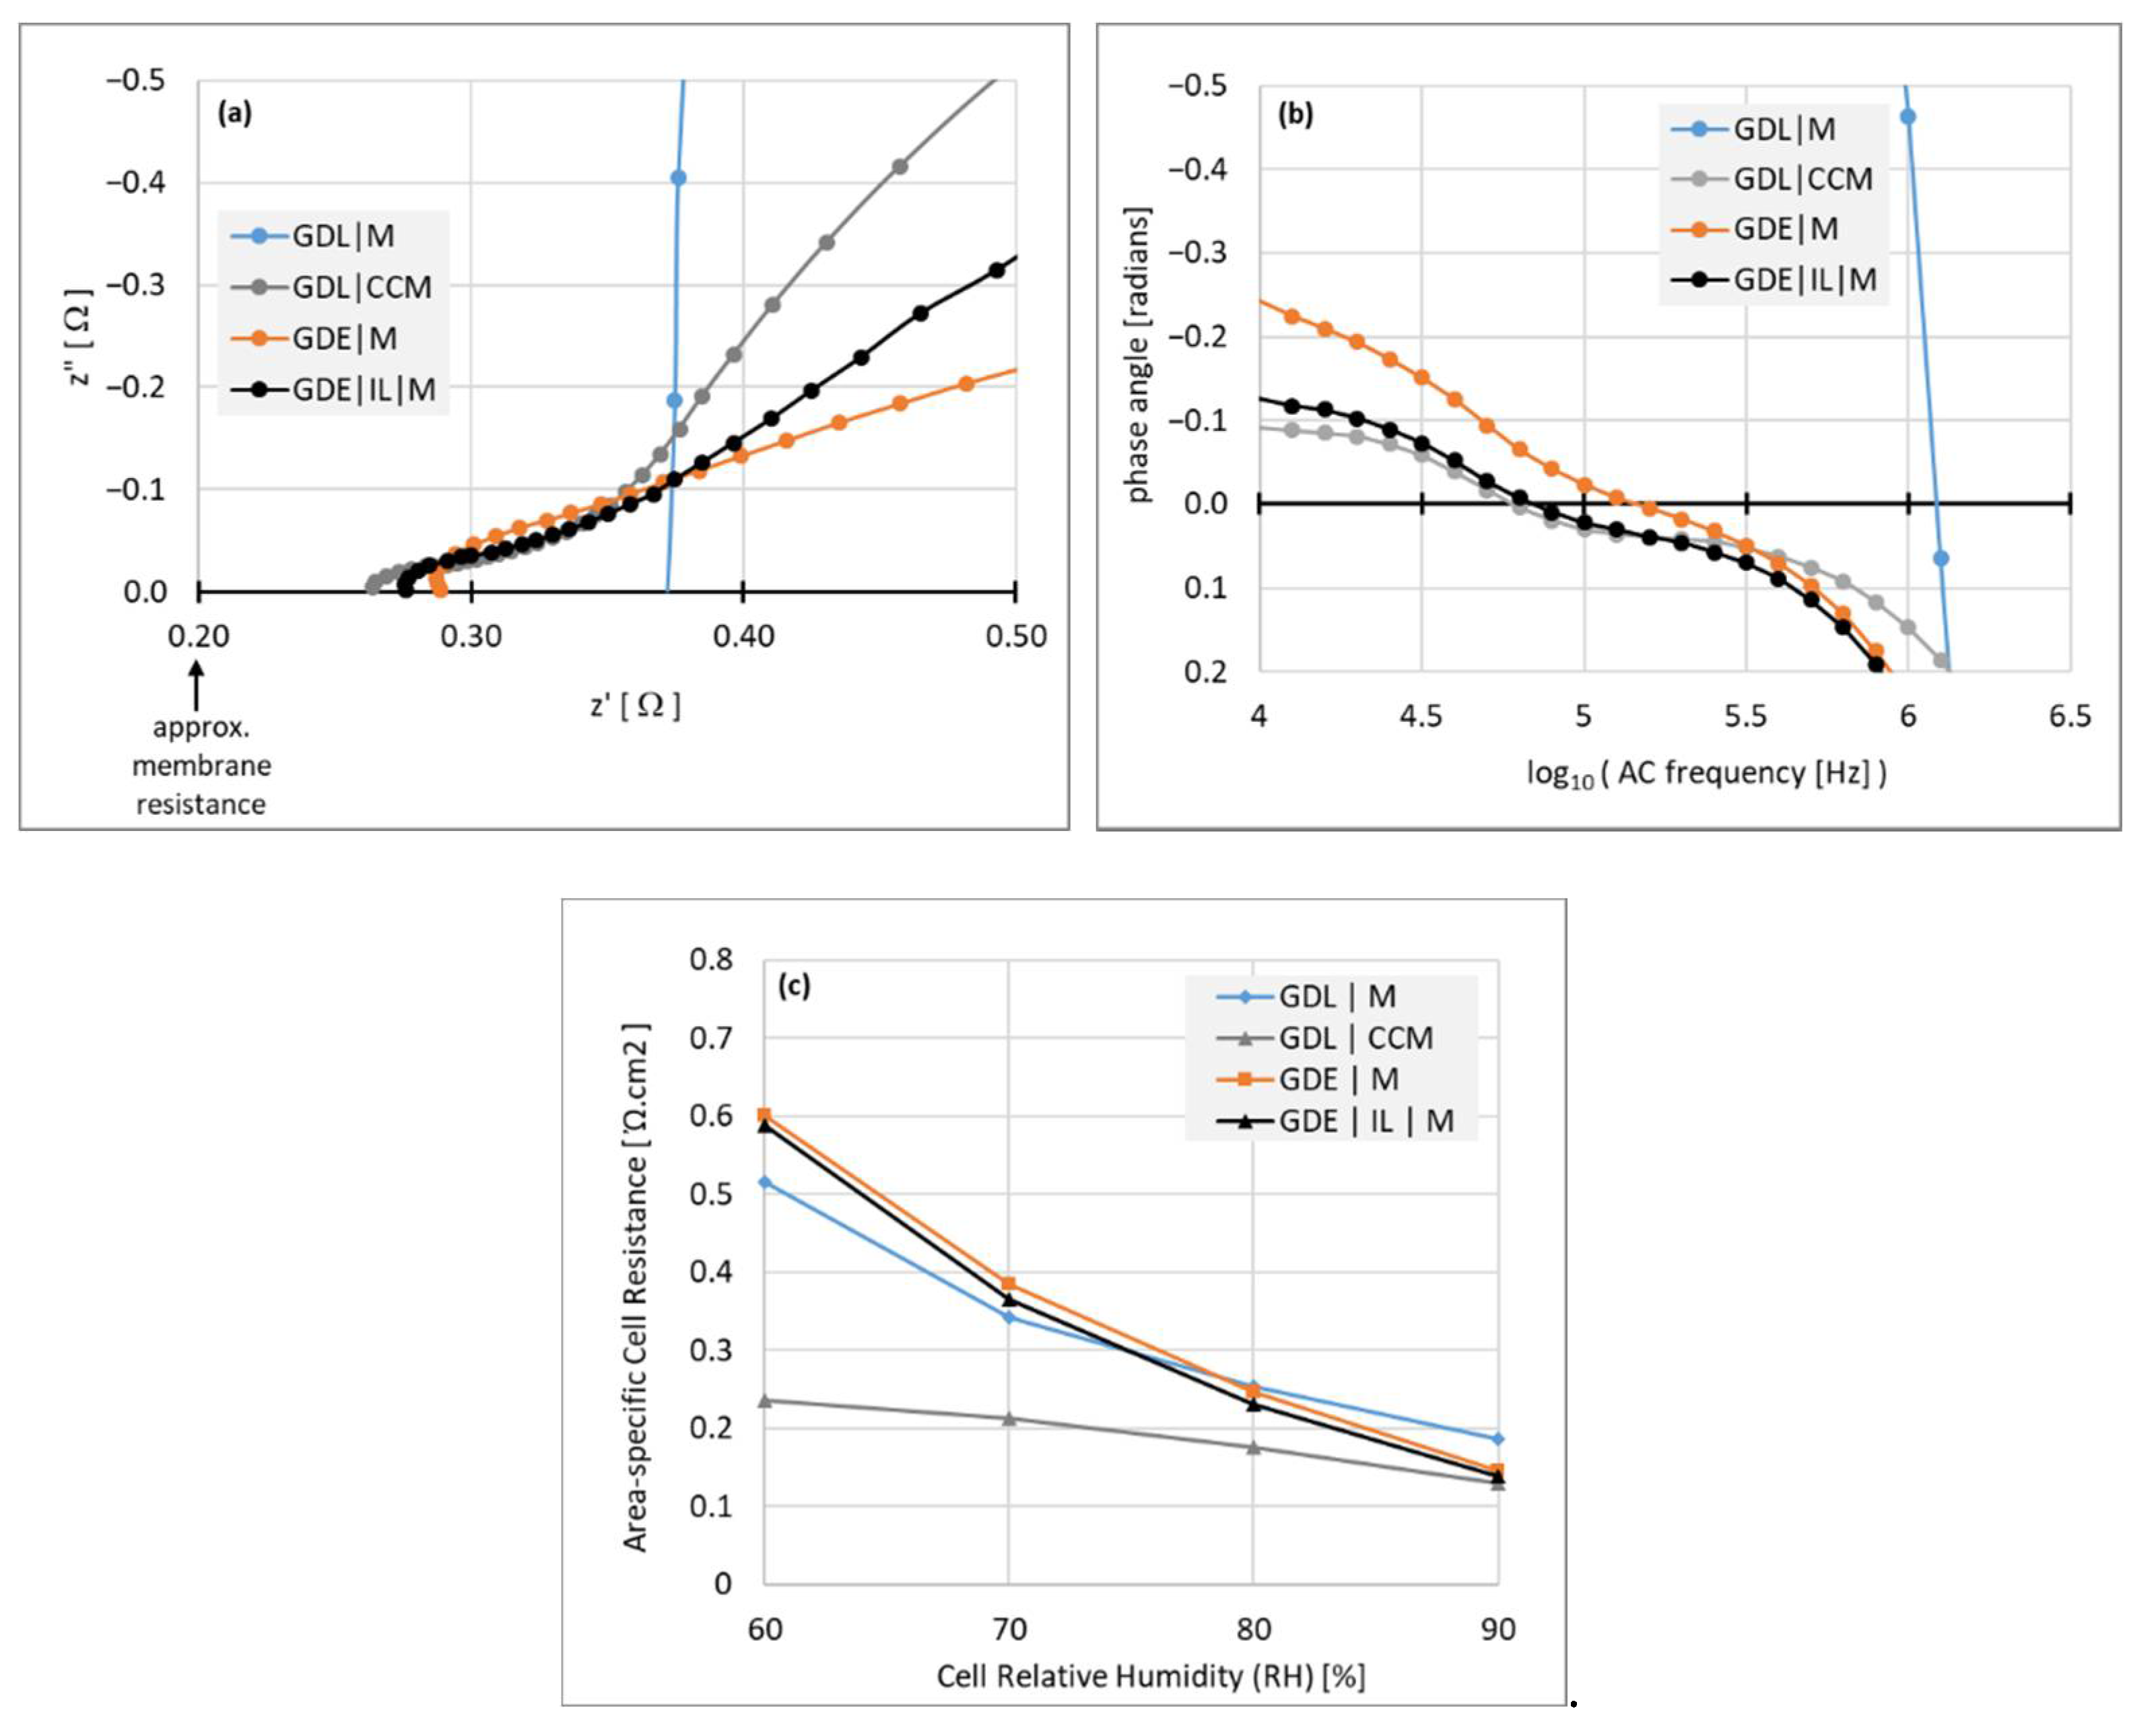
3.1. Membrane-CL Interfacial Resistance Measurements
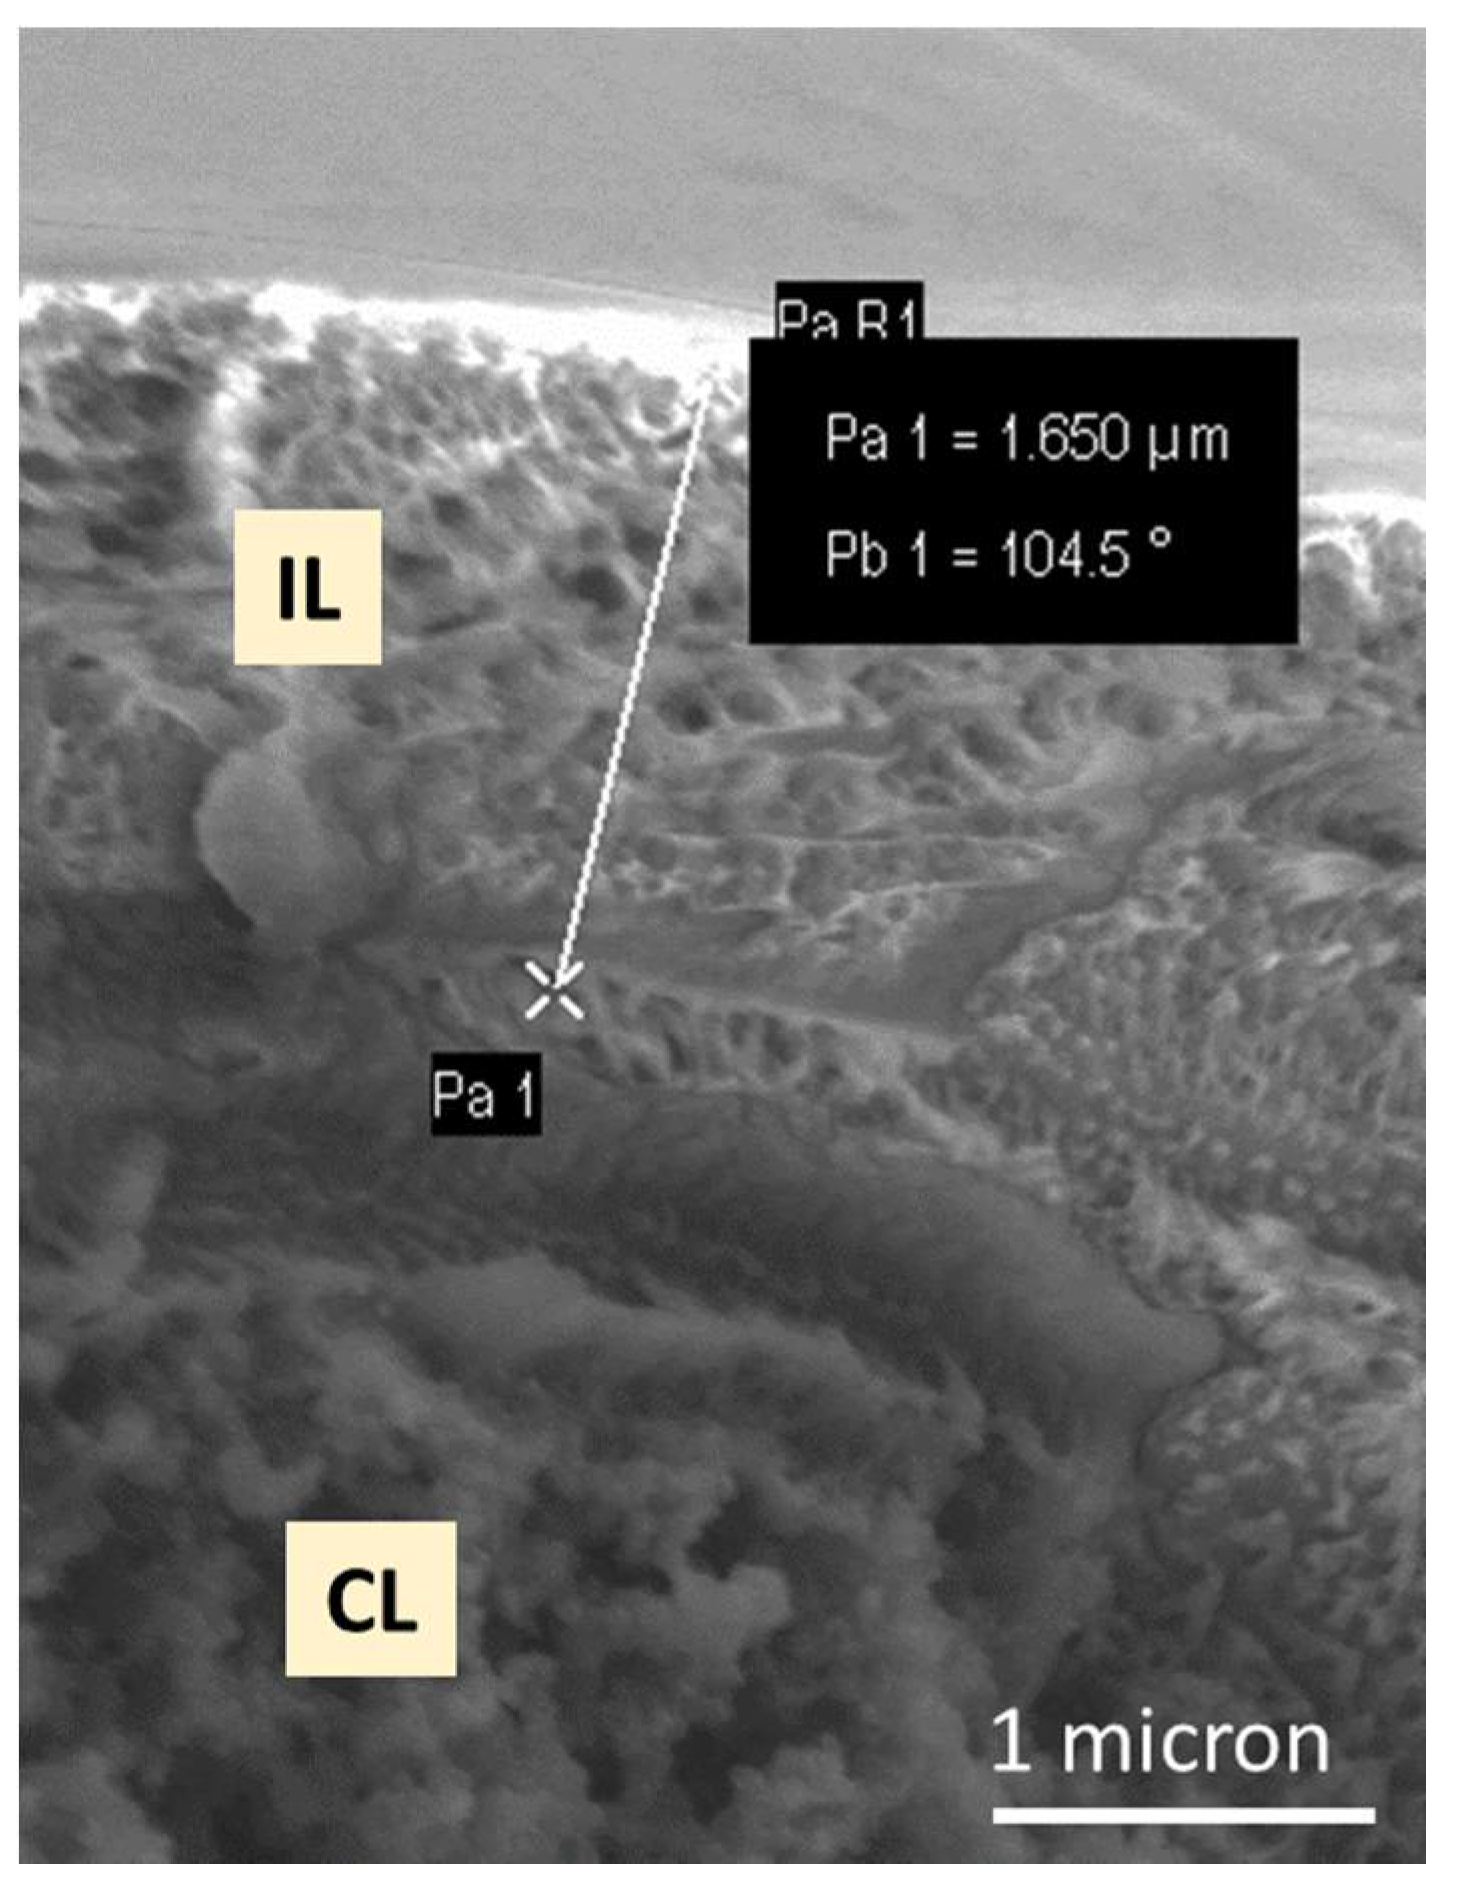
3.2. Imaging the CL | IL Interface
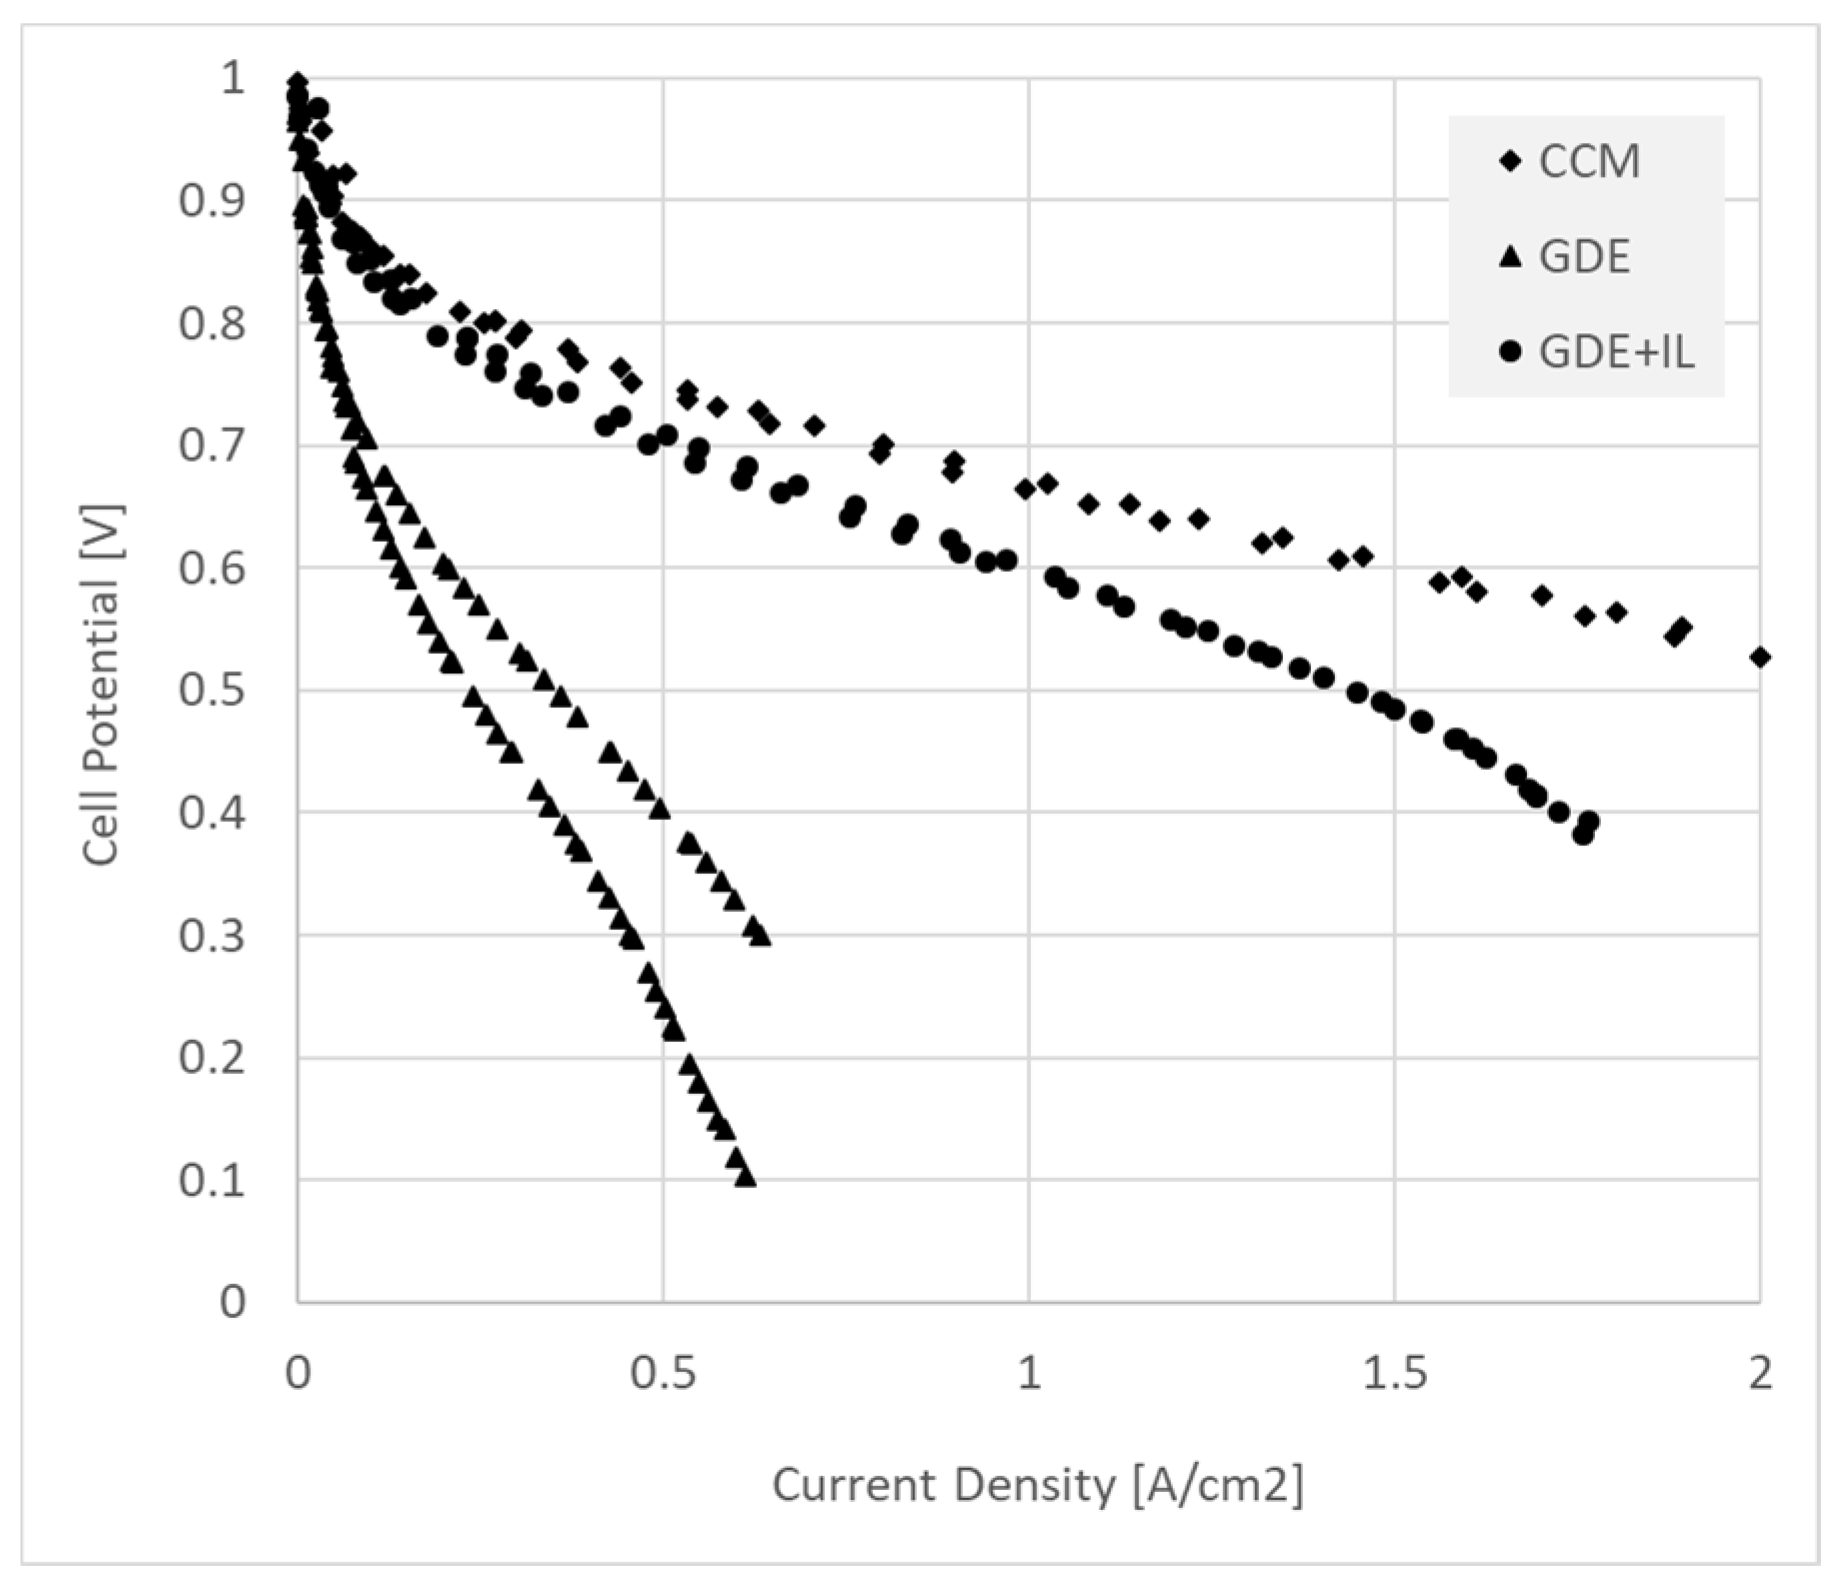
3.3. Performance of MEA’s in Fuel Cell Operation
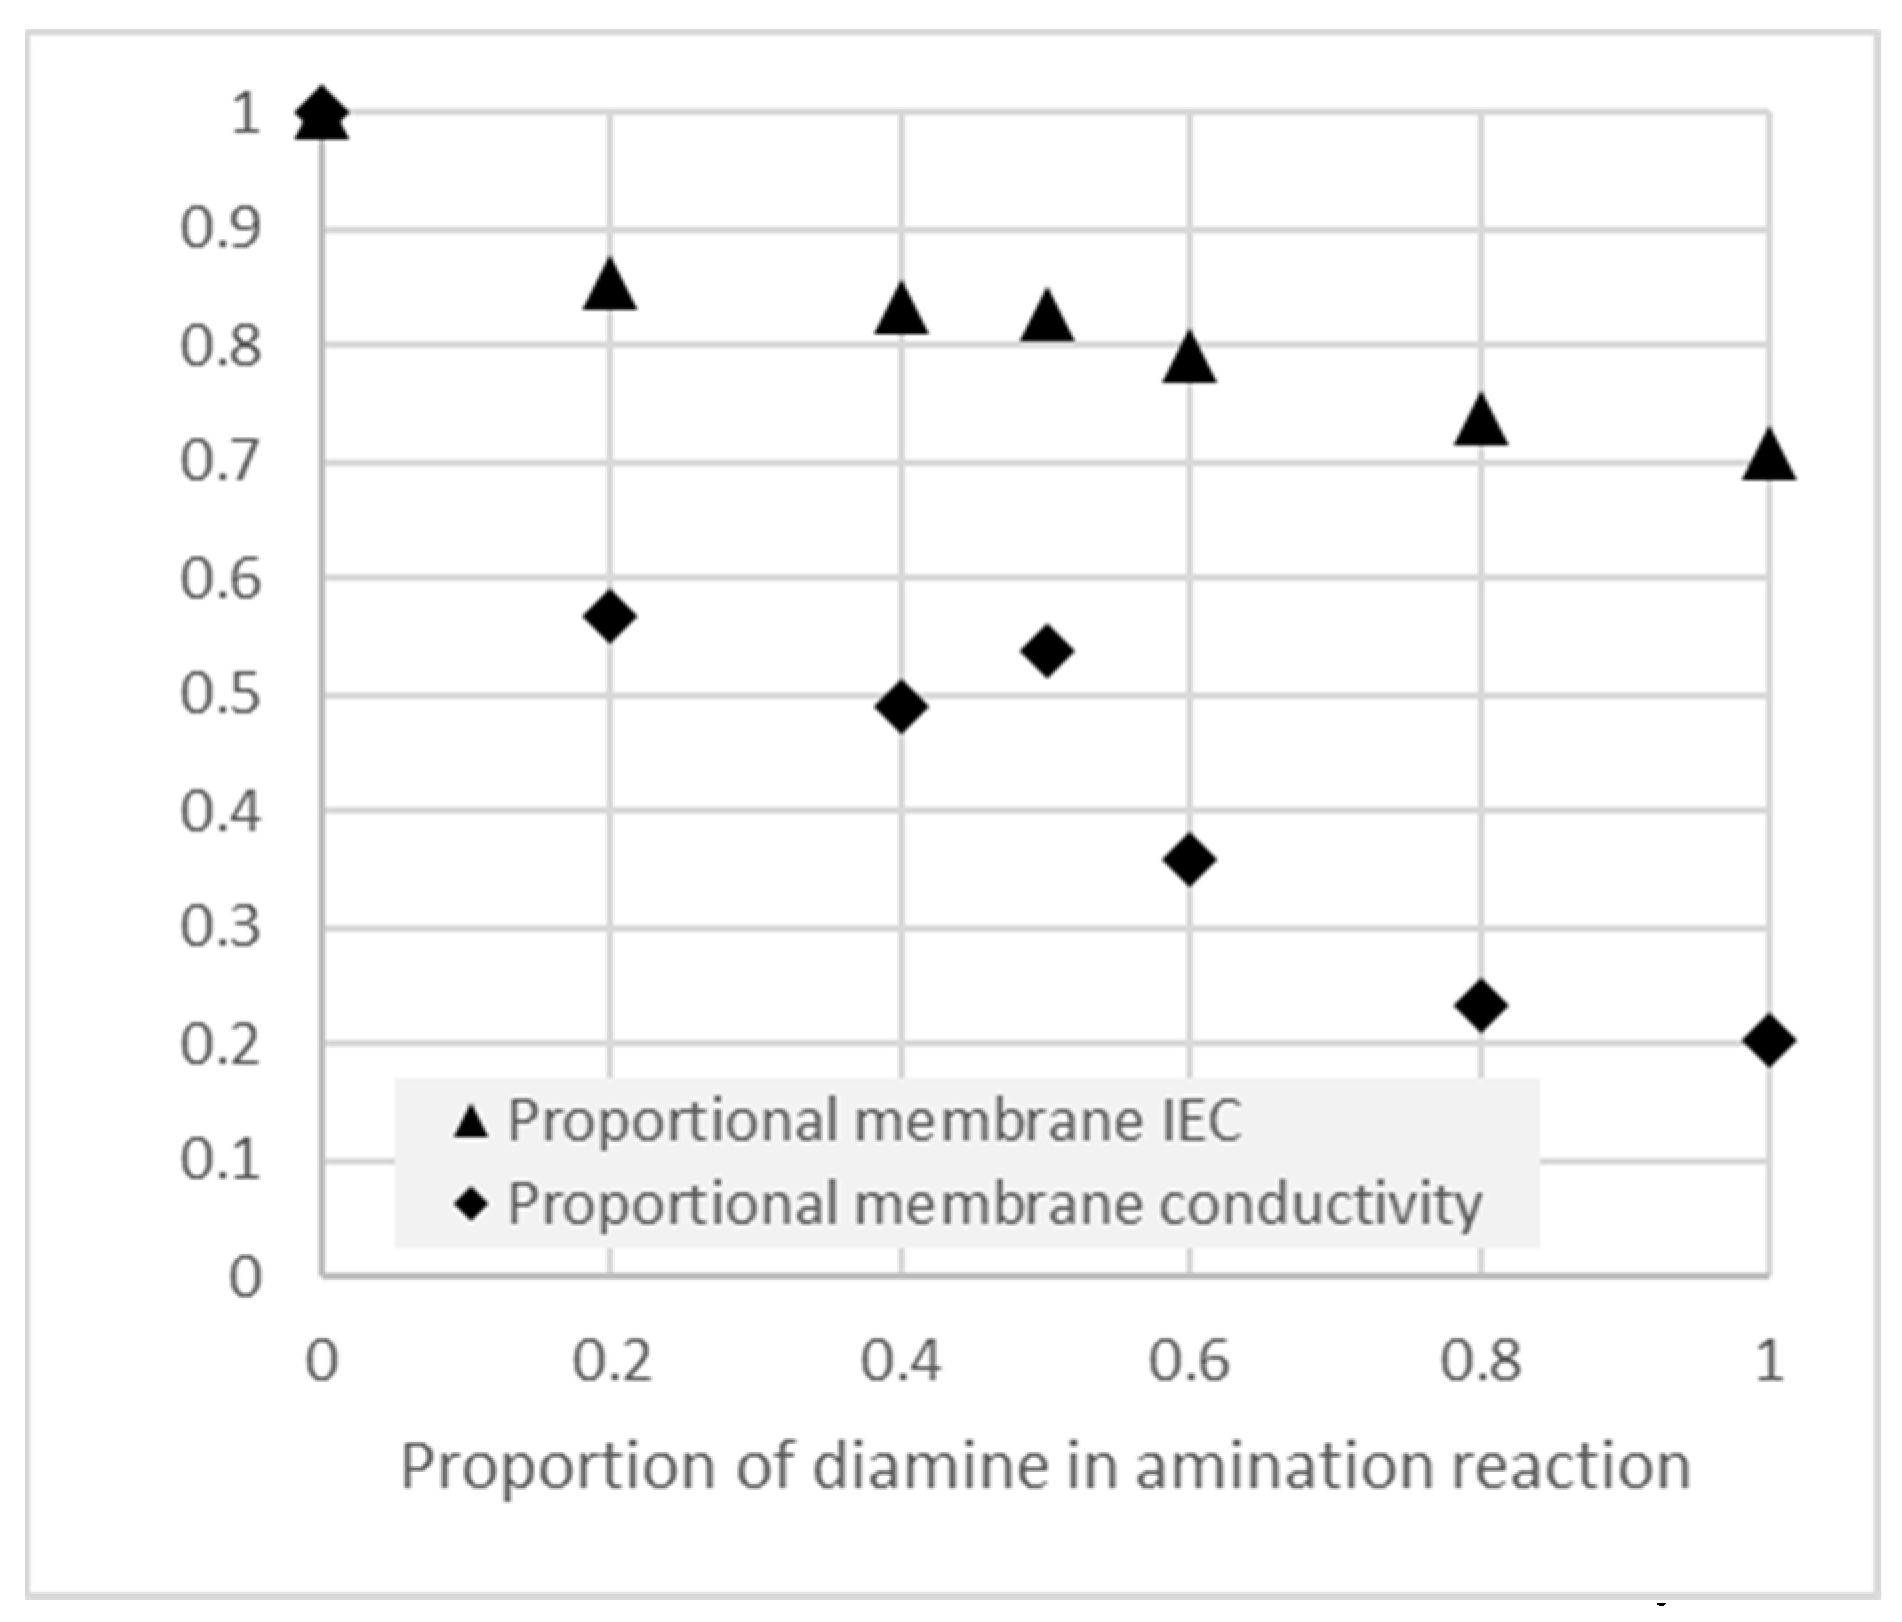
3.4. Cross-Linking of Ionomer Precursors via Quaternization of Secondary Diamines
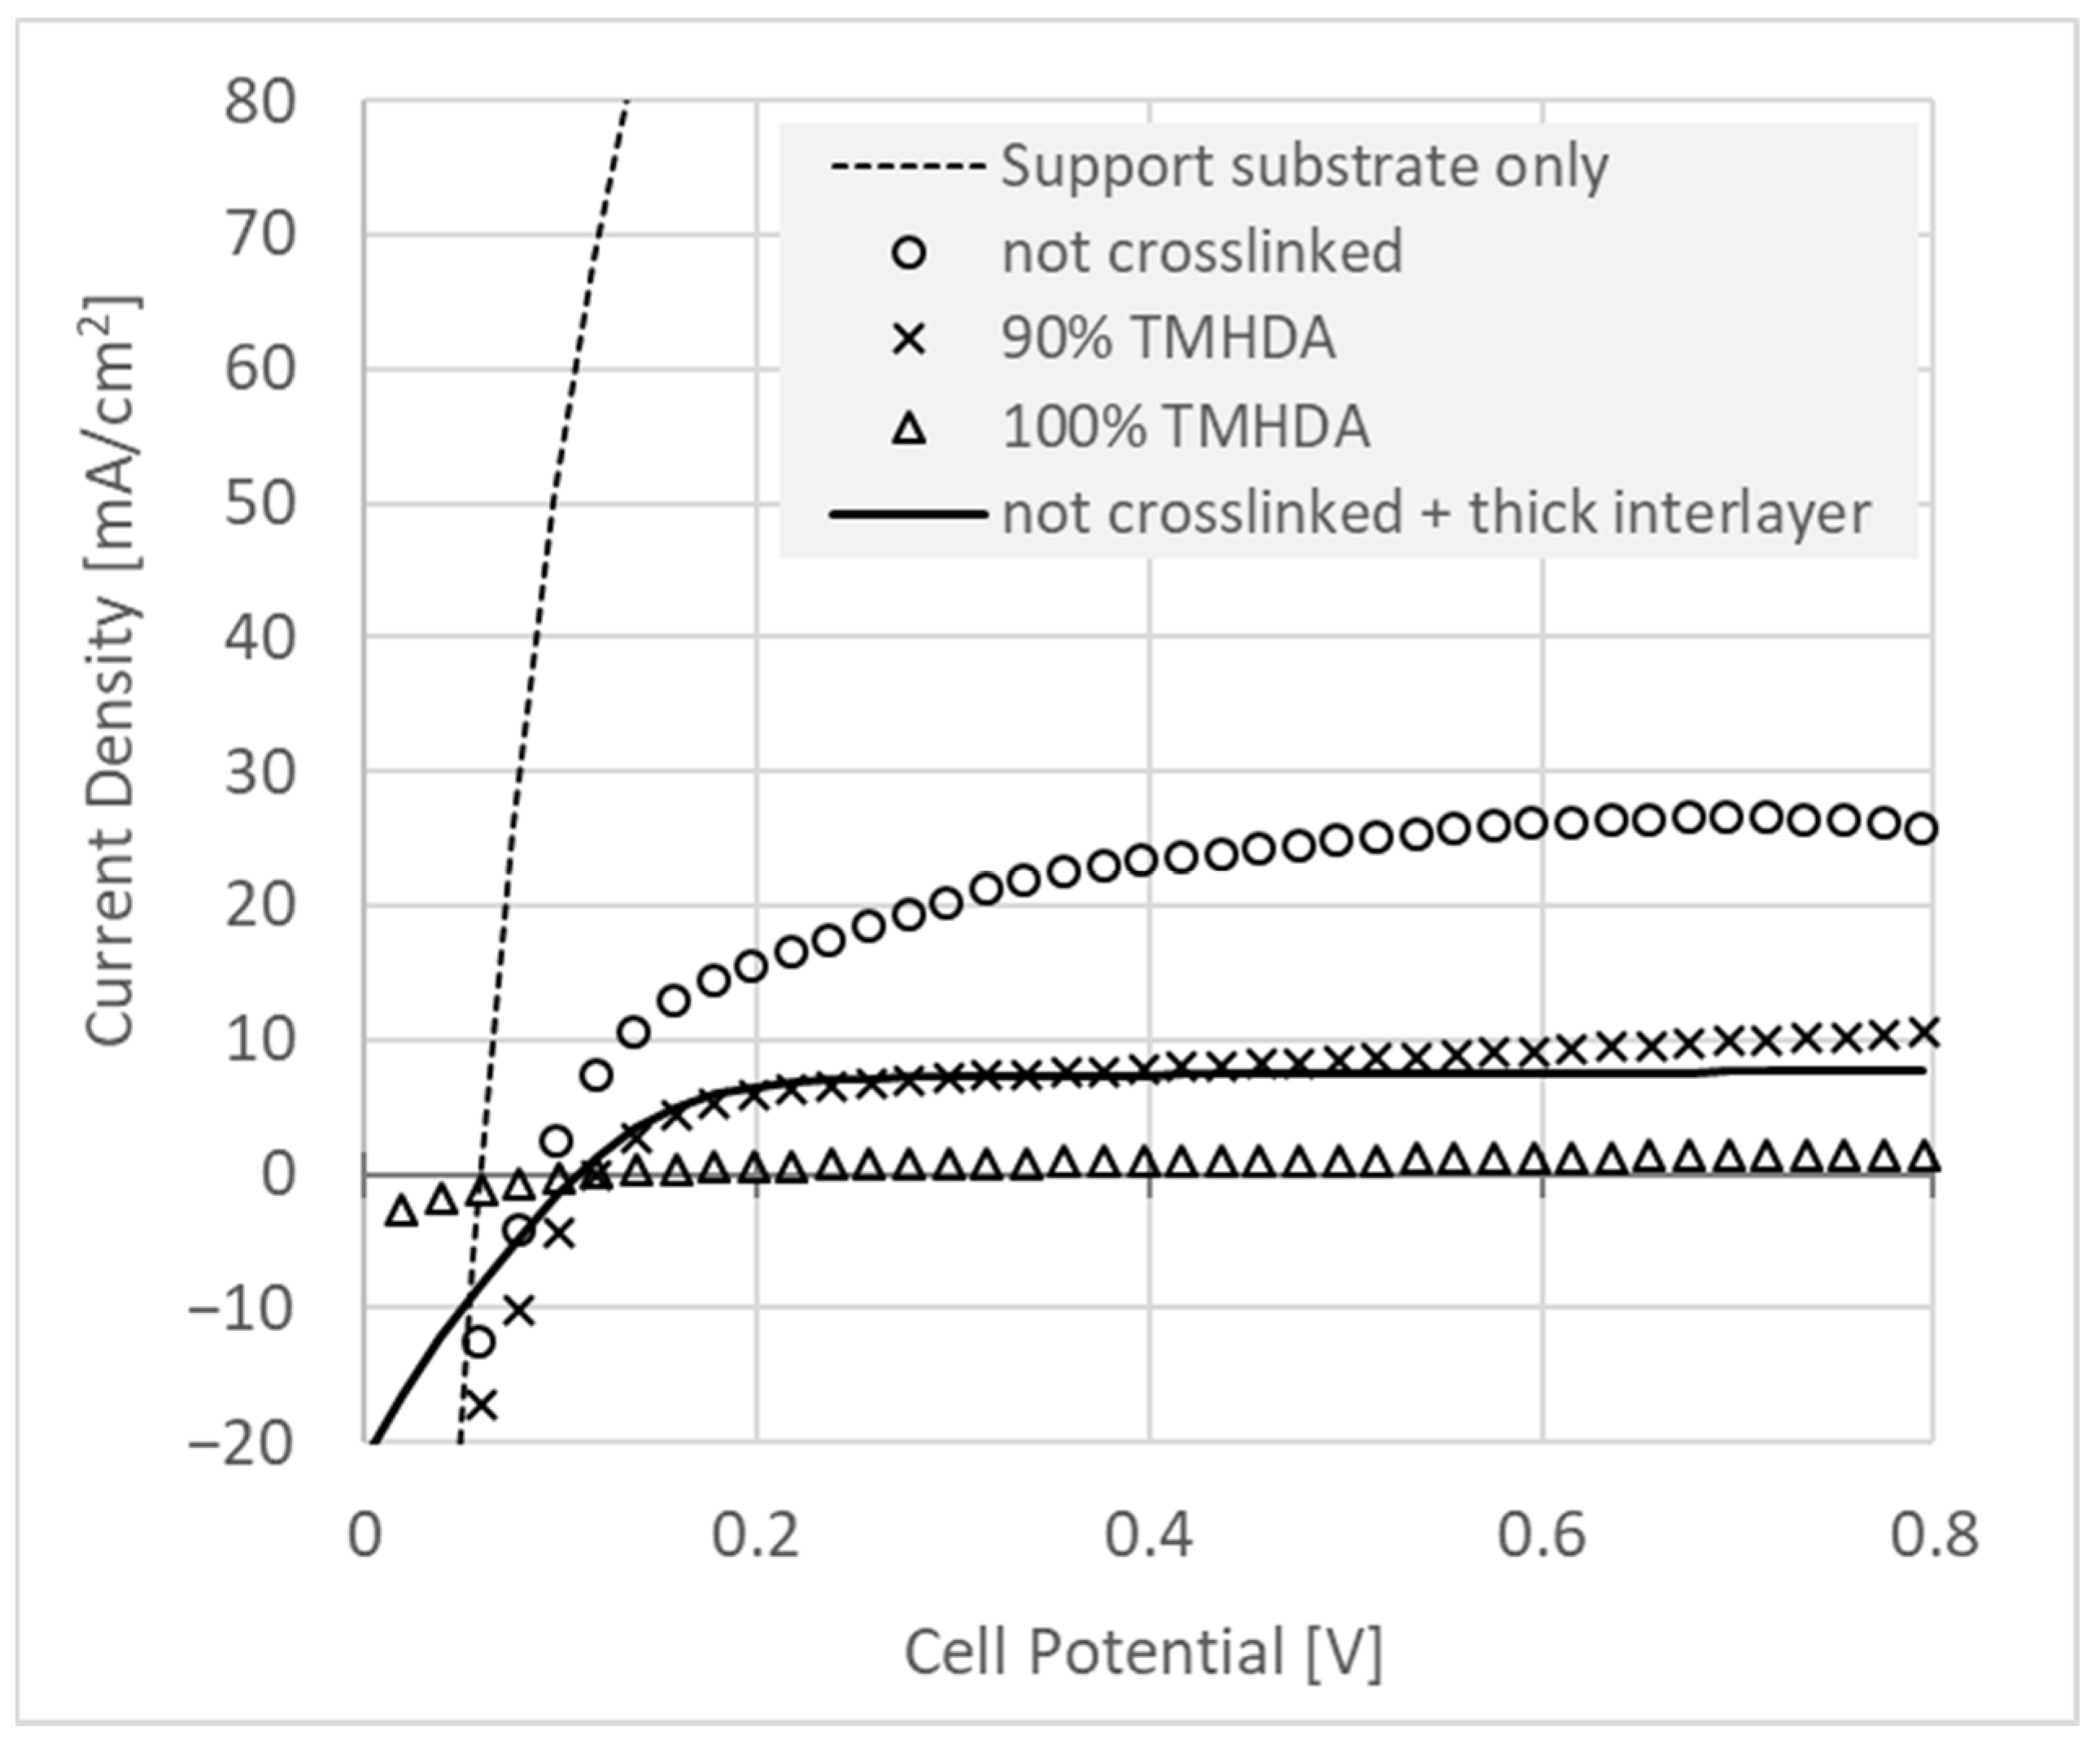
3.5. Hydrogen Crossover in GDE-Based MEA’s
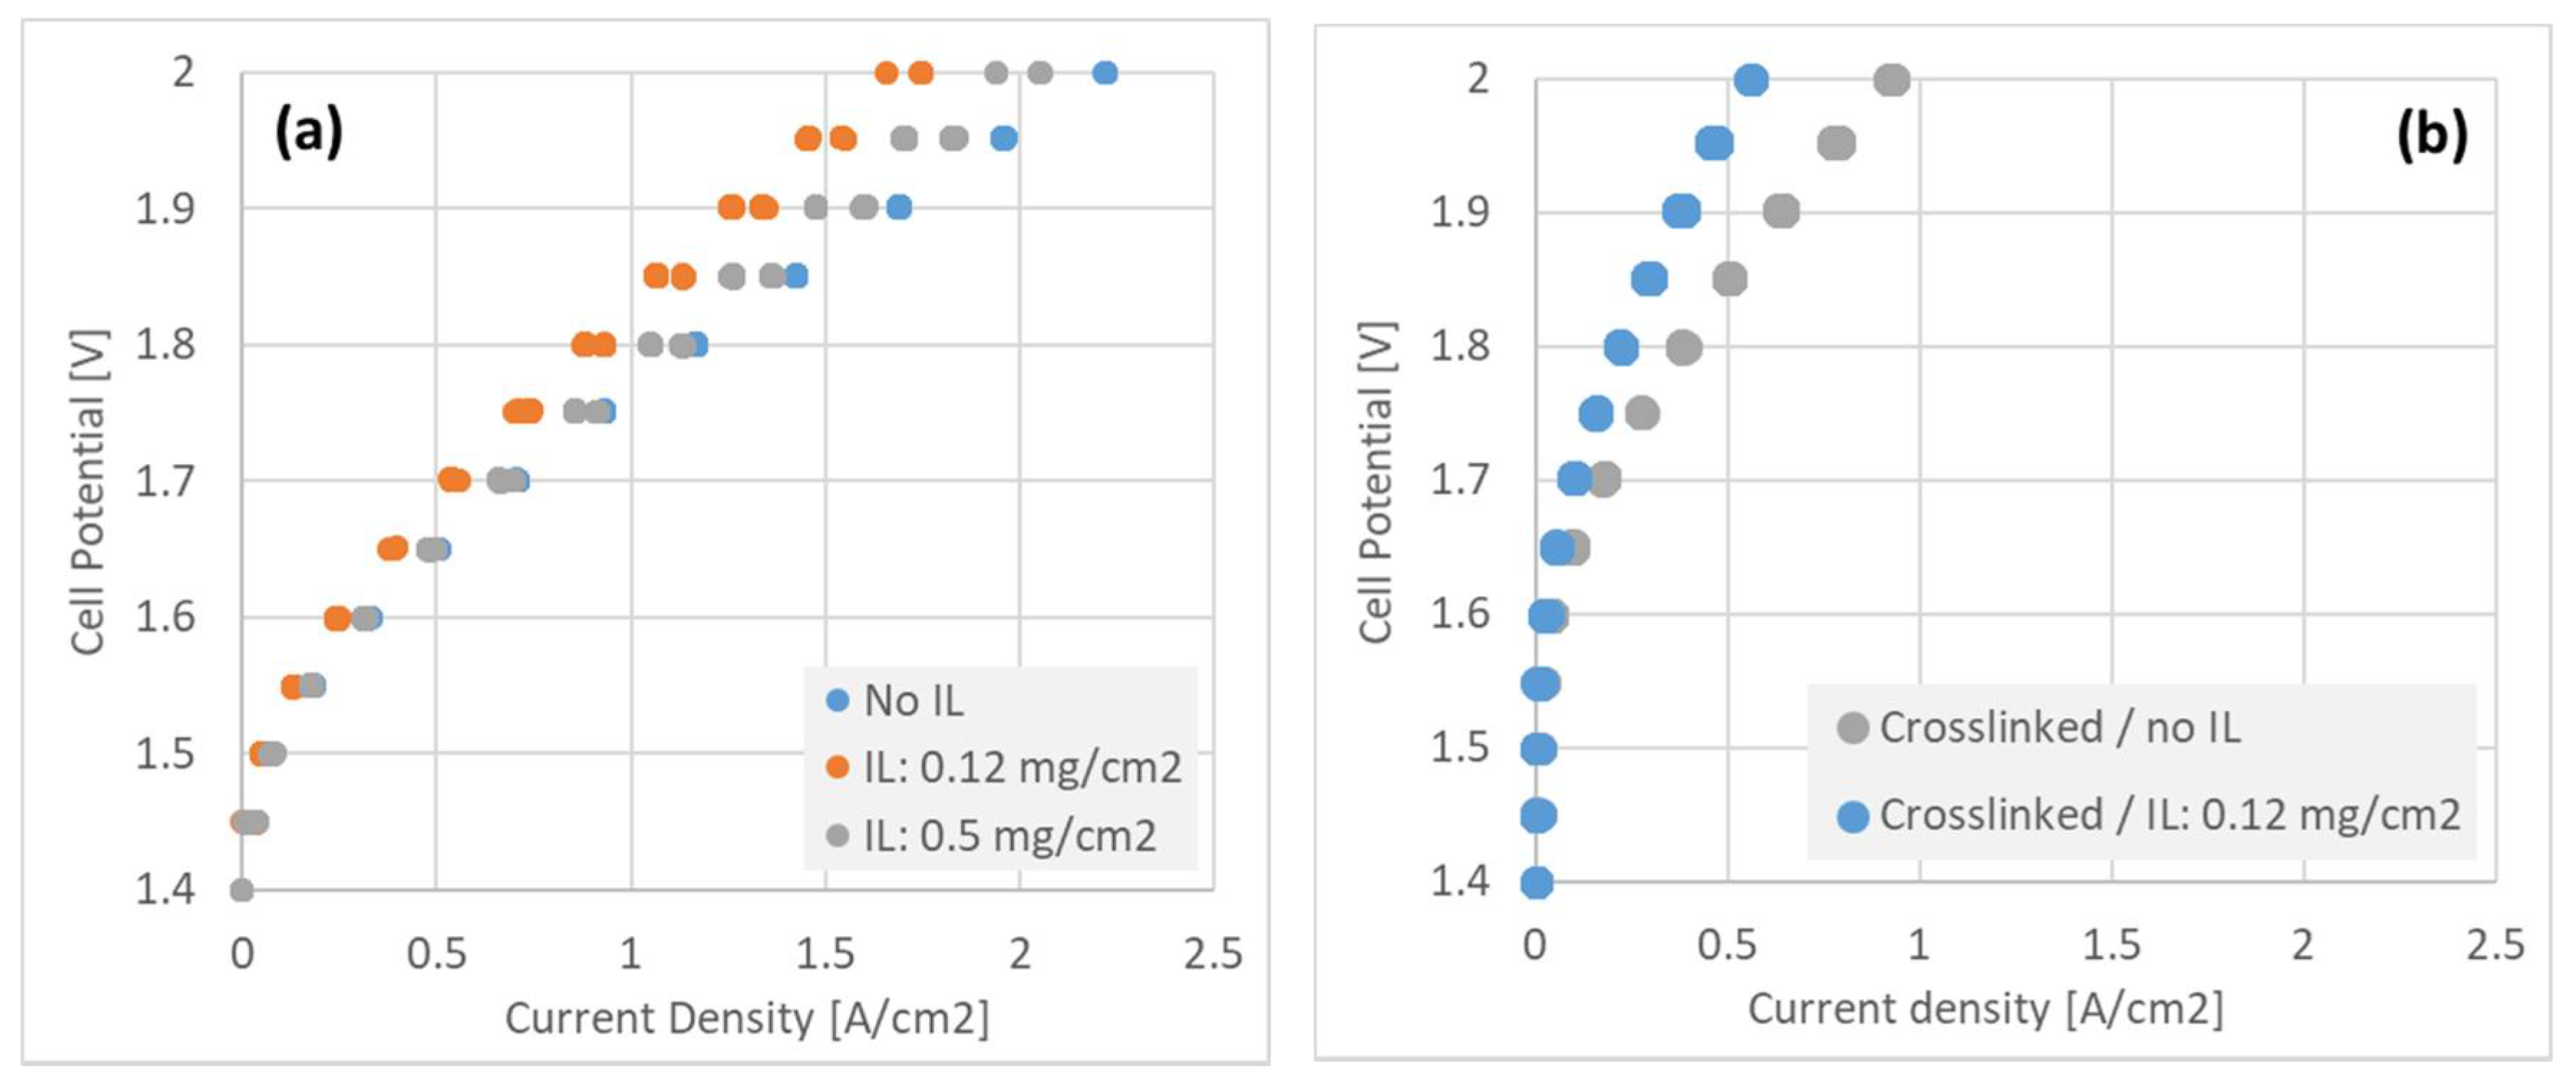
3.6. Performance of MEA’s in Electrolyzer Operation
4. Discussion
4.1. MEA Preparation Methods, Interfacial Resistance and Performance
4.2. Fuel Cell Performance versus MEA Fabrication Process
4.3. GDE + Interlayer—The Effect on Hydrogen Crossover and Performance of Electrolysis Cells
5. Conclusions
Supplementary Materials
Author Contributions
Funding
Institutional Review Board Statement
Informed Consent Statement
Data Availability Statement
Conflicts of Interest
Abbreviations
| AEM | Alkaline Exchange Membrane |
| AC | Alternating Current |
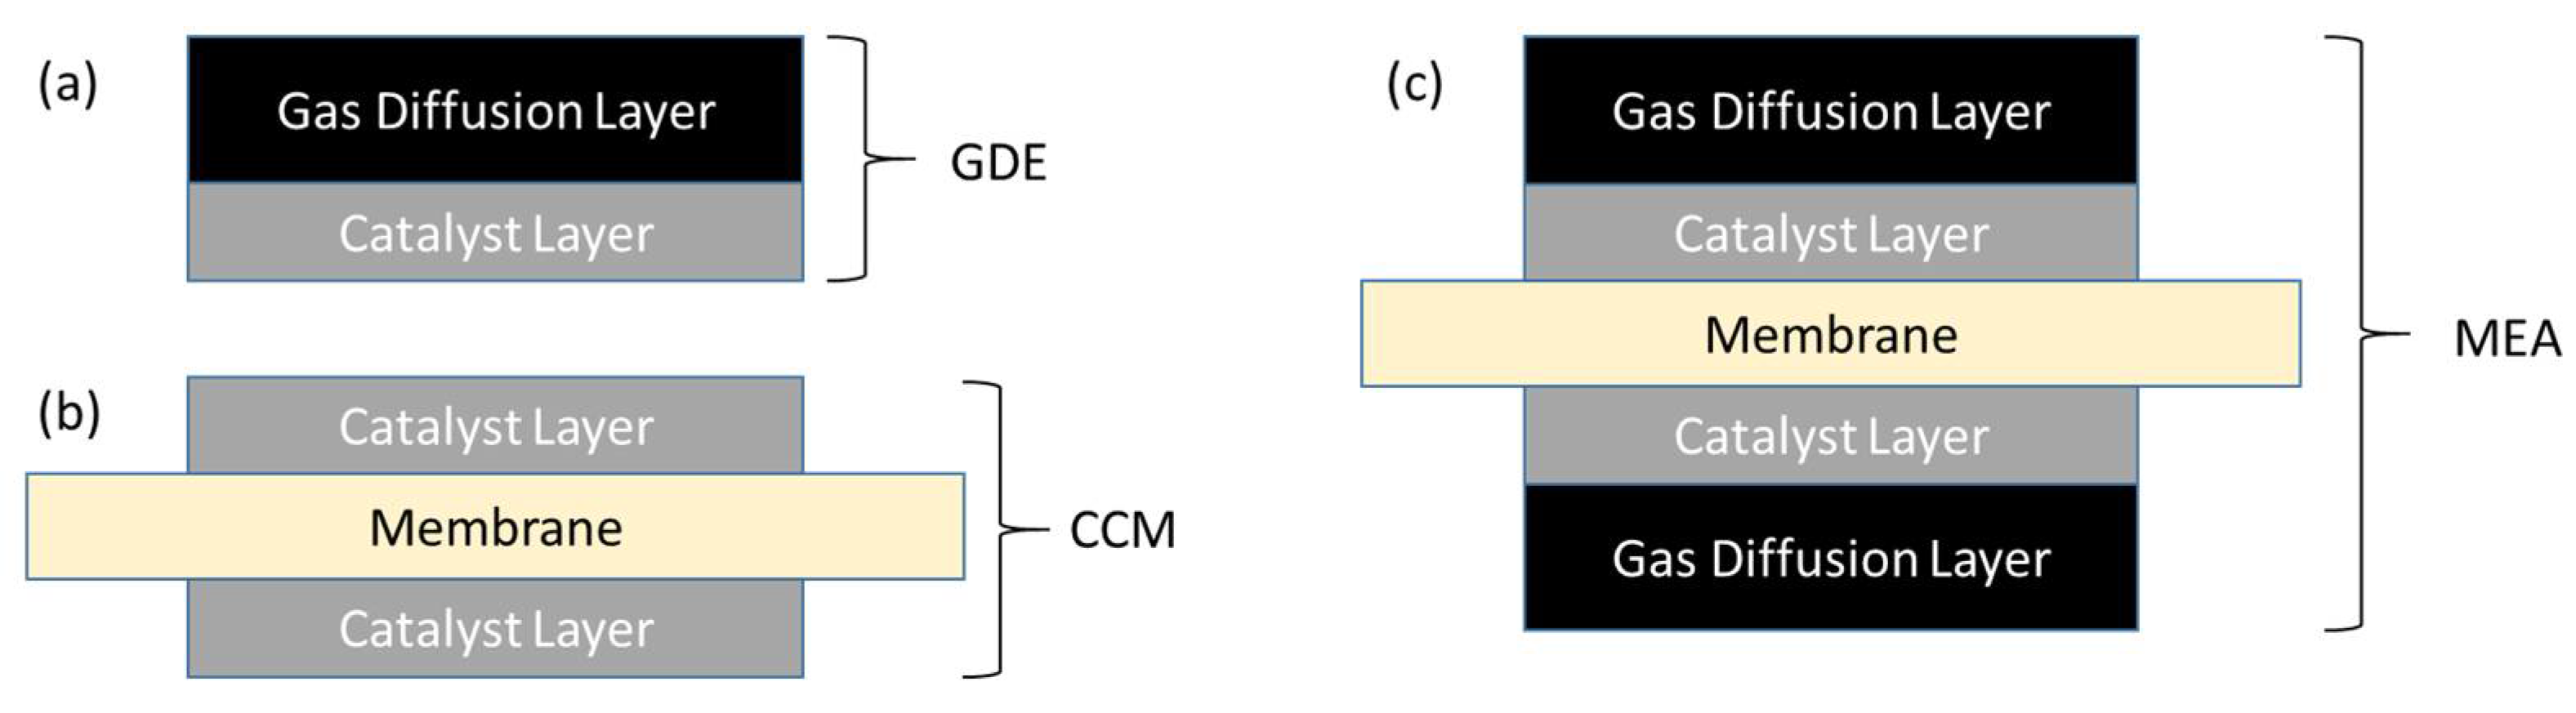
| CCM | Catalyst-Coated Membrane |
| CL | Catalyst Layer |
| DC | Direct Current |
| DCR | Resistance in Direct Current |
| DI | De-ionized [water] |
| DMD | Direct Membrane Deposition |
| GDE | Gas Diffusion Electrode |
| HFR | High-Frequency Resistance |
| IEC | Ion Exchange Capacity |
| IL | Interlayer |
| MEA | Membrane Electrode Assembly |
| PEM | Proton Exchange Membrane |
| Pt/C | Carbon-supported Platinum |
| TMA | Trimethylamine |
| TMHDA | N,N,N′,N′-tetramethyl-1,6-hexanediamine |
| X | Y | Assembly of pre-fabricated MEA sub-components X and Y, where ‘|’ represents the interface created at time of assembly |
References
- Mandal, M. Recent Advancement on Anion Exchange Membranes for Fuel Cell and Water Electrolysis. ChemElectroChem 2020, 7, 1–11. [Google Scholar] [CrossRef]
- Hassan, N.; Mandal, M.; Huang, G.; Firouzjaie, H.A.; Kohl, P.A.; Mustain, W.E. Achieving High-Performance and 2000 h Stability in Anion Exchange Membrane Fuel Cells by Manipulating Ionomer Properties and Electrode Optimization. Adv. Energy Mater. 2020, 10, 2001986. [Google Scholar] [CrossRef]
- Li, D.; Motz, A.R.; Bae, C.; Fujimoto, C.; Yang, G.; Zhang, F.-Y.; Ayers, K.E.; Kim, Y.S. Durability of anion exchange membrane water electrolyzers. Energy Environ. Sci. 2021, 14, 3393–3419. [Google Scholar] [CrossRef]
- Mustain, W.E.; Chatenet, M.; Page, M.; Kim, Y.S. Durability challenges of anion exchange membrane fuel cells. Energy Environ. Sci. 2020, 13, 2805–2838. [Google Scholar] [CrossRef]
- Moteallah, B.; Liu, Z.; Masel, R.I.; Sculley, J.P.; Ni, Z.R.; Meroueh, L. Next-generation anion exchange membrane water electrolyzers operating for commercially relevant lifetimes. Int. J. Hydrogen Energy 2020, 46, 3379–3386. [Google Scholar] [CrossRef]
- Varcoe, J.; Atanassov, P.; Dekel, D.R.; Herring, A.M.; Hickner, M.A.; Kohl, P.A.; Kucernak, A.; Mustain, W.E.; Nijmeijer, K.; Scott, K.; et al. Anion-exchange membranes in electrochemical energy systems. Energy Environ. Sci. 2014, 7, 3135–3191. [Google Scholar] [CrossRef] [Green Version]
- Gottesfeld, S.; Dekel, D.R.; Page, M.; Bae, C.; Yan, Y.; Zelenay, P.; Kim, Y.S. Anion exchange membrane fuel cells: Current status and remaining challenges. J. Power Sources 2018, 375, 170–184. [Google Scholar] [CrossRef]
- Lim, K.L.; Wong, C.Y.; Wong, W.Y.; Loh, K.S.; Selambakkannu, S.; Othman, N.A.F.; Yang, H. Radiation-Grafted Anion-Exchange Membrane for Fuel Cell and Electrolyzer Applications: A Mini Review. Membranes 2021, 11, 397. [Google Scholar] [CrossRef]
- Mohanty, A.D.; Tignor, A.E.; Krause, J.A.; Choe, Y.-K.; Bae, C. Systematic alkaline stability study of polymer backbones for anion exchange membrane applications. Macromolecules 2016, 49, 3361–3372. [Google Scholar] [CrossRef]
- Wang, J.; Zhao, Y.; Setzler, B.P.; Rojas-Carbonell, S.; Ben Yehuda, C.; Amel, A.; Page, M.; Wang, L.; Hu, K.; Shi, Y.; et al. Poly(aryl piperidinium) membranes and ionomers for hydroxide exchange membrane fuel cells. Nat. Energy 2019, 4, 392. [Google Scholar] [CrossRef]
- Wang, L.; Peng, X.; Mustain, W.E.; Varcoe, J.R. Radiation-grafted anion-exchange membranes: The switch from low- to high-density polyethylene leads to remarkably enhanced fuel cell performance. Energy Environ. Sci. 2019, 12, 1575–1579. [Google Scholar] [CrossRef] [Green Version]
- Fan, J.; Willdorf-Cohen, S.; Schibli, E.M.; Paula, Z.; Li, W.; Skalski, T.J.G.; Sergeenko, A.T.; Hohenadel, A.; Frisken, B.J.; Magliocca, E.; et al. Poly(bis-arylimidazoliums) possessing high hydroxide ion exchange capacity and high alkaline stability. Nat. Commun. 2019, 10, 2306. [Google Scholar] [CrossRef] [Green Version]
- Pan, J.; Zhu, L.; Han, J.; Hickner, M.A. Mechanically Tough and Chemically Stable Anion Exchange Membranes from Rigid-Flexible Semi-Interpenetrating Networks. Chem. Mater. 2015, 27, 6689–6698. [Google Scholar] [CrossRef]
- He, S.S.; Strickler, A.L.; Frank, C.W. A Semi-Interpenetrating Network Approach for Dimensionally Stabilizing Highly-Charged Anion Exchange Membranes for Alkaline Fuel Cells. ChemSusChem 2015, 8, 1472–1483. [Google Scholar] [CrossRef] [PubMed]
- Kim, S.H.; Lee, K.H.; Chu, J.Y.; Kim, A.R.; Yoo, D.J. Enhanced Hydroxide Conductivity and Dimensional Stability with Blended Membranes Containing Hyperbranched PAES/Linear PPO as Anion Exchange Membranes. Polymers 2020, 12, 3011. [Google Scholar] [CrossRef]
- Kim, D.-H.; Kang, M.-S. Pore-Filled Anion-Exchange Membranes with Double Cross-Linking Structure for Fuel Cells and Redox Flow Batteries. Energies 2020, 13, 4761. [Google Scholar] [CrossRef]
- Swaby, S.; Urena, N.; Perez-Prior, M.T.; Varez, A.; Levenfeld, B. Synthesis and Characterization of Novel Anion Exchange Membranes Based on Semi-Interpenetrating Networks of Functionalized Polysulfone: Effect of Ionic Crosslinking. Polymers 2021, 13, 958. [Google Scholar] [CrossRef]
- Lu, W.; Shao, Z.-G.; Zhang, G.; Zhao, Y.; Yi, B. Crosslinked poly(vinylbenzyl chloride) with a macromolecular crosslinker for anion exchange membrane fuel cells. J. Power Sources 2014, 248, 905–914. [Google Scholar] [CrossRef]
- Qiao, J.; Fu, J.; Liu, Y.; Sheng, J. Highly stable hydroxyl anion conducting membranes poly(vinyl alcohol)/poly(acrylamide-co-diallyldimethylammonium chloride) (PVA/PAADDA) for alkaline fuel cells: Effect of cross-linking. Int. J. Hydrogen Energy 2012, 37, 4580–4589. [Google Scholar] [CrossRef]
- Dekel, D.R.; Rasin, I.G.; Brandon, S. Predicting performance stability of anion exchange membrane fuel cells. J. Power Sources 2019, 420, 118–123. [Google Scholar] [CrossRef]
- An, L.; Zhao, T.S.; Chai, Z.H.; Tan, P.; Zeng, L. Mathematical modeling of an anion-exchange membrane water electrolyzer for hydrogen production. Int. J. Hydrogen Energy 2014, 39, 19869–19876. [Google Scholar] [CrossRef]
- Fortin, P.; Khoza, T.; Cao, X.; Martinsen, S.Y.; Barnett, A.O.; Holdcroft, S. High-performance alkaline water electrolysis using Aemion™ anion exchange membranes. J. Power Sources 2020, 451, 227814. [Google Scholar] [CrossRef]
- Henkensmeier, D.; Najibah, M.; Harms, C.; Zitka, J.; Hnat, J.; Bouzek, K. Overview: State of the art commercial membranes for anion exchange membrane water electrolysis. J. Electrochem. Energy Convers. Storage 2020, 18, 024001. [Google Scholar] [CrossRef]
- Firouzjaie, H.A.; Mustain, W.E. Catalytic Advantages, Challenges, and Priorities in Alkaline Membrane Fuel Cells. ACS Catal. 2020, 10, 225–234. [Google Scholar] [CrossRef] [Green Version]
- Omasta, T.J.; Park, A.M.; LaManna, J.M.; Zhang, Y.; Peng, X.; Wang, L.; Jacobson, D.L.; Varcoe, J.R.; Hussey, D.S.; Pivovar, B.S.; et al. Beyond catalysis and membranes: Visualizing and solving the challenge of electrode water accumulation and flooding in AEMFCs. Energy Environ. Sci. 2018, 11, 551. [Google Scholar] [CrossRef] [Green Version]
- Truong, V.M.; Duong, N.B.; Yang, H. Effect of Gas Diffusion Layer Thickness on the Performance of Anion Exchange Membrane Fuel Cells. Processes 2021, 9, 718. [Google Scholar] [CrossRef]
- Kim, A.; Khandelwal, M.; Chacko, C.; Mench, M.M. Investigation of the Impact of Interfacial Delamination on Polymer Electrolyte Fuel Cell Performance. J. Electrochem. Soc. 2009, 156, B99–B108. [Google Scholar] [CrossRef]
- Zhang, W.; Pintauro, P. High-performance nanofiber fuel cell electrodes. ChemSusChem 2011, 4, 1753–1757. [Google Scholar] [CrossRef] [PubMed]
- Klingele, M.; Breitwieser, M.; Zengerle, R.; Thiele, S. Direct deposition of proton exchange membranes enabling high performance hydrogen fuel cells. J. Mater. Chem. A 2015, 3, 11239. [Google Scholar] [CrossRef] [Green Version]
- Veh, P.; Britton, B.; Holdcroft, S.; Zengerle, R.; Vierrath, S.; Breitwieser, M. Improving the water management in anion-exchange membrane fuel cells via ultra-thin, directly deposited solid polymer electrolyte. RSC Adv. 2020, 10, 8645. [Google Scholar] [CrossRef] [Green Version]
- Vierrath, S.; Breitwiese, M.; Klingele, M.; Britton, B.; Holdcroft, S.; Zengerle, R.; Thiele, S. The reasons for the high power density of fuel cells fabricated with directly deposited membranes. J. Power Sources 2016, 326, 170. [Google Scholar] [CrossRef]
- Dekel, D.R.; Page, M. Chemical Bonding for Catalyst/Membrane Surface Adherence in Membrane Electrolyte Fuel Cells. U.S. Patent 10,096,838, 9 September 2013. [Google Scholar]
- Dekel, D.; Gottesfeld, S. Preparation of Advanced CCMs for AMFCs by Amination and Cross-Linking of the Precursor Form of the Ionomer. U.S. Patent 10,096,839, 9 September 2014. [Google Scholar]
- Cooper, K.R. In Situ PEMFC Fuel Crossover & Electrical Short Circuit Measurement. Available online: https://www.scribner.com/files/tech-papers/Scribner-on-Crossover-Fuel-Cell-Magazine-2008.pdf (accessed on 1 July 2021).
- Breitwieser, M.; Klingele, M. Tailoring the Membrane-Electrode Interface in PEM Fuel Cells: A Review and Perspective on Novel Engineering Approaches. Adv. Energy Mater. 2017, 8, 1701257. [Google Scholar] [CrossRef]
- Omasta, T.J.; Wang, L. Importance of balancing membrane and electrode water in anion exchange membrane fuel cells. J. Power Sources 2017, 375, 205–213. [Google Scholar] [CrossRef] [Green Version]
- Ziv, N.; Dekel, D.R. A practical method for measuring the true hydroxide conductivity of anion exchange membranes. Electrochem. Commun. 2018, 88, 109–113. [Google Scholar] [CrossRef]
- Pivovar, B.; Kim, Y.S.; Peterson, D.; Papageorgopoulos, D.; Hickner, M.A.; Spendelow, J.S.; Weber, A. Alkaline Membrane Fuel Cell Workshop Report; United States Department of Energy. 2016. Available online: https://www.energy.gov/sites/default/files/2016/10/f33/fcto_2016_amfcw_report (accessed on 1 July 2021).
- Hwang, J.-H.; Kirkpatrick, K.S.; Mason, T.O.; Garboczi, E.J. Experimental limitations in impedance spectroscopy: Part IV. Electrode contact effects. Solid State Ionics 1997, 98, 93–104. [Google Scholar] [CrossRef]
- Marino, M.G.; Melchior, J.P.; Wohlfarth, A.; Kreuer, K.D. Hydroxide, halide and water transport in a model anion exchange membrane. J. Membr. Sci. 2014, 464, 61–71. [Google Scholar] [CrossRef]
- Broka, K.; Ekdunge, P. Oxygen and hydrogen permeation properties and water uptake of Nafion® 117 membrane and recast film for PEM fuel cell. J. Appl. Electrochem. 1997, 27, 117–123. [Google Scholar] [CrossRef]
- Sakai, T.; Takenaka, H.; Torikai, E. Gas diffusion in the dried and hydrated Nafions. J. Electrochem. Soc. 1986, 133, 88–92. [Google Scholar] [CrossRef]


| MEA | HFR | ~DCR | ~(RS − RS,CCM) | ~(R1 − R1,CCM) | |
|---|---|---|---|---|---|
| CCM | 42 | 140 | 0 | 0 | (mΩ·cm2) |
| GDE | 310 | 630 | 270 | 230 | |
| GDE + IL | 50 | 200 | 8 | 60 |
| MEA (GDL+IL) | H2 Crossover at ΔP = 2 bar (mA/cm2) | EL Current Density at 1.8 V (A/cm2) |
|---|---|---|
| IL 0.12 mg/cm2; Non-XL | 26.6 | 0.88 |
| IL 0.12 mg/cm2; 90% TMHDA | 10.5 | 0.22 |
| IL 0.12 mg/cm2; 100% TMHDA | -- | -- |
| IL 0.5 mg/cm2; Non-XL | 7.7 | 1.05 |
| IL 0.5 mg/cm2; 90% TMHDA | -- | 0.034 |
Publisher’s Note: MDPI stays neutral with regard to jurisdictional claims in published maps and institutional affiliations. |
© 2021 by the authors. Licensee MDPI, Basel, Switzerland. This article is an open access article distributed under the terms and conditions of the Creative Commons Attribution (CC BY) license (https://creativecommons.org/licenses/by/4.0/).
Share and Cite
Ashdot, A.; Kattan, M.; Kitayev, A.; Tal-Gutelmacher, E.; Amel, A.; Page, M. Design Strategies for Alkaline Exchange Membrane–Electrode Assemblies: Optimization for Fuel Cells and Electrolyzers. Membranes 2021, 11, 686. https://0-doi-org.brum.beds.ac.uk/10.3390/membranes11090686
Ashdot A, Kattan M, Kitayev A, Tal-Gutelmacher E, Amel A, Page M. Design Strategies for Alkaline Exchange Membrane–Electrode Assemblies: Optimization for Fuel Cells and Electrolyzers. Membranes. 2021; 11(9):686. https://0-doi-org.brum.beds.ac.uk/10.3390/membranes11090686
Chicago/Turabian StyleAshdot, Aviv, Mordechai Kattan, Anna Kitayev, Ervin Tal-Gutelmacher, Alina Amel, and Miles Page. 2021. "Design Strategies for Alkaline Exchange Membrane–Electrode Assemblies: Optimization for Fuel Cells and Electrolyzers" Membranes 11, no. 9: 686. https://0-doi-org.brum.beds.ac.uk/10.3390/membranes11090686