Figure 1.
Schematic overview of the development process of medical devices.
Figure 1.
Schematic overview of the development process of medical devices.
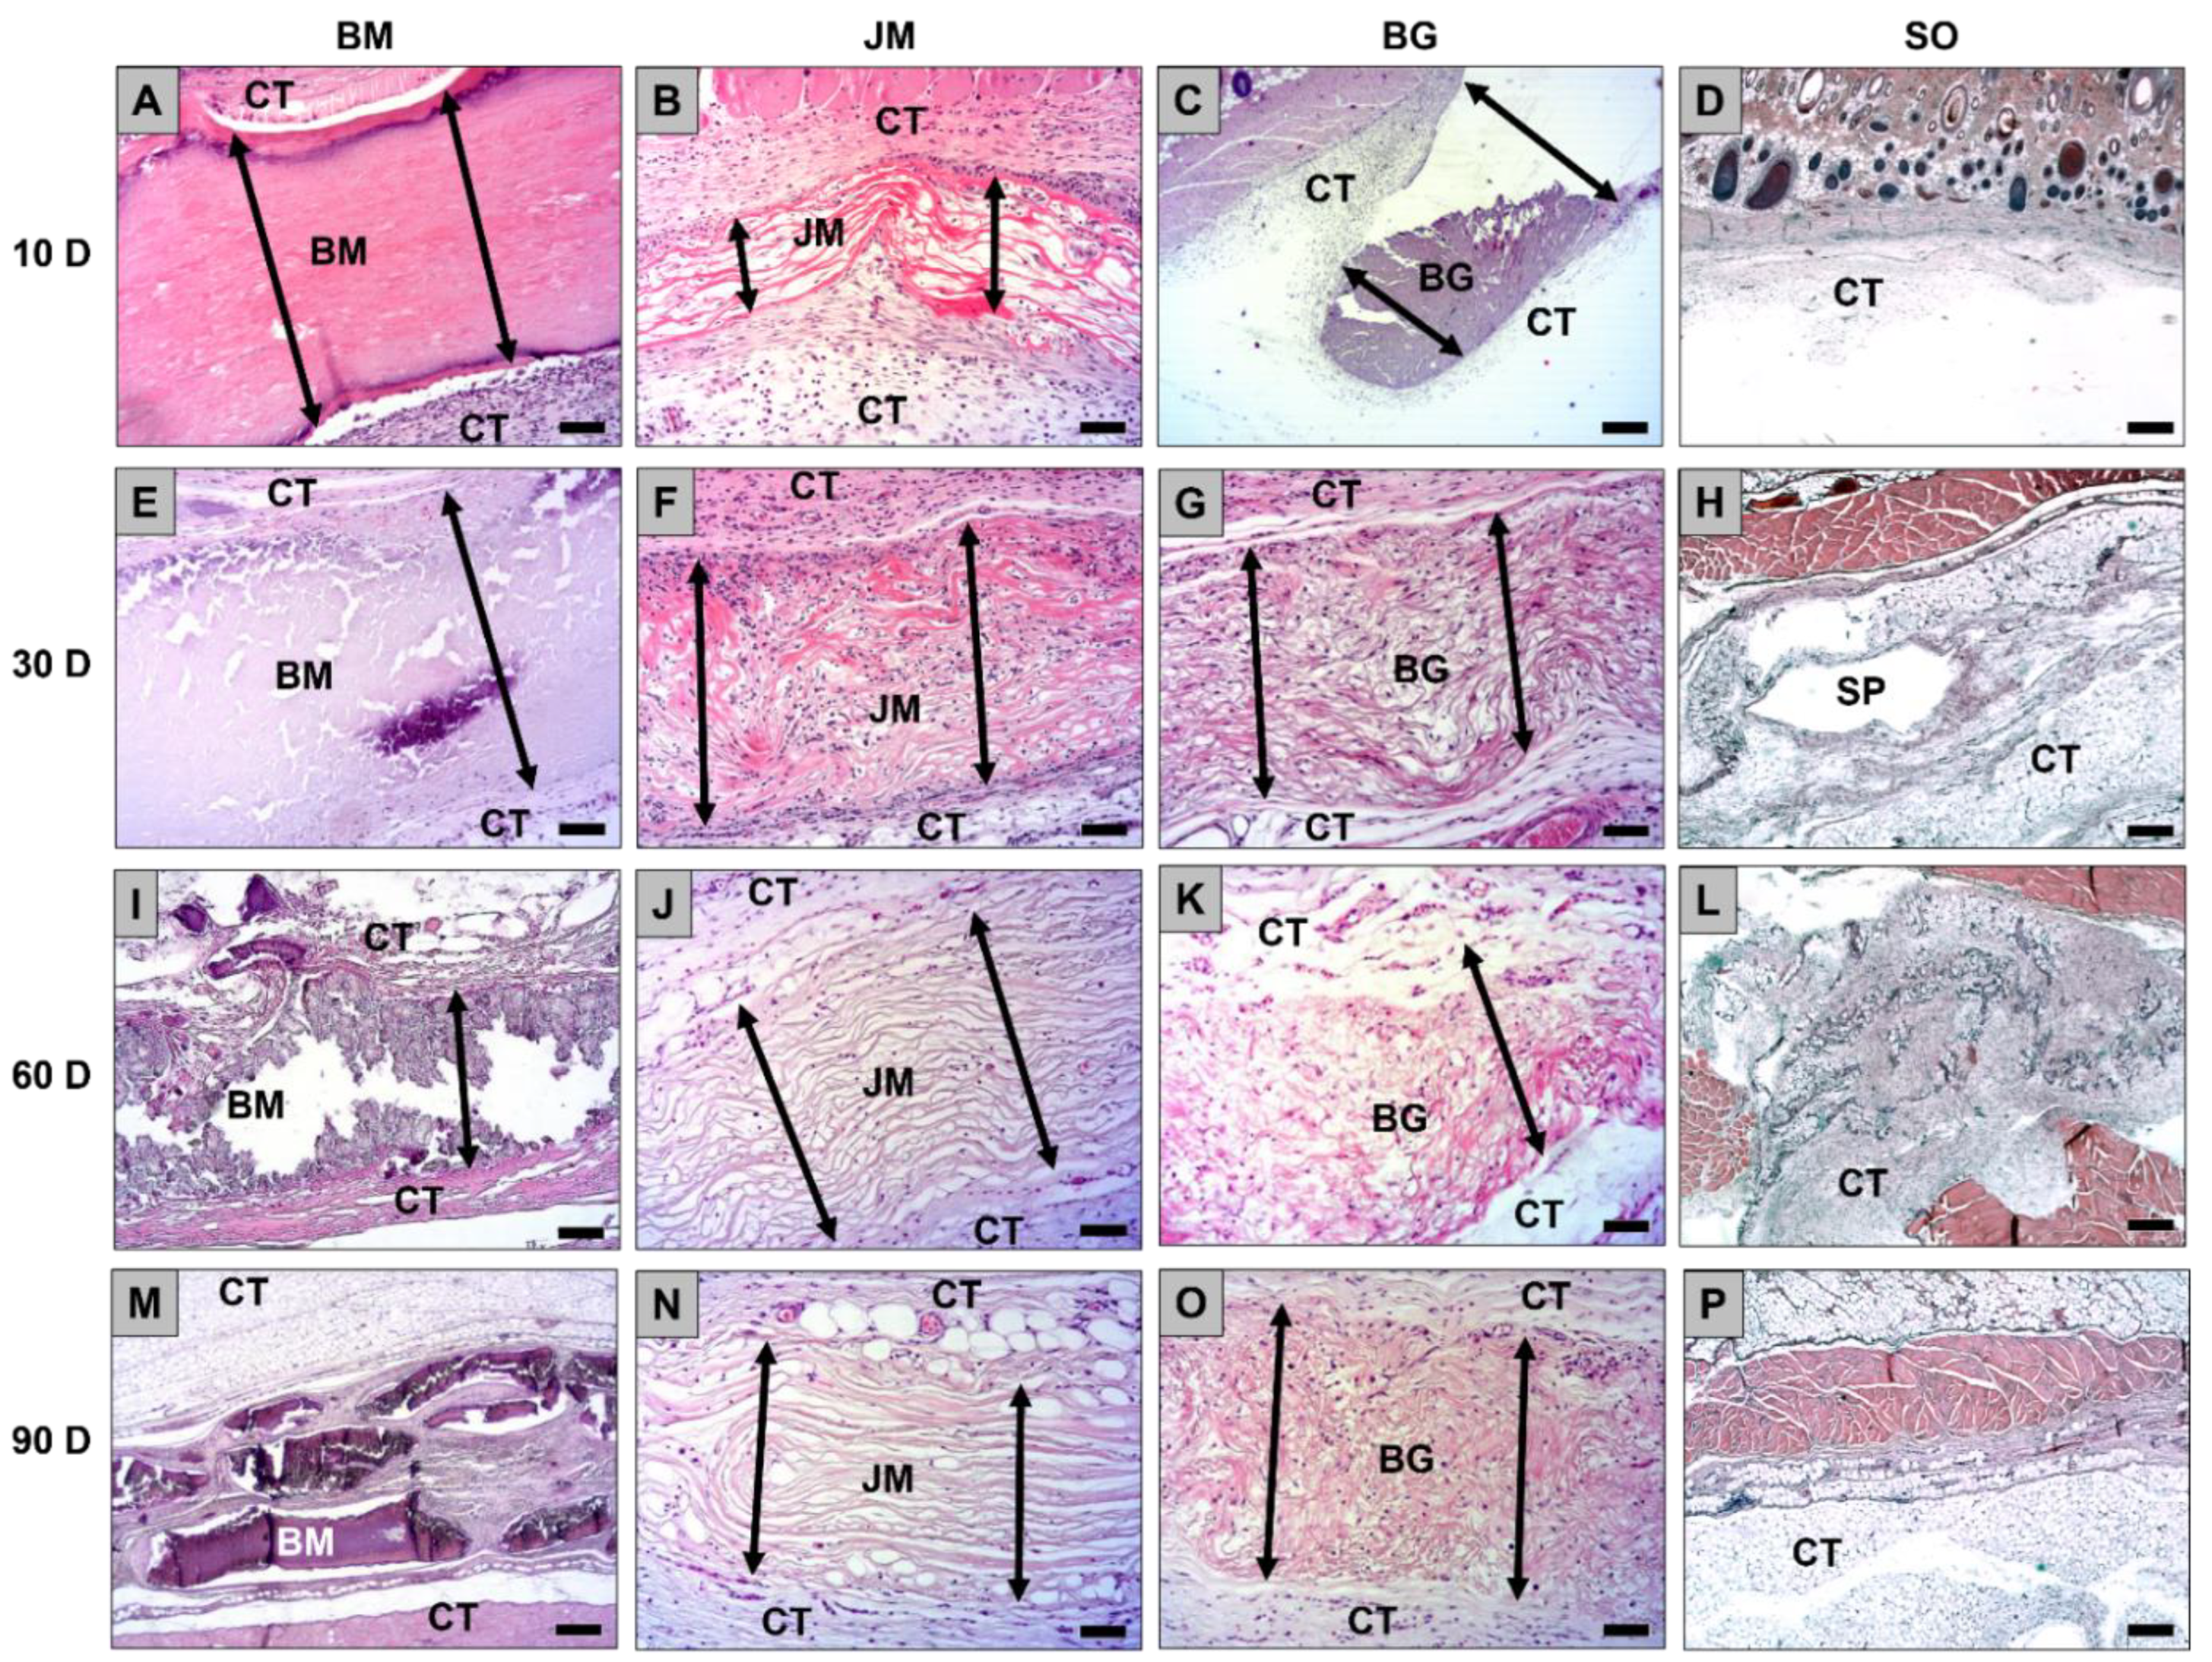
Figure 2.
Exemplary histological images of the three membranes (A–C,E–G,I–K,M–O, double arrows) and the sham operation (D,H,L,P) within the subcutaneous connective tissue (CT) at day 10, 30, 60, and 90 post implantationem. SP = subcutaneous pocket of the sham operation. BM = bovine membrane, JM = Jason® membrane, BG = Bio-Gide® membrane, SO = sham operation (H&E-stainings, 40× magnifications, scalebars = 100 µm).
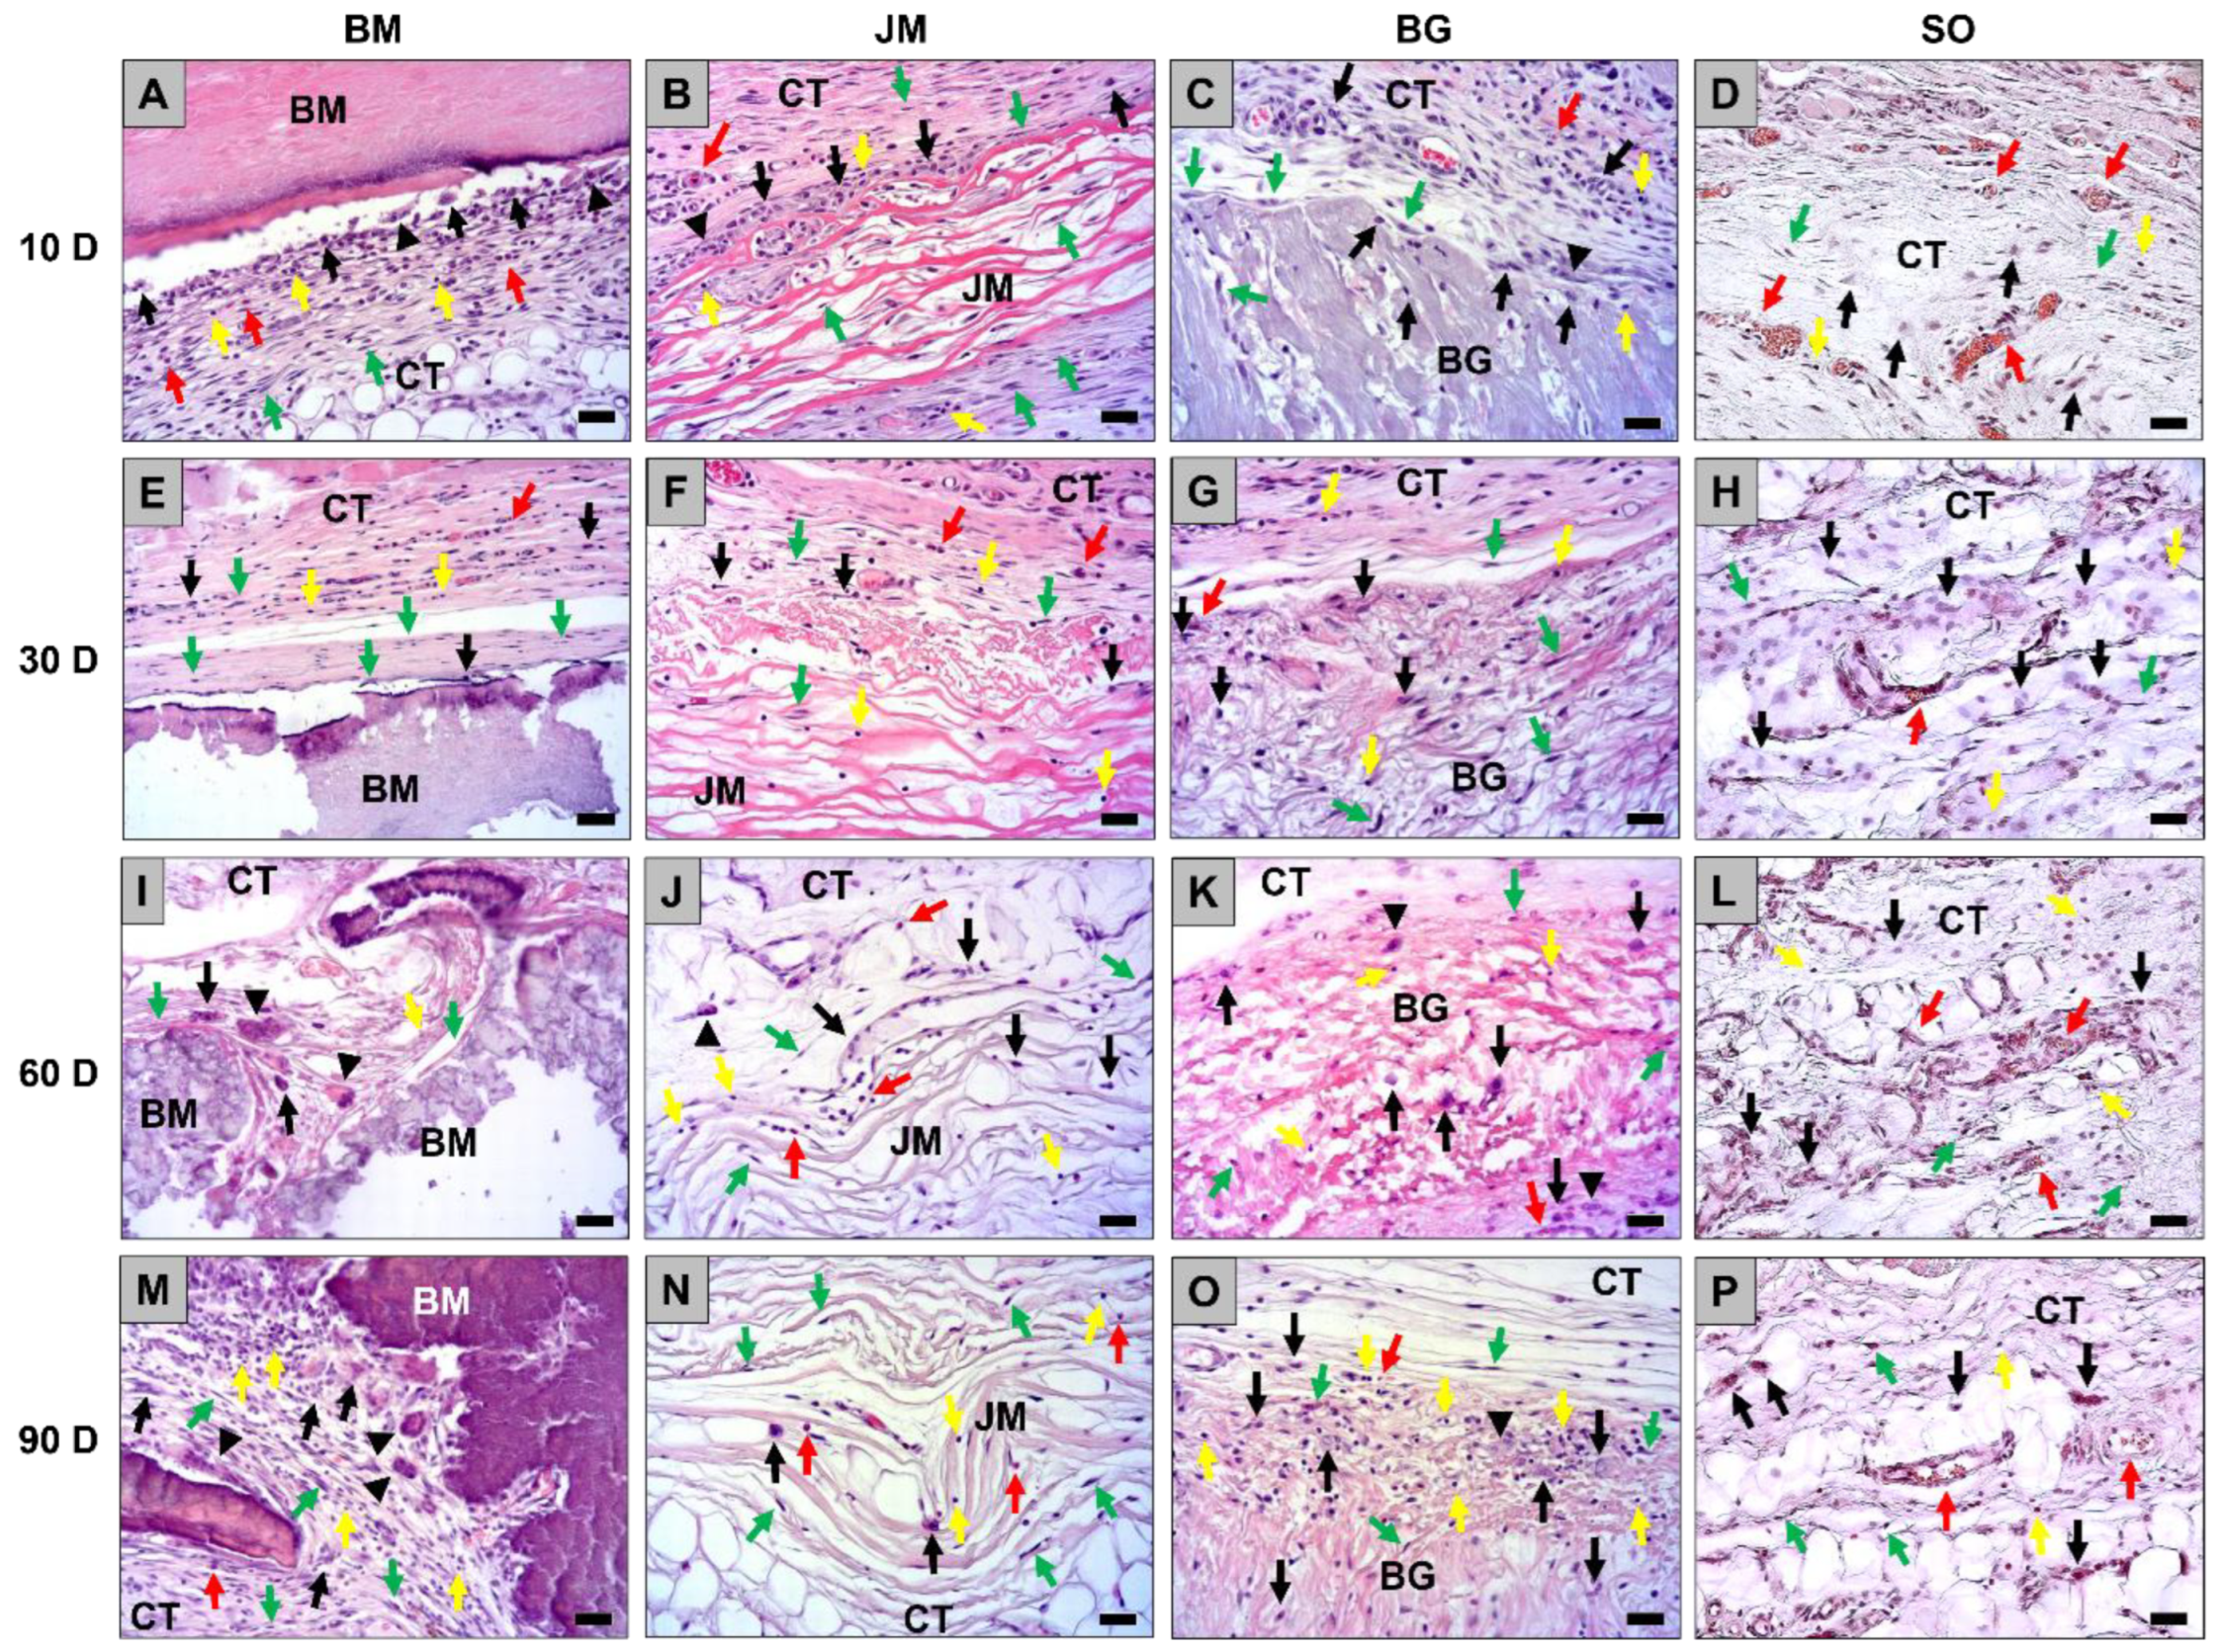
Figure 3.
Exemplary histological images of the tissue responses to the three membranes (A–C,E–G,I–K,M–O) and the sham operation (D,H,L,P) within the subcutaneous connective tissue (CT) at day 10, 30, 60, and 90 post implantationem. Black arrows = macrophages, black arrowheads = multinucleated giant cells, green arrows = fibroblasts, red arrows = eosinophilic granulocytes, yellow arrows = lymphocytes. BM = bovine membrane, JM = Jason® membrane, BG = Bio-Gide® membrane, SO = sham operation (H&E-stainings, 200× magnifications, scalebars = 20 µm).
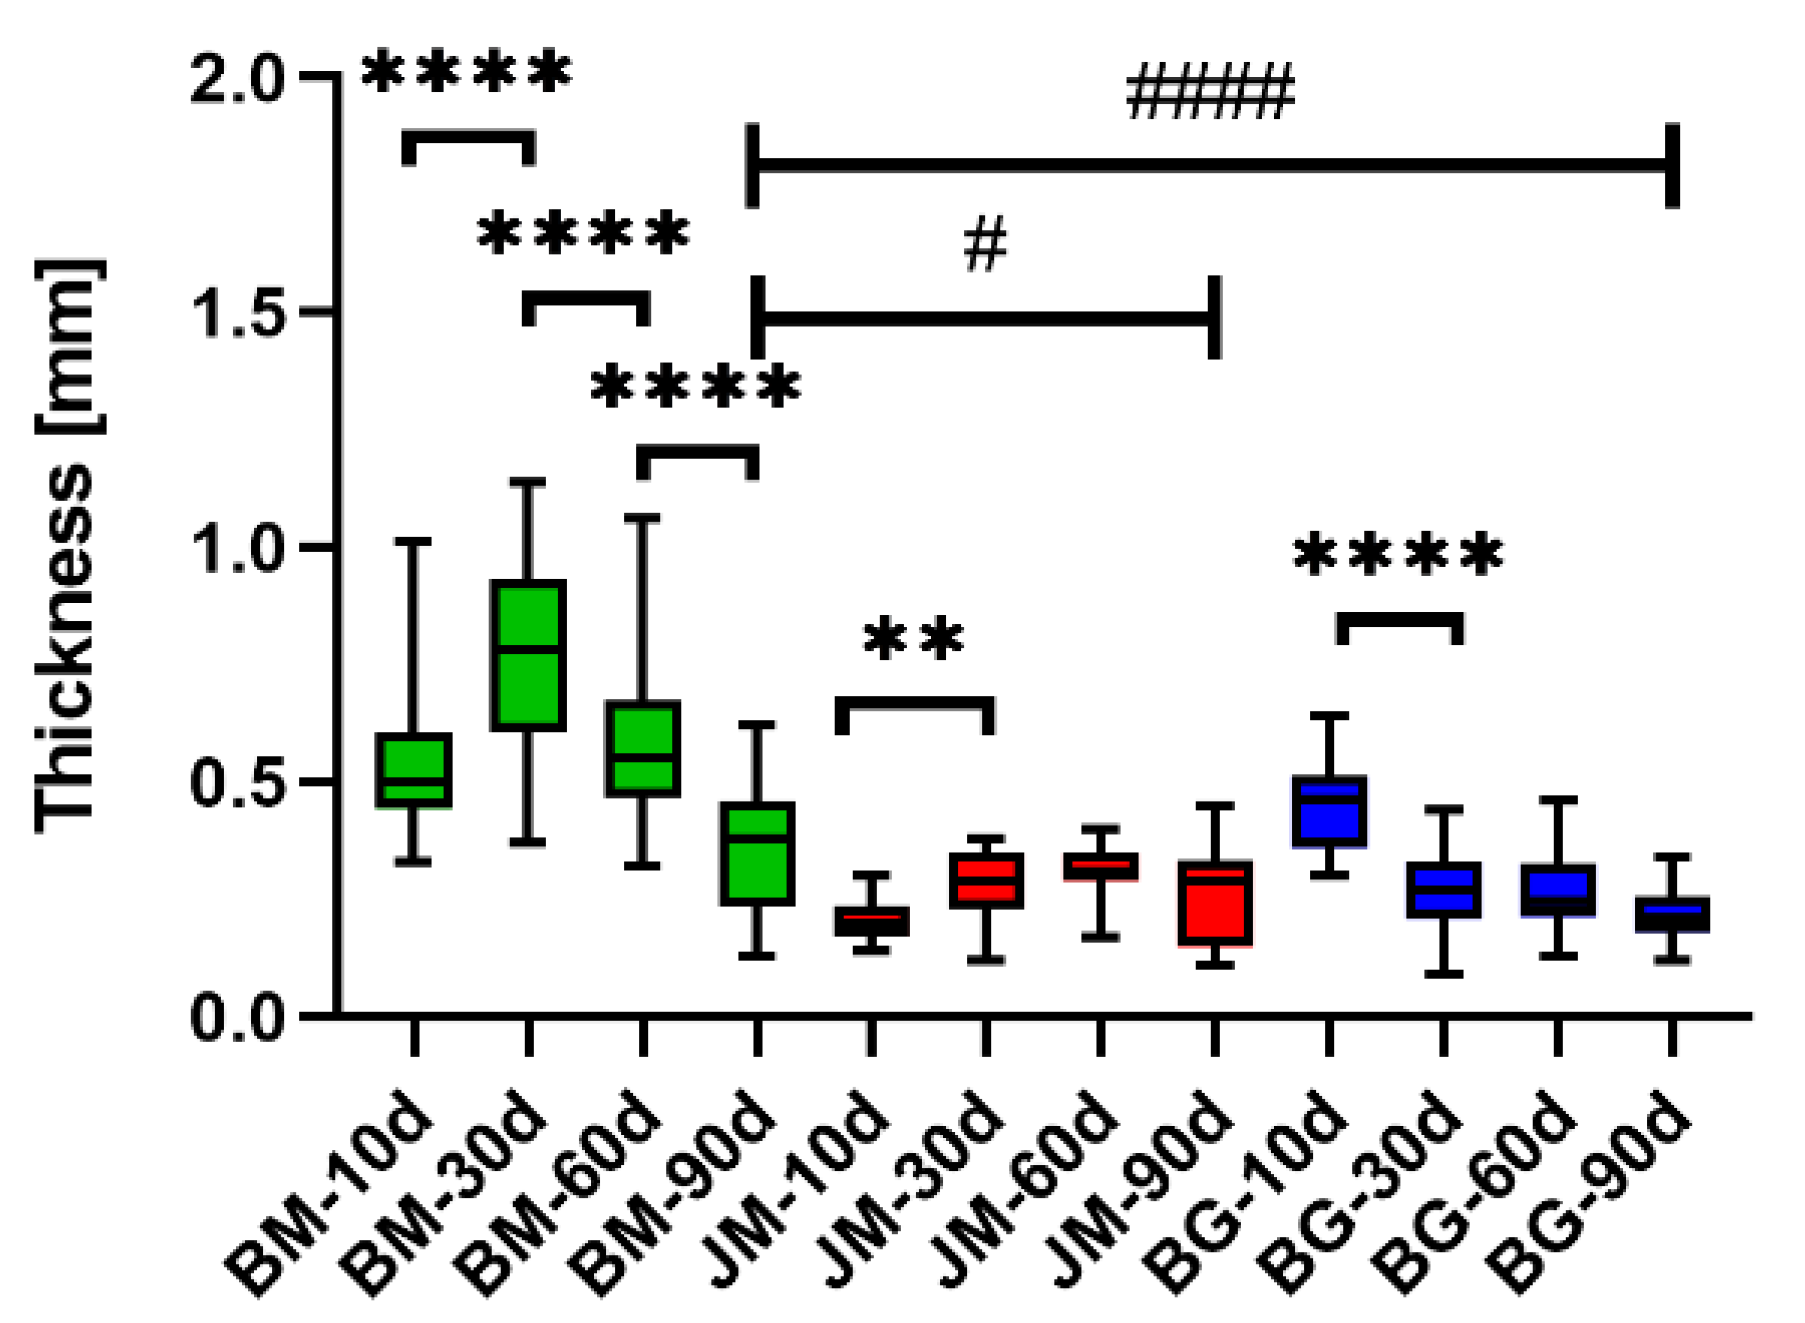
Figure 4.
Results of the histomorphometrical measurements of the membrane thickness (* = intraindividual differences, # = interindividual differences; # p < 0.05, ** p < 0.01 and ****/#### p < 0.0001).
Figure 4.
Results of the histomorphometrical measurements of the membrane thickness (* = intraindividual differences, # = interindividual differences; # p < 0.05, ** p < 0.01 and ****/#### p < 0.0001).
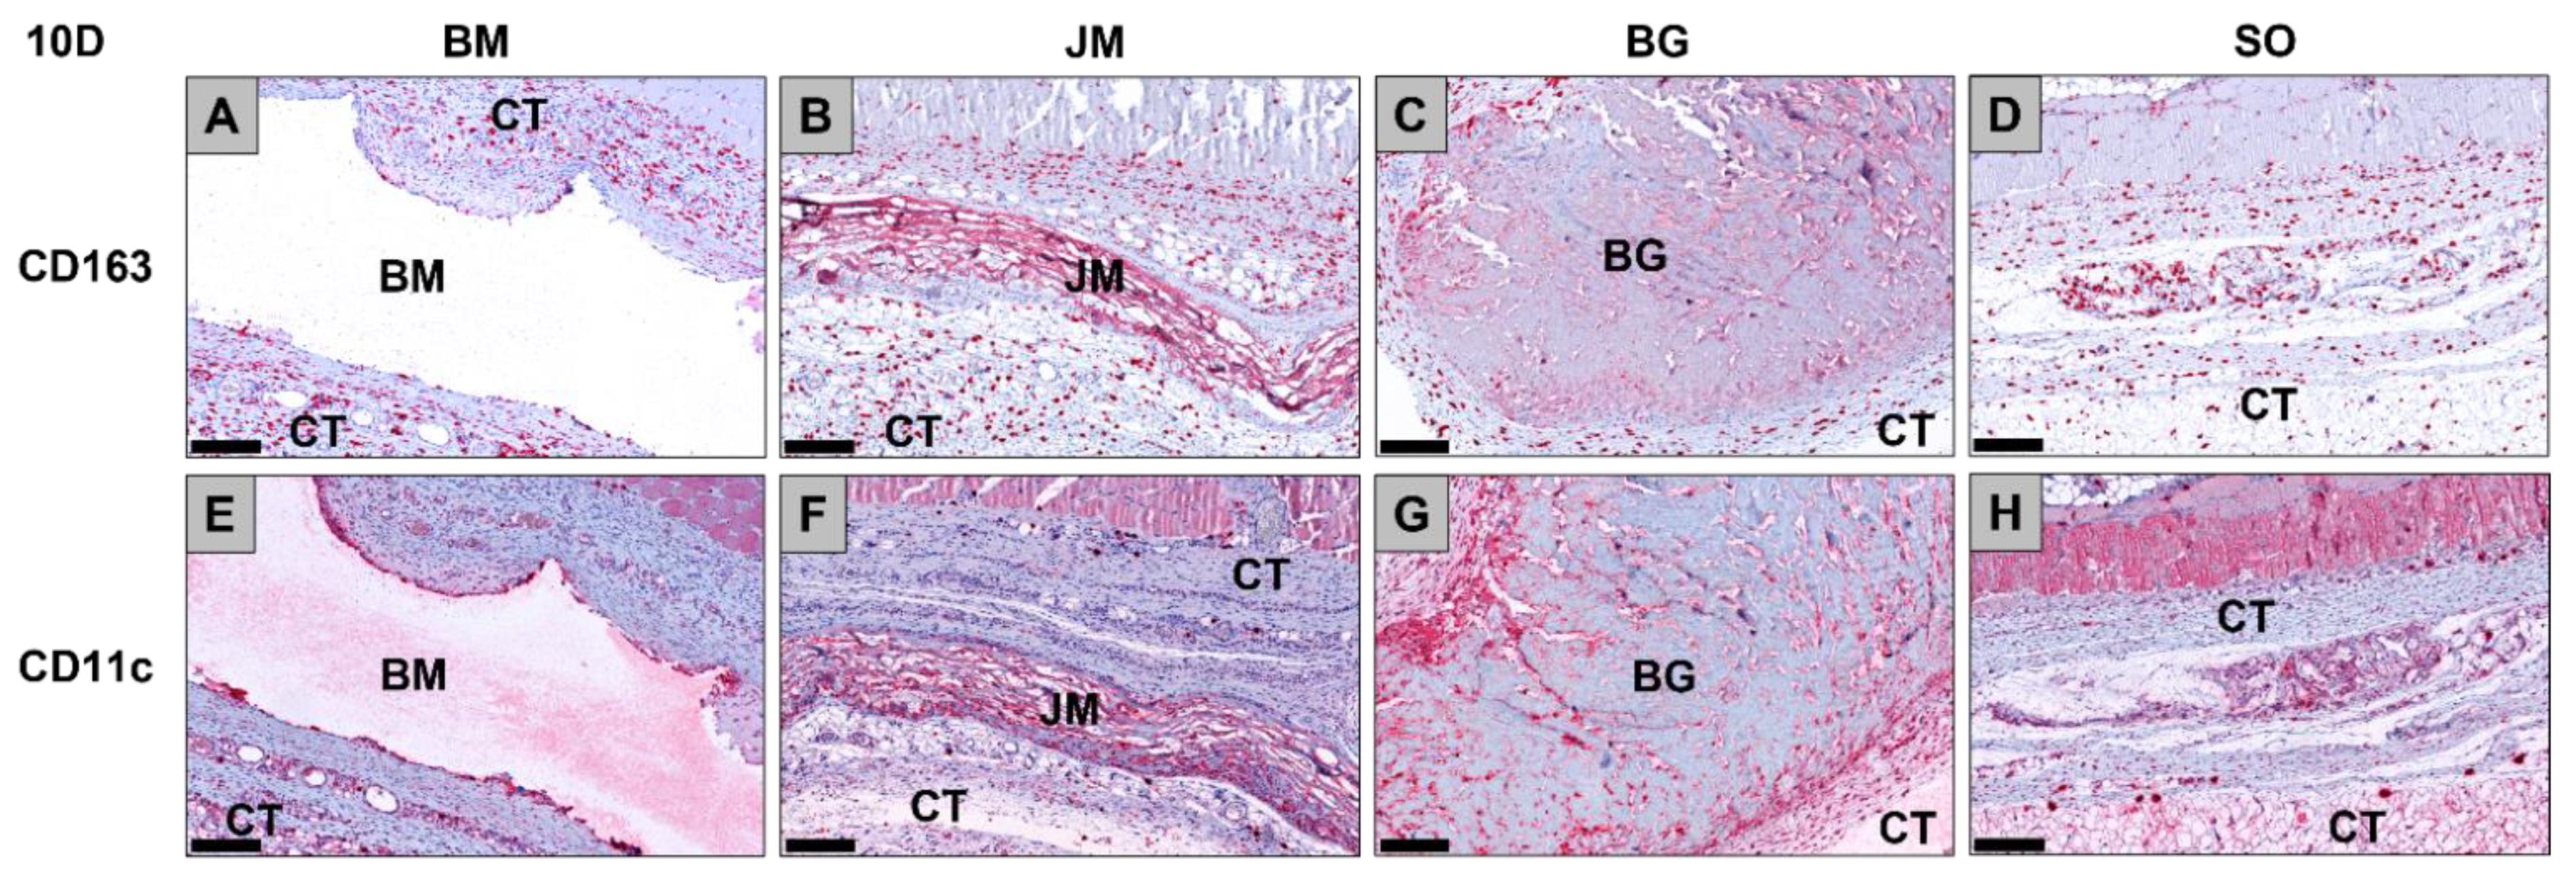
Figure 5.
Exemplary histological images of the distribution of anti-inflammatory CD163-positive macrophages (A–D) and pro-inflammatory CD11c-positive macrophages (E–H) (red staining) within the implant beds of the three membranes within the subcutaneous connective tissue (CT) at day 10 post implantationem. (A) BM = native bovine membrane, (B) JM = Jason® membrane, (C) BG = Bio-Gide® membrane, (D) Sham operation group without biomaterial insertion (CD163-immunostainings (A–D) and CD11c-immunostainings (E–H), 200× magnifications, scalebars = 200 µm).
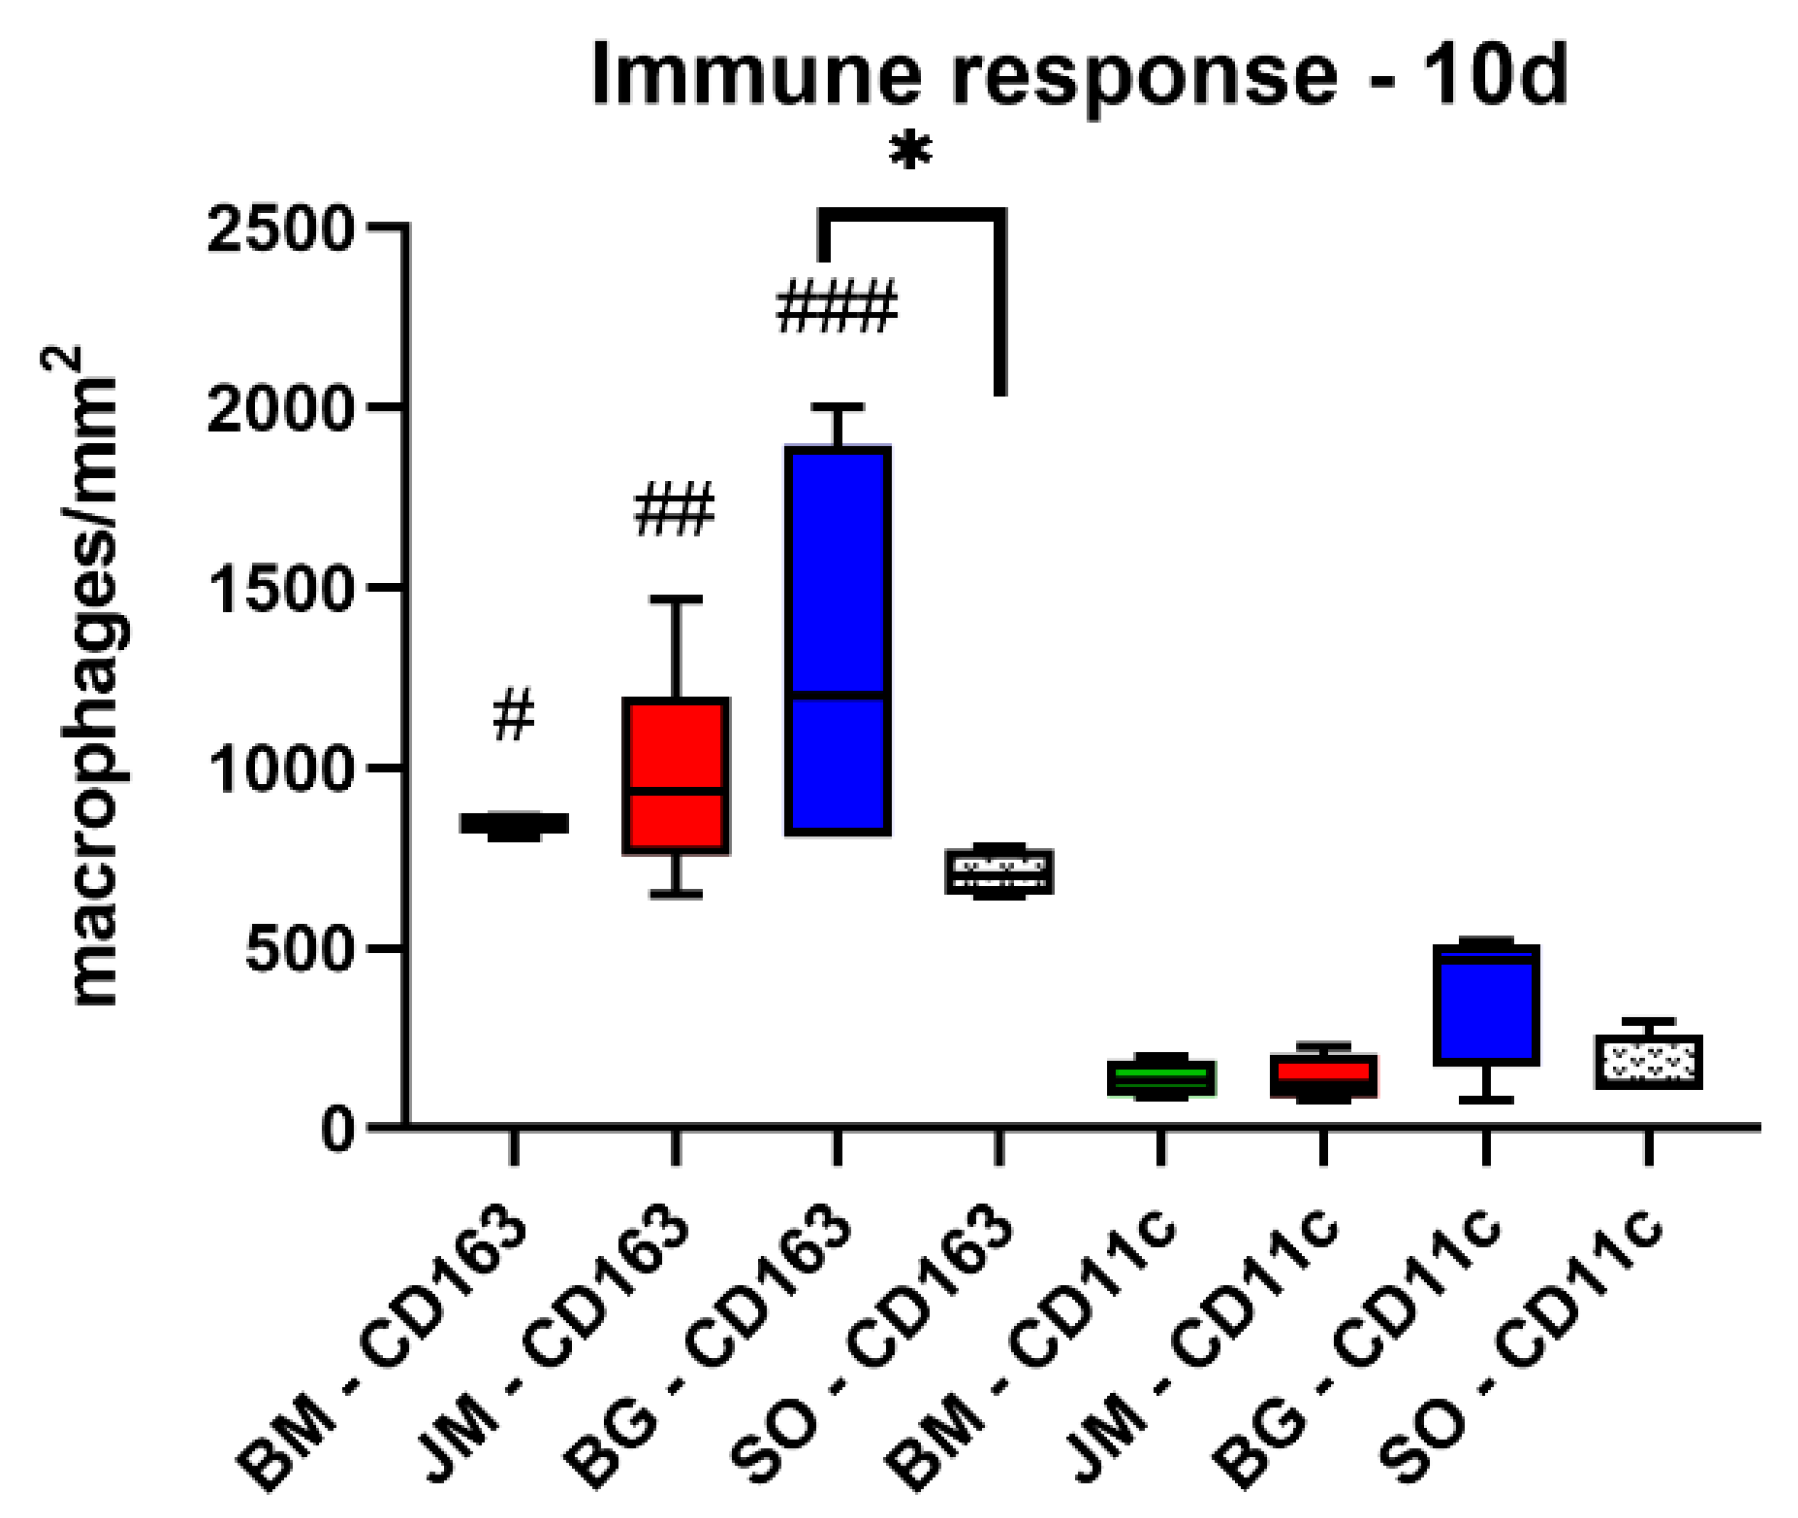
Figure 6.
Results of the histomorphometrical measurements of the macrophage distribution at day 10 post implantationem (* = intraindividual differences, # = interindividual differences; ###: p < 0.001 and ##: p < 0.01, */#: p < 0.05).
Figure 6.
Results of the histomorphometrical measurements of the macrophage distribution at day 10 post implantationem (* = intraindividual differences, # = interindividual differences; ###: p < 0.001 and ##: p < 0.01, */#: p < 0.05).
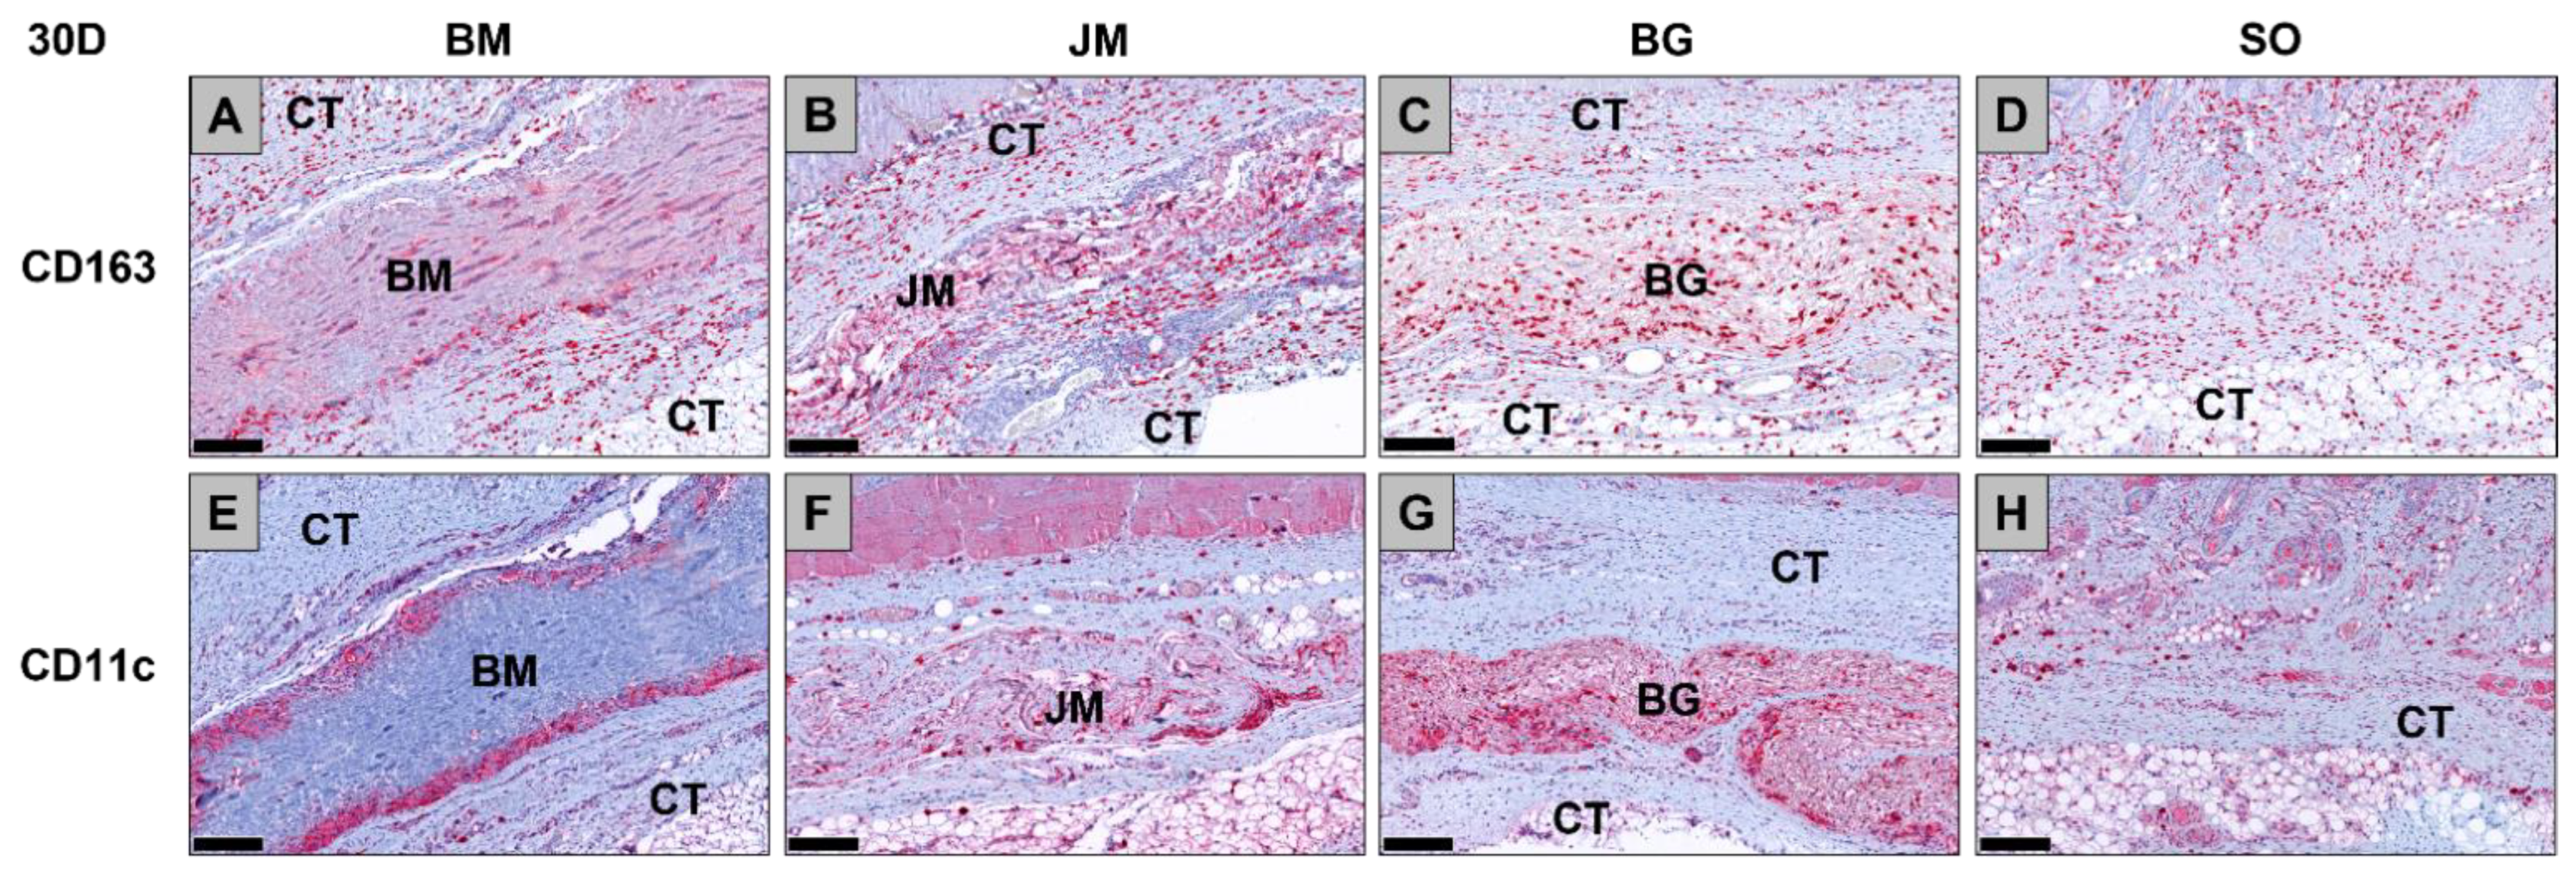
Figure 7.
Exemplary histological images of the distribution of anti-inflammatory CD163-positive macrophages (A–D) and pro-inflammatory CD11c-positive macrophages (E–H) (red staining) within the implant beds of the three membranes within the subcutaneous connective tissue (CT) at day 30 post implantationem. (A) BM = Bovine membrane, (B) JM = Jason® membrane, (C) BG = Bio-Gide® membrane, (D) Sham operation group without biomaterial insertion (CD163-immunostainings (A–D) and CD11c-immunostainings (E–H), 200× magnifications, scalebars = 200 µm).
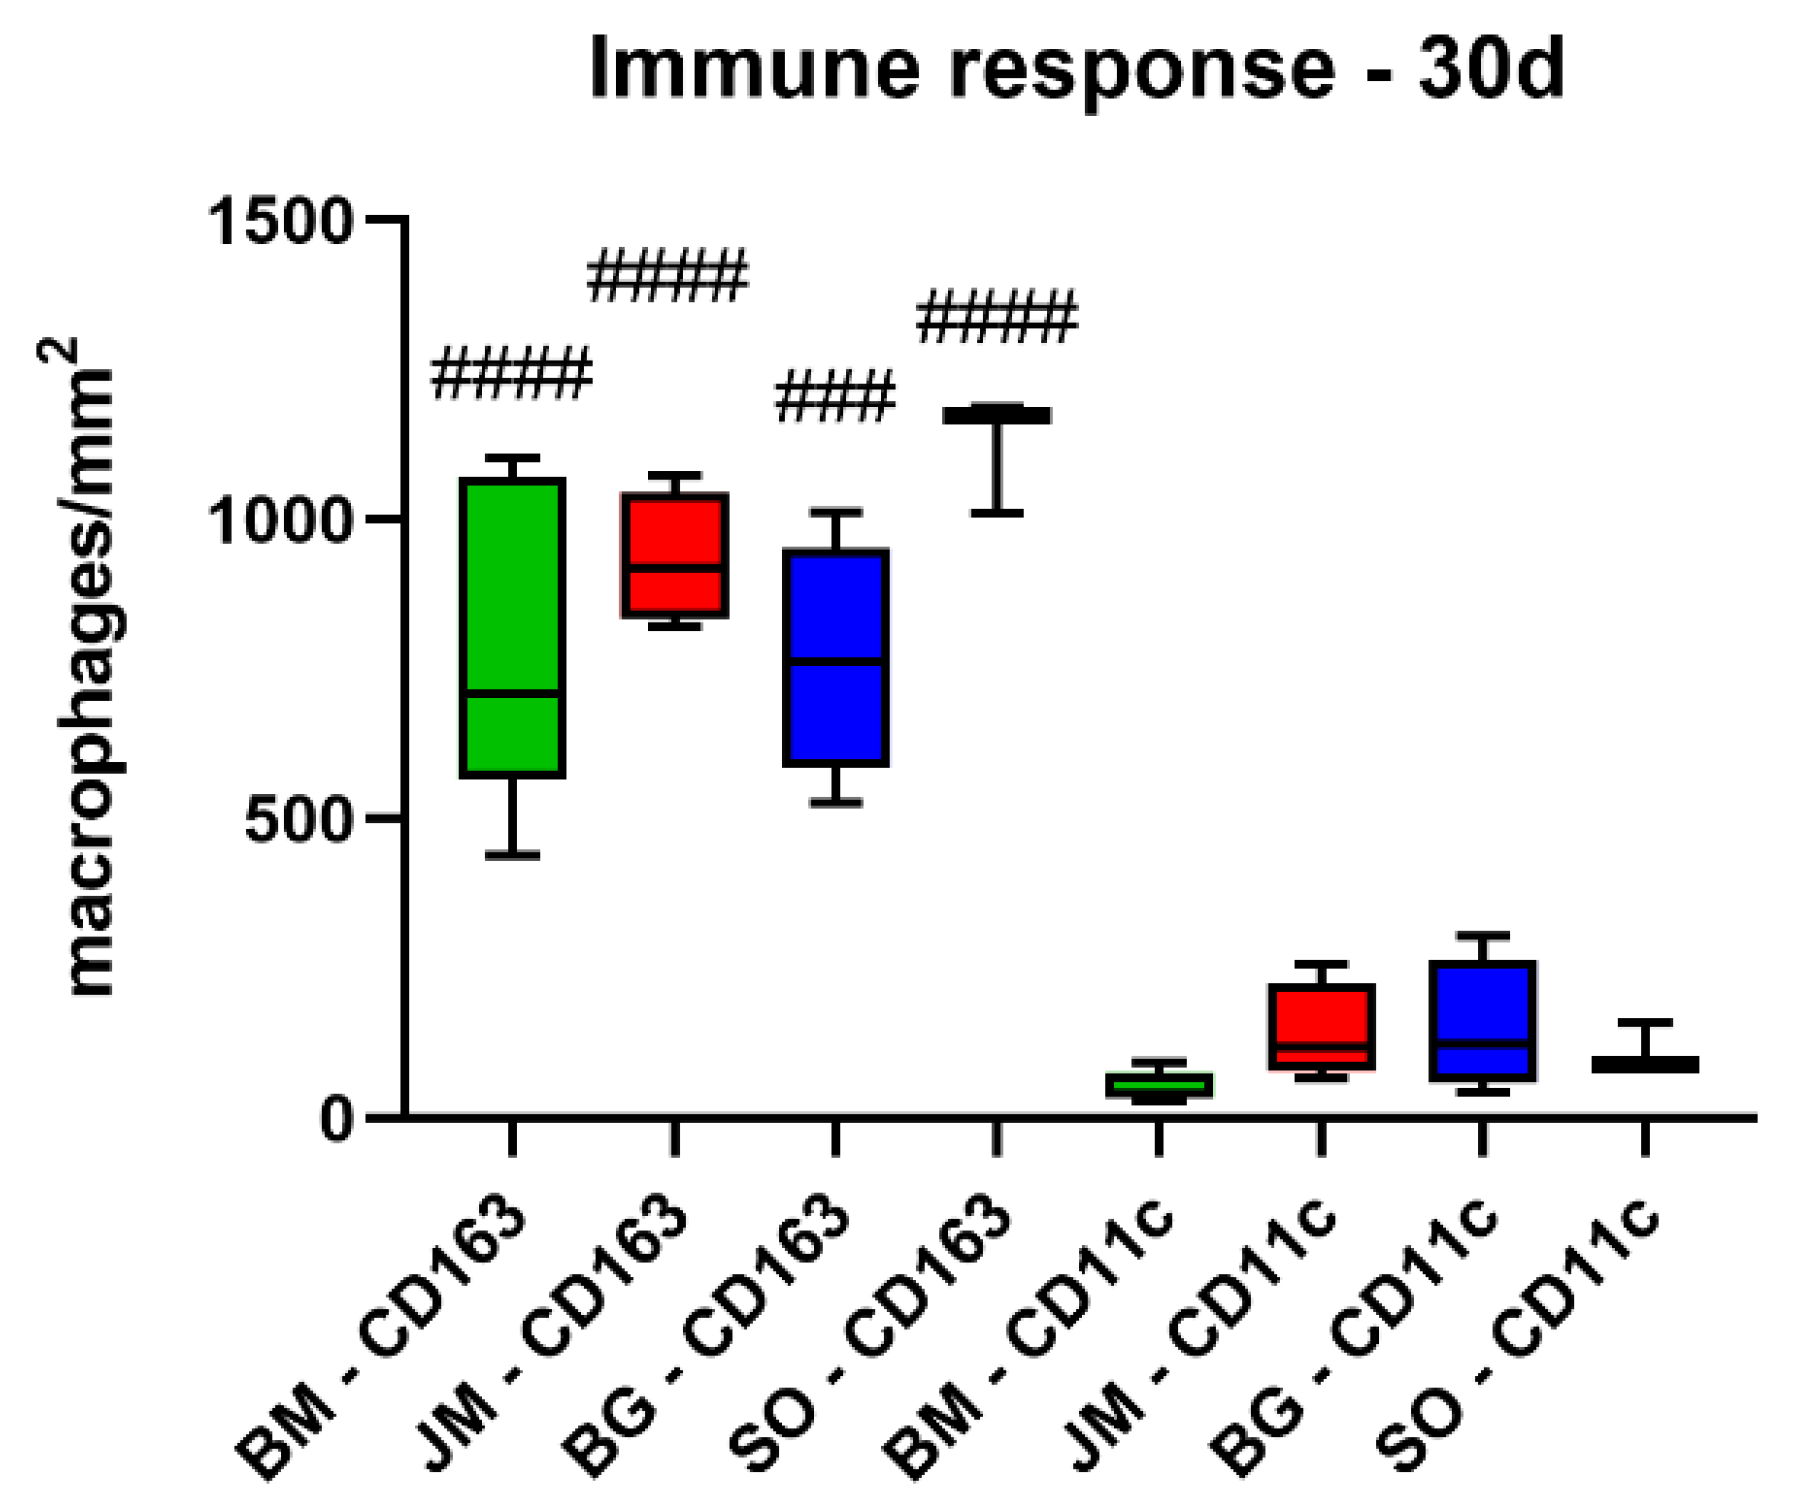
Figure 8.
Results of the histomorphometrical measurements of the macrophage distribution at day 30 post implantationem (# = interindividual differences; ### p < 0.001, #### p < 0.0001).
Figure 8.
Results of the histomorphometrical measurements of the macrophage distribution at day 30 post implantationem (# = interindividual differences; ### p < 0.001, #### p < 0.0001).
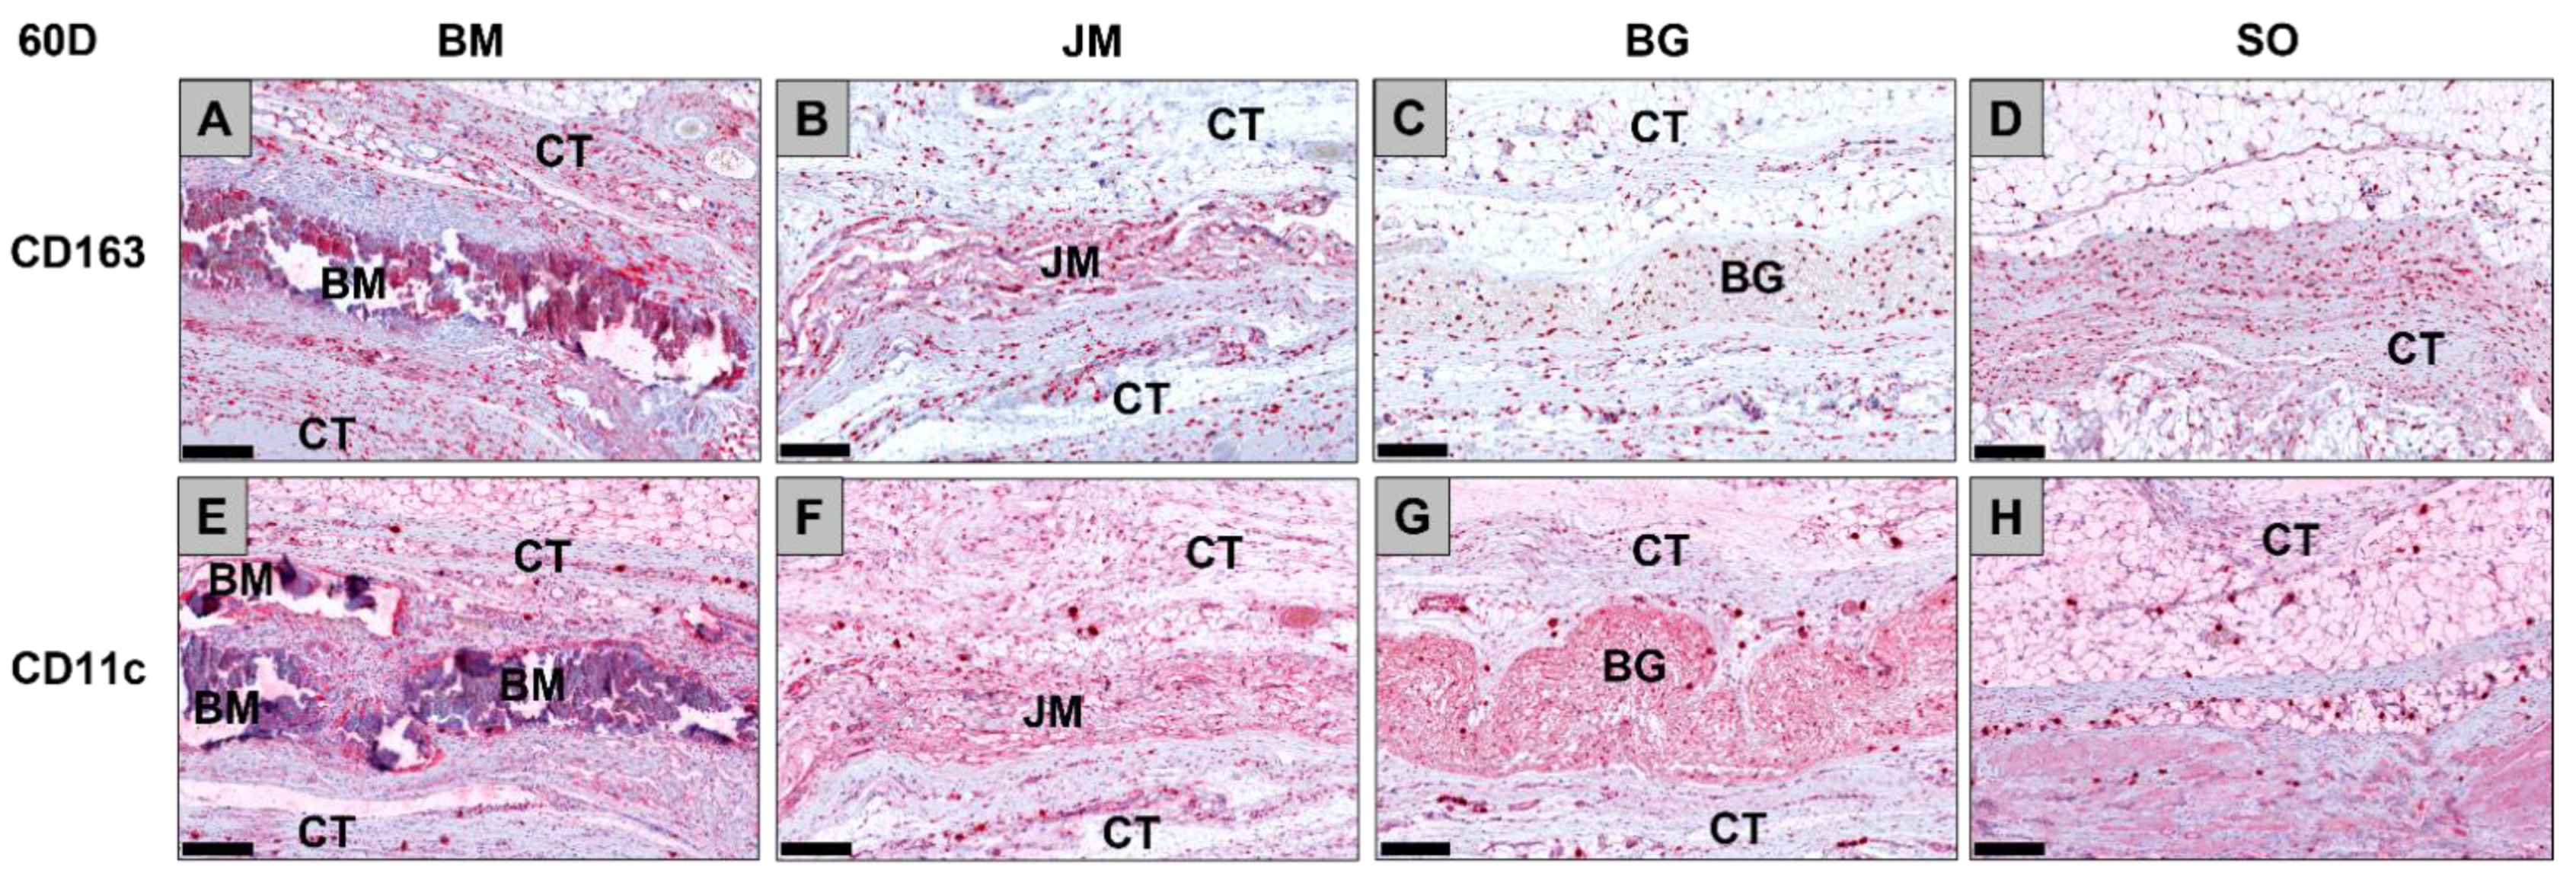
Figure 9.
Exemplary histological images of the distribution of anti-inflammatory CD163-positive macrophages (A–D) and pro-inflammatory CD11c-positive macrophages (E–H) (red staining) within the implant beds of the three membranes within the subcutaneous connective tissue (CT) at day 60 post implantationem. (A) BM = Bovine membrane, (B) JM = Jason® membrane, (C) BG = Bio-Gide® membrane, (D) Sham operation group without biomaterial insertion (CD163-immunostainings (A–D) and CD11c-immunostainings (E–H), 200× magnifications, scalebars = 200 µm).
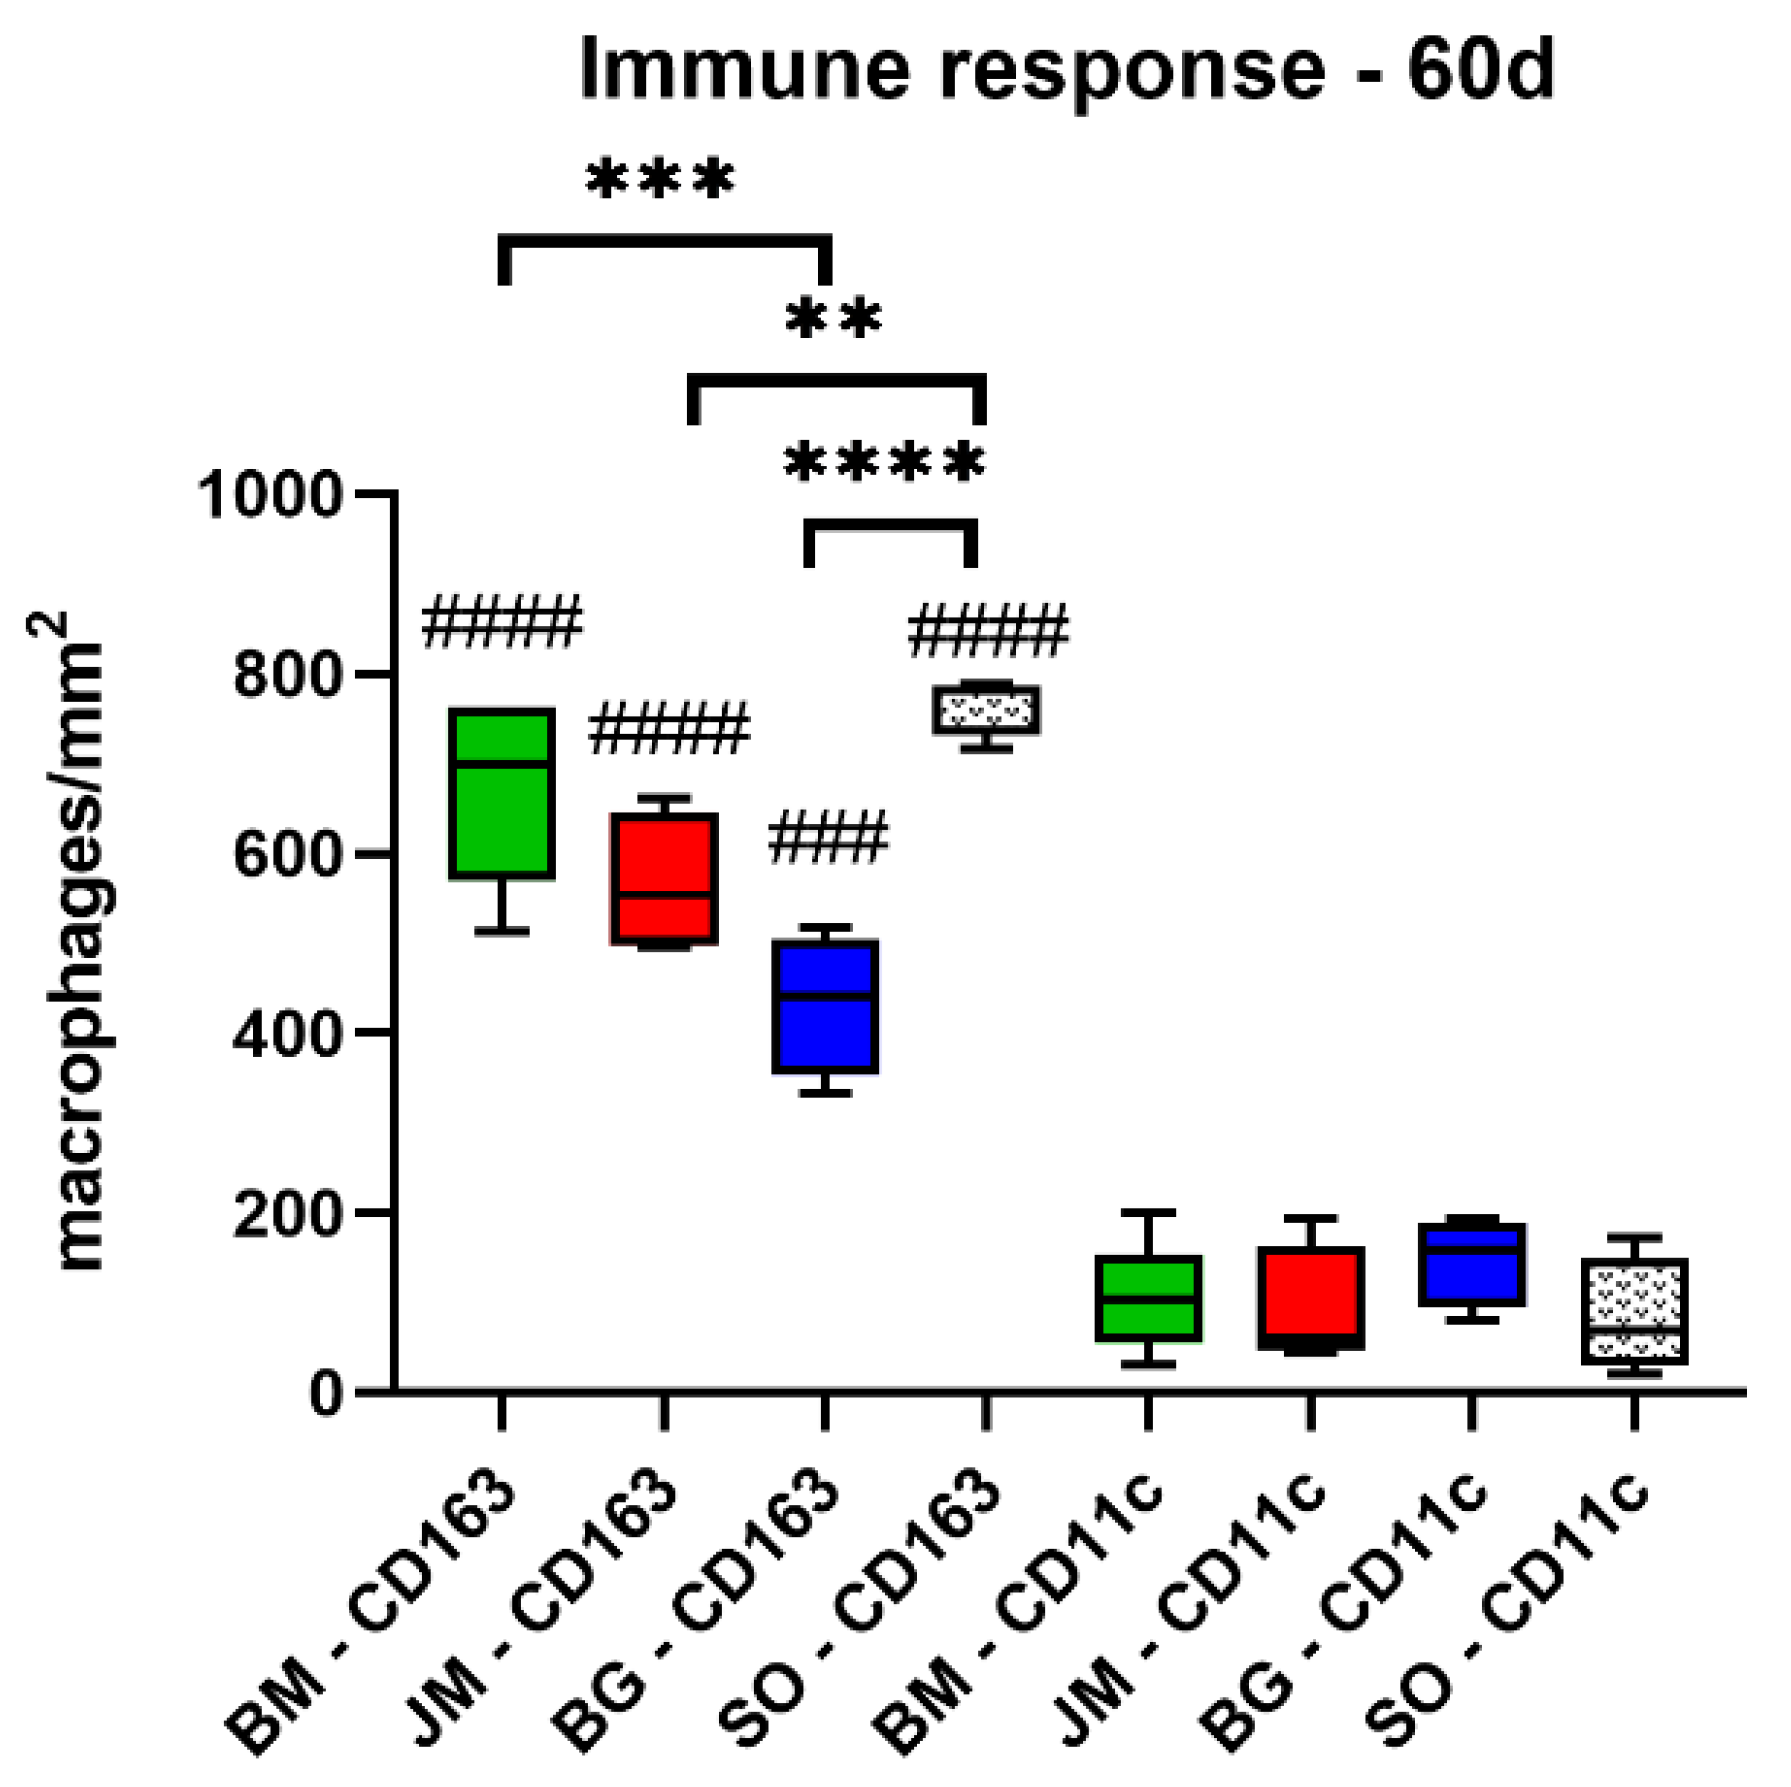
Figure 10.
Results of the histomorphometrical measurements of the macrophage distribution at day 60 post implantationem (* = intraindividual differences, # = interindividual differences; ****/####: p < 0.0001, ***/###: p < 0.001 and **: p < 0.01). BM: bovine membrane, JM: Jason® membrane, BG: Bio-Gide®, SO: sham operation.
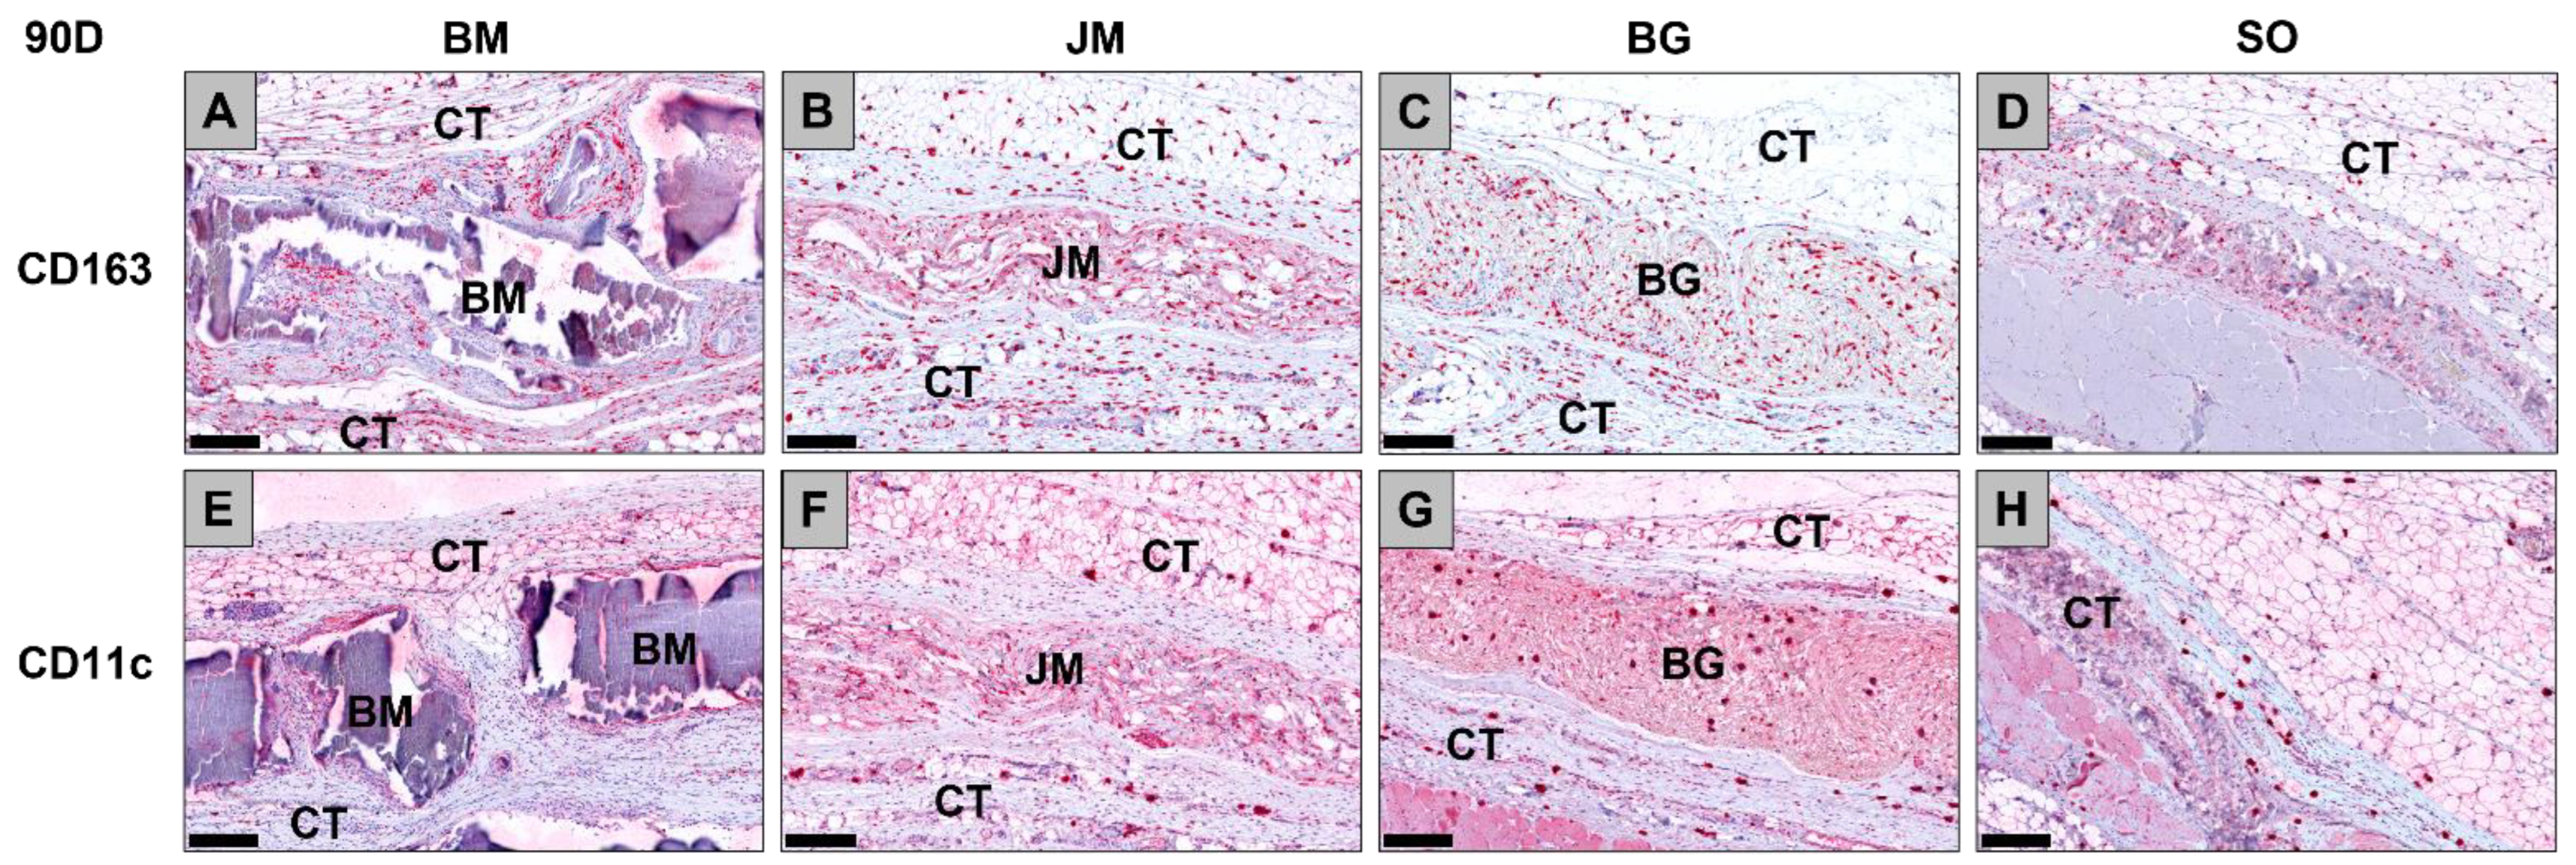
Figure 11.
Exemplary histological images of the distribution of anti-inflammatory CD163-positive macrophages (A–D) and pro-inflammatory CD11c-positive macrophages (E–H) (red staining) within the implant beds of the three membranes within the subcutaneous connective tissue (CT) at day 90 post implantationem. (A) BM = Bovine membrane, (B) JM = Jason® membrane, (C) BG = Bio-Gide® membrane, (D) Sham operation group without biomaterial insertion (CD163-immunostainings (A–D) and CD11c-immunostainings (E–H), 200× magnifications, scalebars = 200 µm).
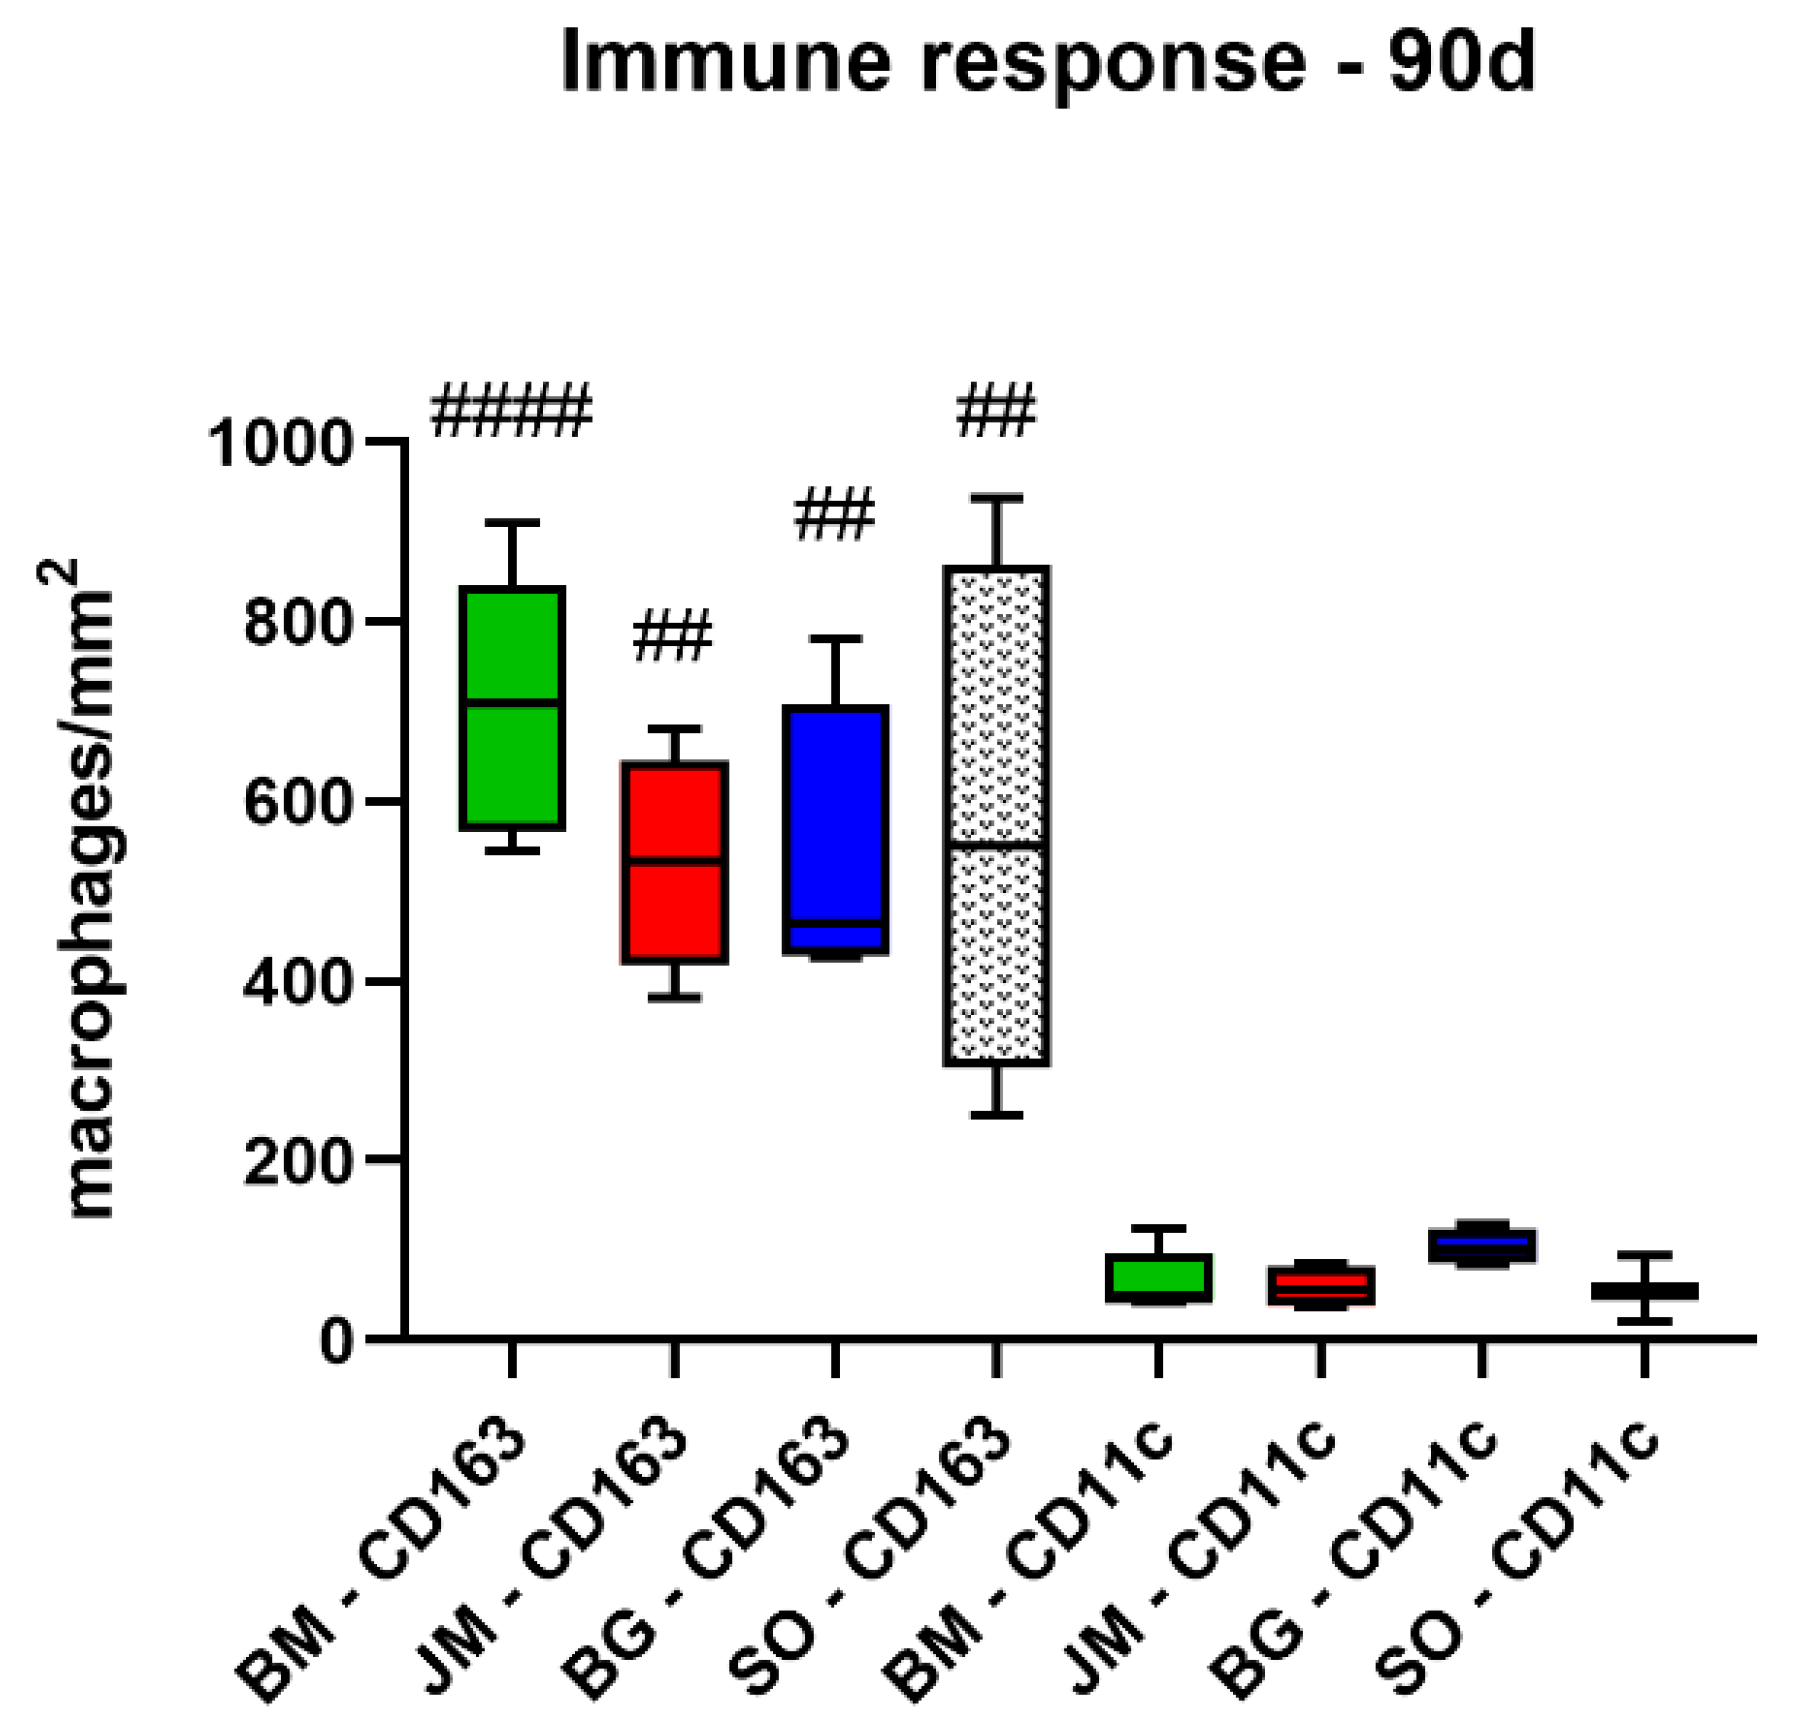
Figure 12.
Results of the histomorphometrical measurements of the macrophage distribution at day 90 post implantationem (# = interindividual differences; ##: p < 0.01 and #### p < 0.0001). BM: bovine membrane, JM: Jason® membrane, BG: Bio-Gide®, SO: sham operation.
Figure 12.
Results of the histomorphometrical measurements of the macrophage distribution at day 90 post implantationem (# = interindividual differences; ##: p < 0.01 and #### p < 0.0001). BM: bovine membrane, JM: Jason® membrane, BG: Bio-Gide®, SO: sham operation.
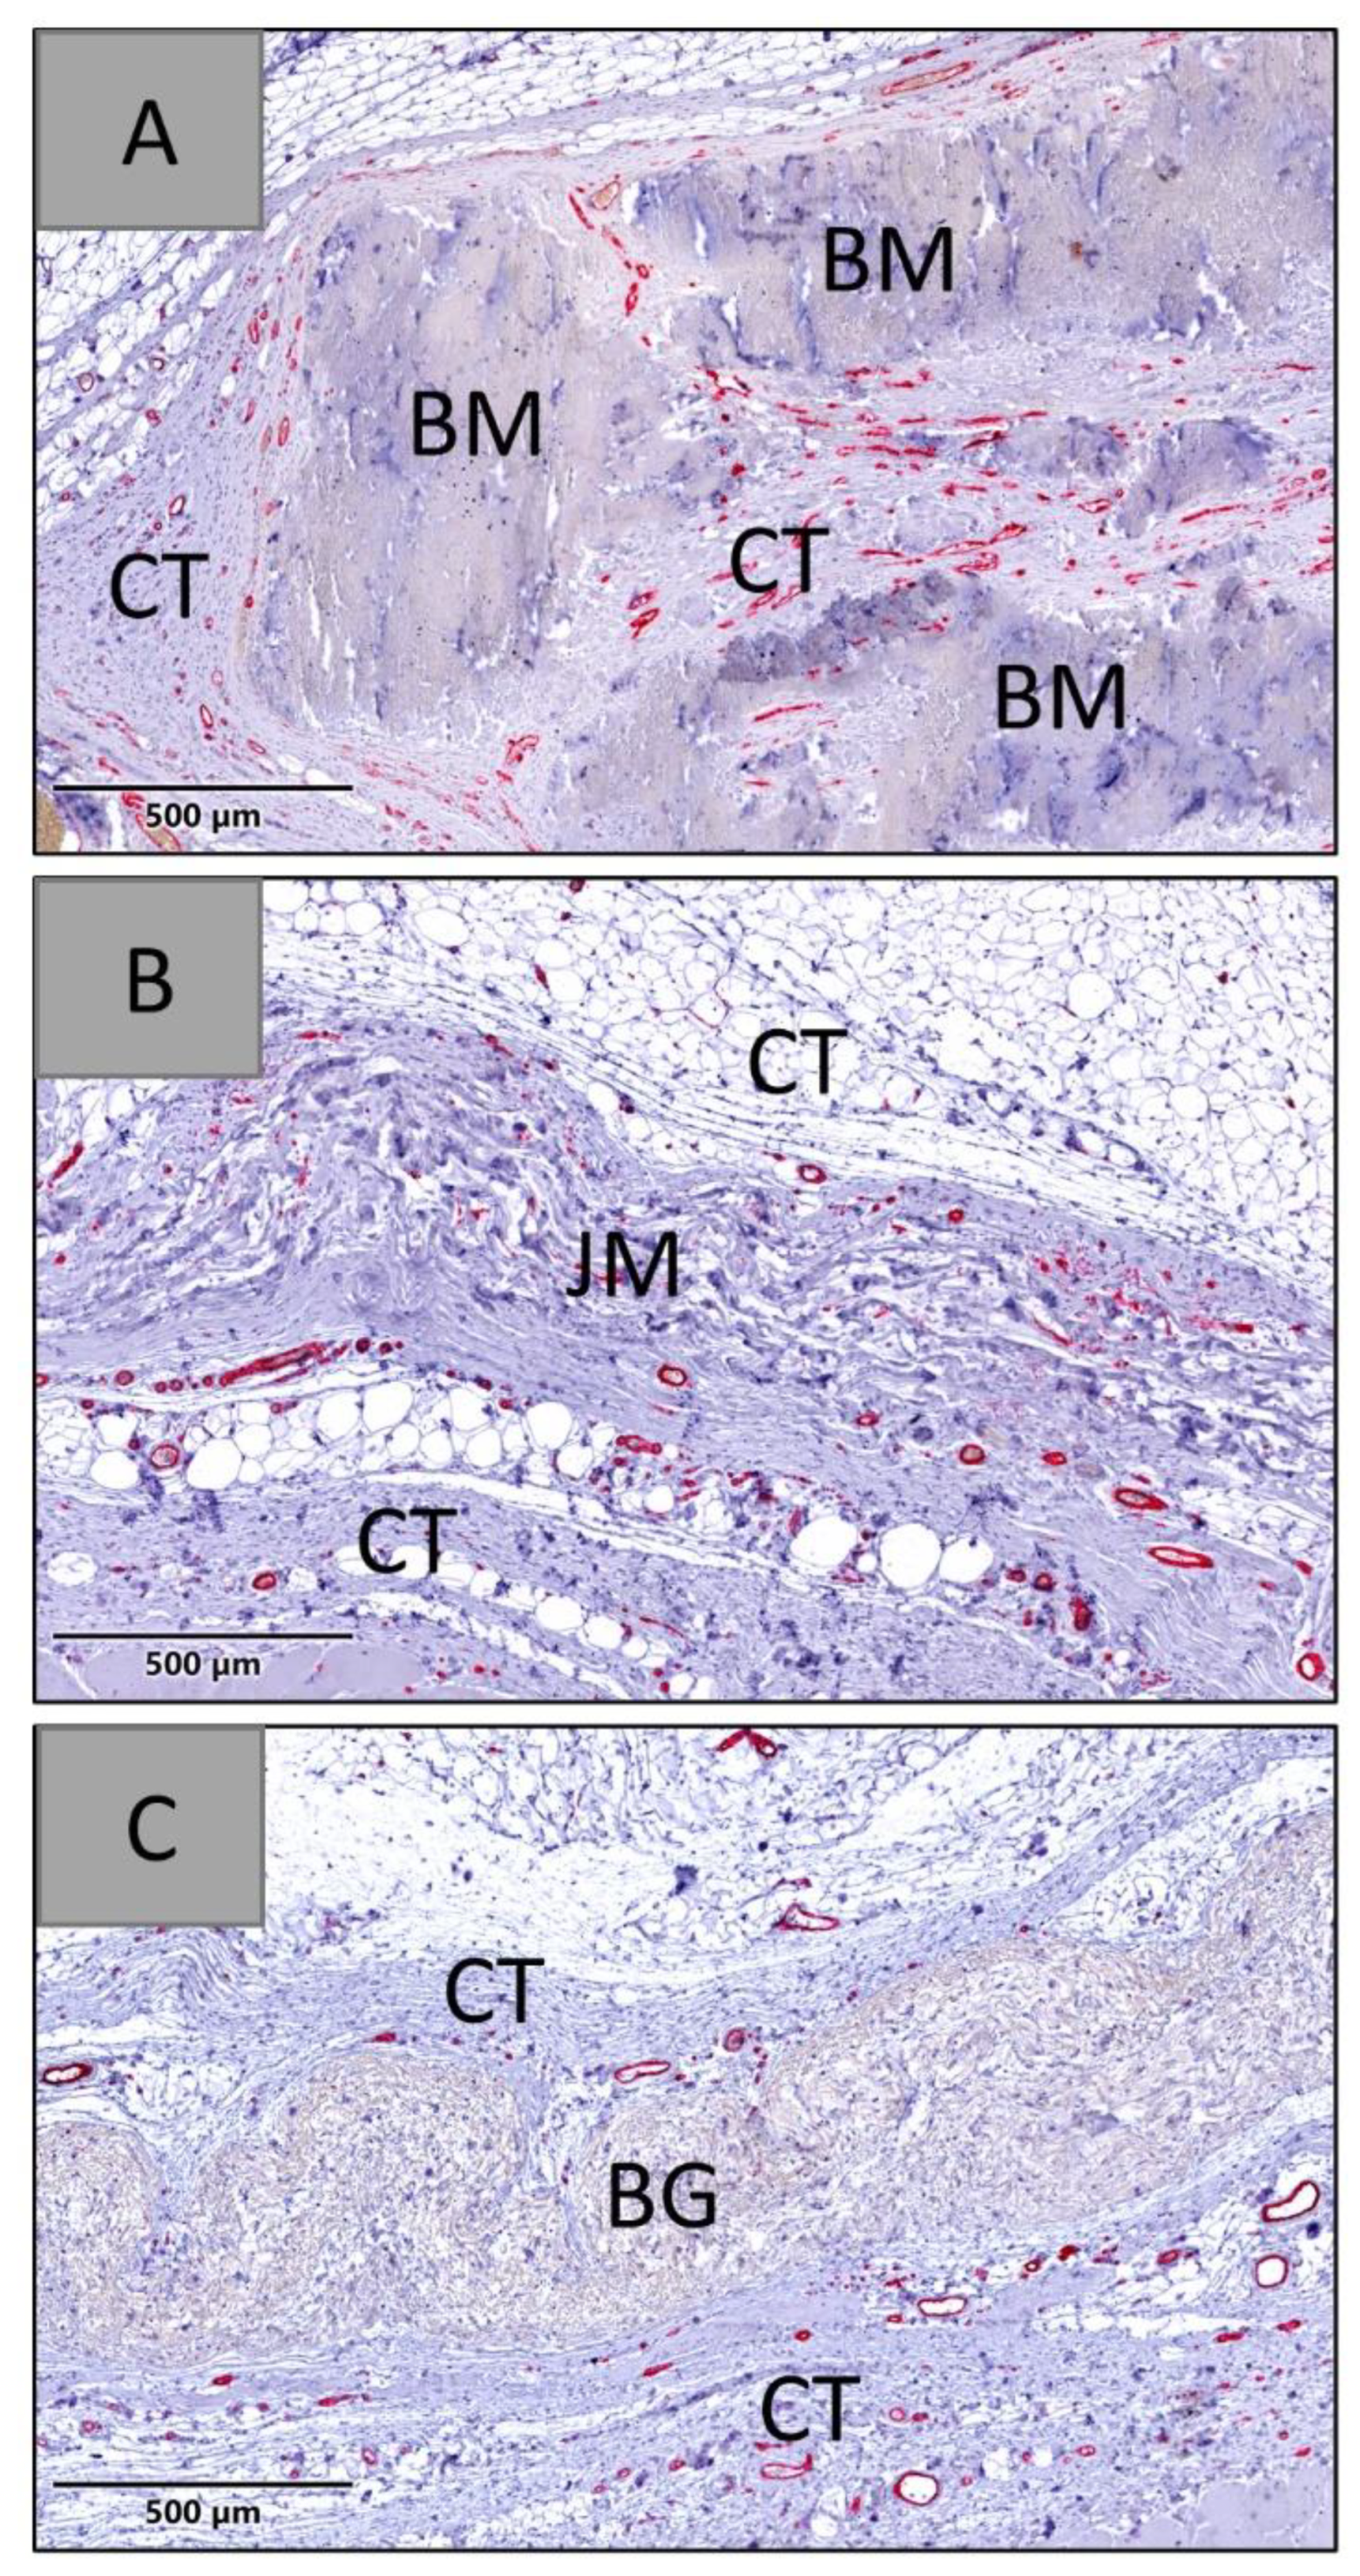
Figure 13.
Exemplary histological images of the three membranes within the subcutaneous connective tissue (CT) at day 30 post implantationem. (A) BM = native bovine membrane, (B) JM = Jason® membrane, (C) BG = Bio-Gide®, red staining = blood vessels (CD31-immunostainings, 20× magnifications, scalebars = 500 µm).
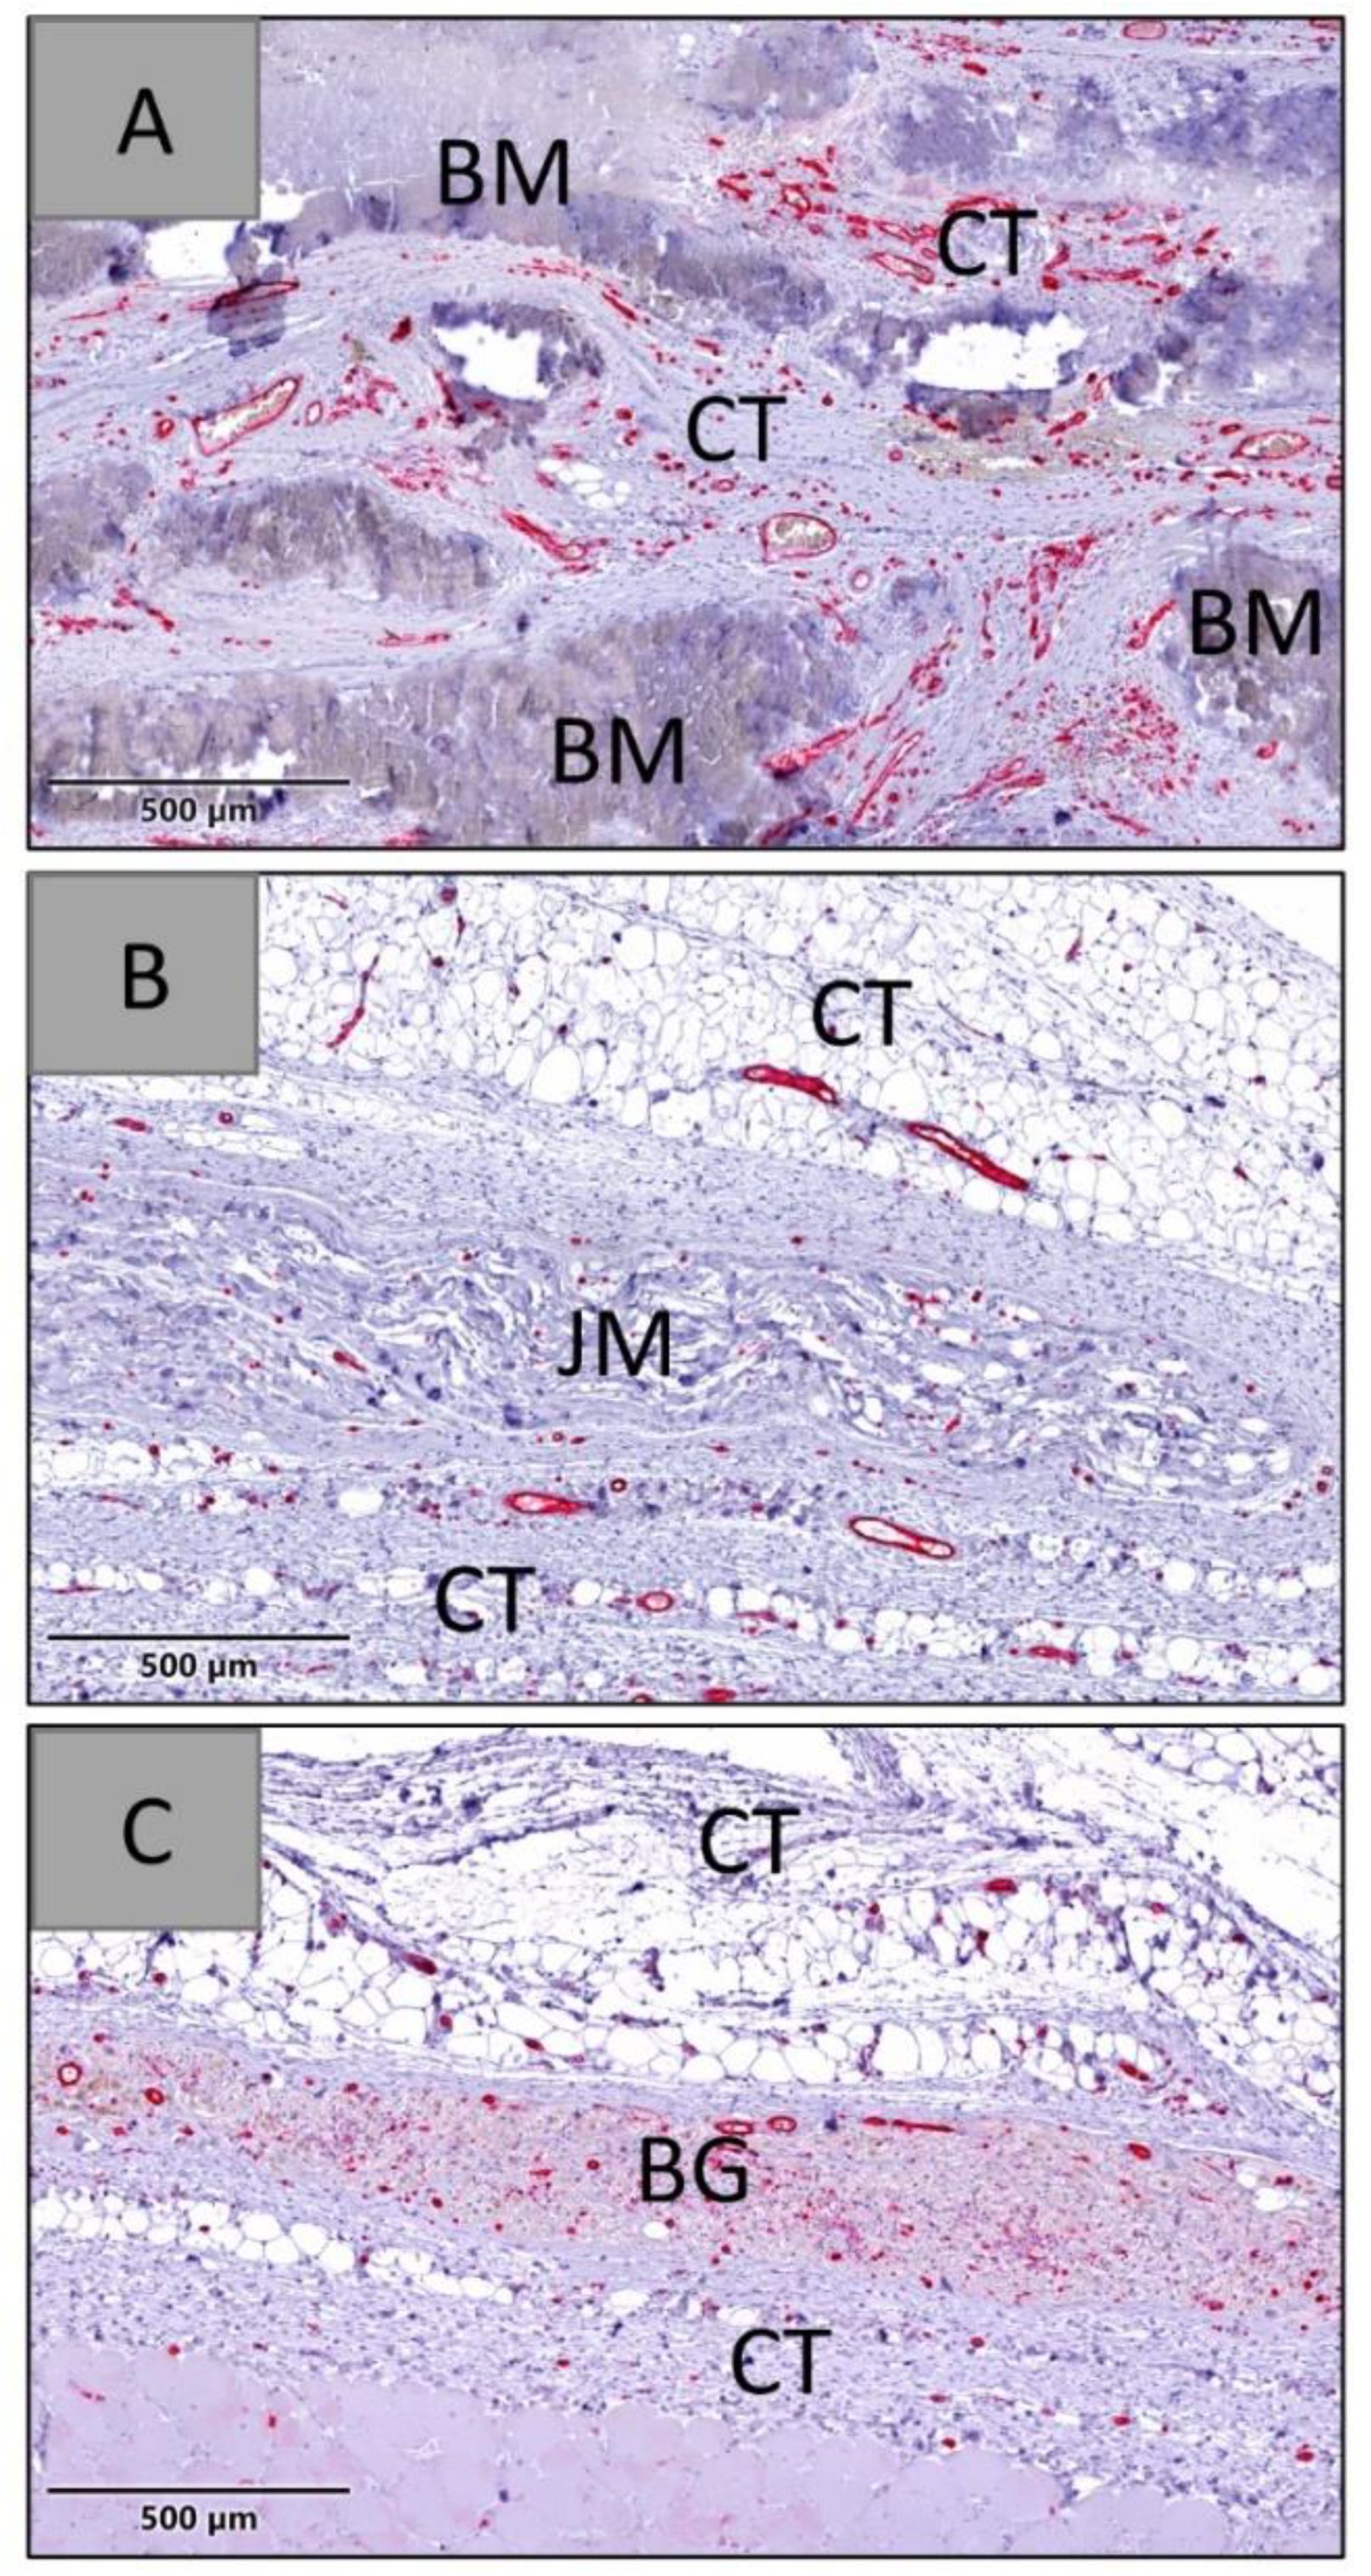
Figure 14.
Exemplary histological images of the three membranes within the subcutaneous connective tissue (CT) at day 60 post implantationem. (A) BM = native bovine membrane, (B) JM = Jason® membrane, (C) BG = Bio-Gide® (CD31-immunostainings, 20× magnifications, scalebars = 500 µm).
Figure 14.
Exemplary histological images of the three membranes within the subcutaneous connective tissue (CT) at day 60 post implantationem. (A) BM = native bovine membrane, (B) JM = Jason® membrane, (C) BG = Bio-Gide® (CD31-immunostainings, 20× magnifications, scalebars = 500 µm).
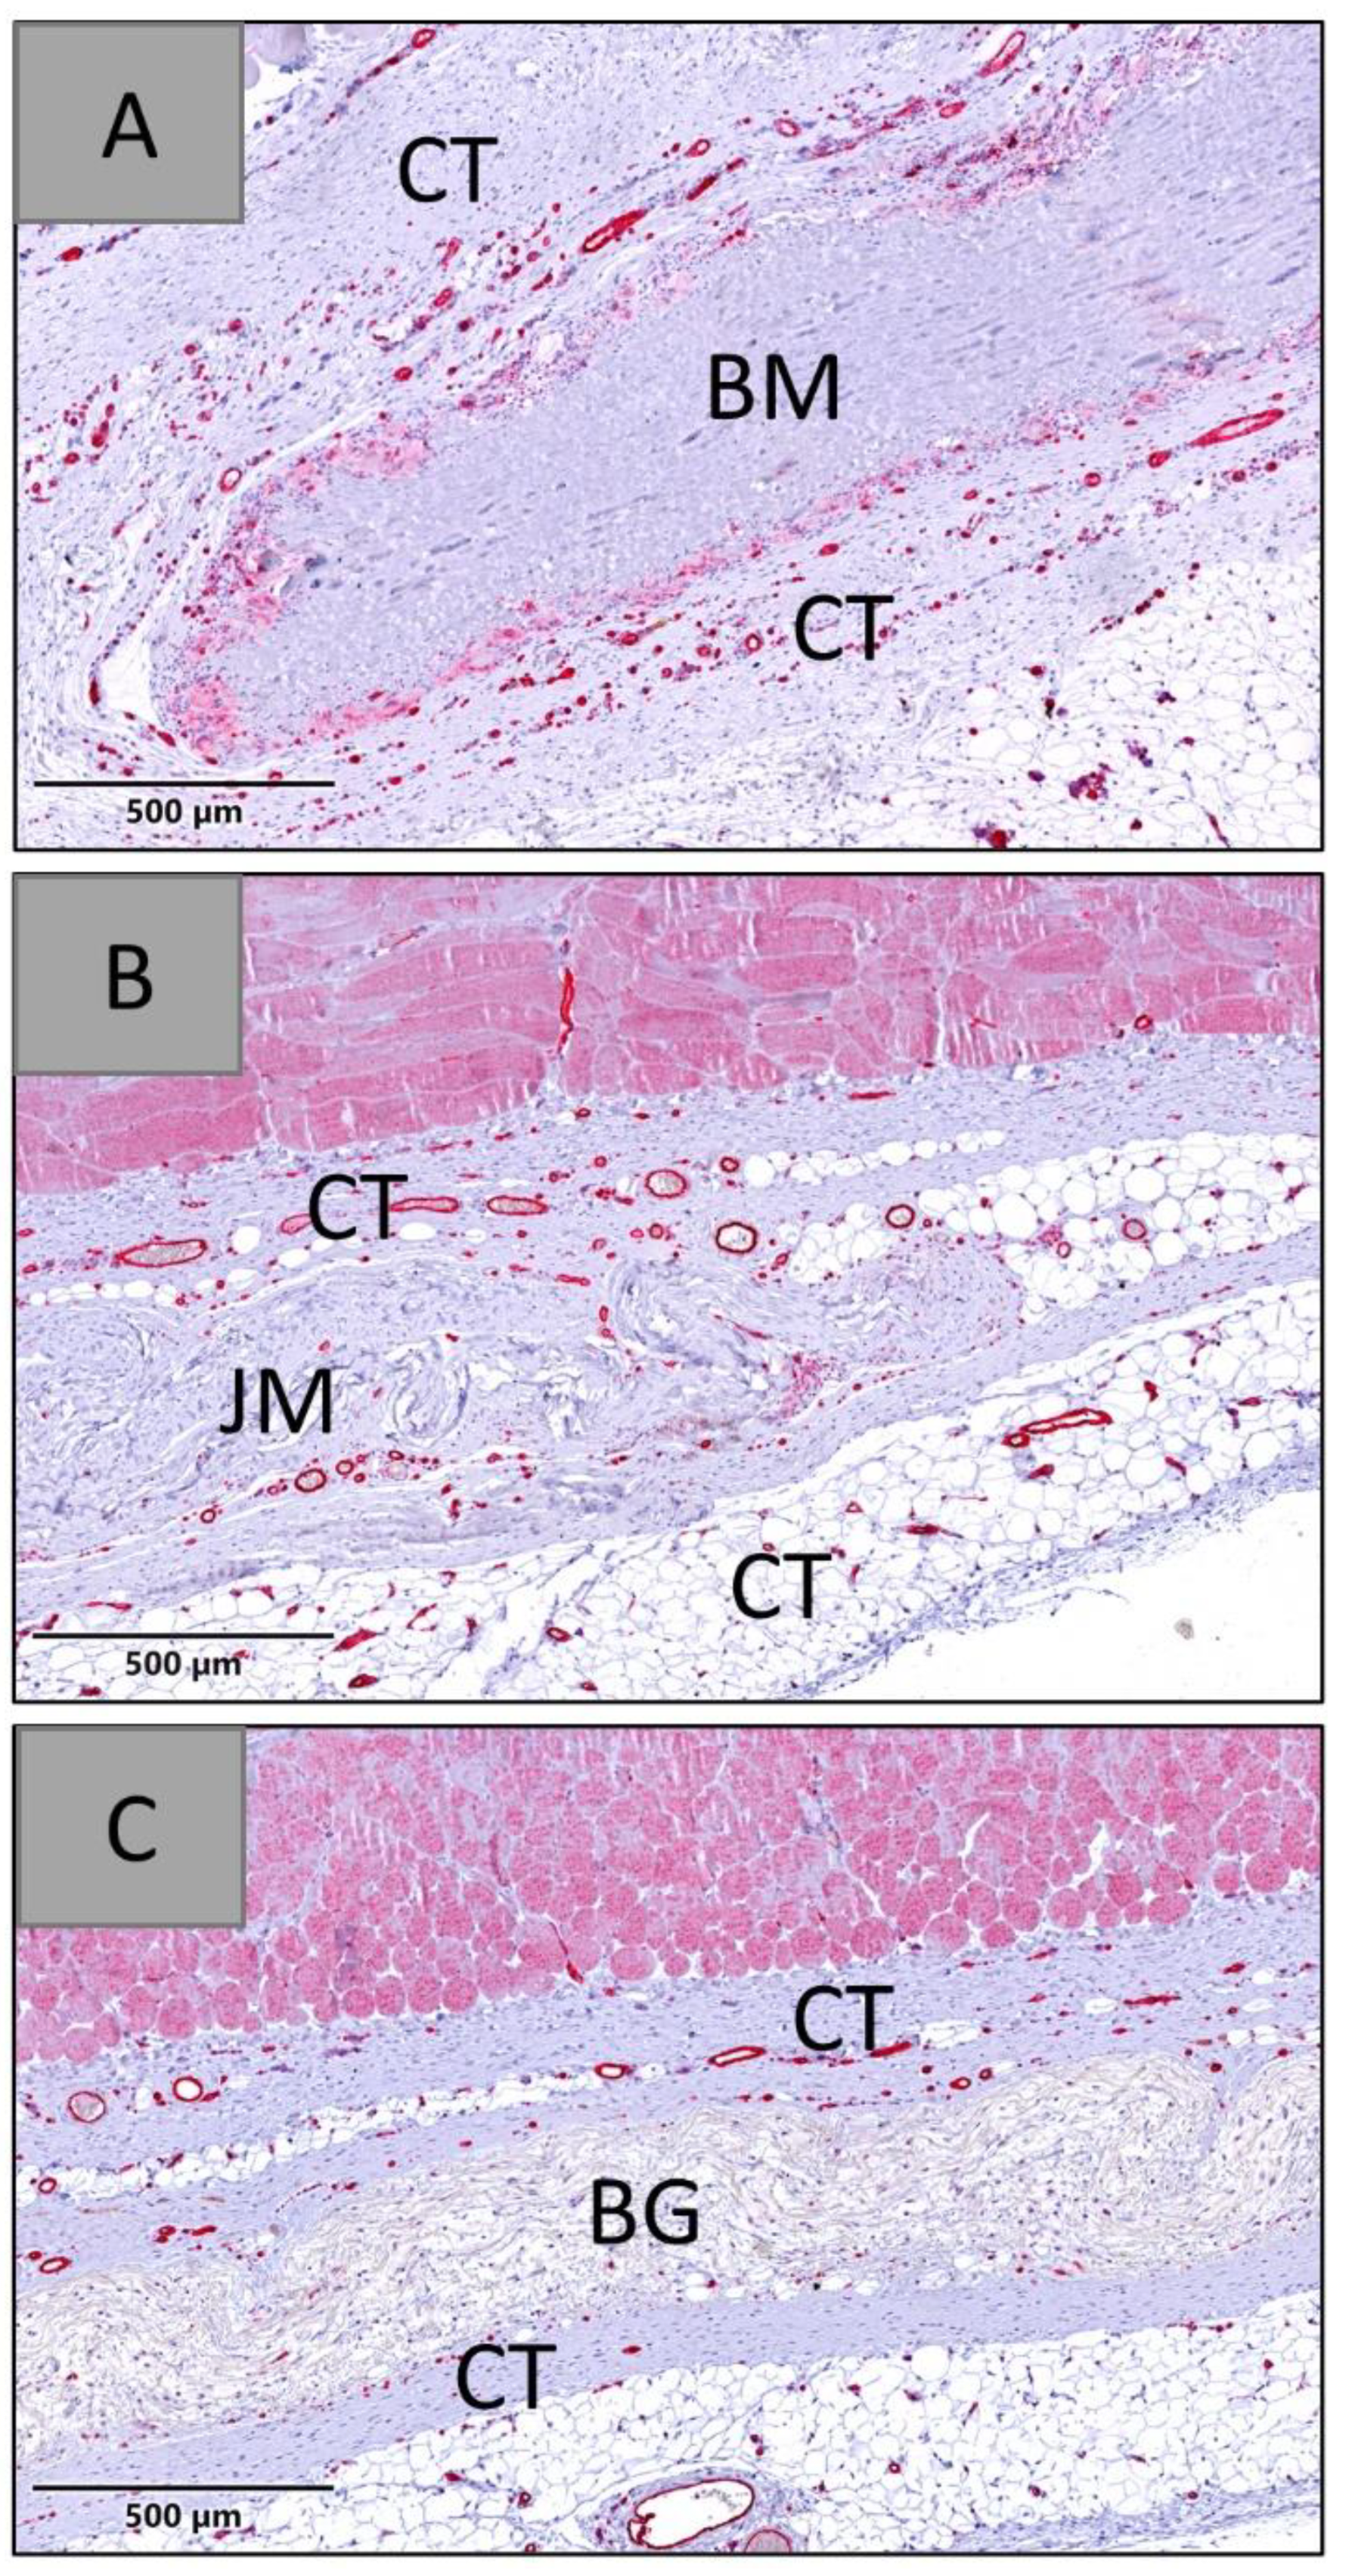
Figure 15.
Exemplary histological images of the three membranes within the subcutaneous connective tissue (CT) at day 90 post implantationem. (A) BM = native bovine membrane, (B) JM = Jason® membrane, (C) BG = Bio-Gide (CD31-immunostainings, 20× magnifications, scalebars = 500 µm).
Figure 15.
Exemplary histological images of the three membranes within the subcutaneous connective tissue (CT) at day 90 post implantationem. (A) BM = native bovine membrane, (B) JM = Jason® membrane, (C) BG = Bio-Gide (CD31-immunostainings, 20× magnifications, scalebars = 500 µm).
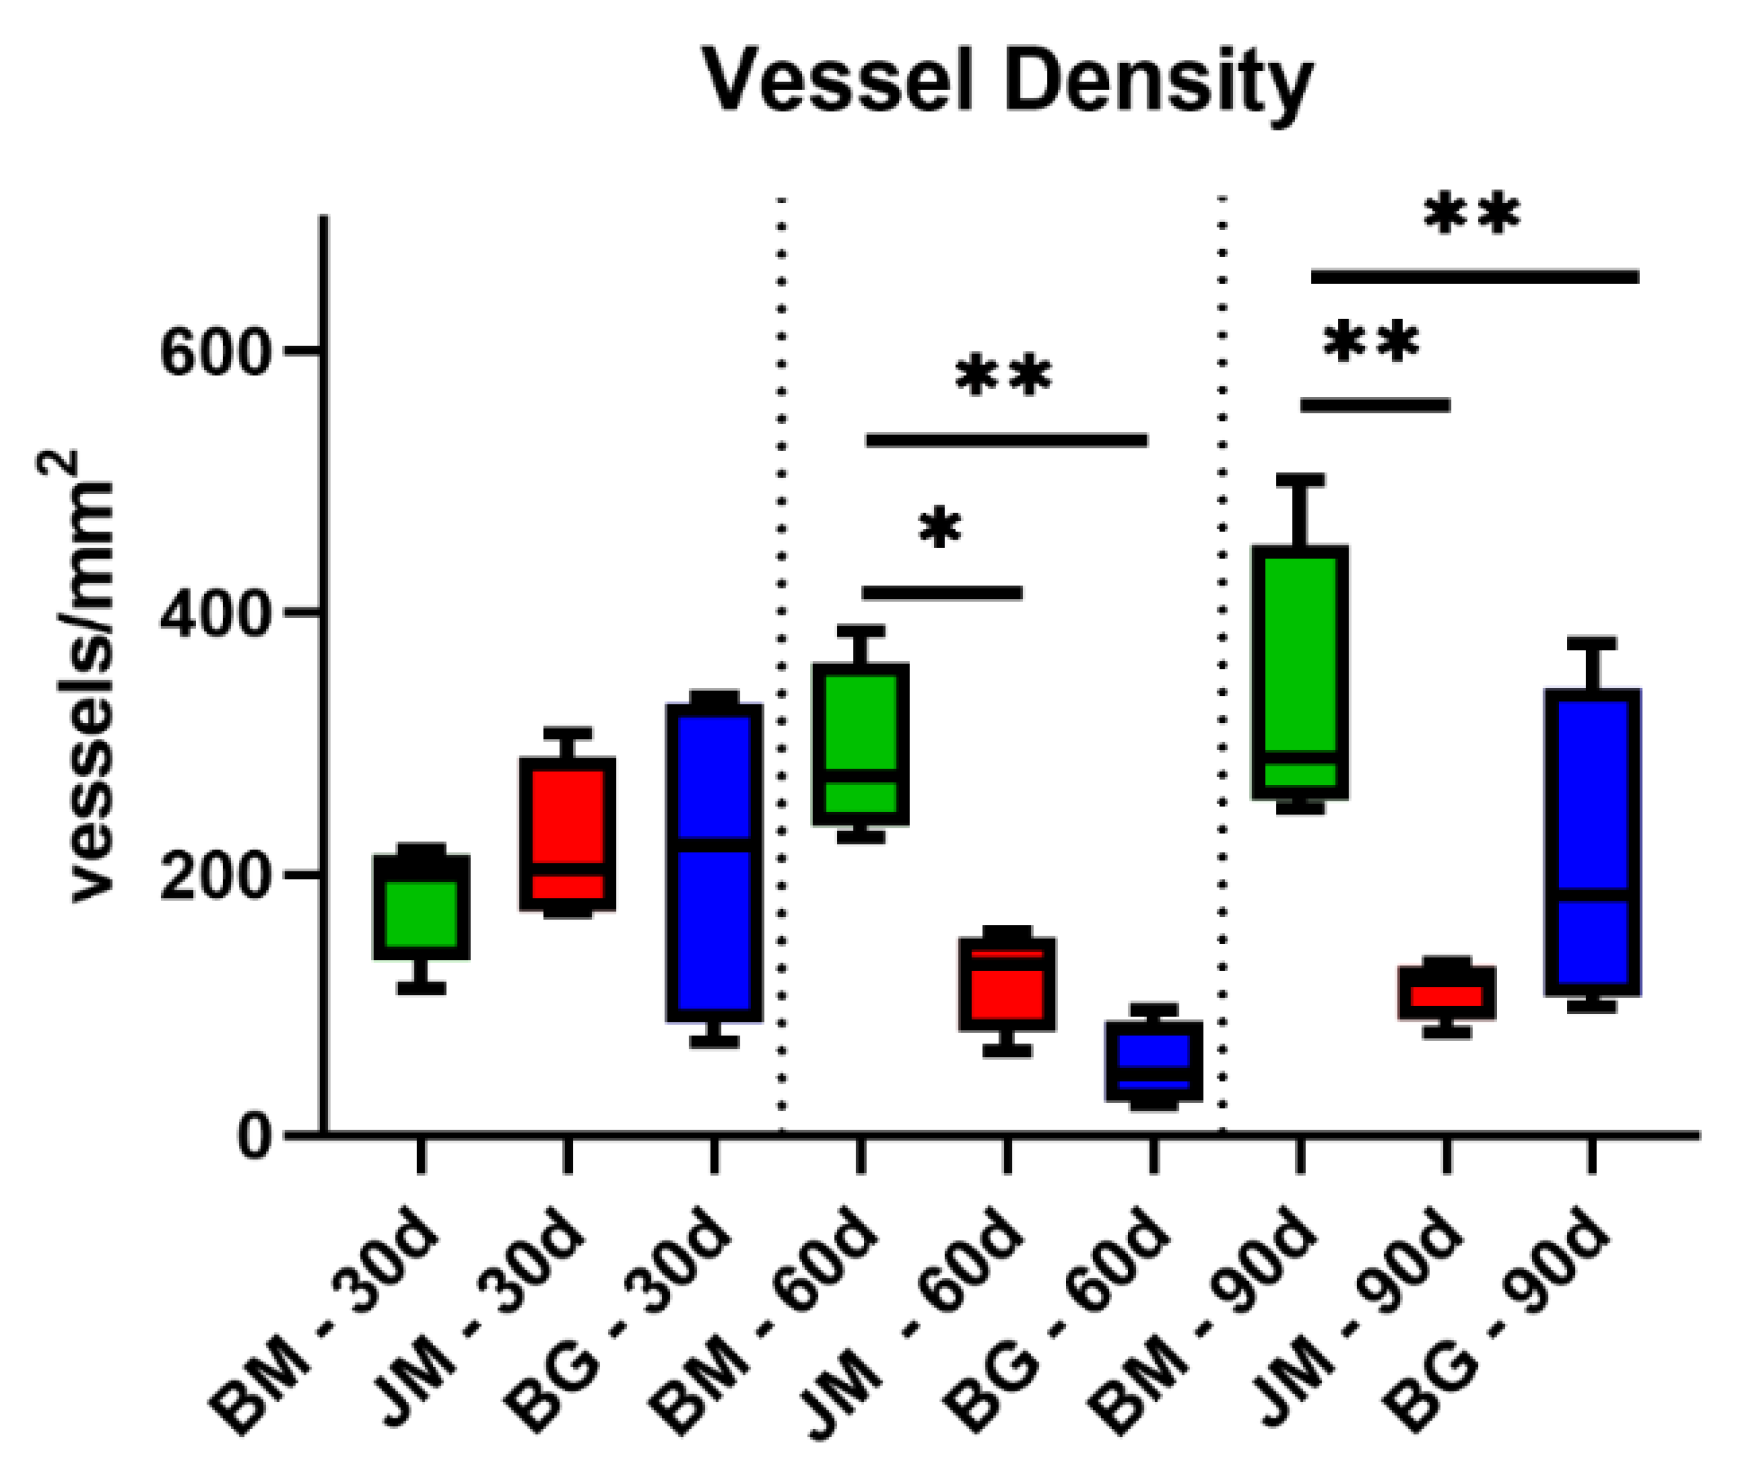
Figure 16.
Results of the histomorphometrical measurements of the vessel density of the membrane areas (* = intraindividual differences; *: p < 0.05 and **: p < 0.01).
Figure 16.
Results of the histomorphometrical measurements of the vessel density of the membrane areas (* = intraindividual differences; *: p < 0.05 and **: p < 0.01).
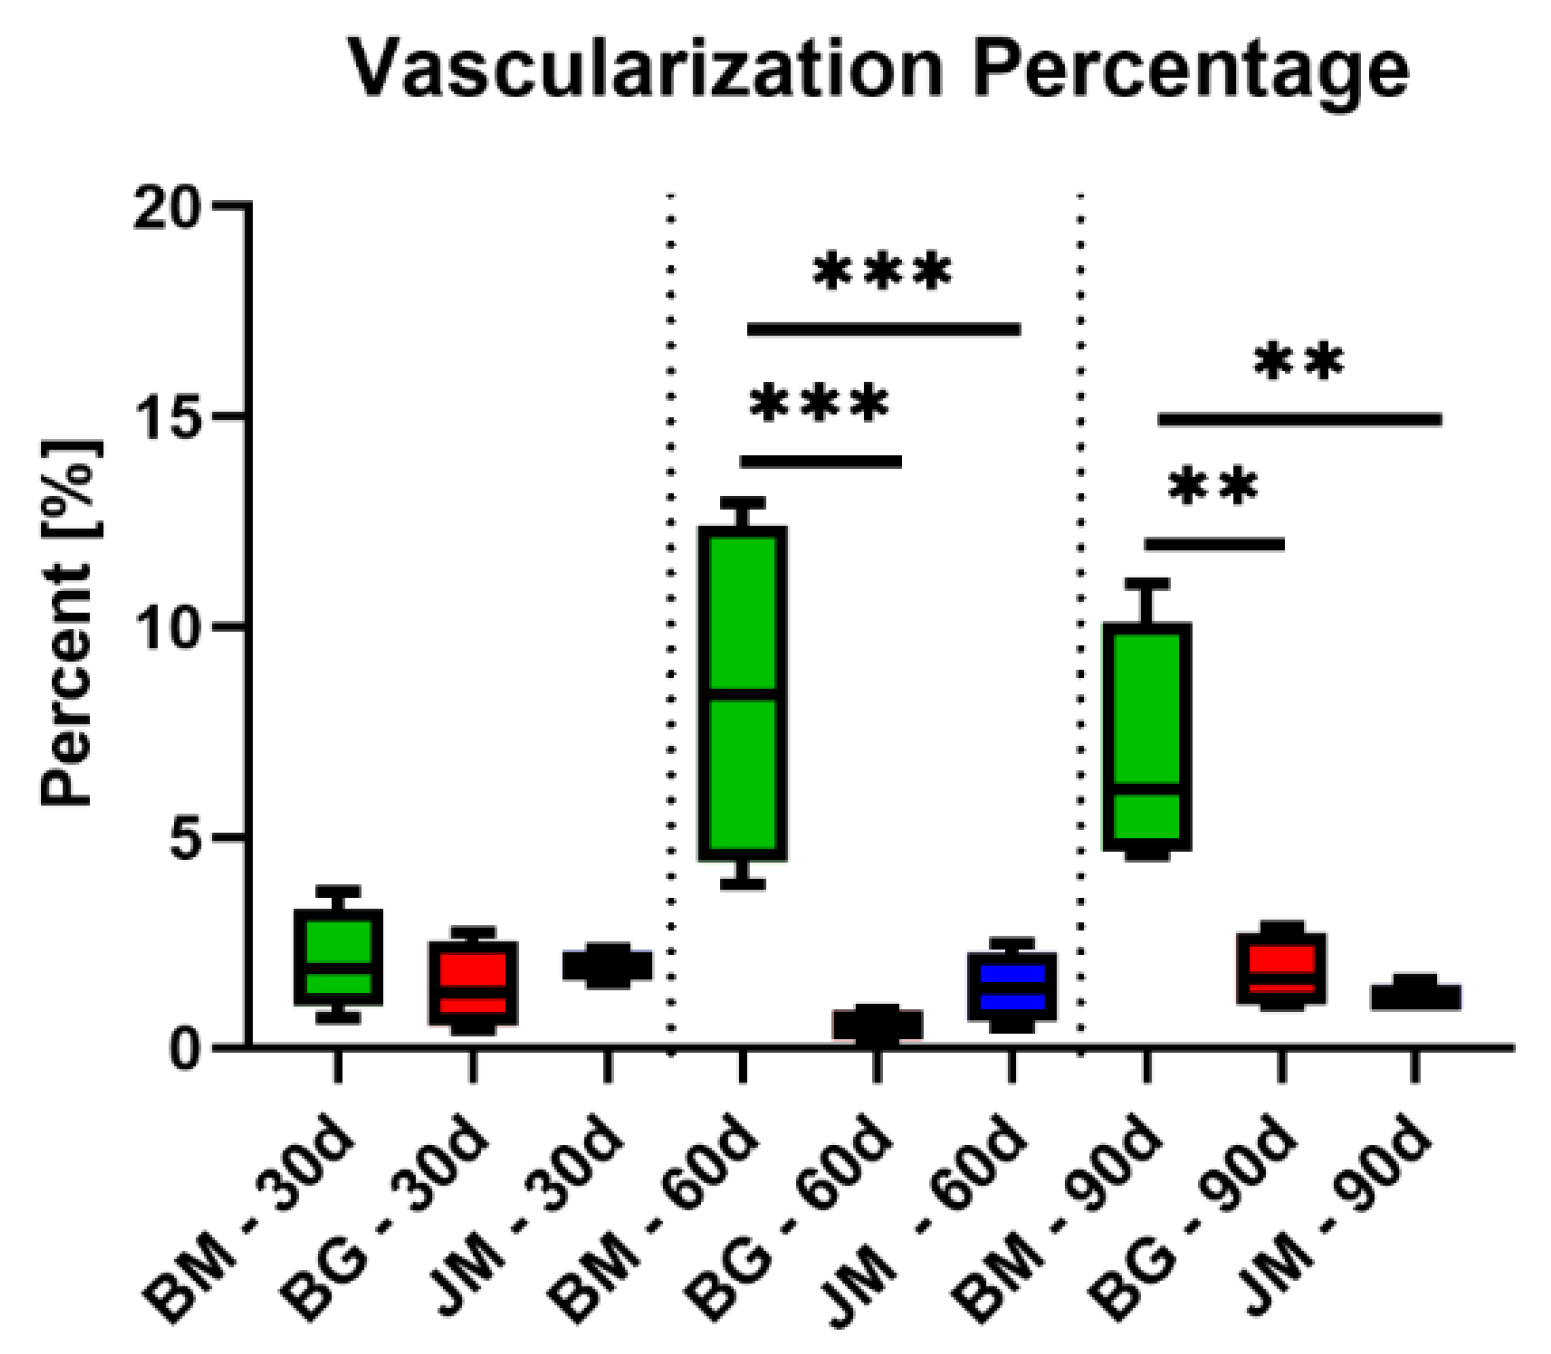
Figure 17.
Results of the histomorphometrical measurements of the percent vascularization of the membrane areas (* = intraindividual differences; **: p < 0.01 and ***: p < 0.0001). BM: bovine membrane, JM: Jason® membrane, BG: Bio-Gide®.
Figure 17.
Results of the histomorphometrical measurements of the percent vascularization of the membrane areas (* = intraindividual differences; **: p < 0.01 and ***: p < 0.0001). BM: bovine membrane, JM: Jason® membrane, BG: Bio-Gide®.
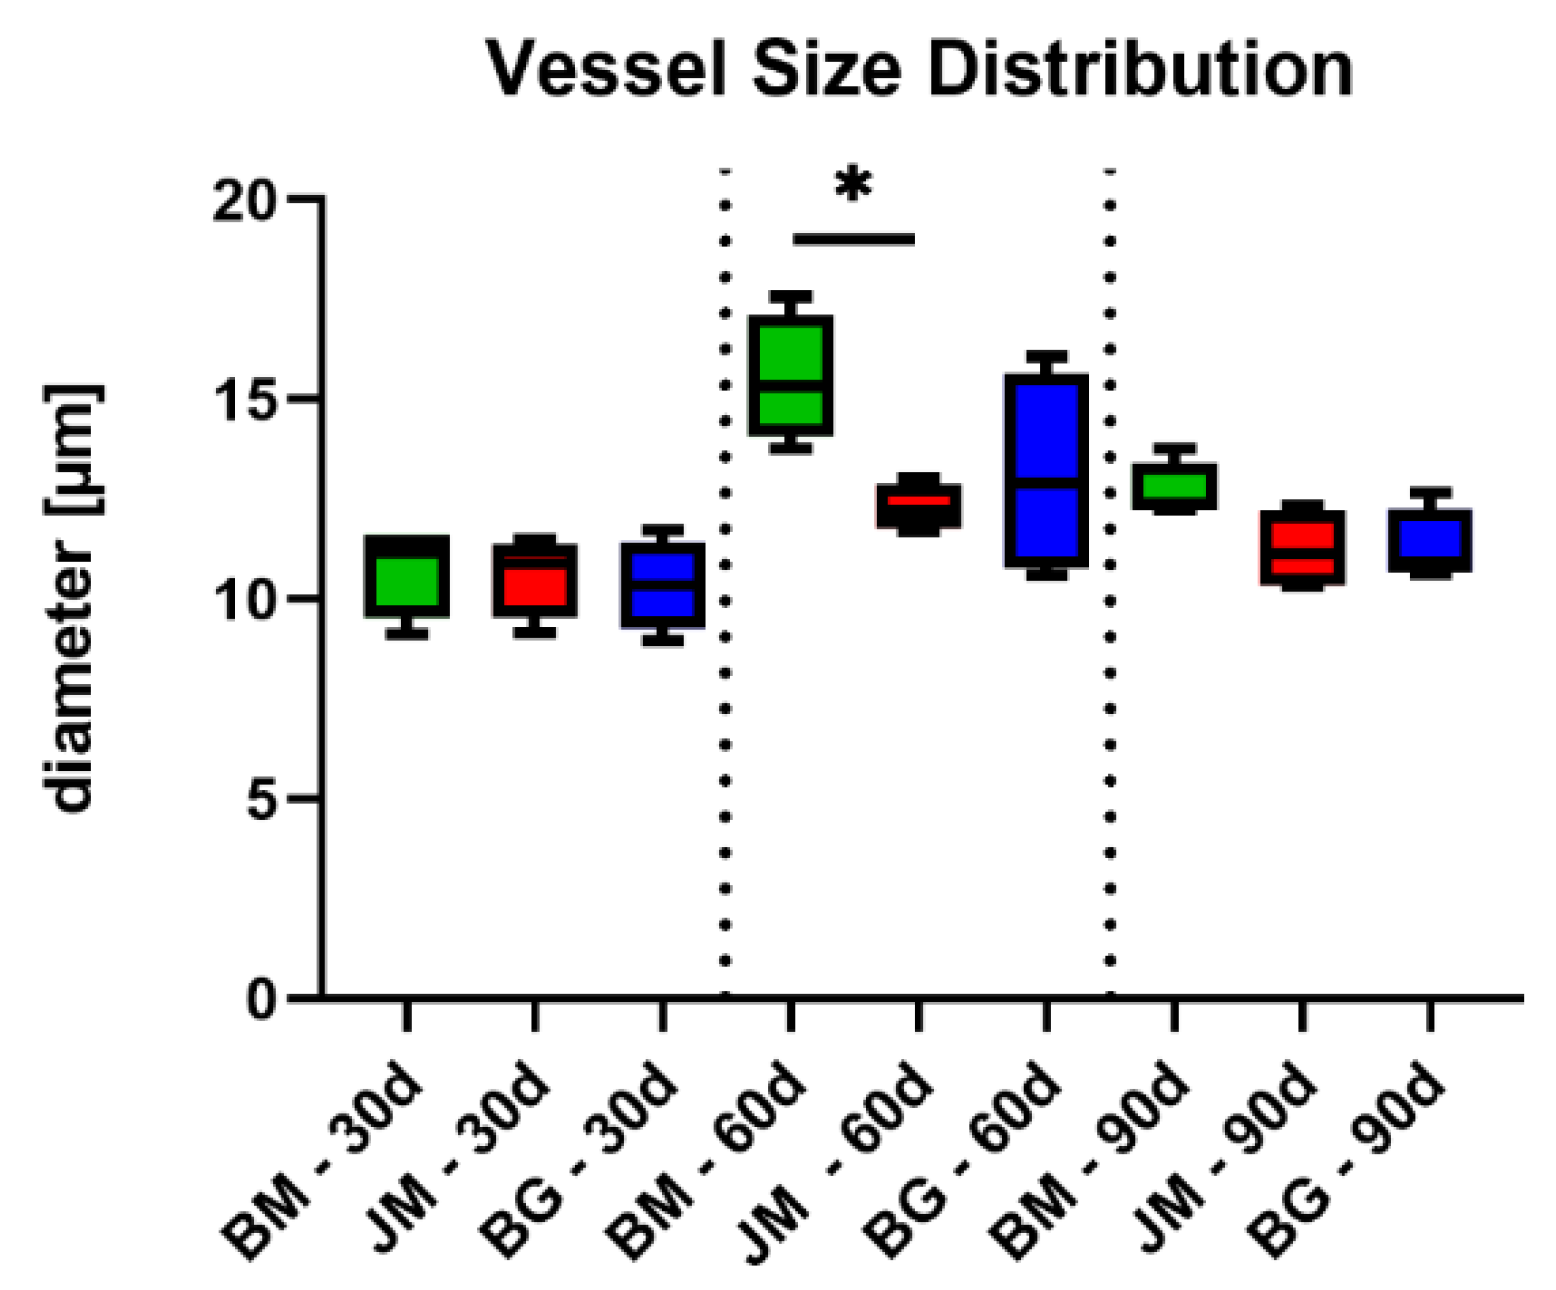
Figure 18.
Results of the histomorphometrical measurements of the vessel sizes within the membrane areas (* = intraindividual differences; *: p < 0.05). BM: bovine membrane, JM: Jason® membrane, BG: Bio-Gide®.
Figure 18.
Results of the histomorphometrical measurements of the vessel sizes within the membrane areas (* = intraindividual differences; *: p < 0.05). BM: bovine membrane, JM: Jason® membrane, BG: Bio-Gide®.
Table 1.
Test and Control Article Descriptions.
Table 1.
Test and Control Article Descriptions.
| Function | Name | Description | Implant Sizes
(mm × mm) |
|---|
| Test Article | Bovine membrane | Native dermis-based
Collagen membrane | 10.0 × 10.0 |
| Positive Control 1 | Bio-Gide® membrane | Native dermis-based
collagen membrane | 10.0 × 10.0 |
| Positive Control 2 | Jason® membrane | Native pericardium-based
collagen membrane | 10.0 × 10.0 |
| Negative Control | Sham operation | without biomaterial insertion | - |
Table 2.
Histologic Evaluation System for Irritancy/Reactivity—Cell Type/Response.
Table 2.
Histologic Evaluation System for Irritancy/Reactivity—Cell Type/Response.
| Response | Score (phf = Per High Powered (×400) Field) |
|---|
| 0 | 1 | 2 | 3 | 4 |
|---|
| Polymorphonuclear cells | 0 | Rare, 1–5/phf | 6–10/phf | Heavy infiltrate | Packed |
| Lymphocytes | 0 | Rare, 1–5/phf | 6–10/phf | Heavy infiltrate | Packed |
| Plasma cells | 0 | Rare, 1–5/phf | 6–10/phf | Heavy infiltrate | Packed |
| Macrophages | 0 | Rare, 1–5/phf | 6–10/phf | Heavy infiltrate | Packed |
| Giant cells | 0 | Rare, 1–2/phf | 3–5/phf | Heavy infiltrate | Packed |
| Necrosis | 0 | Minimal | Mild | Moderate | Marked |
| Neovascularization | 0 | Minimal capillary proliferation focal, 1–3 buds | Groups of 4–7 capillaries with supporting fibroblastic structures | Broad band of capillaries with supporting structures | Extensive band of capillaries with supporting fibroblastic structures |
| Fibrocytes/fibroconnective tissue, fibrosis | 0 | Narrow band | Moderately thick band | Thick band | Extensive band |
| Fatty infiltrate | 0 | Minimal amount of fat associated with fibrosis | Several layers of fat and fibrosis | Elongated and broad accumulation of fat cells about the implant site | Extensive fat completely surrounding the implant |
| Irritancy score = (Polymorphonuclear Cells + Lymphocytes + Plasma Cells + Macrophages + Giant Cells + Necrosis) × 2 + (Neovascularization + Fibrosis + Fatty Infiltrate). |
Table 3.
Irritancy/Reactivity Grade. Adapted from DIN EN ISO 10993-6.
Table 3.
Irritancy/Reactivity Grade. Adapted from DIN EN ISO 10993-6.
| Overall Irritancy Score | Irritancy/Reactivity Status |
|---|
| 0.0 to 2.9 | Minimal or no reaction (non-irritant) |
| 3.0 to 8.9 | Slight reaction (slight irritant) |
| 9.0 to 15.0 | Moderate reaction (moderate irritant) |
| >15.1 | Severe reaction (severe irritant) |
Table 4.
Results of the biomaterial scoring evaluations at 10 days post implantationem. BM: bovine-based membrane, BG: Bio-Gide® membrane, JM: Jason® membrane, and SO: sham operation.
Table 4.
Results of the biomaterial scoring evaluations at 10 days post implantationem. BM: bovine-based membrane, BG: Bio-Gide® membrane, JM: Jason® membrane, and SO: sham operation.
| Parameter | Mean ± SD—Inflammation and Inflammatory Cell Types at Day 10 |
|---|
| BM | JM | BG | SO |
|---|
| Polymorphonuclear Cells | 1.00 ± 0.8 | 0.30 ± 0.1 | 0.40 ± 0.1 | 0.38 ± 0.1 |
| Lymphocytes | 0.75 ± 0.3 | 0.40 ± 0.1 | 0.70 ± 0.3 | 0.63 ± 0.3 |
| Plasma Cells | 0.00 ± 0.0 | 0.00 ± 0.0 | 0.00 ± 0.0 | 0.21 ± 0.1 |
| Macrophages | 2.00 ± 0.0 | 1.50 ± 0.4 | 1.80 ± 0.3 | 1.58 ± 0.4 |
| Giant Cells | 0.67 ± 0.3 | 0.40 ± 0.2 | 0.25 ± 0.2 | 0.00 ± 0.0 |
| Neovascularization | 0.67 ± 0.3 | 0.90 ± 0.2 | 0.60 ± 0.2 | 1.08 ± 0.4 |
| Fibrosis | 0.00 ± 0.0 | 0.10 ± 0.2 | 0.10 ± 0.2 | 0.00 ± 0.0 |
| Fatty infiltrate | 0.00 ± 0.0 | 0.00 ± 0.0 | 0.00 ± 0.0 | 0.00 ± 0.0 |
| Necrosis | 0.00 ± 0.0 | 0.00 ± 0.0 | 0.00 ± 0.0 | 0.00 ± 0.0 |
Table 5.
Results of the biomaterial scoring evaluation at 30 days post implantationem. BM: bovine-based membrane, BG: Bio-Gide® membrane, JM: Jason® membrane, and SO: sham operation.
Table 5.
Results of the biomaterial scoring evaluation at 30 days post implantationem. BM: bovine-based membrane, BG: Bio-Gide® membrane, JM: Jason® membrane, and SO: sham operation.
| Parameter | Mean ± SD—Inflammation and Inflammatory Cell Types at Day 30 |
|---|
| BM | JM | BG | SO |
|---|
| Polymorphonuclear Cells | 0.29 ± 0.1 | 0.29 ± 0.2 | 0.50 ± 0.3 | 0.45 ± 0.1 |
| Lymphocytes | 0.96 ± 0.7 | 1.00 ± 0.5 | 0.67 ± 0.5 | 0.60 ± 0.5 |
| Plasma Cells | 0.00 ± 0.0 | 0.00 ± 0.0 | 0.00 ± 0.0 | 0.1 ± 0.1 |
| Macrophages | 1.83 ± 0.3 | 2.08 ± 0.2 | 2.00 ± 0.7 | 1.80 ± 0.3 |
| Giant Cells | 0.58 ± 0.3 | 0.13 ± 0.1 | 0.58 ± 0.6 | 0.05 ± 0.1 |
| Neovascularization | 0.08 ± 0.1 | 0.17 ± 0.1 | 0.20 ± 0.2 | 1.30 ± 0.4 |
| Fibrosis | 0.00 ± 0.0 | 0.04 ± 0.1 | 0.20 ±0.2 | 0.00 ± 0.0 |
| Fatty infiltrate | 0.00 ± 0.0 | 0.00 ± 0.0 | 0.08 ± 0.1 | 0.55 ± 0.3 |
| Necrosis | 0.04 ± 0.1 | 0.04 ± 0.1 | 0.00 ± 0.0 | 0.00 ± 0.0 |
Table 6.
Results of the biomaterial scoring evaluation at 60 days post implantationem. BM: bovine-based membrane, BG: Bio-Gide® membrane, JM: Jason® membrane, and SO: sham operation.
Table 6.
Results of the biomaterial scoring evaluation at 60 days post implantationem. BM: bovine-based membrane, BG: Bio-Gide® membrane, JM: Jason® membrane, and SO: sham operation.
| Parameter | Mean ± SD—Inflammation and Inflammatory Cell Types at Day 60 |
|---|
| BM | JM | BG | SO |
|---|
| Polymorphonuclear Cells | 0.25 ± 0.2 | 0.75 ± 0.5 | 0.50 ± 0.4 | 0.67 ± 0.2 |
| Lymphocytes | 0.58 ± 0.5 | 0.54 ± 0.2 | 0.33 ± 0.1 | 0.50 ± 0.2 |
| Plasma Cells | 0.00 ± 0.0 | 0.00 ± 0.0 | 0.00 ± 0.0 | 0.0 ± 0.0 |
| Macrophages | 2.08 ± 0.4 | 1.50 ± 0.4 | 1.08 ± 0.2 | 1.33 ± 0.4 |
| Giant Cells | 0.67 ± 0.5 | 0.08 ± 0.1 | 0.08 ± 0.1 | 0.00 ± 0.0 |
| Neovascularization | 0.42 ± 0.1 | 0.08 ± 0.1 | 0.08 ± 0.1 | 0.83 ± 0.4 |
| Fibrosis | 0.13 ± 0.1 | 0.00 ± 0.0 | 0.13 ± 0.14 | 0.00 ± 0.0 |
| Fatty infiltrate | 0.17 ± 0.1 | 0.00 ± 0.0 | 0.04 ± 0.1 | 0.33 ± 0.4 |
| Necrosis | 0.00 ± 0.0 | 0.00 ± 0.0 | 0.00 ± 0.0 | 0.00 ± 0.0 |
Table 7.
Results of the biomaterial scoring evaluation at 90 days post implantationem. BM: bovine-based membrane, BG: Bio-Gide® membrane, JM: Jason® membrane, and SO: sham operation.
Table 7.
Results of the biomaterial scoring evaluation at 90 days post implantationem. BM: bovine-based membrane, BG: Bio-Gide® membrane, JM: Jason® membrane, and SO: sham operation.
| Parameter | Mean ± SD—Inflammation and Inflammatory Cell Types at Day 90 |
|---|
| BM | JM | BG | SO |
|---|
| Polymorphonuclear Cells | 0.33 ± 0.1 | 0.75 ± 0.4 | 0.96 ± 0.3 | 0.33 ± 0.1 |
| Lymphocytes | 0.83 ± 0.4 | 0.41 ± 0.3 | 0.54 ± 0.3 | 0.33 ± 0.1 |
| Plasma Cells | 0.00 ± 0.0 | 0.00 ± 0.0 | 0.00 ± 0.0 | 0.0 ± 0.0 |
| Macrophages | 1.92 ± 0.2 | 1.17 ± 0.3 | 1.08 ± 0.2 | 0.54 ± 0.3 |
| Giant Cells | 0.83 ± 0.4 | 0.08 ± 0.1 | 0.29 ± 0.2 | 0.00 ± 0.0 |
| Neovascularization | 0.58 ±0.2 | 0.13 ± 0.1 | 0.08 ± 0.1 | 0.46 ± 0.2 |
| Fibrosis | 0.00 ± 0.0 | 0.00 ± 0.0 | 0.17 ± 0.1 | 0.00 ± 0.0 |
| Fatty infiltrate | 0.08 ± 0.1 | 0.17 ± 0.1 | 0.17 ± 0.1 | 0.42 ± 0.1 |
| Necrosis | 0.00 ± 0.0 | 0.00 ± 0.0 | 0.00 ± 0.0 | 0.00 ± 0.0 |
Table 8.
Irritancy scores and irritancy status of the bovine-derived membrane at 10-, 30-, 60-, and 90-days post implantationem.
Table 8.
Irritancy scores and irritancy status of the bovine-derived membrane at 10-, 30-, 60-, and 90-days post implantationem.
| | Study
Group | Treatment Irritancy Score | Overall Irritancy Score | Irritant Status |
|---|
| Day 10 | BM | 9.50 | 2.90 | Non-irritant |
| JM | 6.20 | 6.60 | - |
| BG | 7.00 | - |
| SO | 6.67 | - | - |
| Day 30 | BM | 7.50 | 0.0 | Non-irritant |
| JM | 7.29 | 7.61 | - |
| BG | 7.92 | - |
| SO | 7.85 | - | - |
| Day 60 | BM | 7.88 | 2.84 | Non-irritant |
| JM | 5.83 | 5.04 | - |
| BG | 4.25 | - |
| SO | 6.17 | - | - |
| Day 90 | BM | 8.50 | 2.85 | Non-irritant |
| JM | 5.12 | 5.65 | - |
| BG | 6.17 | - |
| SO | 3.29 | - | - |
Table 9.
Results of the Thickness Measurements.
Table 9.
Results of the Thickness Measurements.
| Membrane/Time Point | Thickness (mm) |
|---|
| Day 10 | Day 30 | Day 60 | Day 90 |
|---|
| BM | 0.54 ± 0.15 | 0.77 ± 0.22 | 0.59 ± 0.18 | 0.36 ± 0.13 |
| JM | 0.20 ± 0.04 | 0.28 ± 0.07 | 0.31 ± 0.05 | 0.26 ± 0.11 |
| BG | 0.45 ± 0.10 | 0.26 ± 0.09 | 0.27 ± 0.08 | 0.22 ± 0.05 |
Table 10.
Results of the Macrophage Measurements/Immune Responses.
Table 10.
Results of the Macrophage Measurements/Immune Responses.
| Membrane/Time Point | Day 10 | Day 30 | Day 60 | Day 90 |
|---|
| CD163 (cells/mm2) |
| BM |
848.9 ± 26.7
|
797.4 ± 273.4
|
673.0 ± 105.9
|
704.2 ± 146.3
|
| JM |
970.9 ± 300.4
|
933.3 ± 110.0
|
567.9 ± 75.3
|
531.8 ± 121.7
|
| BG |
1303.0 ± 592.1
|
766.5 ± 199.1
|
423.7 ± 78.2
|
534.2 ± 166.5
|
| SO |
708.7 ± 65.6
|
1123.0 ± 99.3
|
766.6 ± 34.0
|
572.3 ± 290.4
|
| CD11c (cells/mm2) |
| BM |
173.3 ± 56.2
|
52.3 ± 26.2
|
104.3 ± 62.2
|
65.8 ± 34.7
|
| JM |
137.7 ± 65.6
|
140.3 ± 82.0
|
90.5 ± 70.0
|
59.1 ± 23.2
|
| BG |
382.2 ± 204.3
|
148.6 ± 111.0
|
148.5 ± 50.0
|
104.3 ± 20.4
|
| SO |
162.7 ± 91.5
|
109.6 ± 42.0
|
82.8 ± 64.2
|
56.3 ± 36.6
|
Table 11.
Histomorphometrical results of the membrane vascularization. (BM: native bovine membrane, JM: Jason® membrane, BG; Bio-Gide® membrane).
Table 11.
Histomorphometrical results of the membrane vascularization. (BM: native bovine membrane, JM: Jason® membrane, BG; Bio-Gide® membrane).
| | Day 30 | Day 60 | Day 90 |
|---|
| BM | Vessel Density (vessels/mm2) |
| 182.6 ± 47.73 | 291.0 ± 67.80 | 332.30 ± 114.70 |
| Vessel Percentage (%) |
| 2.055 ± 1.246 | 8.405 ± 4.169 | 6.978 ± 2.955 |
| Vessel Diameter (µm) |
| 10.78 ± 1.179 | 15.51 ± 1.587 | 12.67 ± 0.7209 |
| JM | Vessel Density (vessels/mm2) |
| 221.4 ± 64.56 | 120.70 ± 39.53 | 112.20 ± 23.15 |
| Vessel Percentage (%) |
| 1.978 ± 0.365 | 1.448 ± 0.8435 | 1.163 ± 0.3278 |
| Vessel Diameter (µm) |
| 10.61 ± 1.019 | 12.29 ± 0.5697 | 11.23 ± 1.008 |
| BG | Vessel Density (vessels/mm2) |
| 212.9 ± 131.7 | 53.52 ± 32.52 | 211.00 ± 125.80 |
| Vessel Percentage (%) |
| 1.455 ± 1.065 | 0.5575 ± 0.4081 | 1.803 ± 0.9028 |
| Vessel Diameter (µm) |
| 10.34 ± 1.065 | 13.13 ± 2.585 | 11.28 ± 0.9466 |


 ,
, 


