
Immunological Characteristics of Non-Intensive Care Hospitalized COVID-19 Patients: A Preliminary Report

 , ,
, ,
Abstract
:1. Introduction
2. Methods
2.1. Data Collection
2.2. Microbiology
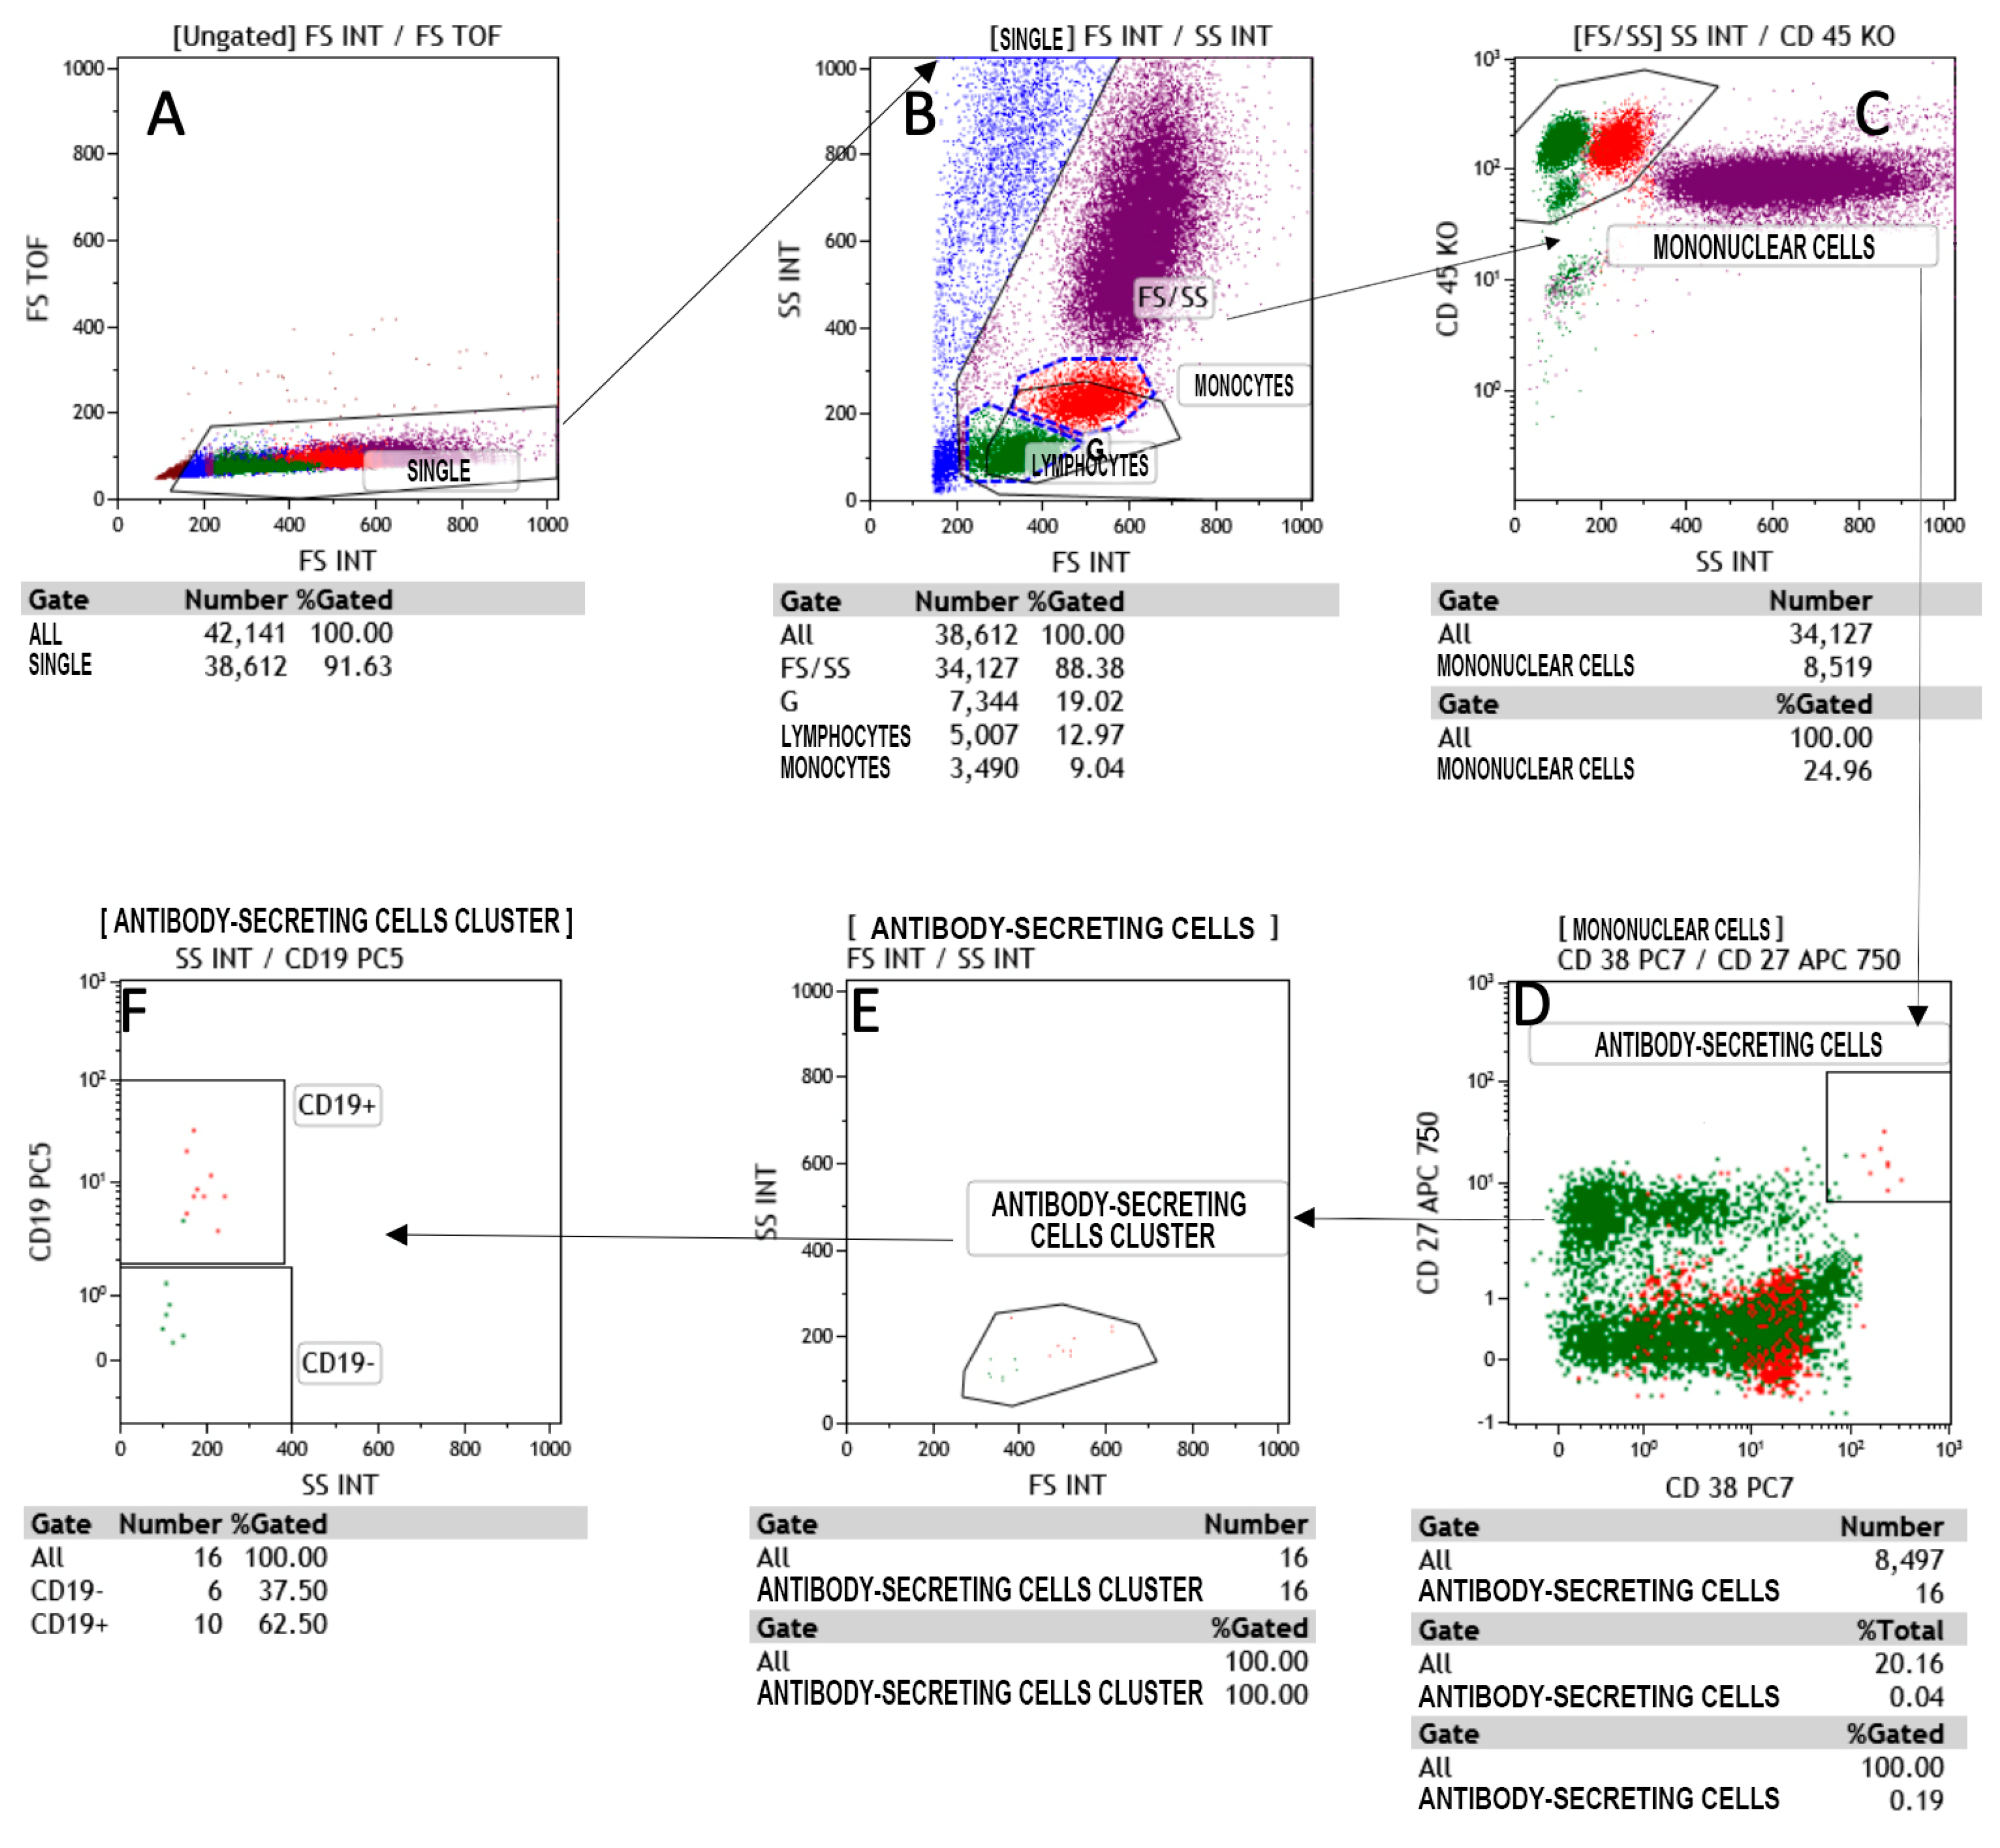
2.3. Flow Cytometry
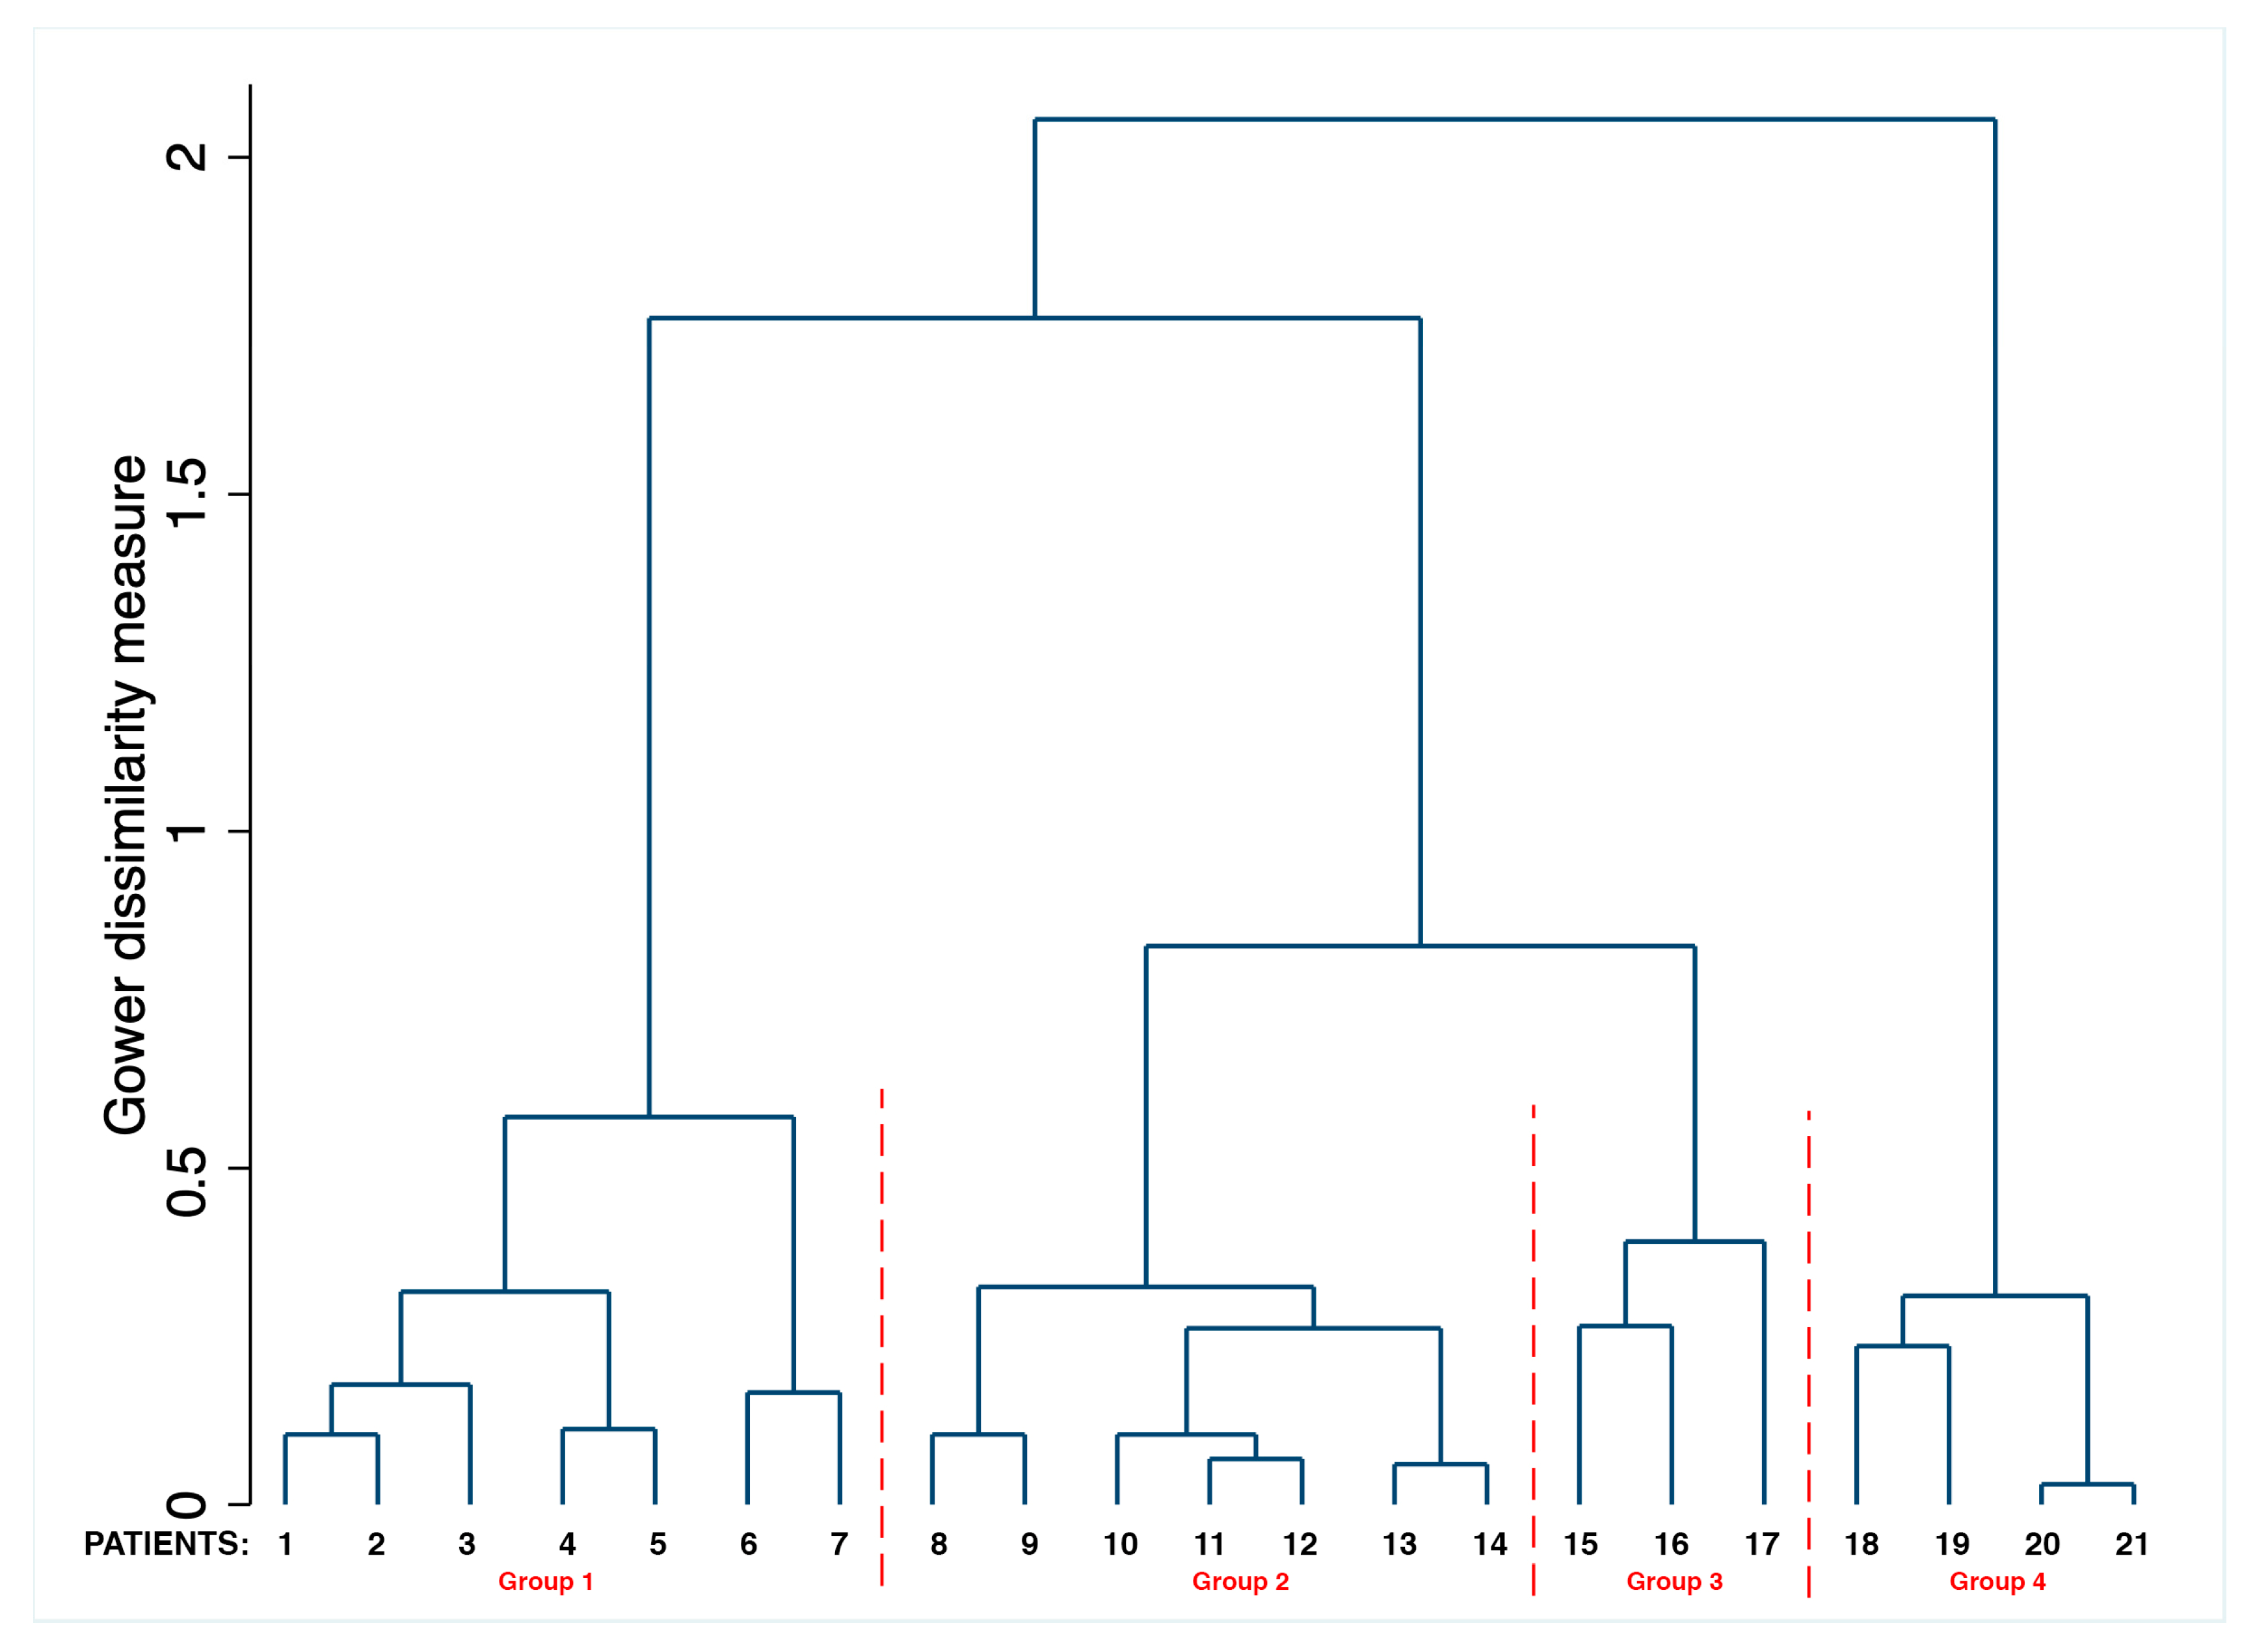
2.4. Statistical Analysis
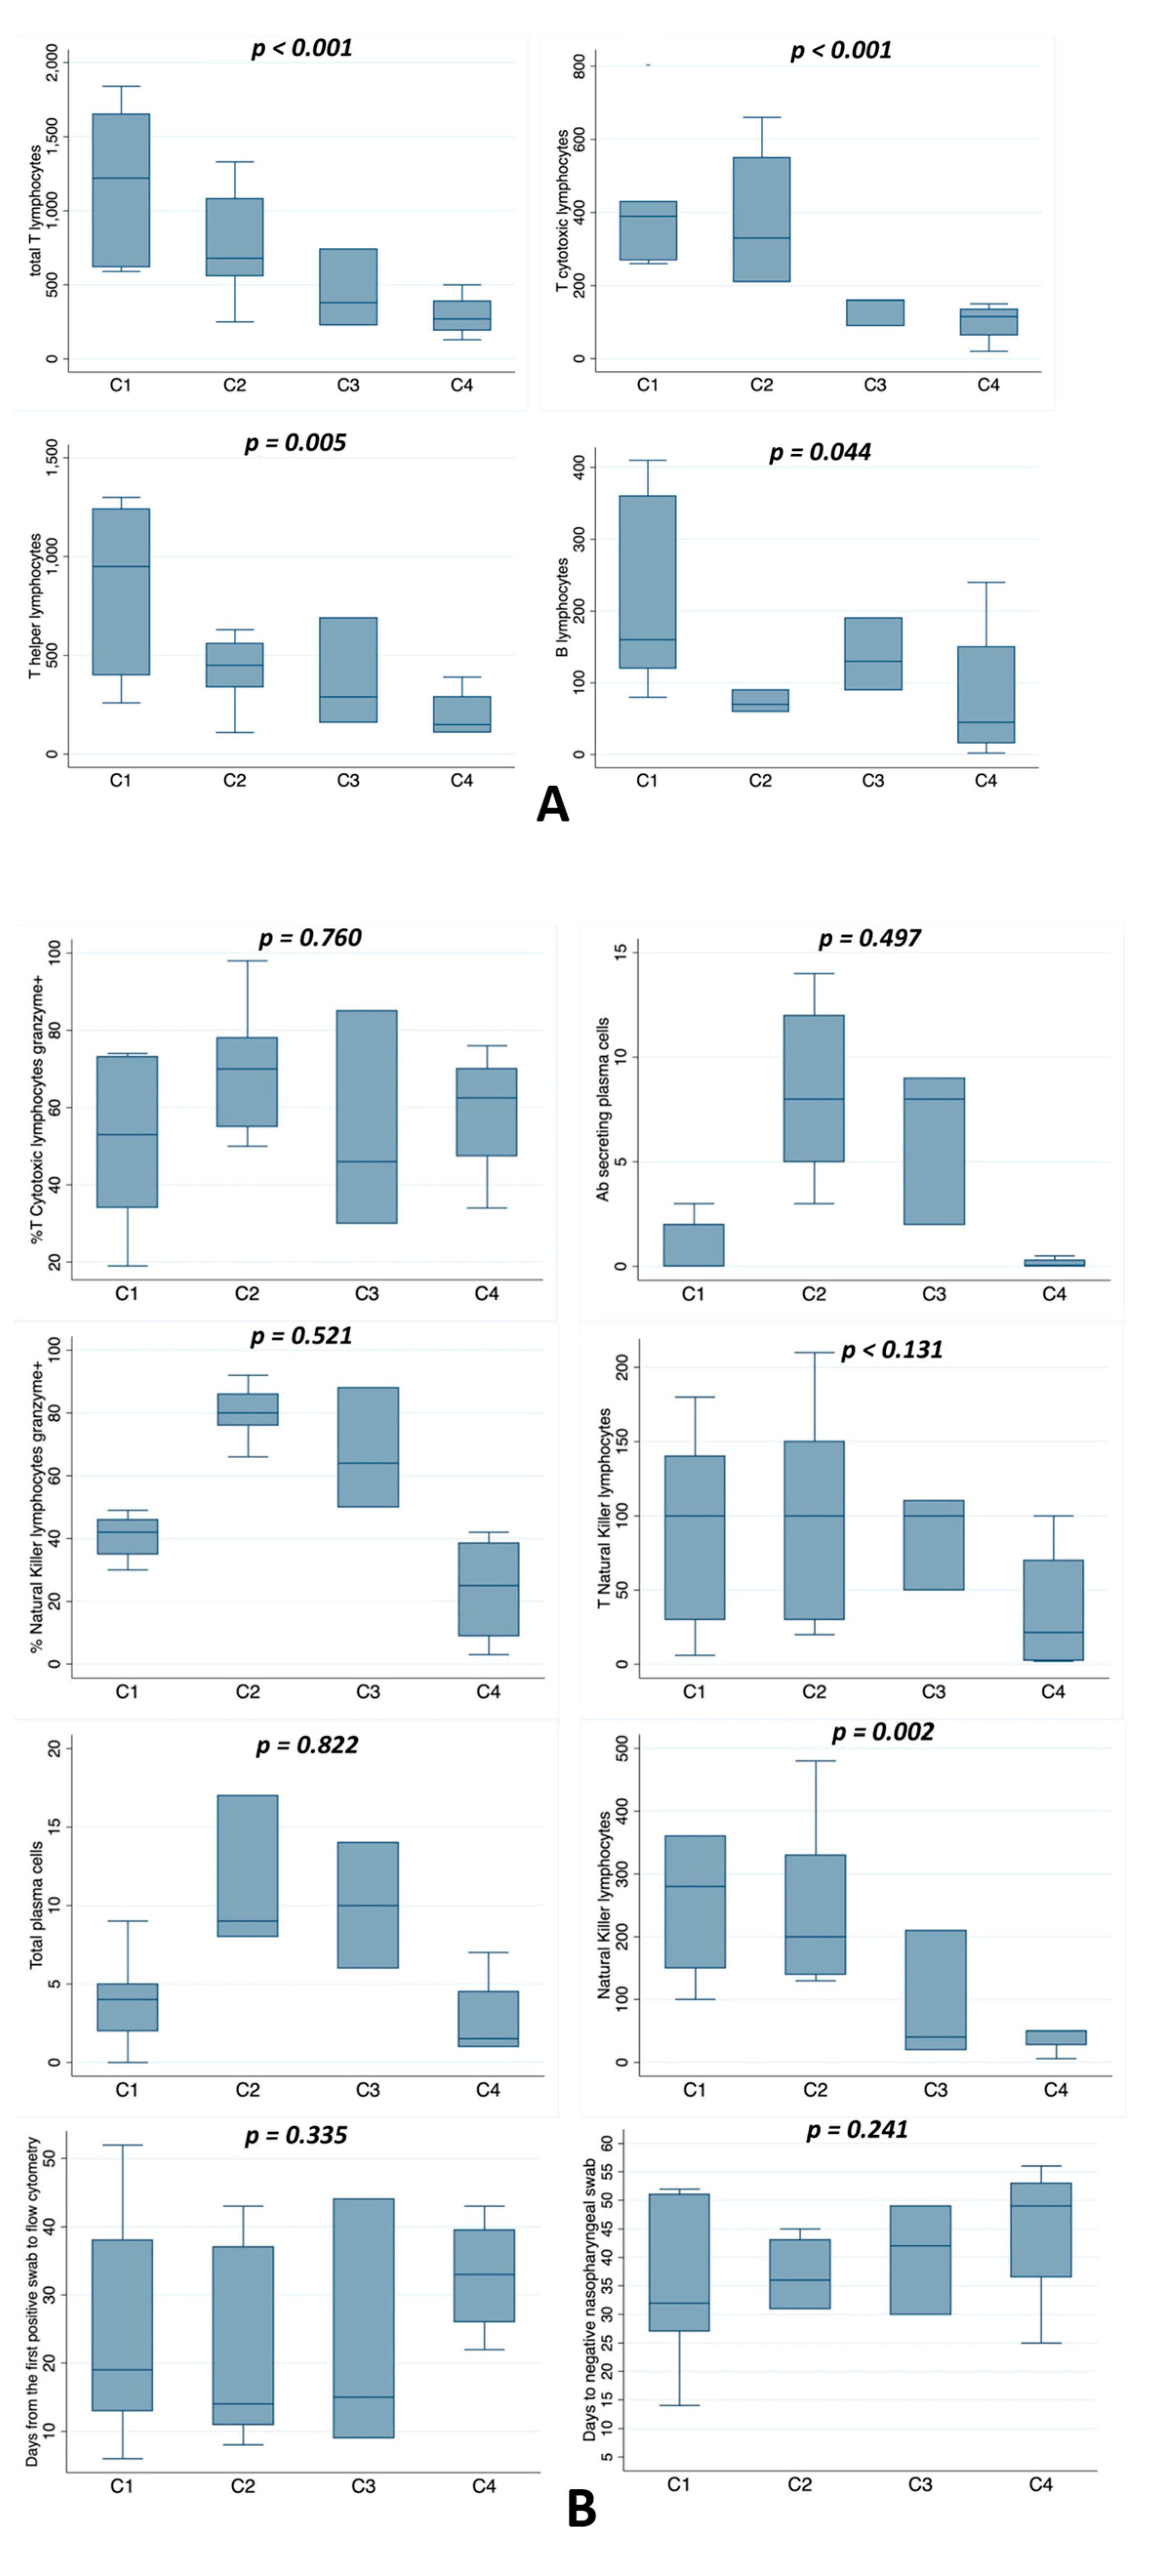
3. Results
4. Discussion
Author Contributions
Funding
Institutional Review Board Statement
Informed Consent Statement
Conflicts of Interest
References
- Wang, D.; Hu, B.; Hu, C.; Zhu, F.; Liu, X.; Zhang, J.; Wang, B.; Xiang, H.; Cheng, Z.; Xiong, Y.; et al. Clinical Characteristics of 138 Hospitalized Patients With 2019 Novel Coronavirus-Infected Pneumonia in Wuhan, China. JAMA 2020, 323, 1061–1069. [Google Scholar] [CrossRef]
- WHO Coronavirus Disease (COVID-19) Dashboard. Available online: https://covid19.who.int/ (accessed on 13 December 2020).
- Shi, Y.; Wang, Y.; Shao, C.; Huang, J.; Gan, J.; Huang, X.; Bucci, E.; Piacentini, M.; Ippolito, G.; Melino, G. COVID-19 infection: The perspectives on immune responses. Cell Death Differ. 2020, 27, 1451–1454. [Google Scholar] [CrossRef] [Green Version]
- Jesenak, M.; Brndiarova, M.; Urbancikova, I.; Rennerova, Z.; Vojtkova, J.; Bobcakova, A.; Ostro, R.; Banovcin, P. Immune Parameters and COVID-19 Infection-Associations with Clinical Severity and Disease Prognosis. Front Cell Infect Microbiol. 2020, 30, 364. [Google Scholar] [CrossRef]
- Conti, P.; Ronconi, G.; Caraffa, A.; Gallenga, C.E.; Ross, R.; Frydas, I.; Kritas, S.K. Induction of proinflammatory cytokines (IL-1 and IL-6) and lung inflammation by Coronavirus-19 (COVI-19 or SARS-CoV-2): Anti-inflammatory strategies. J. Biol. Regul. Homeost. Agents 2020, 34, 327–331. [Google Scholar]
- Chen, G.; Wu, D.; Guo, W.; Cao, Y.; Huang, D.; Wang, H.; Wang, T.; Zhang, X.; Chen, H.; Yu, H.; et al. Clinical and immunological features of severe and moderate coronavirus disease 2019. J. Clin. Investig. 2020, 130, 2620–2629. [Google Scholar] [CrossRef] [Green Version]
- Gong, J.; Dong, H.; Xia, Q.S.; Huang, Z.Y.; Wang, D.K.; Zhao, Y.; Liu, W.H.; Tu, S.H.; Zhang, M.M.; Wang, Q.; et al. Correlation analysis between disease severity and inflammation-related parameters in patients with COVID-19: A retrospective study. BMC Infect Dis. 2020, 21, 963. [Google Scholar]
- Wang, F.; Nie, J.; Wang, H.; Zhao, Q.; Xiong, Y.; Deng, L.; Song, S.; Ma, Z.; Mo, P.; Zhang, Y. Characteristics of Peripheral Lymphocyte Subset Alteration in COVID-19 Pneumonia. J. Infect Dis. 2020, 11, 1762–1769. [Google Scholar] [CrossRef] [Green Version]
- Thevarajan, I.; Nguyen, T.H.O.; Koutsakos, M.; Druce, J.; Caly, L.; van de Sandt, C.E.; Jia, X.; Nicholson, S.; Catton, M.; Cowie, B.; et al. Breadth of concomitant immune responses prior to patient recovery: A case report of non-severe COVID-19. Nat. Med. 2020, 4, 453–455. [Google Scholar] [CrossRef] [PubMed] [Green Version]
- Heng, H.Y.; Zhang, M.; Yang, C.X.; Zhang, N.; Wang, X.C.; Yang, X.P.; Dong, X.Q.; Zheng, Y.T. Elevated exhaustion levels and reduced functional diversity of T cells in peripheral blood may predict severe progression in COVID-19 patients. Cell Mol. Immunol. 2020, 17, 541–543. [Google Scholar]
- Sun, D.W.; Zhang, D.; Tian, R.H.; Li, Y.; Wang, Y.S.; Cao, J.; Tang, Y.; Zhang, N.; Zan, T.; Gao, L.; et al. The underlying changes and predicting role of peripheral blood inflammatory cells in severe COVID-19 patients: A sentinel? Clin. Chim. Acta 2020, 508, 122–129. [Google Scholar] [CrossRef]
- Xu, B.; Fan, C.Y.; Wang, A.L.; Zou, Y.L.; Yu, Y.H.; He, C.; Xia, W.G.; Zhang, J.X.; Miao, Q. Suppressed T cell-mediated immunity in patients with COVID-19: A clinical retrospective study in Wuhan, China. J. Infect. 2020, 81, e51–e60. [Google Scholar] [CrossRef] [PubMed]
- Diao, B.; Wang, C.; Tan, Y.; Chen, X.; Liu, Y.; Ning, L.; Chen, L.; Li, M.; Liu, Y.; Wang, G.; et al. Reduction and Functional Exhaustion of T Cells in Patients with Coronavirus Disease 2019 (COVID-19). Front Immunol. 2020, 11, 827. [Google Scholar] [CrossRef] [PubMed]
- Bocsi, J.; Melzer, S.; Dahnert, I.; Tarnok, A. OMIP-023:10-color, 13 antibody panel for in-depth phenotyping of human peripheral blood leukocytes. Cytometry 2014, 85, 781–784. [Google Scholar] [CrossRef] [PubMed]
- Maecker, H.T.; McCoy, J.P.; Nussenblatt, R. Standardizing immunophenotyping for the human immunology project. Nat. Rev. Immunol. 2012, 12, 191–200. [Google Scholar] [CrossRef] [PubMed] [Green Version]
- Finak, G.; Langweiler, M.; Jaimes, M.; Malek, M.; Taghiyar, J.; Korin, Y.; Raddassi, K.; Devine, L.; Obermoser, G.; Pekalski, M.L.; et al. Standadizing flow cytometry immunophenotyping analysis from the human immunophetyping consortium. Sci. Rep. 2016, 6, 20686. [Google Scholar] [CrossRef] [Green Version]
- Treitz, M.; Miloud, T.; Kapinsky, M.; Magari, R.; Geissler, E.K.; Hutchinson, J.A.; Cogt, K.; Schlickeiser, S.; Kvenerland, A.H.; Meisel, C.; et al. Standardization of whole blood immune phenotype monitoring for clinical trials: Panels and method from the ONE study. Transpl. Res. 2013, 2, 17. [Google Scholar] [CrossRef] [Green Version]
- Forman, A.K. Die Latent Class Analyse: Einfuhurung in die Theorie and Anwendung; Beitz: Weinheim, Germany, 1984. [Google Scholar]
- Ward, J.H., Jr. Hierarchical Grouping to Optimize an Objective Function. J. Am. Stat. Assoc. 1963, 58, 236–244. [Google Scholar] [CrossRef]
- Van Eeden, C.; Khan, L.; Osman, M.S.; Tervaert, J.W.C. Natural Killer Cell Dysfunction and its Role in COVID-19. Int. J. Mol. Sci. 2020, 21, 6351. [Google Scholar] [CrossRef]
- Chen, Z.; Wherry, E.J. T cell responses in patients with COVID-19. Nat. Rev. Immunol. 2020, 20, 529–536. [Google Scholar] [CrossRef]
- Liu, Y.; Yang, Y.; Zhang, C.; Huang, F.; Wang, F.; Yuan, J.; Wang, Z.; Li, J.; Li, J.; Feng, C.; et al. Clinical and biochemical indexes from 2019-nCoV infected patients linked to viral loads and lung injury. Sci. China Life Sci. 2020, 63, 364–374. [Google Scholar] [CrossRef] [Green Version]
- Zheng, M.; Gao, Y.; Wang, G.; Song, G.; Liu, S.; Sun, D.; Xu, Y.; Tian, Z. Functional exhaustion of antiviral lymphocytes in COVID-19 patients. Cell Mol. Immunol. 2020, 17, 533–535. [Google Scholar] [CrossRef] [Green Version]
- Cifaldi, L.; Prencipe, G.; Caiello, I.; Bracaglia, C.; Locatelli, F.; De Benedetti, F.; Strippoli, R. Inhibition of natural killer cell cytotoxicity by interleukin-6: Implications for the pathogenesis of macrophage activation syndrome. Arthritis Rheumatol. 2015, 67, 3037–3046. [Google Scholar] [CrossRef]
- Mazzoni, A.; Salvati, L.; Maggi, L.; Capone, M.; Vanni, A.; Spinicci, M.; Mencarini, J.; Caporale, R.; Peruzzi, B.; Antonelli, A.; et al. Impaired immune cell cytotoxicity in severe COVID-19 is IL-6 dependent. J. Clin. Investig. 2020, 130, 4694–4703. [Google Scholar] [CrossRef]
- Wu, C.; Chen, X.; Cai, Y.; Xia, J.; Zhou, X.; Xu, S.; Huang, H.; Zhang, L.; Zhou, X.; Du, C.; et al. Risk Factors Associated with Acute Respiratory Distress Syndrome and Death in Patients With Coronavirus Disease 2019 Pneumonia in Wuhan, China. JAMA Intern Med. 2020, 1, 934–943. [Google Scholar] [CrossRef] [Green Version]
- Ling, Y.; Xu, S.B.; Lin, Y., X.; Tian, D.; Zhu, Z.Q.; Dai, H.; Wu, F.; Song, Z.G.; Huang, W.; Chen, J.; et al. Persistence and clearance of viral RNA in 2019 novel coronavirus disease rehabilitation patients. Chin Med. J. 2020, 5, 1039–1043. [Google Scholar] [CrossRef] [PubMed]
- Jiang, M.; Guo, Y.; Luo, Q.; Huang, Z.; Zhao, R.; Liu, S.; Le, A.; Li, J.; Wan, L. T-Cell Subset Counts in Peripheral Blood Can Be Used as Discriminatory Biomarkers for Diagnosis and Severity Prediction of Coronavirus Disease 2019. J. Infect Dis. 2020, 29, 198–202. [Google Scholar] [CrossRef]
- Varnaitė, R.; García, M.; Glans, H.; Maleki, K.T.; Sandberg, J.T.; Tynell, J.; Christ, W.; Lagerqvist, N.; Asgeirsson, H.; Ljunggren, H.G.; et al. Expansion of SARS-CoV-2-Specific Antibody-Secreting Cells and Generation of Neutralizing Antibodies in Hospitalized COVID-19 Patients. J. Immunol. 2020, 2, ji2000717. [Google Scholar] [CrossRef]
- Lee, F.E.H.; Falsey, A.R.; Halliley, J.L.; Sanz, I.; Walsh, E.E. Circulating antibody-secreting cells during acute respiratory syncytial virus infection in adults. J. Infect. Dis. 2010, 202, 1659–1666. [Google Scholar] [CrossRef] [PubMed] [Green Version]
- Grifoni, A.; Weiskopf, D.; Ramirez, S.I.; Mateus, J.; Dan, J.M.; Moderbacher, C.R.; Rawlings, S.A.; Sutherland, A.; Premkumar, L.; Jadi, R.S.; et al. Targets of T Cell Responses to SARS-CoV-2 Coronavirus in Humans with COVID-19 Disease and Unexposed Individuals. Cell 2020, 25, 1489–1501.e15. [Google Scholar] [CrossRef] [PubMed]
- Braun, J.; Loyal, L.; Frentsch, M.; Wendisch, D.; Georg, P.; Kurth, F.; Hippenstiel, S.; Dingeldey, M.; Kruse, B.; Fauchere, F.; et al. SARS-CoV-2-reactive T cells in healthy donors and patients with COVID-19. Nature 2020, 587, 270–274. [Google Scholar] [CrossRef]
- Peng, Y.; Mentzer, A.J.; Liu, G.; Yao, X.; Yin, Z.; Dong, D.; Dejnirattisai, W.; Rostron, T.; Supasa, P.; Liu, C.; et al. Broad and strong memory CD4+ and CD8+ T cells induced by SARS-CoV-2 in UK convalescent individuals following COVID-19. Nat. Immunol. 2020, 21, 1336–1345. [Google Scholar] [CrossRef] [PubMed]
- Li, C.K.; Wu, H.; Yan, H.; Ma, S.; Wang, L.; Zhang, M.; Tang, X.; Temperton, N.J.; Weiss, R.A.; Brenchley, J.M.; et al. T cell responses to whole SARS coronavirus in humans. J. Immunol. 2008, 15, 5490–5500. [Google Scholar] [CrossRef] [PubMed] [Green Version]
- Wise, J. Covid-19: T cell response lasts for at least six months after infection, study shows. BMJ 2020, 371, m4257. [Google Scholar] [CrossRef] [PubMed]


| Variables | |
|---|---|
| n | 21 |
| Age § | 75 (61–81) |
| Men (%) | 47.6 |
| Low flow oxygen (%) | 66.7 |
| High flow oxygen (%) | 14.3 |
| Intensive care unit hospitalization (%) | 14.3 |
| Days from the first positive swab to flow cytometry § | 19 (13–37) |
| Days from the first positive swab to hospitalization § | 4 (2–10) |
| Days from first to last swab § | 42 (31–48) |
| Last positive swab (%) | 28.6 |
| Deaths (%) | 9.5 |
| Hospital stay § | 36 (30–43) |
| White blood cells (×103/μL) § | 5.1 (4.0–7.8) |
| Fever (%) | 57.1 |
| Asthenia (%) | 40.0 |
| Dry cough (%) | 26.7 |
| Myalgia and or arthralgia (%) | 26.7 |
| Dyspnea (%) | 20.0 |
| Chest Pain (%) | 13.3 |
| Anorexia (%) | 6.7 |
| Nausea (%) | 6.7 |
| Diarrhea (%) | 6.7 |
| Variables | |
|---|---|
| Hypertension (%) | 72.2 |
| Cerebrovascular disease (%) | 38.9 |
| COPD (%) | 33.3 |
| Atrial fibrillation (%) | 27.8 |
| Chronic renal failure (%) | 27.8 |
| Heart failure (%) | 27.8 |
| Dyslipidemia (%) | 22.2 |
| Ischemic heart disease (%) | 22.2 |
| Obesity (%) | 16.7 |
| Dementia (%) | 16.7 |
| Diabetes (%) | 16.7 |
| Metabolic syndrome (%) | 11.1 |
| Variables | |
|---|---|
| Total T lymphocytes § | 620 (380–1080) |
| Total T lymphocytes <1200 (%) | 76.2 |
| 1200 ≤ total T lymphocytes ≤ 1400 (%) | 9.5 |
| Total T lymphocytes >1400 (%) | 14.3 |
| T helper lymphocytes CD4+ § | 400 (260–630) |
| T helper lymphocytes CD4+ <500 (%) | 61.9 |
| 500 ≤ T helper lymphocytes CD4+ ≤ 2000 (%) | 38.1 |
| T helper lymphocytes CD4+ >2000 (%) | 0.0 |
| T cytotoxic lymphocytes CD8+ § | 270 (160–410) |
| T cytotoxic lymphocytes CD8+ <200 (%) | 33.3 |
| 200 ≤ T cytotoxic lymphocytes CD8+ ≤ 1200 (%) | 66.7 |
| T cytotoxic lymphocytes CD8+ >1200 (%) | 0.0 |
| Natural killer lymphocytes § | 150 (50–300) |
| Natural killer lymphocytes <100 (%) | 28.6 |
| 200 ≤ Natural killer lymphocytes ≤ 1200 (%) | 71.4 |
| Natural killer lymphocytes >1200 (%) | 0.0 |
| B lymphocytes CD20+ § | 90 (70–160) |
| B lymphocytes CD20+ <60 (%) | 9.5 |
| 60 ≤ B lymphocytes CD20+ ≤ 800 (%) | 90.5 |
| B lymphocytes >800 (%) | 0.0 |
| T Natural killer lymphocytes § | 100 (30–110) |
| T Natural killer lymphocytes <100 (%) | 42.9 |
| 100 ≤ T Natural killer lymphocytes ≤ 500 (%) | 57.1 |
| T Natural killer lymphocytes >500 (%) | 0.0 |
| % T cytotoxic lymphocytes CD8+ granzyme+ § | 62 (46–74) |
| % T cytotoxic lymphocytes CD8+ granzyme+ <50% (%) | 28.6 |
| % T cytotoxic lymphocytes CD8+ granzyme+ ≥ 50% (%) | 71.4 |
| % Natural killer lymphocytes granzyme+ § | 49 (38–77) |
| % Natural killer lymphocytes granzyme+ <50% (%) | 52.4 |
| % Natural killer lymphocytes granzyme+ ≥ 50% (%) | 47.6 |
| Total plasma cells § | 7 (2–9) |
| Total plasma cells <1 (%) | 14.3 |
| 1 ≤ Total plasma cells ≤ 11 (%) | 66.7 |
| Total plasma cells >11 (%) | 19.0 |
| % Total plasma cells § | 7.9 (2.5–15) |
| % Total plasma cells <0.7 (%) | 4.8 |
| 0.7 ≤ % Total plasma cells ≤ 4.8 (%) | 42.8 |
| % Total plasma cells >4.8 (%) | 52.4 |
| Ab-secreting plasma cells § | 2 (0.5–8) |
| Ab-secreting plasma cells <1 (%) | 28.6 |
| 1 ≤ Ab-secreting plasma cells ≤ 5 (%) | 38.1 |
| Ab-secreting plasma cells >5 (%) | 33.3 |
Publisher’s Note: MDPI stays neutral with regard to jurisdictional claims in published maps and institutional affiliations. |
© 2021 by the authors. Licensee MDPI, Basel, Switzerland. This article is an open access article distributed under the terms and conditions of the Creative Commons Attribution (CC BY) license (http://creativecommons.org/licenses/by/4.0/).
Share and Cite
Corrao, S.; Gervasi, F.; Di Bernardo, F.; Natoli, G.; Raspanti, M.; Catalano, N.; Argano, C. Immunological Characteristics of Non-Intensive Care Hospitalized COVID-19 Patients: A Preliminary Report. J. Clin. Med. 2021, 10, 849. https://0-doi-org.brum.beds.ac.uk/10.3390/jcm10040849
Corrao S, Gervasi F, Di Bernardo F, Natoli G, Raspanti M, Catalano N, Argano C. Immunological Characteristics of Non-Intensive Care Hospitalized COVID-19 Patients: A Preliminary Report. Journal of Clinical Medicine. 2021; 10(4):849. https://0-doi-org.brum.beds.ac.uk/10.3390/jcm10040849
Chicago/Turabian StyleCorrao, Salvatore, Francesco Gervasi, Francesca Di Bernardo, Giuseppe Natoli, Massimo Raspanti, Nicola Catalano, and Christiano Argano. 2021. "Immunological Characteristics of Non-Intensive Care Hospitalized COVID-19 Patients: A Preliminary Report" Journal of Clinical Medicine 10, no. 4: 849. https://0-doi-org.brum.beds.ac.uk/10.3390/jcm10040849