
The Predictive Role of NLR and PLR in Outcome and Patency of Lower Limb Revascularization in Patients with Femoropopliteal Disease

 ,
,
Abstract
:1. Introduction
2. Materials and Methods
2.1. Study Design
2.2. Data Collection
2.3. Preoperative Workup and Revascularization Technique
2.4. Study Outcomes
2.5. Ethical Approval
2.6. Statistical Analysis
3. Results
4. Discussion
5. Conclusions
Author Contributions
Funding
Institutional Review Board Statement
Informed Consent Statement
Acknowledgments
Conflicts of Interest
References
- Welten, G.M.J.M.; Schouten, O.; Hoeks, S.E.; Chonchol, M.; Vidakovic, R.; van Domburg, R.T.; Bax, J.J.; van Sambeek, M.R.H.M.; Poldermans, D. Long-Term Prognosis of Patients with Peripheral Arterial Disease: A Comparison in Patients with Coronary Artery Disease. J. Am. Coll. Cardiol. 2008, 51, 1588–1596. [Google Scholar] [CrossRef] [PubMed] [Green Version]
- Pasternak, R.C.; Criqui, M.H.; Benjamin, E.J.; Fowkes, F.G.R.; Isselbacher, E.M.; McCullough, P.A.; Wolf, P.A.; Zheng, Z.-J. American Heart Association Atherosclerotic Vascular Disease Conference: Writing Group I: Epidemiology. Circulation 2004, 109, 2605–2612. [Google Scholar] [CrossRef] [PubMed] [Green Version]
- Aboyans, V.; Ricco, J.-B.; Bartelink, M.-L.E.L.; Björck, M.; Brodmann, M.; Cohnert, T.; Collet, J.-P.; Czerny, M.; De Carlo, M.; Debus, S.; et al. Editor’s Choice—2017 ESC Guidelines on the Diagnosis and Treatment of Peripheral Arterial Diseases, in Collaboration with the European Society for Vascular Surgery (ESVS). Eur. J. Vasc. Endovasc. Surg. J. Eur. Soc. Vasc. Surg. 2018, 55, 305–368. [Google Scholar] [CrossRef] [PubMed] [Green Version]
- Eid, M.A.; Mehta, K.; Barnes, J.A.; Wanken, Z.; Columbo, J.; Stone, D.H.; Goodney, P.P.; Smith, M.M. Global Burden of Disease of Peripheral Artery Disease. J. Vasc. Surg. 2021, 74, e327. [Google Scholar] [CrossRef]
- Aboyans, V.; Ricco, J.-B.; Bartelink, M.-L.E.L.; Björck, M.; Brodmann, M.; Cohnert, T.; Collet, J.-P.; Czerny, M.; De Carlo, M.; Debus, S.; et al. 2017 ESC Guidelines on the Diagnosis and Treatment of Peripheral Arterial Diseases, in Collaboration with the European Society for Vascular Surgery (ESVS): Document Covering Atherosclerotic Disease of Extracranial Carotid and Vertebral, Mesenteric, Renal, Upper and Lower Extremity ArteriesEndorsed by: The European Stroke Organization (ESO)The Task Force for the Diagnosis and Treatment of Peripheral Arterial Diseases of the European Society of Cardiology (ESC) and of the European Society for Vascular Surgery (ESVS). Eur. Heart J. 2018, 39, 763–816. [Google Scholar] [CrossRef] [Green Version]
- Hirsch, A.T.; Criqui, M.H.; Treat-Jacobson, D.; Regensteiner, J.G.; Creager, M.A.; Olin, J.W.; Krook, S.H.; Hunninghake, D.B.; Comerota, A.J.; Walsh, M.E.; et al. Peripheral Arterial Disease Detection, Awareness, and Treatment in Primary Care. JAMA 2001, 286, 1317–1324. [Google Scholar] [CrossRef]
- Leng, G.C.; Lee, A.J.; Fowkes, F.G.; Whiteman, M.; Dunbar, J.; Housley, E.; Ruckley, C.V. Incidence, Natural History and Cardiovascular Events in Symptomatic and Asymptomatic Peripheral Arterial Disease in the General Population. Int. J. Epidemiol. 1996, 25, 1172–1181. [Google Scholar] [CrossRef] [Green Version]
- Kasapis, C.; Gurm, H.S. Current Approach to the Diagnosis and Treatment of Femoral-Popliteal Arterial Disease. A Systematic Review. Curr. Cardiol. Rev. 2009, 5, 296–311. [Google Scholar] [CrossRef] [Green Version]
- Rutherford, R.B.; Baker, J.D.; Ernst, C.; Johnston, K.W.; Porter, J.M.; Ahn, S.; Jones, D.N. Recommended standards for reports dealing with lower extremity ischemia: Revised version. J. Vasc. Surg. 1997, 26, 517–538. [Google Scholar] [CrossRef] [Green Version]
- Morris-Stiff, G.; Ogunbiyi, S.; Rees, J.; Davies, C.J.; Hicks, E.; Lewis, M.H. Variations in the Anatomical Distribution of Peripheral Vascular Disease According to Gender. Ann. R. Coll. Surg. Engl. 2011, 93, 306–309. [Google Scholar] [CrossRef] [Green Version]
- Libby, P.; Ridker, P.M.; Maseri, A. Inflammation and Atherosclerosis. Circulation 2002, 105, 1135–1143. [Google Scholar] [CrossRef]
- Santo Signorelli, S.; Anzaldi, M.; Fiore, V.; Catanzaro, S.; Simili, M.; Torrisi, B.; Neri, S. Study on Unrecognized Peripheral Arterial Disease (PAD) by Ankle/Brachial Index and Arterial Comorbidity in Catania, Sicily, Italy. Angiology 2010, 61, 524–529. [Google Scholar] [CrossRef] [PubMed]
- Ross, R. Atherosclerosis--an Inflammatory Disease. N. Engl. J. Med. 1999, 340, 115–126. [Google Scholar] [CrossRef] [PubMed]
- Zeng, Y.; Chen, Z.; Chen, Q.; Zhan, X.; Long, H.; Peng, F.; Zhang, F.; Feng, X.; Zhou, Q.; Liu, L.; et al. Neutrophil to Lymphocyte Ratio Predicts Adverse Cardiovascular Outcome in Peritoneal Dialysis Patients Younger than 60 Years Old. Mediat. Inflamm. 2020, 2020, e4634736. [Google Scholar] [CrossRef]
- Iliopoulos, I.; Alder, M.N.; Cooper, D.S.; Villarreal, E.G.; Loomba, R.; Sahay, R.D.; Fei, L.; Steele, P.E.; Flores, S. Pre-Operative Neutrophil–Lymphocyte Ratio Predicts Low Cardiac Output in Children after Cardiac Surgery. Cardiol. Young 2020, 30, 521–525. [Google Scholar] [CrossRef] [PubMed]
- Park, J.-S.; Seo, K.-W.; Choi, B.-J.; Choi, S.-Y.; Yoon, M.-H.; Hwang, G.-S.; Tahk, S.-J.; Shin, J.-H. Importance of Prognostic Value of Neutrophil to Lymphocyte Ratio in Patients with ST-Elevation Myocardial Infarction. Medicine 2018, 97, e13471. [Google Scholar] [CrossRef]
- Efros, O.; Beit Halevi, T.; Meisel, E.; Soffer, S.; Barda, N.; Cohen, O.; Kenet, G.; Lubetsky, A. The Prognostic Role of Neutrophil-to-Lymphocyte Ratio in Patients Hospitalized with Acute Pulmonary Embolism. J. Clin. Med. 2021, 10, 4058. [Google Scholar] [CrossRef]
- Yoshitomi, R.; Nakayama, M.; Sakoh, T.; Fukui, A.; Katafuchi, E.; Seki, M.; Tsuda, S.; Nakano, T.; Tsuruya, K.; Kitazono, T. High Neutrophil/Lymphocyte Ratio Is Associated with Poor Renal Outcomes in Japanese Patients with Chronic Kidney Disease. Ren. Fail. 2019, 41, 238–243. [Google Scholar] [CrossRef] [Green Version]
- Solak, Y.; Yilmaz, M.I.; Sonmez, A.; Saglam, M.; Cakir, E.; Unal, H.U.; Gok, M.; Caglar, K.; Oguz, Y.; Yenicesu, M.; et al. Neutrophil to Lymphocyte Ratio Independently Predicts Cardiovascular Events in Patients with Chronic Kidney Disease. Clin. Exp. Nephrol. 2013, 17, 532–540. [Google Scholar] [CrossRef]
- Ying, H.-Q.; Deng, Q.-W.; He, B.-S.; Pan, Y.-Q.; Wang, F.; Sun, H.-L.; Chen, J.; Liu, X.; Wang, S.-K. The Prognostic Value of Preoperative NLR, d-NLR, PLR and LMR for Predicting Clinical Outcome in Surgical Colorectal Cancer Patients. Med. Oncol. 2014, 31, 305. [Google Scholar] [CrossRef]
- Duan, J.; Pan, L.; Yang, M. Preoperative Elevated Neutrophil-to-Lymphocyte Ratio (NLR) and Derived NLR Are Associated with Poor Prognosis in Patients with Breast Cancer. Medicine 2018, 97, e13340. [Google Scholar] [CrossRef] [PubMed]
- Hu, H.; Yao, X.; Xie, X.; Wu, X.; Zheng, C.; Xia, W.; Ma, S. Prognostic Value of Preoperative NLR, DNLR, PLR and CRP in Surgical Renal Cell Carcinoma Patients. World J. Urol. 2017, 35, 261–270. [Google Scholar] [CrossRef] [PubMed]
- Kumarasamy, C.; Tiwary, V.; Sunil, K.; Suresh, D.; Shetty, S.; Muthukaliannan, G.K.; Baxi, S.; Jayaraj, R. Prognostic Utility of Platelet-Lymphocyte Ratio, Neutrophil–Lymphocyte Ratio and Monocyte–Lymphocyte Ratio in Head and Neck Cancers: A Detailed PRISMA Compliant Systematic Review and Meta-Analysis. Cancers 2021, 13, 4166. [Google Scholar] [CrossRef] [PubMed]
- Kumarasamy, C.; Sabarimurugan, S.; Madurantakam, R.M.; Lakhotiya, K.; Samiappan, S.; Baxi, S.; Nachimuthu, R.; Gothandam, K.M.; Jayaraj, R. Prognostic Significance of Blood Inflammatory Biomarkers NLR, PLR, and LMR in Cancer—A Protocol for Systematic Review and Meta-Analysis. Medicine 2019, 98, e14834. [Google Scholar] [CrossRef]
- Urbanowicz, T.; Olasińska-Wiśniewska, A.; Michalak, M.; Rodzki, M.; Witkowska, A.; Straburzyńska-Migaj, E.; Perek, B.; Jemielity, M. The Prognostic Significance of Neutrophil to Lymphocyte Ratio (NLR), Monocyte to Lymphocyte Ratio (MLR) and Platelet to Lymphocyte Ratio (PLR) on Long-Term Survival in Off-Pump Coronary Artery Bypass Grafting (OPCAB) Procedures. Biology 2022, 11, 34. [Google Scholar] [CrossRef] [PubMed]
- Aurelian, S.V.; Adrian, M.; Andercou, O.; Bruno, S.; Alexandru, O.; Catalin, T.; Dan, B. Neutrophil-to-Lymphocyte Ratio: A Comparative Study of Rupture to Nonruptured Infrarenal Abdominal Aortic Aneurysm. Ann. Vasc. Surg. 2019, 58, 270–275. [Google Scholar] [CrossRef]
- Kordzadeh, A.; Malietzis, G.; Browne, T.; Prionidis, I.; Panayiotopoulos, Y.P. Neutrophil to Lymphocyte Ratio (NLR) of Five Predicts 30-Day Morbidity in Ruptured Abdominal Aortic Aneurysms (RAAA): A Retrospective Cohort Study. Int. J. Surg. 2015, 15, 45–48. [Google Scholar] [CrossRef]
- Bath, J.; Smith, J.B.; Kruse, R.L.; Vogel, T.R. Association of Neutrophil-to-Lymphocyte Ratio with Outcomes after Elective Abdominal Aortic Aneurysm Repair. J. Vasc. Nurs. 2019, 37, 213–220. [Google Scholar] [CrossRef]
- Appleton, N.D.; Bailey, D.M.; Morris-Stiff, G.; Lewis, M.H. Neutrophil to Lymphocyte Ratio Predicts Perioperative Mortality Following Open Elective Repair of Abdominal Aortic Aneurysms. Vasc. Endovasc. Surg. 2014, 48, 311–316. [Google Scholar] [CrossRef]
- Ntalouka, M.P.; Nana, P.; Kouvelos, G.N.; Stamoulis, K.; Spanos, K.; Giannoukas, A.; Matsagkas, M.; Arnaoutoglou, E. Association of Neutrophil–Lymphocyte and Platelet–Lymphocyte Ratio with Adverse Events in Endovascular Repair for Abdominal Aortic Aneurysm. J. Clin. Med. 2021, 10, 1083. [Google Scholar] [CrossRef]
- Garagoli, F.; Fiorini, N.; Pérez, M.N.; Rabellino, J.M.; Valle Raleigh, J.; Chas, J.G.; DI Caro, V.; Pizarro, R.; Bluro, I.M. Neutrophil-to-Lymphocyte Ratio and Platelet-to-Lymphocyte Ratio Predict in-Hospital Mortality in Symptomatic but Unruptured Abdominal Aortic Aneurysm Patients. Int. Angiol. J. Int. Union Angiol. 2022, 5, 149–156. [Google Scholar] [CrossRef] [PubMed]
- Schanzer, A.; Mega, J.; Meadows, J.; Samson, R.H.; Bandyk, D.F.; Conte, M.S. Risk Stratification in Critical Limb Ischemia: Derivation and Validation of a Model to Predict Amputation-Free Survival using Multi-Center Surgical Outcomes Data. J. Vasc. Surg. Off. Publ. Soc. Vasc. Surg. Int. Soc. Cardiovasc. Surg. N. Am. Chapter 2008, 48, 1464–1471. [Google Scholar] [CrossRef] [PubMed] [Green Version]
- Bhutta, H.; Agha, R.; Wong, J.; Tang, T.Y.; Wilson, Y.G.; Walsh, S.R. Neutrophil-Lymphocyte Ratio Predicts Medium-Term Survival Following Elective Major Vascular Surgery: A Cross-Sectional Study. Vasc. Endovasc. Surg. 2011, 45, 227–231. [Google Scholar] [CrossRef] [PubMed]
- Wolfe, J.H.; Wyatt, M.G. Critical and Subcritical Ischaemia. Eur. J. Vasc. Endovasc. Surg. Off. J. Eur. Soc. Vasc. Surg. 1997, 13, 578–582. [Google Scholar] [CrossRef] [Green Version]
- Gibson, P.H.; Croal, B.L.; Cuthbertson, B.H.; Small, G.R.; Ifezulike, A.I.; Gibson, G.; Jeffrey, R.R.; Buchan, K.G.; El-Shafei, H.; Hillis, G.S. Preoperative Neutrophil-Lymphocyte Ratio and Outcome from Coronary Artery Bypass Grafting. Am. Heart J. 2007, 154, 995–1002. [Google Scholar] [CrossRef] [PubMed] [Green Version]
- Tamhane, U.U.; Aneja, S.; Montgomery, D.; Rogers, E.-K.; Eagle, K.A.; Gurm, H.S. Association between Admission Neutrophil to Lymphocyte Ratio and Outcomes in Patients with Acute Coronary Syndrome. Am. J. Cardiol. 2008, 102, 653–657. [Google Scholar] [CrossRef]
- Duffy, B.K.; Gurm, H.S.; Rajagopal, V.; Gupta, R.; Ellis, S.G.; Bhatt, D.L. Usefulness of an Elevated Neutrophil to Lymphocyte Ratio in Predicting Long-Term Mortality after Percutaneous Coronary Intervention. Am. J. Cardiol. 2006, 97, 993–996. [Google Scholar] [CrossRef]
- Kobayashi, M.; Kubo, T.; Komatsu, K.; Fujisaki, A.; Terauchi, F.; Natsui, S.; Nukui, A.; Kurokawa, S.; Morita, T. Changes in Peripheral Blood Immune Cells: Their Prognostic Significance in Metastatic Renal Cell Carcinoma Patients Treated with Molecular Targeted Therapy. Med. Oncol. Northwood 2013, 30, 556. [Google Scholar] [CrossRef]
- Chen, X.; Meng, F.; Jiang, R. Neutrophil-to-Lymphocyte Ratio as a Prognostic Biomarker for Patients with Metastatic Renal Cell Carcinoma Treated With Immune Checkpoint Inhibitors: A Systematic Review and Meta-Analysis. Front. Oncol. 2021, 11, 746976. [Google Scholar] [CrossRef]
- Nishiyama, N.; Hirobe, M.; Kikushima, T.; Matsuki, M.; Takahashi, A.; Yanase, M.; Ichimatsu, K.; Egawa, M.; Hayashi, N.; Negishi, T.; et al. The Neutrophil-Lymphocyte Ratio Has a Role in Predicting the Effectiveness of Nivolumab in Japanese Patients with Metastatic Renal Cell Carcinoma: A Multi-Institutional Retrospective Study. BMC Urol. 2020, 20, 110. [Google Scholar] [CrossRef]
- Yun, T.H.; Jeong, Y.Y.; Lee, S.J.; Choi, Y.S.; Ryu, J.M. Neutrophil–Lymphocyte and Platelet–Lymphocyte Ratios in Preoperative Differential Diagnosis of Benign, Borderline, and Malignant Ovarian Tumors. J. Clin. Med. 2022, 11, 1355. [Google Scholar] [CrossRef]
- Sanna, E.; Tanca, L.; Cherchi, C.; Gramignano, G.; Oppi, S.; Chiai, M.G.; Macciò, A.; Madeddu, C. Decrease in Neutrophil-to-Lymphocyte Ratio during Neoadjuvant Chemotherapy as a Predictive and Prognostic Marker in Advanced Ovarian Cancer. Diagnostics 2021, 11, 1298. [Google Scholar] [CrossRef] [PubMed]
- Zhou, M.; Li, L.; Wang, X.; Wang, C.; Wang, D. Neutrophil-to-Lymphocyte Ratio and Platelet Count Predict Long-Term Outcome of Stage IIIC Epithelial Ovarian Cancer. Cell. Physiol. Biochem. 2018, 46, 178–186. [Google Scholar] [CrossRef] [PubMed]
- Miao, Y.; Yan, Q.; Li, S.; Li, B.; Feng, Y. Neutrophil to Lymphocyte Ratio and Platelet to Lymphocyte Ratio Are Predictive of Chemotherapeutic Response and Prognosis in Epithelial Ovarian Cancer Patients Treated with Platinum-Based Chemotherapy. Cancer Biomark. Sect. Dis. Markers 2016, 17, 33–40. [Google Scholar] [CrossRef] [PubMed]
- Kim, Y.-J.; Lee, I.; Chung, Y.S.; Nam, E.; Kim, S.; Kim, S.-W.; Kim, Y.T.; Lee, J.-Y. Pretreatment Neutrophil-to-Lymphocyte Ratio and Its Dynamic Change during Neoadjuvant Chemotherapy as Poor Prognostic Factors in Advanced Ovarian Cancer. Obstet. Gynecol. Sci. 2018, 61, 227–234. [Google Scholar] [CrossRef] [PubMed]
- Kim, E.Y.; Lee, J.W.; Yoo, H.M.; Park, C.H.; Song, K.Y. The Platelet-to-Lymphocyte Ratio Versus Neutrophil-to-Lymphocyte Ratio: Which Is Better as a Prognostic Factor in Gastric Cancer? Ann. Surg. Oncol. 2015, 22, 4363–4370. [Google Scholar] [CrossRef]
- Jung, M.R.; Park, Y.K.; Jeong, O.; Seon, J.W.; Ryu, S.Y.; Kim, D.Y.; Kim, Y.J. Elevated Preoperative Neutrophil to Lymphocyte Ratio Predicts Poor Survival Following Resection in Late Stage Gastric Cancer. J. Surg. Oncol. 2011, 104, 504–510. [Google Scholar] [CrossRef]
- Miyamoto, R.; Inagawa, S.; Sano, N.; Tadano, S.; Adachi, S.; Yamamoto, M. The Neutrophil-to-Lymphocyte Ratio (NLR) Predicts Short-Term and Long-Term Outcomes in Gastric Cancer Patients. Eur. J. Surg. Oncol. 2018, 44, 607–612. [Google Scholar] [CrossRef]
- Walsh, S.R.; Cook, E.J.; Goulder, F.; Justin, T.A.; Keeling, N.J. Neutrophil-Lymphocyte Ratio as a Prognostic Factor in Colorectal Cancer. J. Surg. Oncol. 2005, 91, 181–184. [Google Scholar] [CrossRef]
- Haram, A.; Boland, M.R.; Kelly, M.E.; Bolger, J.C.; Waldron, R.M.; Kerin, M.J. The Prognostic Value of Neutrophil-to-Lymphocyte Ratio in Colorectal Cancer: A Systematic Review. J. Surg. Oncol. 2017, 115, 470–479. [Google Scholar] [CrossRef]
- Sharaiha, R.Z.; Halazun, K.J.; Mirza, F.; Port, J.L.; Lee, P.C.; Neugut, A.I.; Altorki, N.K.; Abrams, J.A. Elevated Preoperative Neutrophil:Lymphocyte Ratio as a Predictor of Postoperative Disease Recurrence in Esophageal Cancer. Ann. Surg. Oncol. 2011, 18, 3362–3369. [Google Scholar] [CrossRef] [PubMed] [Green Version]
- Yodying, H.; Matsuda, A.; Miyashita, M.; Matsumoto, S.; Sakurazawa, N.; Yamada, M.; Uchida, E. Prognostic Significance of Neutrophil-to-Lymphocyte Ratio and Platelet-to-Lymphocyte Ratio in Oncologic Outcomes of Esophageal Cancer: A Systematic Review and Meta-Analysis. Ann. Surg. Oncol. 2016, 23, 646–654. [Google Scholar] [CrossRef] [PubMed]
- Azab, B.; Bhatt, V.R.; Phookan, J.; Murukutla, S.; Kohn, N.; Terjanian, T.; Widmann, W.D. Usefulness of the Neutrophil-to-Lymphocyte Ratio in Predicting Short- and Long-Term Mortality in Breast Cancer Patients. Ann. Surg. Oncol. 2012, 19, 217–224. [Google Scholar] [CrossRef] [PubMed]
- Asano, Y.; Kashiwagi, S.; Onoda, N.; Noda, S.; Kawajiri, H.; Takashima, T.; Ohsawa, M.; Kitagawa, S.; Hirakawa, K. Predictive Value of Neutrophil/Lymphocyte Ratio for Efficacy of Preoperative Chemotherapy in Triple-Negative Breast Cancer. Ann. Surg. Oncol. 2016, 23, 1104–1110. [Google Scholar] [CrossRef] [Green Version]
- Spark, J.I.; Sarveswaran, J.; Blest, N.; Charalabidis, P.; Asthana, S. An Elevated Neutrophil-Lymphocyte Ratio Independently Predicts Mortality in Chronic Critical Limb Ischemia. J. Vasc. Surg. 2010, 52, 632–636. [Google Scholar] [CrossRef] [Green Version]
- Chan, C.; Puckridge, P.; Ullah, S.; Delaney, C.; Spark, J.I. Neutrophil-Lymphocyte Ratio as a Prognostic Marker of Outcome in Infrapopliteal Percutaneous Interventions for Critical Limb Ischemia. J. Vasc. Surg. 2014, 60, 661–668. [Google Scholar] [CrossRef] [Green Version]
- González-Fajardo, J.A.; Brizuela-Sanz, J.A.; Aguirre-Gervás, B.; Merino-Díaz, B.; Del Río-Solá, L.; Martín-Pedrosa, M.; Vaquero-Puerta, C. Prognostic Significance of an Elevated Neutrophil–Lymphocyte Ratio in the Amputation-Free Survival of Patients with Chronic Critical Limb Ischemia. Ann. Vasc. Surg. 2014, 28, 999–1004. [Google Scholar] [CrossRef]
- Kullar, P.; Weerakoddy, R.; Walsh, S. Neutrophil-Lymphocyte Ratio Predicts Graft Patency Following Lower Limb Revascularisation. Acta Chir. Belg. 2012, 112, 365–368. [Google Scholar] [CrossRef]
- Taurino, M.; Aloisi, F.; Del Porto, F.; Nespola, M.; Dezi, T.; Pranteda, C.; Rizzo, L.; Sirignano, P. Neutrophil-to-Lymphocyte Ratio Could Predict Outcome in Patients Presenting with Acute Limb Ischemia. J. Clin. Med. 2021, 10, 4343. [Google Scholar] [CrossRef]
- King, A.H.; Kwan, S.; Schmaier, A.H.; Kumins, N.H.; Harth, K.C.; Colvard, B.D.; Wong, V.L.; Kashyap, V.S.; Cho, J.S. Elevated neutrophil to lymphocyte ratio is associated with decreased amputation-free survival after femoropopliteal percutaneous revascularization. Int. Angiol. 2021, 40, 442–449. [Google Scholar] [CrossRef]
- Adler, L.S.; Rabie, E.M.; Shave, S.M.; Alla, A.; Rahimi, S.A.; Beckerman, W.E. Evaluating Neutrophil-to-lymphocyte Ratio as A Predictive Tool For Post-operative Outcomes In Patients Undergoing Open Lower Extremity Revascularization Procedures. Ann. Vasc. Surg. 2022, 79, 394–395. [Google Scholar] [CrossRef]
- Songur, M.; Simsek, E.; Faruk, O.; Kavasoğlu, K.; Alagha, S.; Karahan, M. The Platelet-Lymphocyte Ratio Predict the Risk of Amputation in Critical Limb Ischemia. J. Vasc. Med. Surg. 2014, 2, 1–4. [Google Scholar] [CrossRef] [Green Version]
- Demirdal, T.; Sen, P. The Significance of Neutrophil-Lymphocyte Ratio, Platelet-Lymphocyte Ratio and Lymphocyte-Monocyte Ratio in Predicting Peripheral Arterial Disease, Peripheral Neuropathy, Osteomyelitis and Amputation in Diabetic Foot Infection. Diabetes Res. Clin. Pract. 2018, 144, 118–125. [Google Scholar] [CrossRef] [PubMed]
- Zhou, D.; Wang, G.; Fan, Y.; Wan, Z.; Liu, X. Platelet to Lymphocyte Ratio Is Associated with the Severity of Coronary Artery Disease and Clinical Outcomes of Percutaneous Coronary Intervention in the Chinese Han Population. Exp. Ther. Med. 2017, 13, 731–738. [Google Scholar] [CrossRef] [Green Version]
- Lee, Y.S.G.; Baradi, A.; Peverelle, M.; Sultani, R.; Adams, H.; Garlick, J.; Wilson, A.M. Usefulness of Platelet-to-Lymphocyte Ratio to Predict Long-Term All-Cause Mortality in Patients at High Risk of Coronary Artery Disease Who Underwent Coronary Angiography. Am. J. Cardiol. 2018, 121, 1021–1026. [Google Scholar] [CrossRef]


| Variables | All Patients n = 224 |
|---|---|
| Age mean ± SD (min-max) | 69.72 ± 8.34 (51–92) |
| Male sex no. (%) | 166 (74.11%) |
| Comorbidities and Risk factors | |
| AH, no. (%) | 186 (83.04%) |
| IHD, no. (%) | 181 (80.80%) |
| AF, no. (%) | 53 (23.66%) |
| CHF, no. (%) | 142 (63.39%) |
| MI, no. (%) | 79 (35.27%) |
| COPD, no. (%) | 56 (25.00%) |
| T2D, no. (%) | 110 (49.11%) |
| CVA, no. (%) | 61 (27.23%) |
| CVI, no. (%) | 50 (22.32%) |
| CKD, no. (%) | 53 (23.66%) |
| Tobacco, no. (%) | 141 (62.95%) |
| Obesity, no. (%) | 84 (37.5%) |
| Hyperlipidemia, no. (%) | 133 (59.38%) |
| Laboratory data | |
| Hemoglobin g/dL median (Q1–Q3) | 12.36 (10.33–13.92) |
| Hematocrit % median (Q1–Q3) | 37.33 (31.94–41.92) |
| Glucose mg/dL median (Q1–Q3) | 106 (92–134) |
| Neutrophils ×103/uL median (Q1–Q3) | 6.24 (4.77–8.42) |
| Lymphocytes ×103/uL median (Q1–Q3) | 1.90 (1.45–2.62) |
| Monocyte ×103/uL median (Q1–Q3) | 0.61 (0.46–0.79) |
| PLT ×103/uL median (Q1–Q3) | 251.35 (208.32–314.35) |
| NLR median (Q1–Q3) | 2.98 (1.97–5.81) |
| PLR median (Q1–Q3) | 126.21 (94.24–181.99) |
| Variables | All Patients n = 224 |
|---|---|
| Rutherford classification | |
| Stg 2, no. (%) | 45 (20.09%) |
| Stg 3, no. (%) | 69 (30.80%) |
| Stg 4, no. (%) | 54 (24.11%) |
| Stg 5, no. (%) | 56 (25.00%) |
| Arterial occlusion | |
| SFA, no. (%) | 120 (53.57%) |
| SFA + PA, no. (%) | 104 (46.42%) |
| Below the knee run-off arteries | |
| <1 | 64 (28.57%) |
| 1–2 | 109 (48.66%) |
| 3 | 51 (22.76%) |
| Type of surgery | |
| Remote endarterectomy, no. (%) | 25 (11.16%) |
| AK FP bypass, no. (%) | 139 (62.05%) |
| BK FP bypass, no. (%) | 60 (26.79%) |
| Outcome | |
| 12 months primary patency, no. (%) | 138 (61.61%) |
| Amputation, no. (%) | 40 (17.86%) |
| Death, no. (%) | 27 (12.05%) |
| Patency n = 138 | Nonpatency n = 86 | p-Value (OR; CI 95%) | |
|---|---|---|---|
| Age mean ± SD (min–max) | 69.56 ± 7.86 (52–92) | 69.98 ± 9.10 (51–89) | 0.72 a |
| Male sex no. (%) | 105 (76.09%) | 61 (70.93%) | 0.39 b (0.76; 0.41–1.40) |
| Comorbidities and Risk factors | |||
| AH, no. (%) | 110 (79.71%) | 76 (88.37%) | 0.09 b (1.93; 0.88–4.21) |
| IHD, no. (%) | 107 (77.54%) | 74 (86.05%) | 0.11 b (1.78; 0.86–3.70) |
| AF, no. (%) | 25 (18.12%) | 28 (32.56%) | 0.01 b (2.18; 1.16–4.07) |
| CHF, no. (%) | 80 (57.97%) | 62 (72.09%) | 0.03 b (1.87; 1.04–3.34) |
| MI, no. (%) | 40 (28.99%) | 39 (45.35%) | 0.01 b (2.03; 1.15–3.56) |
| COPD, no. (%) | 33 (23.91%) | 23 (26.74%) | 0.63 b (1.16; 0.62–2.15) |
| T2D, no. (%) | 66 (47.83%) | 44 (51.16%) | 0.62 b (0.87; 0.51–1.49) |
| CVA, no. (%) | 36 (26.09%) | 25 (29.07%) | 0.62 b (1.14; 0.66–1.95) |
| CVI, no. (%) | 34 (24.64%) | 16 (18.6%) | 0.29 b (0.69; 0.35–1.36) |
| CKD, no. (%) | 26 (18.84%) | 27 (30.23%) | 0.03 b (1.97; 1.05–3.67) |
| Tobacco, no. (%) | 76 (55.07%) | 65 (75.58%) | 0.002 b (2.52; 1.39–4.58) |
| Obesity, no. (%) | 51 (36.96%) | 33 (38.37%) | 0.83 b (1.06; 0.60–1.85) |
| Hyperlipidemia, no. (%) | 81 (58.7%) | 52 (60.47%) | 0.79 b (1.07; 0.62–1.86) |
| Laboratory data | |||
| Hemoglobin g/dL median (Q1–Q3) | 12.75 (10.96–14.24) | 11.35 (9.72–13.23) | 0.001 c |
| Hematocrit % median (Q1–Q3) | 39.26 (33.4–42.97) | 34.86 (30.52–40.29) | 0.0005 c |
| Glucose mg/dL median (Q1–Q3) | 102.4 (91–126) | 116.3 (95.25–140.62) | 0.03 c |
| Neutrophils ×103/uL median (Q1–Q3) | 5.24 (4.03–6.58) | 8.85 (6.83–11.14) | <0.0001 c |
| Lymphocytes ×103/uL median (Q1–Q3) | 2.25 (1.77–2.96) | 1.46 (1.13–1.86) | <0.0001 c |
| Monocyte ×103/uL median (Q1–Q3) | 0.59 (0.44–0.72) | 0.70 (0.51–0.94) | 0.0003 c |
| PLT ×103/uL median (Q1–Q3) | 238.45 (202.7–293.85) | 283.65 (227.75–416.85) | <0.0001 c |
| NLR median (Q1–Q3) | 2.21 (1.66–2.99) | 6.40 (4.64–8.83) | <0.0001 c |
| PLR median (Q1–Q3) | 108.02 (82.81–131.55) | 191.51 (145.5–273.58) | <0.0001 c |
| Patency n = 138 | Nonpatency n = 86 | p-Value b (OR; CI 95%) | |
|---|---|---|---|
| Rutherford classification | |||
| stg 2, no. (%) | 34 (24.64%) | 11 (12.79%) | 0.03 b (0.44; 0.21–0.94) |
| stg 3, no. (%) | 50 (36.23%) | 19 (22.09%) | 0.02 b (0.49; 0.26–0.92) |
| stg 4, no. (%) | 39 (28.26%) | 15 (17.44%) | 0.06 b (0.53; 0.27–1.04) |
| stg 5, no. (%) | 15 (10.87%) | 41 (47.67%) | <0.0001 b (7.47; 3.77–14.279) |
| Arterial occlusion | |||
| SFA, no. (%) | 87 (63.04%) | 33 (38.37%) | 0.0004 b (0.36; 0.20–0.63) |
| SFA + PA, no. (%) | 51 (36.96%) | 53 (61.63%) | 0.0004 b (2.73; 1.57–4.77) |
| Below the knee run-off arteries | |||
| <1 | 51 (36.96%) | 13 (15.11%) | 0.0006 b (0.30; 0.15–0.60) |
| 1–2 | 64 (46.37%) | 45 (52.32%) | 0.38 b (1.26; 0.73–2.17) |
| 3 | 23 (16.67%) | 28 (32.57%) | 0.0006 b (2.41; 1.27–455) |
| Type of surgery | |||
| Remote endarterectomy, no. (%) | 14 (10.14%) | 11 (12.79%) | 0.54 b (1.29; 0.56–3.00) |
| AK FP bypass, no. (%) | 95 (68.84%) | 44 (51.16%) | 0.008 b (0.47; 0.27–0.82) |
| BK FP bypass, no. (%) | 29 (21.01%) | 31 (36.05%) | 0.01 b (2.11; 1.16–3.86) |
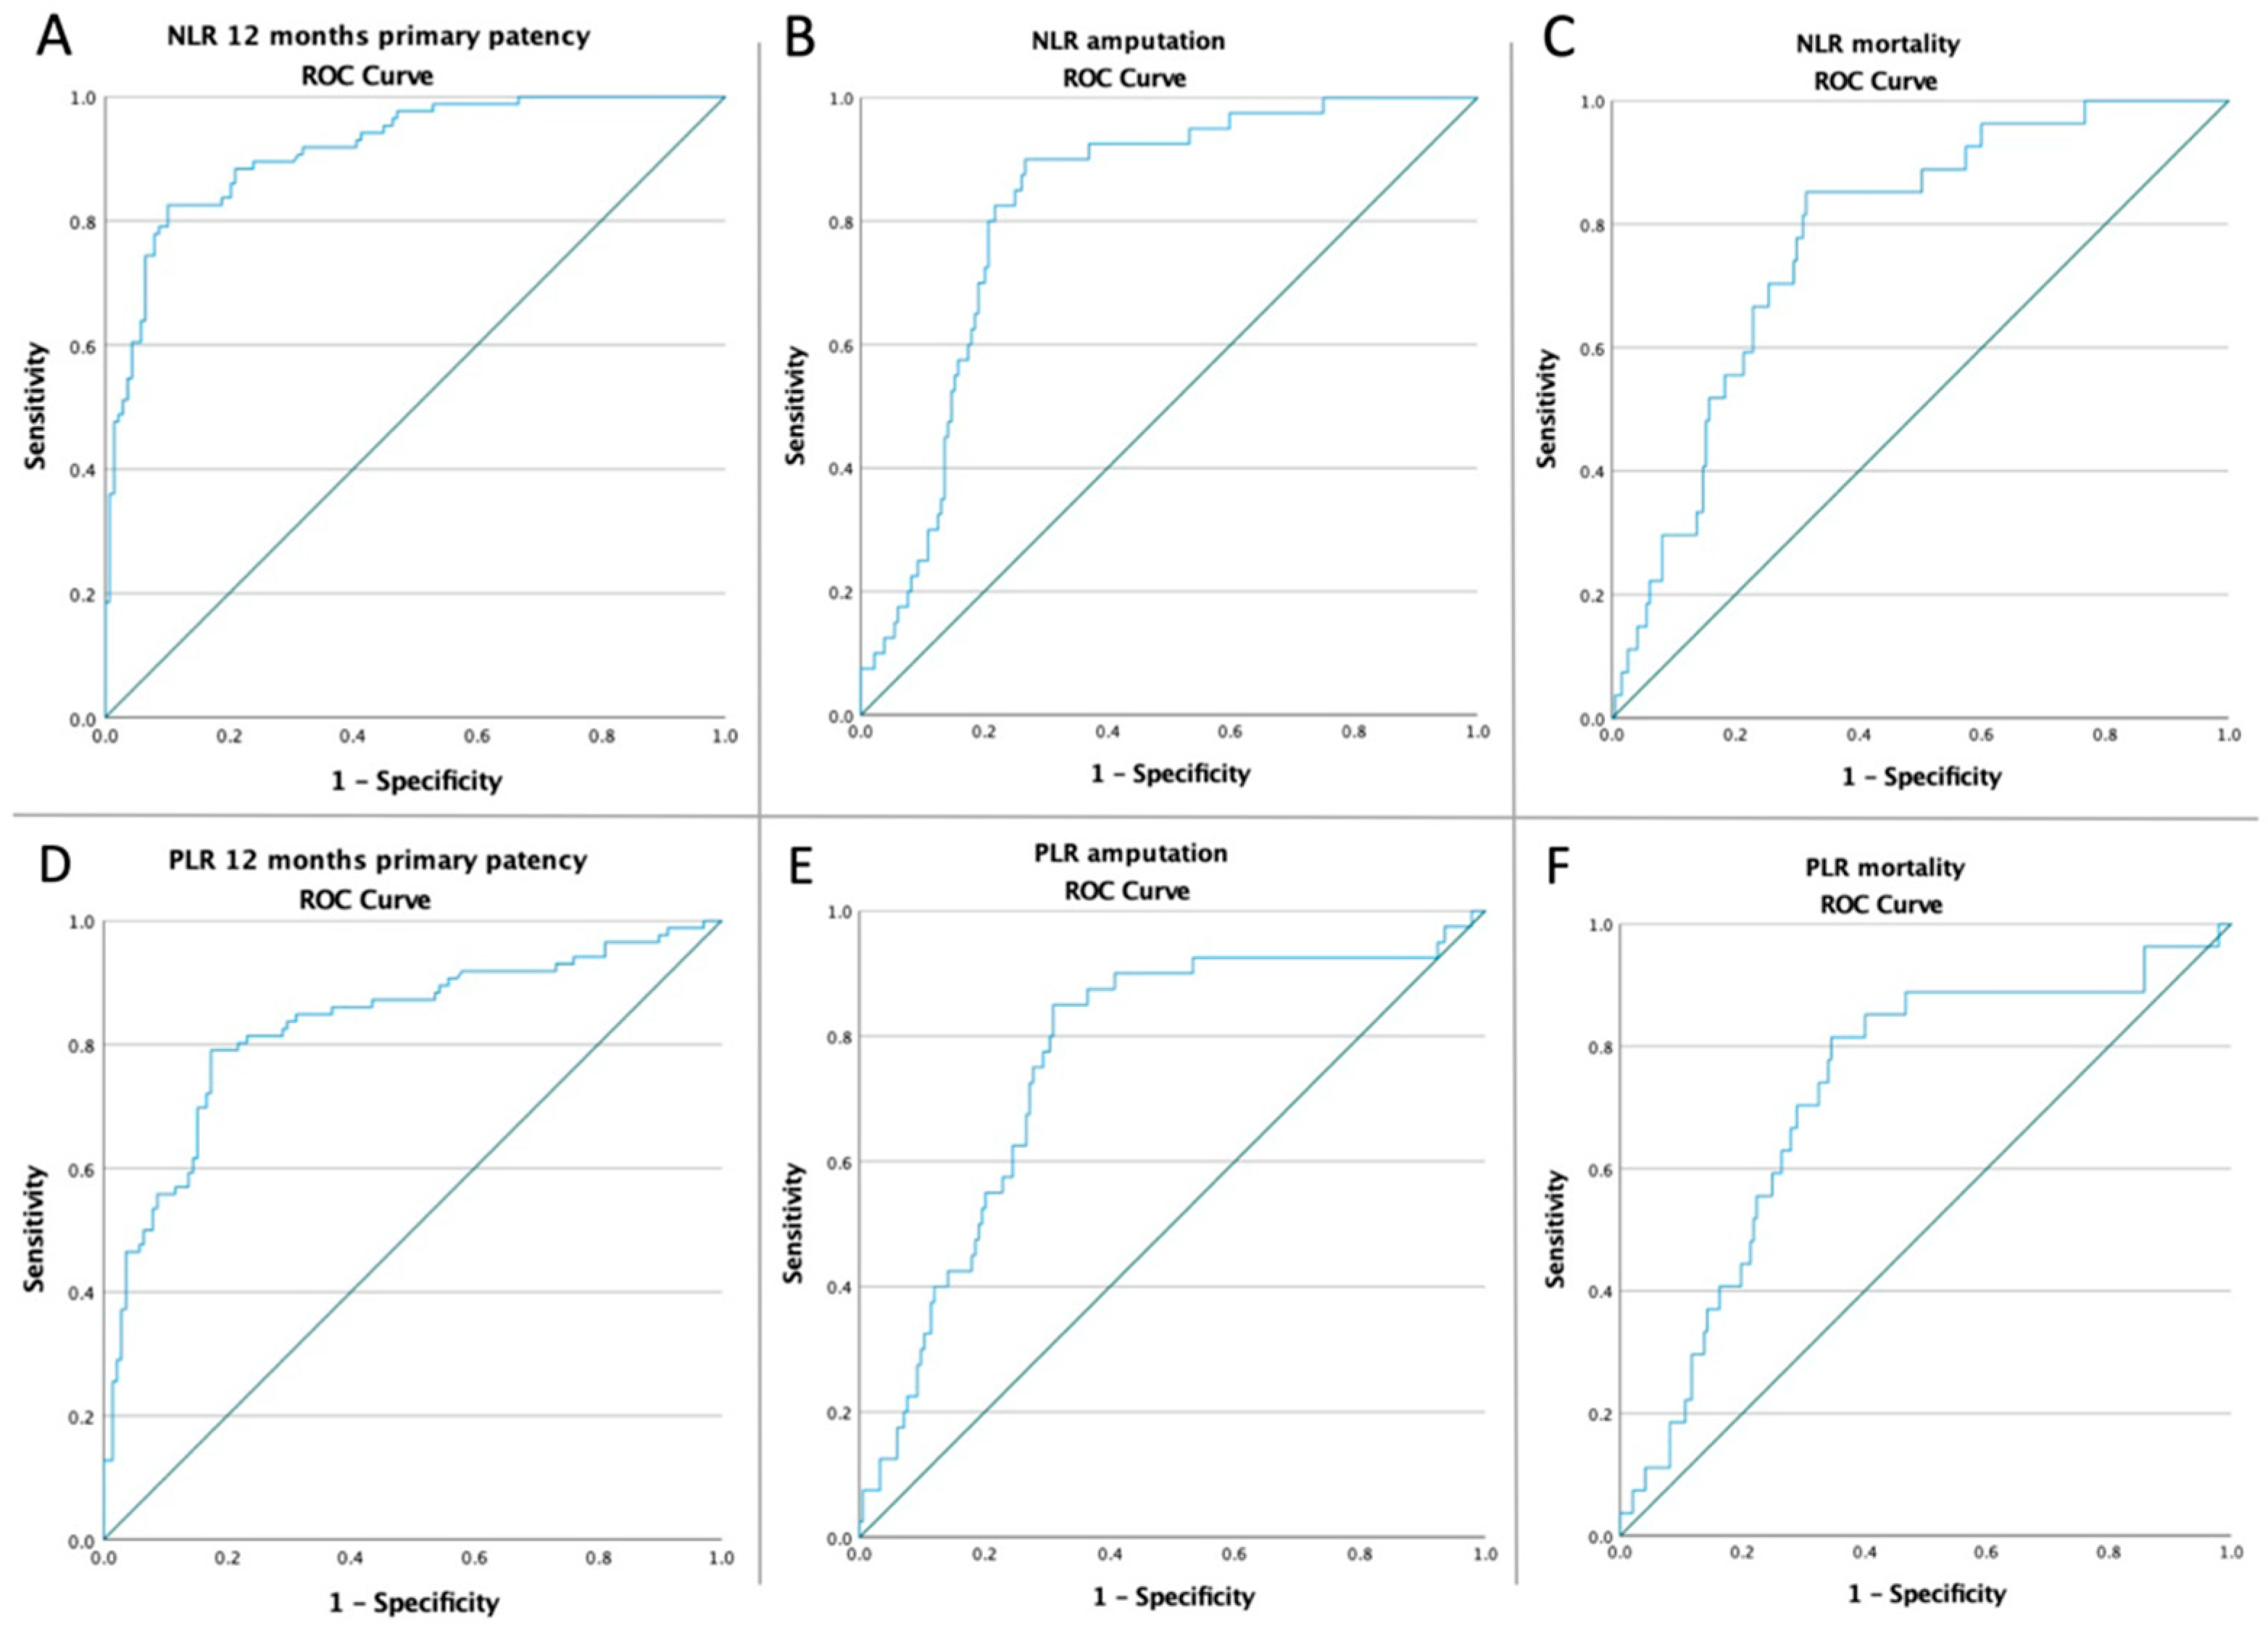
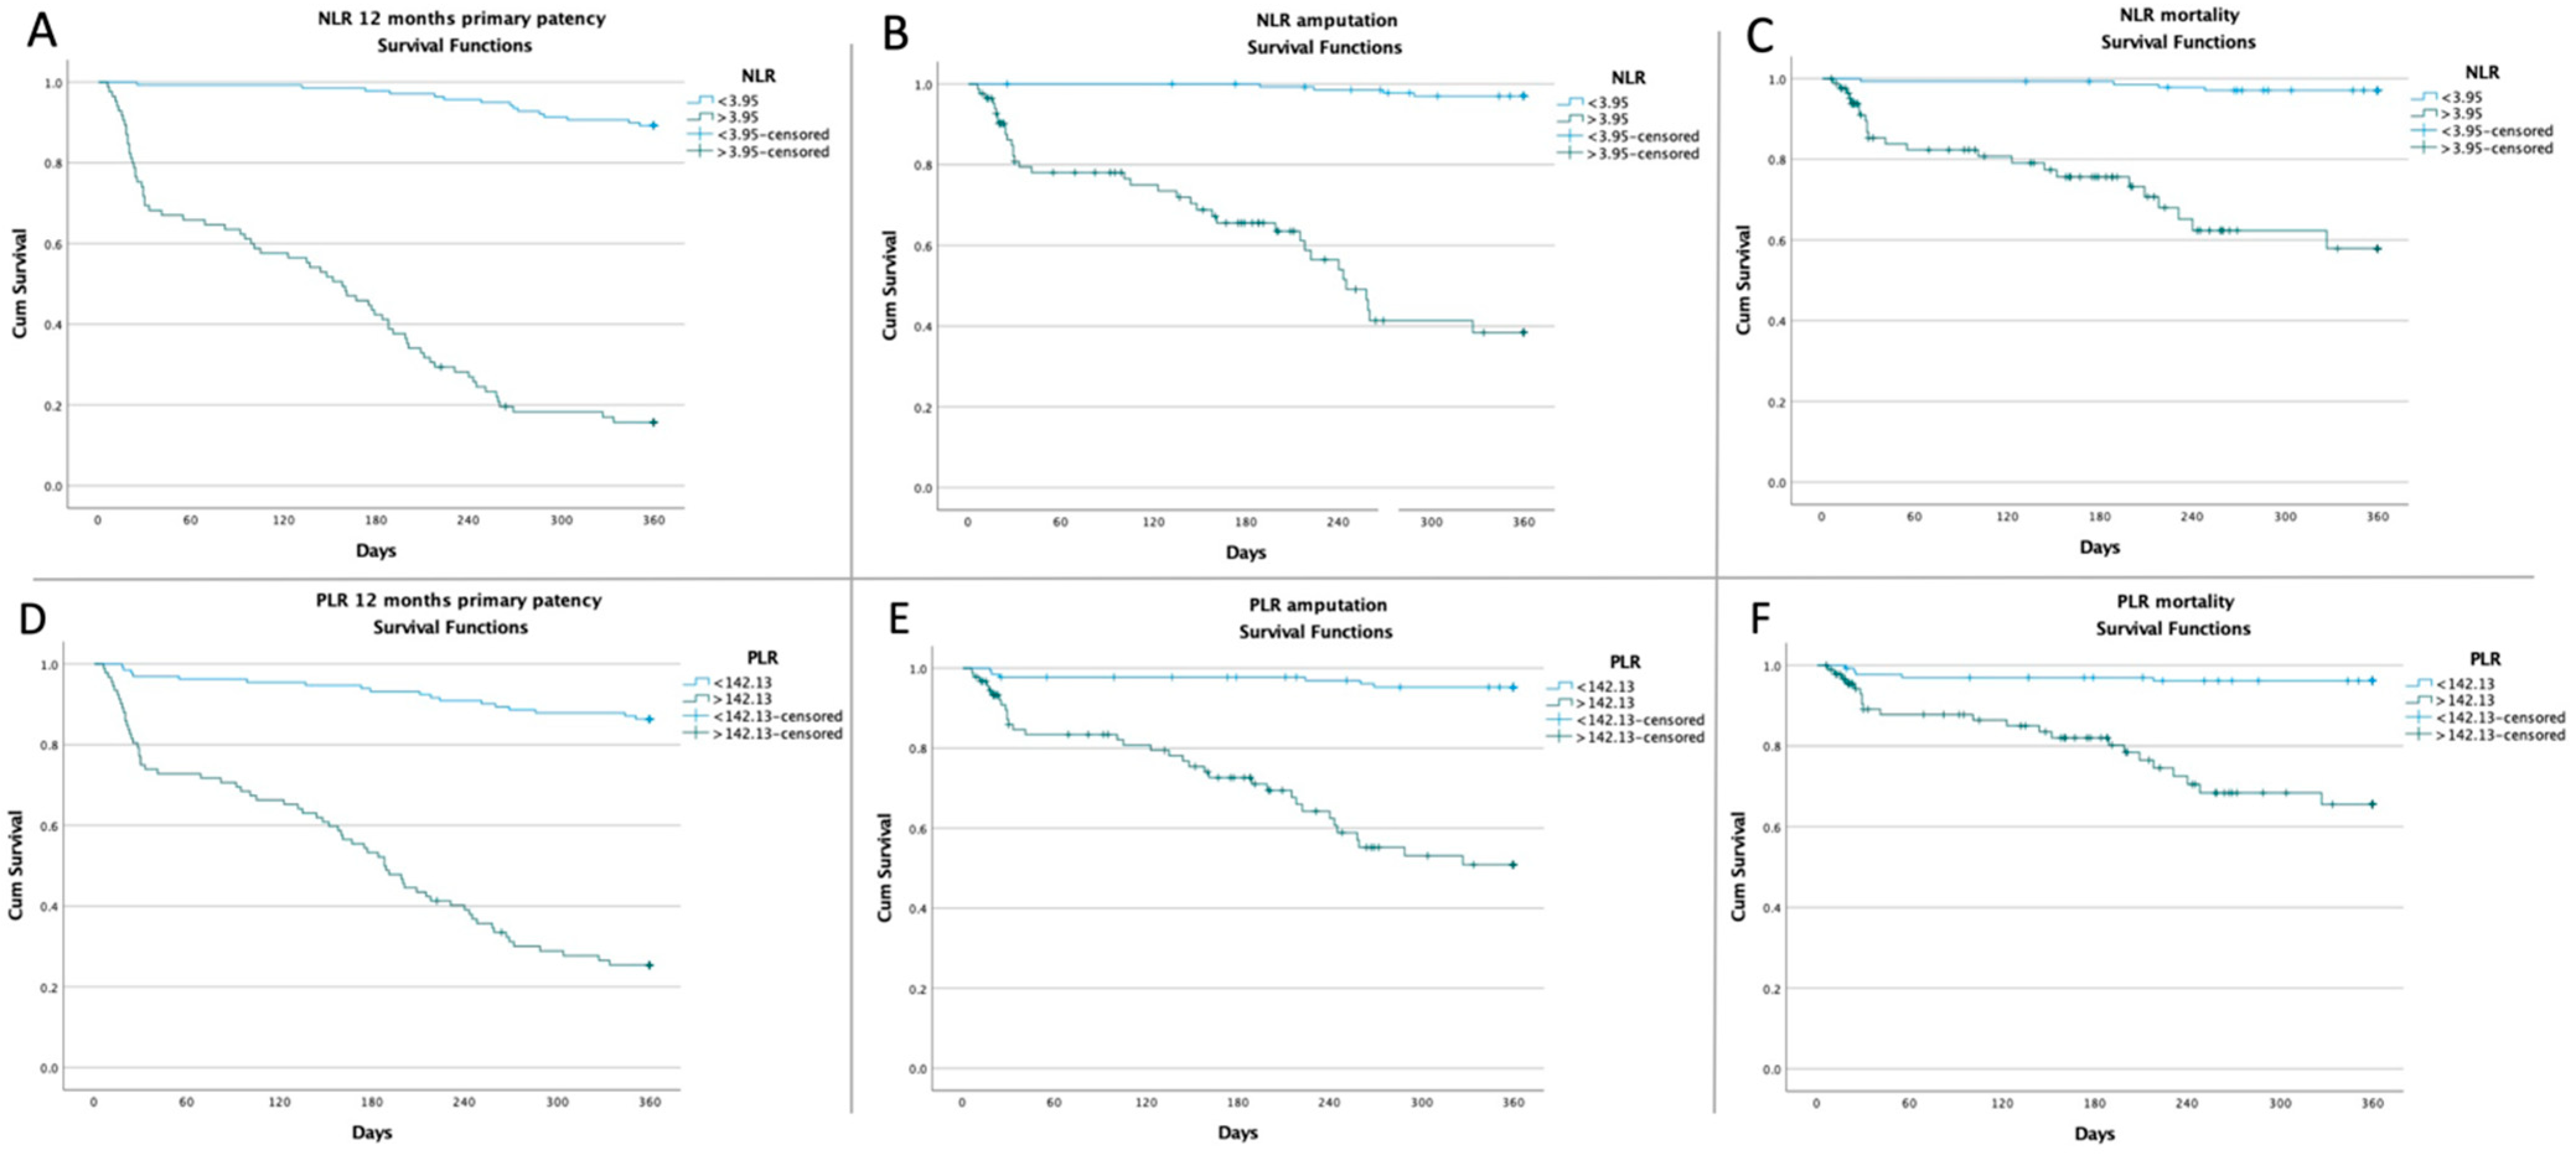
| NLR = 3.95 | 12 Months Primary Patency | Amputation | Mortality |
|---|---|---|---|
| LOW-NLR VS. HIGH-NLR | 124/139 (89.21%) vs. 14/85 (16.47%) p < 0.0001 OR:0.02 CI: (0.01–0.05) | 4/139 (2.88%) vs. 36/85 (42.35%) p < 0.0001 OR:24.79 CI: (8.39–73.27) | 4/139 (2.88%) vs. 23/85 (27.06%) p < 0.0001 OR:12.52 CI: (4.15–37.74) |
| PLR = 142.13 | 12 Months Primary Patency | Amputation | Mortality |
| LOW-PLR VS. HIGH-PLR | 114/132 (86.38%) vs. 24/92 (26.09%) p < 0.0001 OR:0.05 CI: (0.02–0.11) | 6/132 (4.55%) vs. 34/92 (36.96%) p < 0.0001 OR:12.31 CI: (4.89–30.95) | 5/132 (3.79%) vs. 22/92 (23.91%) p = 0.0001 OR:7.98 CI: (2.89–22) |
| 12 Months Primary Patency | Amputation | Mortality | |||||||
|---|---|---|---|---|---|---|---|---|---|
| OR | 95% CI | p Value | OR | 95% CI | p Value | OR | 95% CI | p Value | |
| AF | 2.18 | 1.16–4.07 | 0.01 | 1.73 | 0.82–3.66 | 0.15 | 1.14 | 0.45–2.88 | 0.76 |
| MI | 1.59 | 0.90–2.78 | 0.10 | 1.45 | 0.72–2.92 | 0.29 | 1.55 | 0.68–3.50 | 0.29 |
| CVA | 1.16 | 0.63–2.11 | 0.62 | 1.18 | 0.55–2.51 | 0.66 | 1.14 | 0.47–2.76 | 0.76 |
| CKD | 1.86 | 0.99–3.49 | 0.051 | 1.32 | 0.60–2.87 | 0.48 | 2.17 | 0.92–5.09 | 0.07 |
| Tobacco | 2.52 | 1.39–4.58 | 0.002 | 3.31 | 1.39–2.87 | 0.007 | 2.24 | 0.86–5.81 | 0.09 |
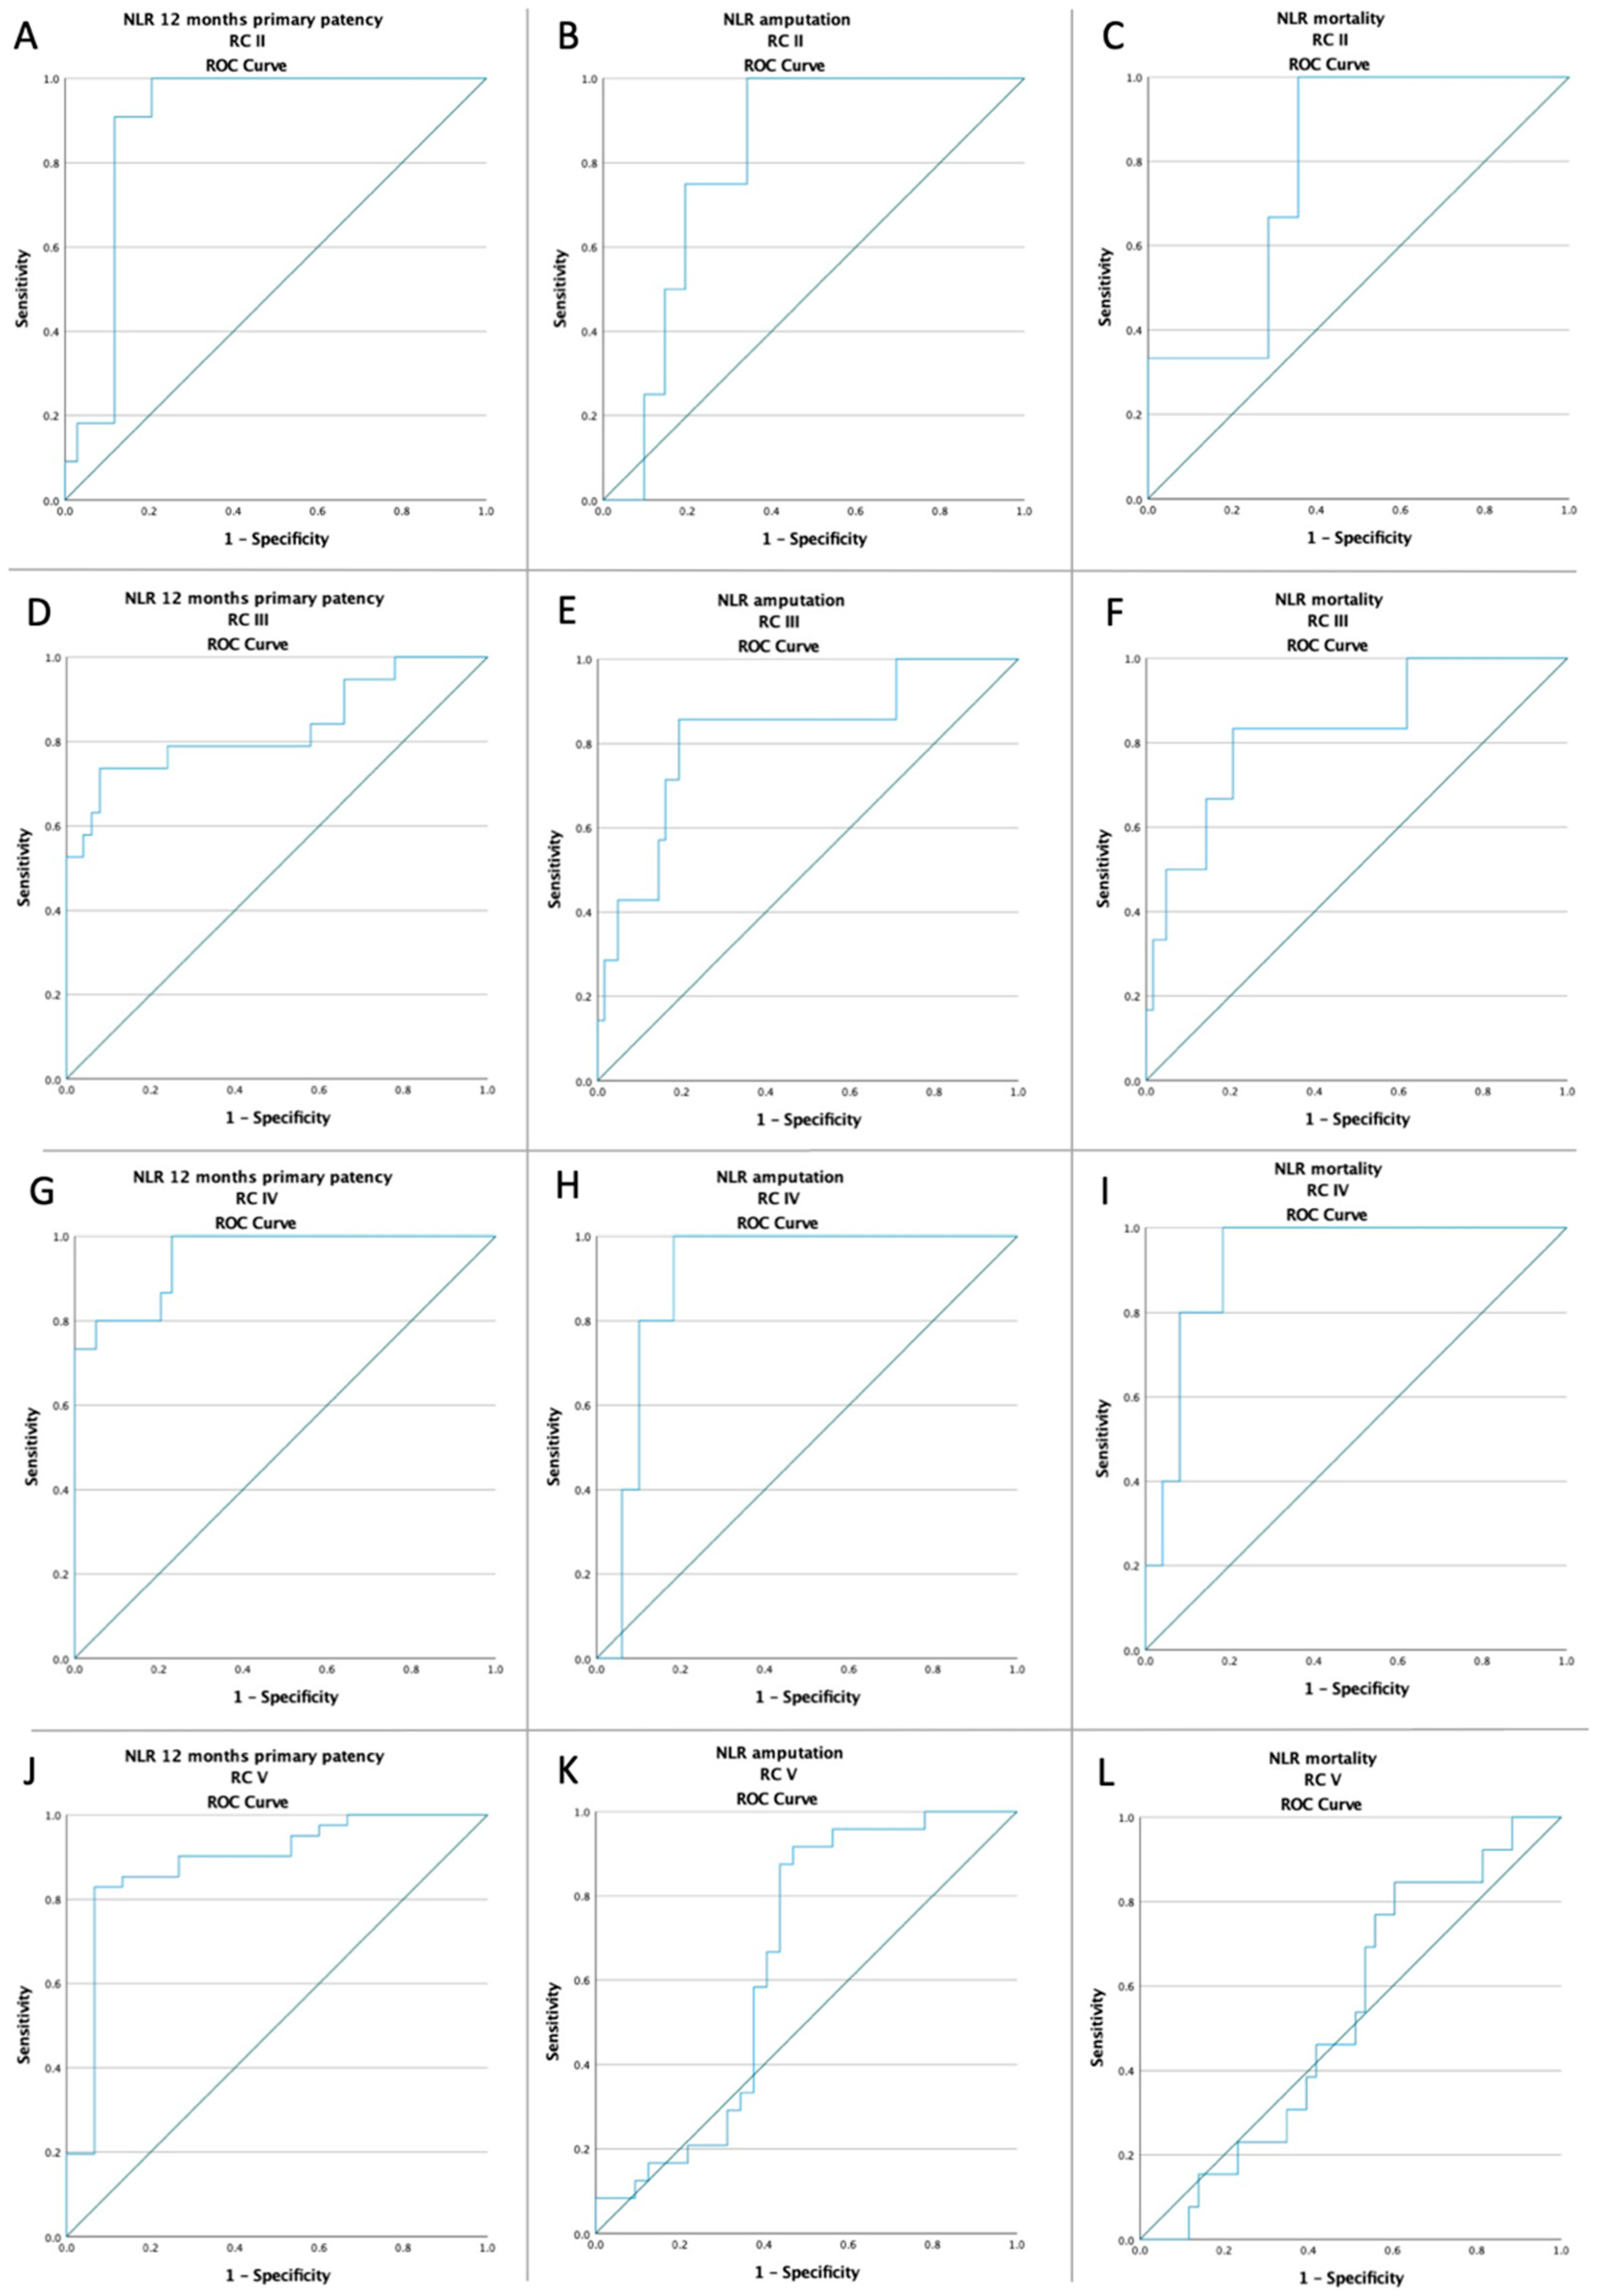
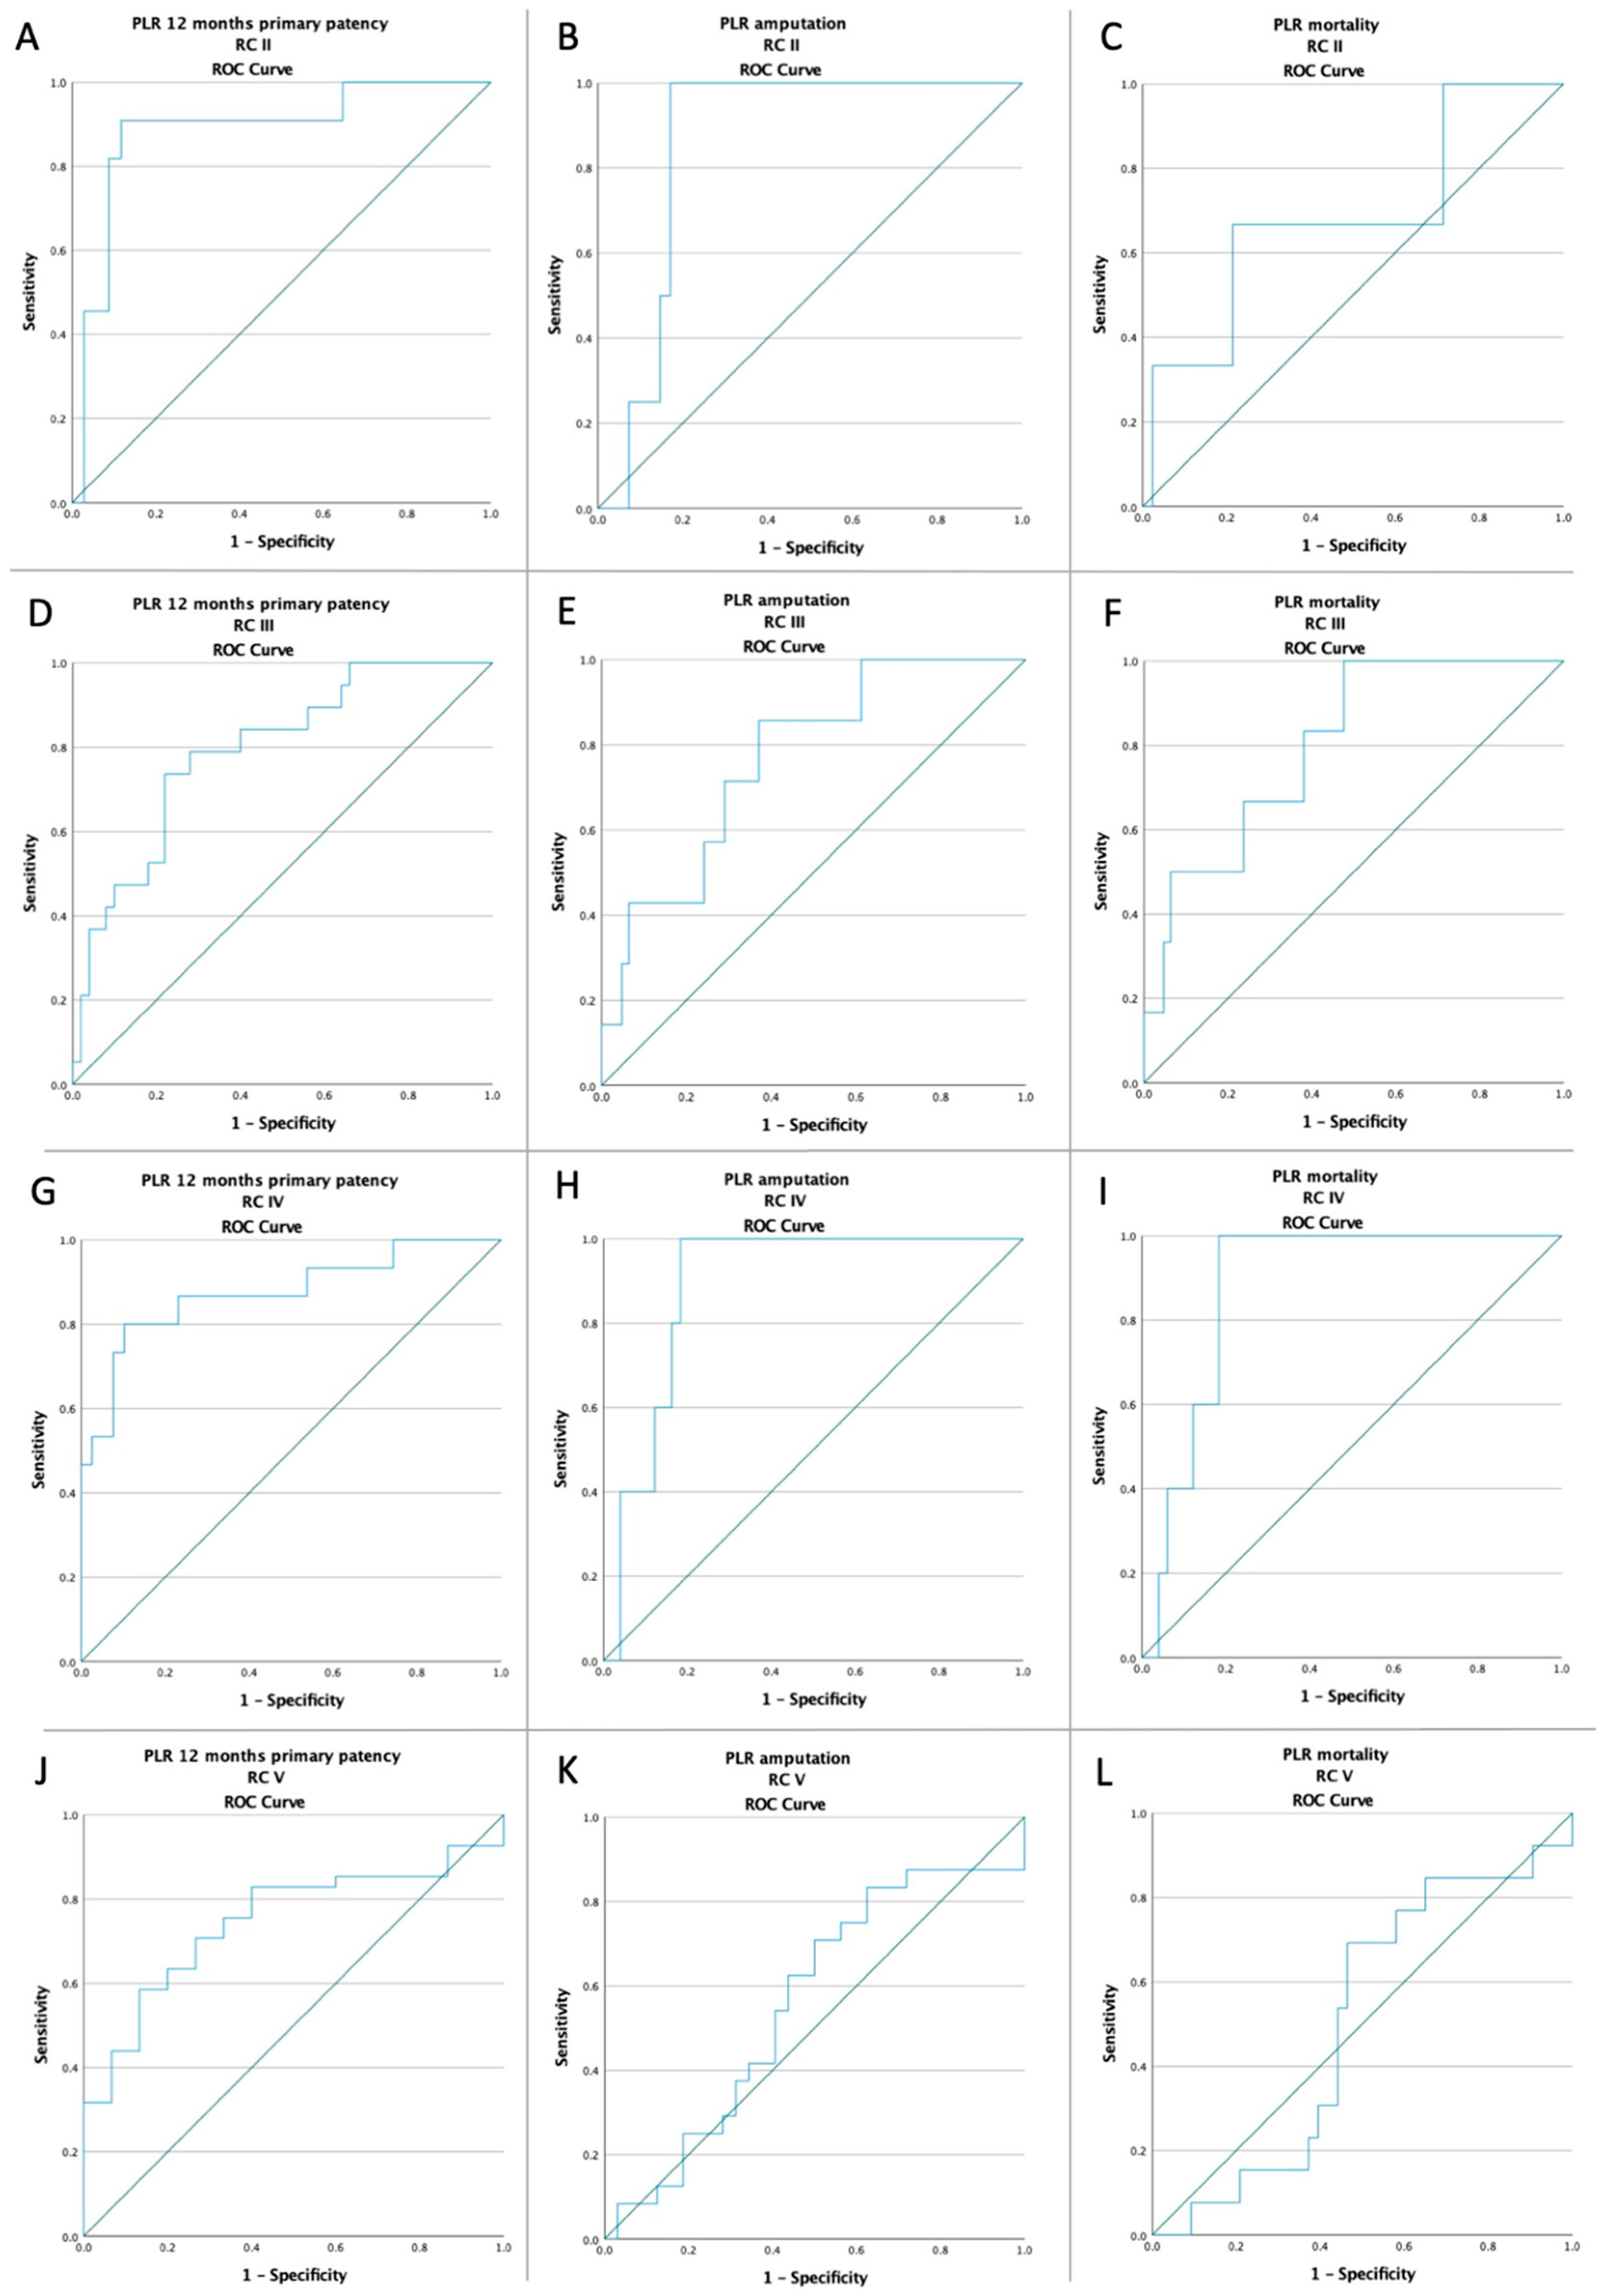
| RC II | 0.44 | 0.21–0.94 | 0.03 | 0.38 | 0.13–1.15 | 0.46 | 0.46 | 0.13–1.60 | 0.22 |
| RC III | 0.49 | 0.26–0.92 | 0.02 | 0.41 | 0.17–0.99 | 0.04 | 0.60 | 0.23–1.58 | 0.30 |
| RC IV | 0.53 | 0.27–1.04 | 0.06 | 0.39 | 0.14–1.06 | 0.06 | 0.68 | 0.24–1.91 | 0.057 |
| RC V | 7.47 | 3.77–14.79 | <0.001 | 7.12 | 3.40–14.91 | <0.001 | 3.32 | 1.45–7.60 | 0.004 |
| high-NLR | 41.92 | 19.13–91.87 | <0.001 | 24.79 | 8.39–73.27 | <0.001 | 12.52 | 4.15–37.74 | <0.001 |
| high-PLR | 17.94 | 9.08–35.45 | <0.001 | 12.31 | 4.89–30.95 | <0.001 | 7.98 | 2.89–22.00 | <0.001 |
Publisher’s Note: MDPI stays neutral with regard to jurisdictional claims in published maps and institutional affiliations. |
© 2022 by the authors. Licensee MDPI, Basel, Switzerland. This article is an open access article distributed under the terms and conditions of the Creative Commons Attribution (CC BY) license (https://creativecommons.org/licenses/by/4.0/).
Share and Cite
Russu, E.; Mureșan, A.V.; Arbănași, E.M.; Kaller, R.; Hosu, I.; Voidăzan, S.; Arbănași, E.M.; Coșarcă, C.M. The Predictive Role of NLR and PLR in Outcome and Patency of Lower Limb Revascularization in Patients with Femoropopliteal Disease. J. Clin. Med. 2022, 11, 2620. https://0-doi-org.brum.beds.ac.uk/10.3390/jcm11092620
Russu E, Mureșan AV, Arbănași EM, Kaller R, Hosu I, Voidăzan S, Arbănași EM, Coșarcă CM. The Predictive Role of NLR and PLR in Outcome and Patency of Lower Limb Revascularization in Patients with Femoropopliteal Disease. Journal of Clinical Medicine. 2022; 11(9):2620. https://0-doi-org.brum.beds.ac.uk/10.3390/jcm11092620
Chicago/Turabian StyleRussu, Eliza, Adrian Vasile Mureșan, Emil Marian Arbănași, Réka Kaller, Ioan Hosu, Septimiu Voidăzan, Eliza Mihaela Arbănași, and Cătălin Mircea Coșarcă. 2022. "The Predictive Role of NLR and PLR in Outcome and Patency of Lower Limb Revascularization in Patients with Femoropopliteal Disease" Journal of Clinical Medicine 11, no. 9: 2620. https://0-doi-org.brum.beds.ac.uk/10.3390/jcm11092620