1. Introduction
Gestational diabetes (GDM) is one of the most common complications during pregnancy, with short- and long-term implications for the mother, fetus, and offspring [
1]. However, despite large-scale studies, major controversies remain about its diagnosis, treatment, and future implications.
The American College of Obstetrics and Gynecology (ACOG) recommends screening all pregnant women for GDM, preferably at 24 + 0 to 28 + 6 gestational weeks [
1,
2]. In the United States, the preferred method for screening is the two-steps approach, which uses the glucose challenging test (GCT) followed by a diagnostic 3 h 100 g oral glucose tolerance test (oGTT) for the screen-positive women [
1]. The timing of oGTT between 24 and 28 weeks of pregnancy was chosen to align with the physiological changes of pregnancy, maximizing the number of chances to detect GDM and allow for timely intervention and management.
Notably, over the last years, several publications investigated the importance of late GDM, diagnosed in the third trimester after 28 gestational weeks. In a Dutch cohort study, the authors reported GDM diagnoses in 23.5% of parturients who initially tested negative at 24–28 gestational weeks [
3]. Similarly, other studies demonstrated around 25% late GDM diagnoses in women who underwent late oGTT because of suspected large-for-gestational-age fetuses or polyhydramnios [
4,
5,
6], with even higher rates of GDM for women with obesity [
5,
6].
Several studies evaluated the clinical implications of late GDM [
5,
7,
8,
9,
10], emphasizing short-term maternal and neonatal outcomes with conflicting results, especially regarding the delivery of large-for-gestational-age babies and mode of delivery. To note, there was great variance among studies regarding the population, the methodology, the definition of late GDM, the GDM screening approach, and the evaluated outcomes; therefore, conclusions were hard to draw.
Regardless of that, GDM is a well-established risk factor for type 2 diabetes mellitus (T2DM). It is estimated that up to 70% of women with GDM will develop T2DM 22–28 years after pregnancy [
1]. To the best of our knowledge, none of the studies that investigated late oGTT evaluated the risk of future T2DM based on the timing of GDM diagnosis during pregnancy. Thus, in this study, we aimed to investigate the risk of T2DM in women who performed abnormal late oGTT during pregnancy in a large cohort of women with 5 years of follow-up after pregnancy.
2. Materials and Methods
A retrospective cohort study aimed to evaluate the prediction performance of late 100 g oGTT during pregnancy for T2DM in a 5-year follow-up. The study included all women with documented singleton pregnancies (by pregnancy registry) without diabetes diagnosis, with last menstrual period (LMP) between 1 January 2017 and 31 December 2020. Pregnancies complicated by early GDM, defined as fasting plasma glucose at early pregnancy at or above 92 mg/dL, or women who performed oGTT at less than 24 gestational weeks were excluded. For women with more than one pregnancy during the study period, only the first pregnancy was included to ensure the longest available follow-up time. On-time oGTT was defined as oGTT performed between 24 + 0 and 28 + 6 weeks. Late oGTT was defined as oGTT performed after 28 gestational weeks. Risk for T2DM was compared between women with abnormal oGTT results—either single abnormal value (SAV) or GDM and, according to oGTT timing, on-time oGTT vs. late oGTT. Follow-up time was defined as the date of diabetes diagnosis, the date of data extraction (13 November 2022), or death—whichever came first. The study was approved by the local Institutional Review Board committee (10-18-08-21). Due to the retrospective nature of the study, informed consent was waived.
For this study, data were extracted from a dataset encompassing more than 5 years of laboratory data collected by Meuhedet HMO (health maintenance organization), cross-tabulated with a pregnancy registry, and integrated with the Israeli National Diabetes Registry (INDR). Meuhedet is one of the four Israel health insurance and medical services organizations to which Israeli residents must belong under Israel’s universal healthcare framework. Maternal data included maternal age, body mass index (BMI), and diagnosis of hypertension. Delivery data included gestational age at delivery and neonatal gender. All clinical data were retrieved from the parturient electronic medical records at the time of pregnancy. Laboratory data included first-trimester fasting glucose levels, 50 g glucose challenge test (GCT), and 100 g oGTT values. T2DM diagnosis was retrieved from the INDR. As previously described [
11], since 2012, all health medical organizations in Israel are required by law to report cases of diabetes to the INDR. Data in this registry were linked to the pregnancy registry and the laboratory data of Meuhedet. Diabetes diagnosis is updated daily to the registry and defined as meeting one or more of the following criteria: (1) glycated hemoglobin greater than or equal to 6.5% (47.5 mmol/mol), (2) serum glucose concentrations greater than or equal to 200 mg/dL (11.1 mmol/L) in 2 tests performed at an interval of at least 1 month, and (3) 3 or more purchases of glucose-lowering medications. The registry has a sensitivity of 95% and the positive predictive value is 93%.
By convention, and according to Israeli guidelines, all parturients are recommended to undergo fasting plasma glucose level in the first trimester to exclude overt diabetes (>125 mg/dL). Screening for GDM is recommended for all women at 24–28 gestational weeks by the two-steps approach. Late oGTT, after 28 weeks, is usually performed for latecomers or as part of large-for-gestational-age or polyhydramnios evaluation. Threshold values for GDM are consistent throughout pregnancy and defined according to the Carpenter and Coustan values [
2], which require a GDM diagnosis to include at least two out of four abnormal values.
Statistical Analysis
At first, we utilized univariate analysis to evaluate differences between women who performed on-time oGTT, late oGTT, or had normal glucose tolerance. Also, we evaluated differences according to oGTT results: between women with SAV or GDM at on-time oGTT and women with SAV or GDM at late oGTT. We determined all women in the cohort without SAV or GDM diagnosis (including women with normal GCT or women with four normal values on oGTT) as women with normal glucose tolerance (control group). Maternal age and BMI were evaluated both as continuous variables and as categorical variables (with a cutoff of 35 and 40 years for age and 30 kg/m2 for BMI). Glucose levels, gestational age at delivery, and time to follow-up were treated as continuous variables, while hypertension, GDM, neonatal gender, and T2DM were treated as categorical variables. Categorical variables were compared using χ2 tests, and the Kruskal–Wallis test was used to test differences for continuous variables. All the tests were 2-tailed and p < 0.05 was considered statistically significant. Next, to account for different follow-up times, we computed Kaplan–Meier hazard curves, applied Cox regression analysis, and determined the Hazard ratio (HR) with a 95% confidence interval (CI) for the cumulative incidence of T2DM, with maternal age, BMI, and maternal hypertension as covariates, using the control group as the reference group.
Lastly, due to the large impact of obesity on future T2DM, the risk for T2DM according to oGTT results was stratified according to maternal pre-pregnancy BMI and divided into women with obesity (BMI ≥ 30 kg/m2) and without obesity (BMI < 30 kg/m2).
3. Results
3.1. Study Population
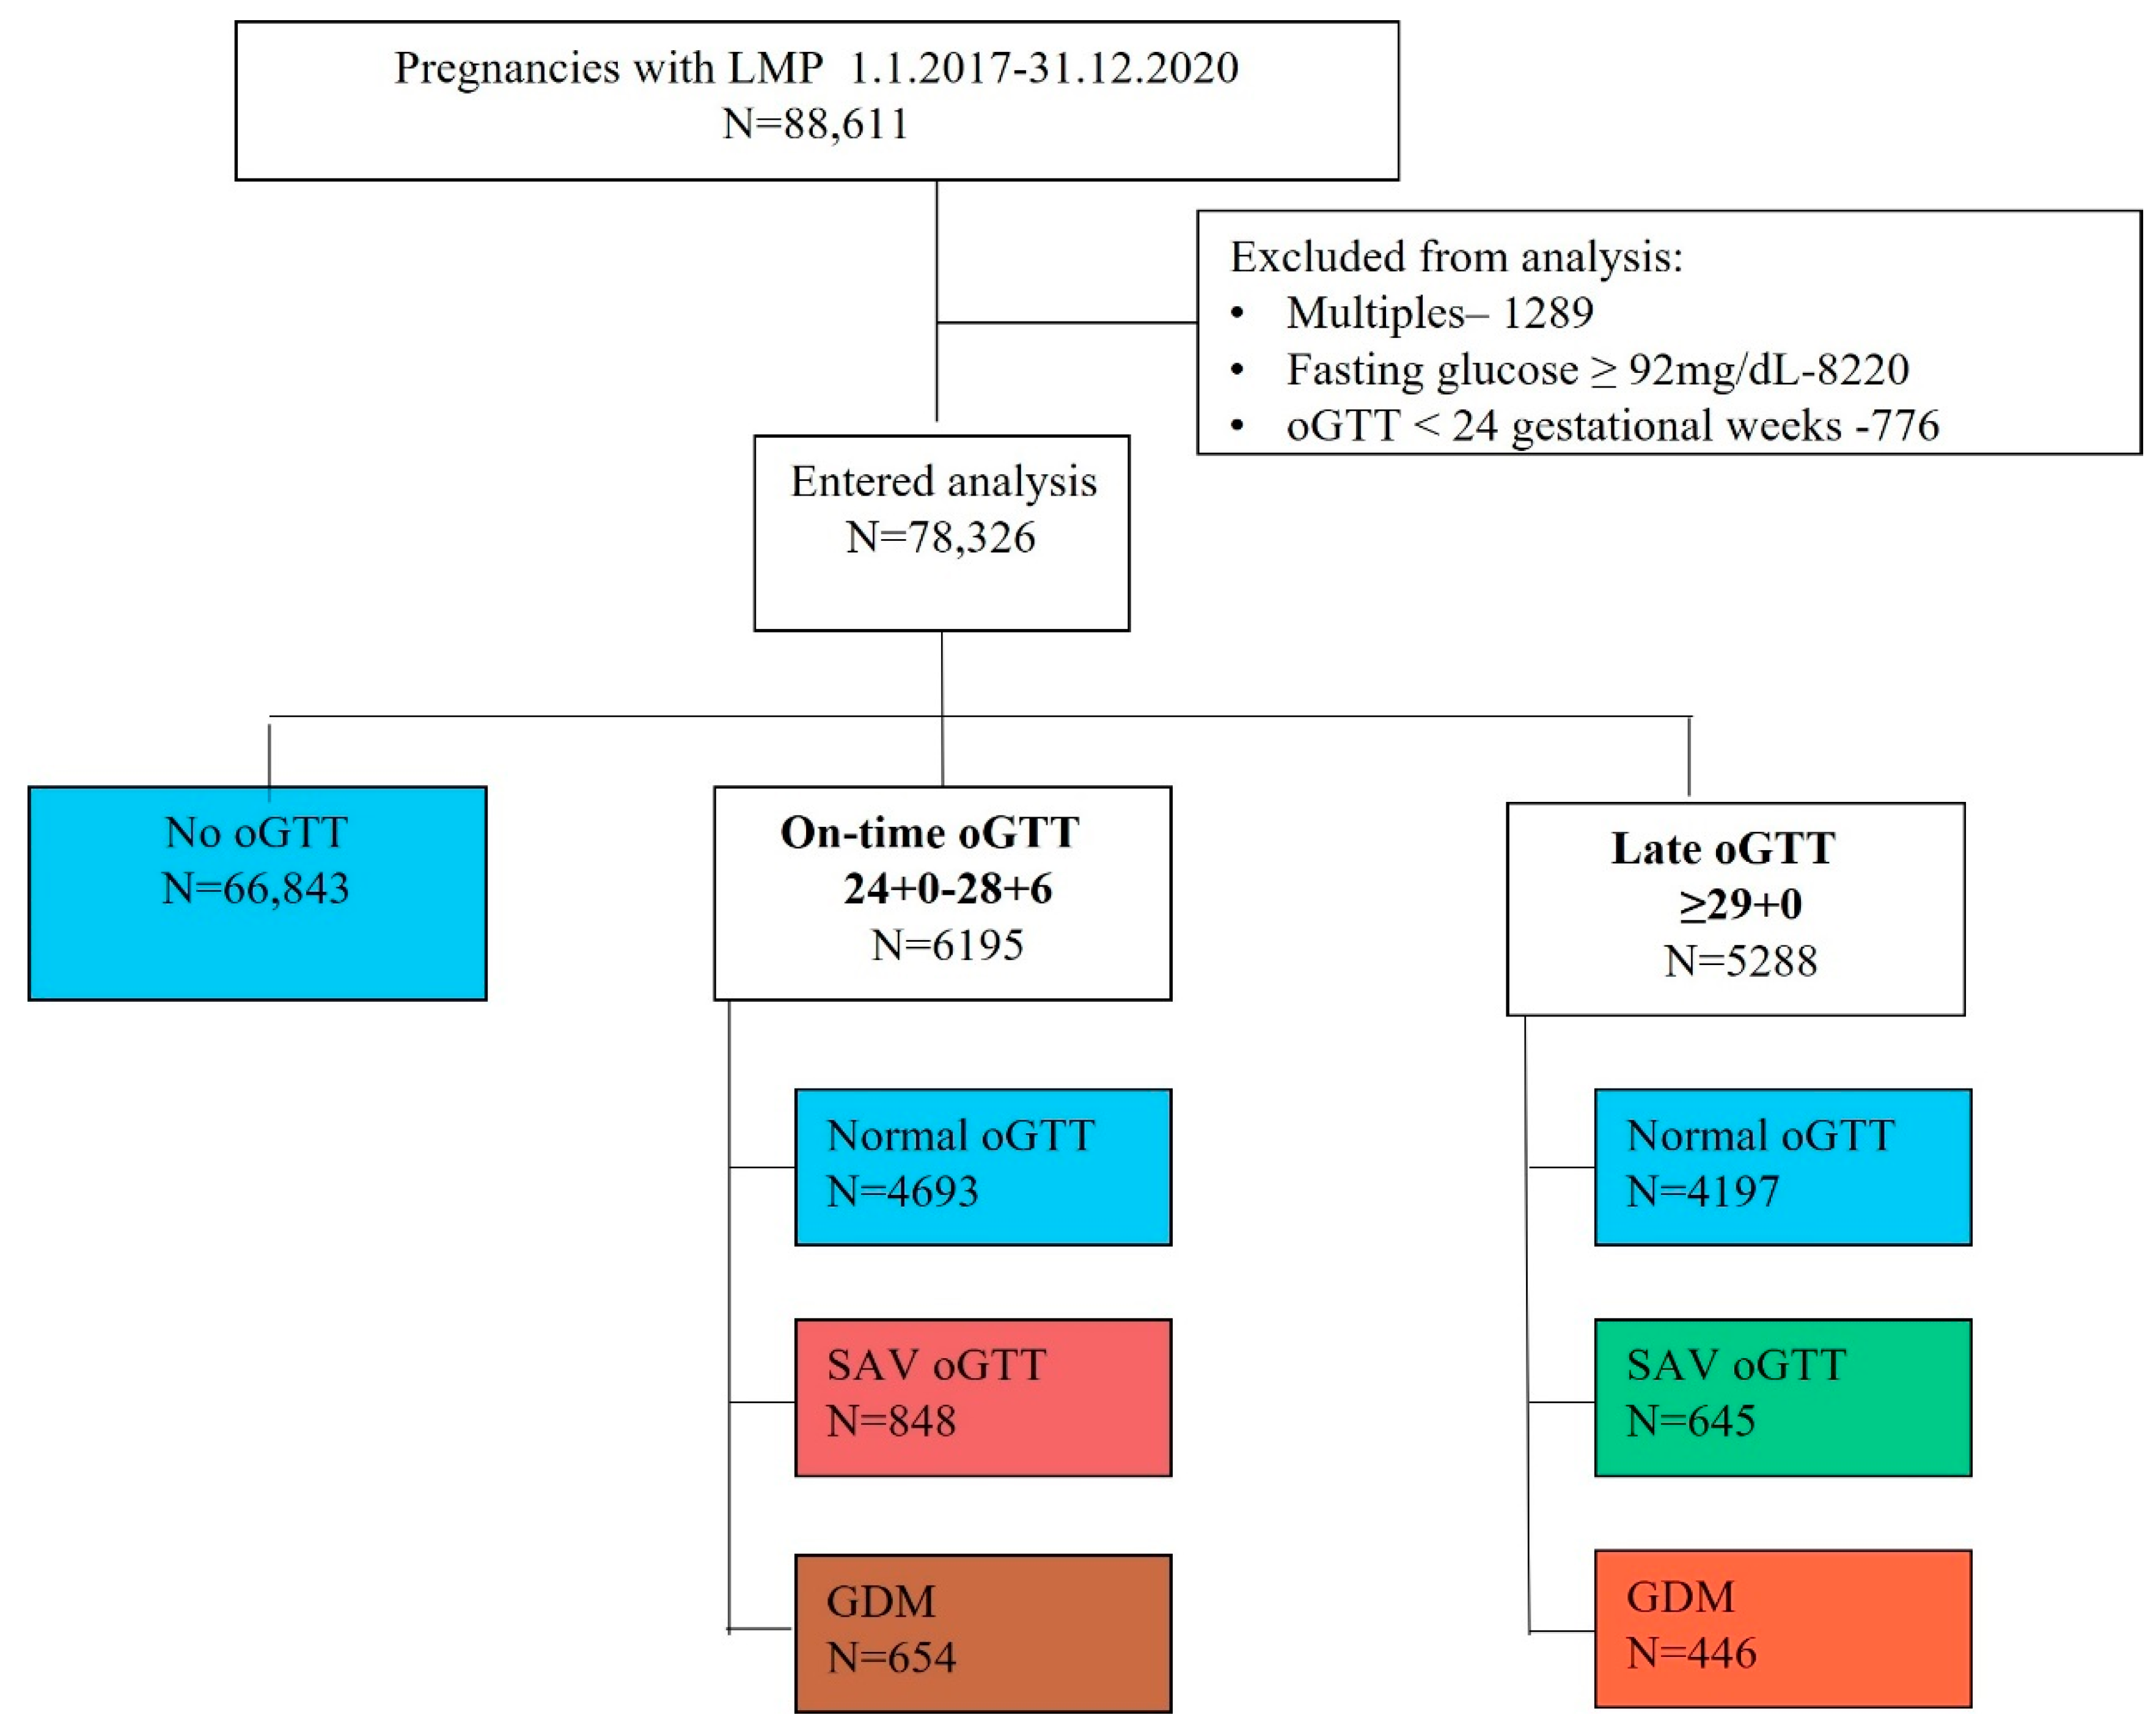
Our dataset included 88,611 women with LMP during the study period and T2DM data. After excluding all multiple pregnancies (n = 1289), women with first-trimester fasting plasma glucose levels ≥ 92 mg/dL (n = 8220), and women with oGTT performed prior to 24 weeks gestation (n = 776), we were left with 78,326 women who were eligible for analysis. Of them, 6195 (7.9%) women performed oGTT at 24 + 0–28 + 6 gestational weeks (on-time oGTT) and 5288 (6.8%) performed oGTT after 28 gestational weeks (late oGTT). Demographics, baseline characteristics, glucose values, and rates of T2DM according to the timing of oGTT are presented in
Table 1 and
Figure 1. Overall, women who performed late oGTT had lower rates of abnormal oGTT results and lower rates of T2DM during the study period. Maternal variables and risk for T2DM are further presented, stratified by oGTT results when performed on time and late in gestation (
Table 2). Regardless of oGTT timing, women with GDM were older and had higher obesity levels compared to women with normal glucose tolerance. Moreover, their glucose values throughout pregnancy were higher compared to women with SAV oGTT or women with normal glucose tolerance (
Table 2).
3.2. Incidence of Type 2 Diabetes
In the univariate analysis, for women who performed late oGTT, GDM diagnosis was associated with higher rates of T2DM compared to SAV oGTT or normal glucose tolerance. Nevertheless, unlike women with on-time oGTT, SAV results on late oGTT were not associated with an increased risk for T2DM compared to women with normal glucose tolerance.
Using the Cox-regression survival analysis, and adjusted to maternal age, BMI, and hypertension, abnormal oGTT results, either SAV or GDM, that were diagnosed from on-time oGTT (24–28 gestational weeks) indicated a higher risk for T2DM compared to SAV or GDM that was diagnosed after 28 gestational weeks (
Table 3,
Figure 2).
3.3. Stratification by Obesity Status
Due to the significant association between BMI and T2DM, which was also evident in our cohort, we repeated the analysis separately for women with and without obesity (
Table 4 and
Table 5,
Figure 3). The absolute incidence of T2DM was higher for women with obesity. That being said, their aHR that was solely related to abnormal oGTT results was lower compared to women without obesity.
4. Discussion
In this study, we aimed to investigate the risk of T2DM, over 5 years of follow-up, among women with abnormal oGTT results performed after 28 weeks of gestation (late oGTT) as compared to women who had abnormal oGTT results at 24–28 weeks of gestation (on time oGTT) and to women with normal glucose tolerance.
Our study results demonstrate the following findings: a. Women who perform late oGTT have lower rates of GDM and T2DM; b. Once GDM is diagnosed, regardless of oGTT timing, the risk of T2DM is increased even in a 5-year follow-up; c. The risk of T2DM following GDM diagnosis at late oGTT is increased for women with and without obesity; d. A SAV oGTT is associated with T2DM only if oGTT was performed prior to 28 gestational weeks.
4.1. Results in the Context of What Is Known
GDM is considered a well-established risk factor for the development of T2DM [
1,
2]. However, since the majority of GDM cases are diagnosed between 24 + 0 and 28 + 6 weeks, none of the studies evaluated the risk of T2DM specifically when GDM was diagnosed later in gestation.
Prior studies that evaluated the clinical implication of late oGTT investigated the maternal and neonatal short-term outcomes with conflicting results [
5,
7,
10]. Thus, there is no consensus on yield and indications for performing oGTT in late pregnancy. Our results demonstrated that women who performed late oGTT had a lower prevalence of abnormal oGTT results, both SAV and GDM. This result is probably related to the different maternal characteristics and the indications for performing oGTT. Women who performed late oGTT were younger, with lower rates of hypertension and lower glucose levels in the first trimester and at GCT compared to women who performed on-time oGTT. Moreover, although indications for late oGTT were unavailable for this dataset, we assume that indications included latecomers or women with large-for-gestational-age fetuses or polyhydramnios with a previous normal GCT screening. Accordingly, this group represents women with lower pre-pregnancy metabolic risk and, therefore, lower abnormal oGTT risk and lower risk for T2DM.
According to our results, once GDM was diagnosed, regardless of the timing of the oGTT, the risk for T2DM was about three folds higher compared to women with normal glucose tolerance during gestation. Nevertheless, women with only a SAV oGTT had a statistically significant increased risk for T2DM only if oGTT was performed between 24 + 0 and 28 + 6 gestational weeks. Several possibilities can explain this difference. First, insulin resistance during pregnancy is mainly increased from 16 to 26 weeks of gestation, with a mild increase thereafter [
12]. It is possible that late GDM, diagnosed to a large extent after normal GCT screening, represents milder insulin insensitivity when compared to on-time oGTT; therefore, when using the same thresholds for diagnosis, abnormal oGTT results will be associated with lower rates of T2DM compared to on-time oGTT. This is supported by the fact that SAV in late oGTT, unlike in on-time oGTT, was not statistically associated with an increased risk of T2DM in our cohort. These women may be prone to T2DM later in life, and our limited 5-year follow-up was too short to detect the risk. A second possible explanation considers the need for different thresholds for GDM diagnosis at a more advanced stage of pregnancy. O’Sullivan, who set the first thresholds for GDM, tested women in their second and third trimesters [
13]. Further studies have tried to determine the correct thresholds during the third trimester regarding fetal outcomes [
14]. The authors compared the glucose levels by home glucose monitoring between 2 groups of women who conducted oGTT after 33 weeks due to risk factors. One group was diagnosed with GDM and the other was negative. They found that the distribution of glucose values between the groups was significantly different nevertheless, with overlapping. Women who were diagnosed and treated reached lower glucose values in the third trimester and had lower rates of macrosomia and cesarean deliveries. These results were explained by the continuity effect of hyperglycemia. The authors concluded that high-risk women who do not fulfill the criteria for GDM diagnosis should be treated with the same attention as GDM parturients due to their risk factors and that no different thresholds should be set. Lastly, it is possible that the reproducibility of the oGTT decreases with advanced gestational age; therefore, there are more false positive and negative results for late oGTT [
15].
4.2. Obesity and Type 2 Diabetes Incident
The underlying mechanism for T2DM is thought to be different among women with and without obesity [
16]. A common underlying mechanism for GDM development is relative pancreatic insufficiency or β-cell dysfunction, which is possibly the predominant mechanism in women with normal BMI. Advanced gestation insulin resistance increases in order to preserve fetal demands, leading to accelerating ongoing pancreatic β-cell exhaustion and an increased risk of postpartum T2DM. Alternatively, in women with obesity, excessive adiposity may promote a proinflammatory state and insulin resistance, which contribute to both GDM development and later T2DM [
17].
Prior studies that evaluated combinations of risk factors and postpartum dysglycemia [
16] demonstrated that GDM alone had a comparable risk for T2DM, such as having two risk factors—obesity or post-delivery weight retention, for example. Having GDM on top of these risk factors exacerbates the effect of GDM on T2DM development. Concordant with that observation, our results showed that women with obesity had a significantly higher risk of developing T2DM compared to women without obesity. That being said, GDM diagnosis increased the risk of T2DM in women with and without obesity.
4.3. Research Implications
Our results emphasize the need to set universal standards for late oGTT, regarding indications, thresholds of diagnosis, and treatment advantage. Further studies should focus on both short-term and long-term outcomes for the mother and offspring and the extent of improvement in outcomes.
Since hyperglycemia is a continuum throughout pregnancy, and several studies have demonstrated increased fetal and maternal risk with increasing glucose levels even within the normal range [
18,
19], we need models with a longer follow-up time to determine the actual risk of late GDM and SAV diagnosis. Understanding the long-term implications of the late GDM diagnosis might clarify the underlying mechanism and contribute to the follow-up and therapeutic approach to these patients.
4.4. Clinical Implications
Our results imply that GDM diagnosed in late gestation represents a true metabolic disturbance and is not just a matter of threshold. This may imply its significance when managing GDM diagnosed in late gestation. Moreover, our results suggest that women with late GDM diagnoses should be further evaluated for risk factors and be tested for diabetes postpartum according to the ADA guidelines [
2] in a similar way to women diagnosed with GDM at 24 + 0 and 28 + 6 gestational weeks. Regarding SAV, our findings do not support the need for GDM follow-up postpartum for women with late SAV solely based on this diagnosis. However, as long as we continue to diagnose late GDM with the same thresholds, we should treat these women with caution and recruit them to follow up according to their risk factors, regardless of their GDM status.
4.5. Strength and Limitations
The strengths of this study include the large cohort and the linkage of two detailed databases with systematic data collection measured rather than reported. Our results were based directly on the laboratory glucose values and INDR solid criteria and not on reported GDM or T2DM diagnosis. To avoid prediabetes patients, we only included women with fasting glucose less than 92 mg/dL and women with oGTT performed after 20 weeks. Nevertheless, our study was not free of limitations, mainly due to its retrospective nature. First, the Meuhedet HMO pregnancy registry has been limited to the last five years. Second, we lacked data on other covariates, such as a family history of T2DM or possible after-pregnancy interventions such as weight reduction or lifestyle modifications that might have interfered with the risk for T2DM. Third, we did not have the indication for late oGTT performance or if an oGTT was performed for the second time during pregnancy. Lastly, the INRD does not include prediabetic state and T2DM diagnosis by 75GR oGTT; however, only a few participants went through this test, and we assume all of them were captured by the INRD diagnostic criteria postpartum.
5. Conclusions
When diagnosed after 28 weeks, GDM, but not SAV, is associated with an increased risk of T2DM over 5 years of follow-up. Further studies are needed to standardize late oGTT regarding indications, thresholds for diagnosis, short- and long-term implications, and yield for treatment.
Author Contributions
Conceptualization, E.M.-S. and R.G.-B.; Data curation, R.G.-B.; Formal analysis, R.G.-B. and E.M.-S.; Investigation, M.H. and E.M.-S.; Methodology, Y.T. and R.G.-B.; Supervision, R.G.-B. and M.H.; Writing—original draft, E.M.-S.; Writing—review & editing, Y.T., M.H. and R.G.-B. All authors have read and agreed to the published version of the manuscript.
Funding
This research received no external funding.
Institutional Review Board Statement
This study was approved by the institutional review board in accordance with the Helsinki Declaration. IRB 10-18-08-21 was given at 18 August 2021.
Informed Consent Statement
Patient consent was waived since the research subjects’ identities were not known to the researchers.
Data Availability Statement
Data may by available upon request.
Conflicts of Interest
The authors declare no conflict of interest.
References
- Bulletins-Obstetrics, C. ACOG Practice Bulletin No. 190: Gestational Diabetes Mellitus. Obstet. Gynecol. 2018, 131, e49–e64. [Google Scholar]
- American Diabetes Association. Classification and Diagnosis of Diabetes: Standards of Medical Care in Diabetes—2021. Diabetes Care 2021, 44 (Suppl. S1), S15–S33, Erratum in Diabetes Care 2021, 44, 2182. [Google Scholar]
- de Wit, L.; Bos, D.M.; van Rossum, A.P.; van Rijn, B.B.; Boers, K.E. Repeated oral glucose tolerance tests in women at risk for gestational diabetes mellitus. Eur. J. Obstet. Gynecol. Reprod. Biol. 2019, 242, 79–85. [Google Scholar] [CrossRef] [PubMed]
- Sasson, A.M.; Shats, M.; Goichberg, Z.; Mazaki-Tovi, S.; Morag, I.; Hendler, I. Oral glucose tolerance test for suspected late onset gestational diabetes. J. Matern. Neonatal Med. 2021, 34, 3928–3932. [Google Scholar] [CrossRef] [PubMed]
- Abu Shqara, R.; Or, S.; Wiener, Y.; Lowenstein, L.; Wolf, M.F. Clinical implications of the 100-g oral glucose tolerance test in the third trimester. Arch. Gynecol. Obstet. 2023, 307, 421–429. [Google Scholar] [CrossRef] [PubMed]
- Abu Shqara, R.; Or, S.; Nakhleh Francis, Y.; Wiener, Y.; Lowenstein, L.; Wolf, M.F. Third trimester re-screening for gestational diabetes in morbidly obese women despite earlier negative test can reveal risks for obstetrical complications. J. Obstet. Gynaecol. Res. 2023, 49, 852–862. [Google Scholar] [CrossRef] [PubMed]
- Chionuma, J.; Akinola, I.; Dada, A.; Ubuane, P.; Kuku-Kuye, T.; Olalere, F. Profile of insulin resistance of pregnant women at late third trimester in Nigeria: A descriptive cross-sectional report. Niger. J. Clin. Pract. 2022, 25, 1736–1744. [Google Scholar] [CrossRef] [PubMed]
- Wolf, M.F.; Peleg, D.; Stahl-Rosenzweig, T.; Kurzweil, Y.; Yogev, Y. Isolated polyhydramnios in the third trimester: Is a gestational diabetes evaluation of value? Gynecol. Endocrinol. 2017, 33, 849–852. [Google Scholar] [CrossRef] [PubMed]
- Arbib, N.; Gabbay-Benziv, R.; Aviram, A.; Sneh-Arbib, O.; Wiznitzer, A.; Hod, M.; Chen, R.; Hadar, E. Third trimester abnormal oral glucose tolerance test and adverse perinatal outcome. J. Matern.-Fetal Neonatal Med. 2017, 30, 917–921. [Google Scholar] [CrossRef] [PubMed]
- Shindo, R.; Aoki, S.; Nakanishi, S.; Misumi, T.; Miyagi, E. Impact of gestational diabetes mellitus diagnosed during the third trimester on pregnancy outcomes: A case-control study. BMC Pregnancy Childbirth 2021, 21, 246. [Google Scholar] [CrossRef] [PubMed]
- Twig, G.; Zucker, I.; Afek, A.; Cukierman-Yaffe, T.; Bendor, C.D.; Derazne, E.; Lutski, M.; Shohat, T.; Mosenzon, O.; Tzur, D.; et al. Adolescent Obesity and Early-Onset Type 2 Diabetes. Diabetes Care 2020, 43, 1487–1495. [Google Scholar] [CrossRef] [PubMed]
- Stanley, K.; Fraser, R.; Bruce, C. Physiological changes in insulin resistance in human pregnancy: Longitudinal study with the hyperinsulinaemic euglycaemic clamp technique. BJOG Int. J. Obstet. Gynaecol. 1998, 105, 756–759. [Google Scholar] [CrossRef] [PubMed]
- O’sullivan, J.B.; Mahan, C.M. Criteria for the oral glucose tolerance test in pregnancy. Diabetes 1964, 13, 278–285. [Google Scholar] [PubMed]
- Cauldwell, M.; Chmielewska, B.; Kaur, K.; Van-De-L’Isle, Y.; Sherry, A.; Coote, I.W.; Steer, P.J. Screening for late-onset gestational diabetes: Are there any clinical benefits? BJOG Int. J. Obstet. Gynaecol. 2022, 129, 2176–2183. [Google Scholar] [CrossRef] [PubMed]
- Libman, I.M.; Barinas-Mitchell, E.; Bartucci, A.; Robertson, R.; Arslanian, S. Reproducibility of the oral glucose tolerance test in overweight children. J. Clin. Endocrinol. Metab. 2008, 93, 4231–4237. [Google Scholar] [CrossRef] [PubMed]
- Chen, L.-W.; Soh, S.E.; Tint, M.-T.; Loy, S.L.; Yap, F.; Tan, K.H.; Lee, Y.S.; Shek, L.P.-C.; Godfrey, K.M.; Gluckman, P.D.; et al. Combined analysis of gestational diabetes and maternal weight status from pre-pregnancy through post-delivery in future development of type 2 diabetes. Sci. Rep. 2021, 11, 5021. [Google Scholar] [CrossRef] [PubMed]
- Šimják, P.; Cinkajzlová, A.; Anderlová, K.; Pařízek, A.; Mráz, M.; Kršek, M.; Haluzík, M. The role of obesity and adipose tissue dysfunction in gestational diabetes mellitus. J. Endocrinol. 2018, 238, R63–R77. [Google Scholar] [CrossRef] [PubMed]
- Bo, S.; Monge, L.; Macchetta, C.; Menato, G.; Pinach, S.; Uberti, B.; Pagano, G. Prior gestational hyperglycemia: A long-term predictor of the metabolic syndrome. J. Endocrinol. Investig. 2004, 27, 629–635. [Google Scholar] [CrossRef] [PubMed]
- Riskin-Mashiah, S.; Younes, G.; Damti, A.; Auslender, R. First-trimester fasting hyperglycemia and adverse pregnancy outcomes. Diabetes Care 2009, 32, 1639–1643. [Google Scholar] [CrossRef] [PubMed]
| Disclaimer/Publisher’s Note: The statements, opinions and data contained in all publications are solely those of the individual author(s) and contributor(s) and not of MDPI and/or the editor(s). MDPI and/or the editor(s) disclaim responsibility for any injury to people or property resulting from any ideas, methods, instructions or products referred to in the content. |
© 2023 by the authors. Licensee MDPI, Basel, Switzerland. This article is an open access article distributed under the terms and conditions of the Creative Commons Attribution (CC BY) license (https://creativecommons.org/licenses/by/4.0/).


