
Anatomical Variations of the Human Cochlea Using an Image Analysis Tool
 , , , , , and
Abstract
:1. Introduction
2. Materials and Methods
2.1. Dataset
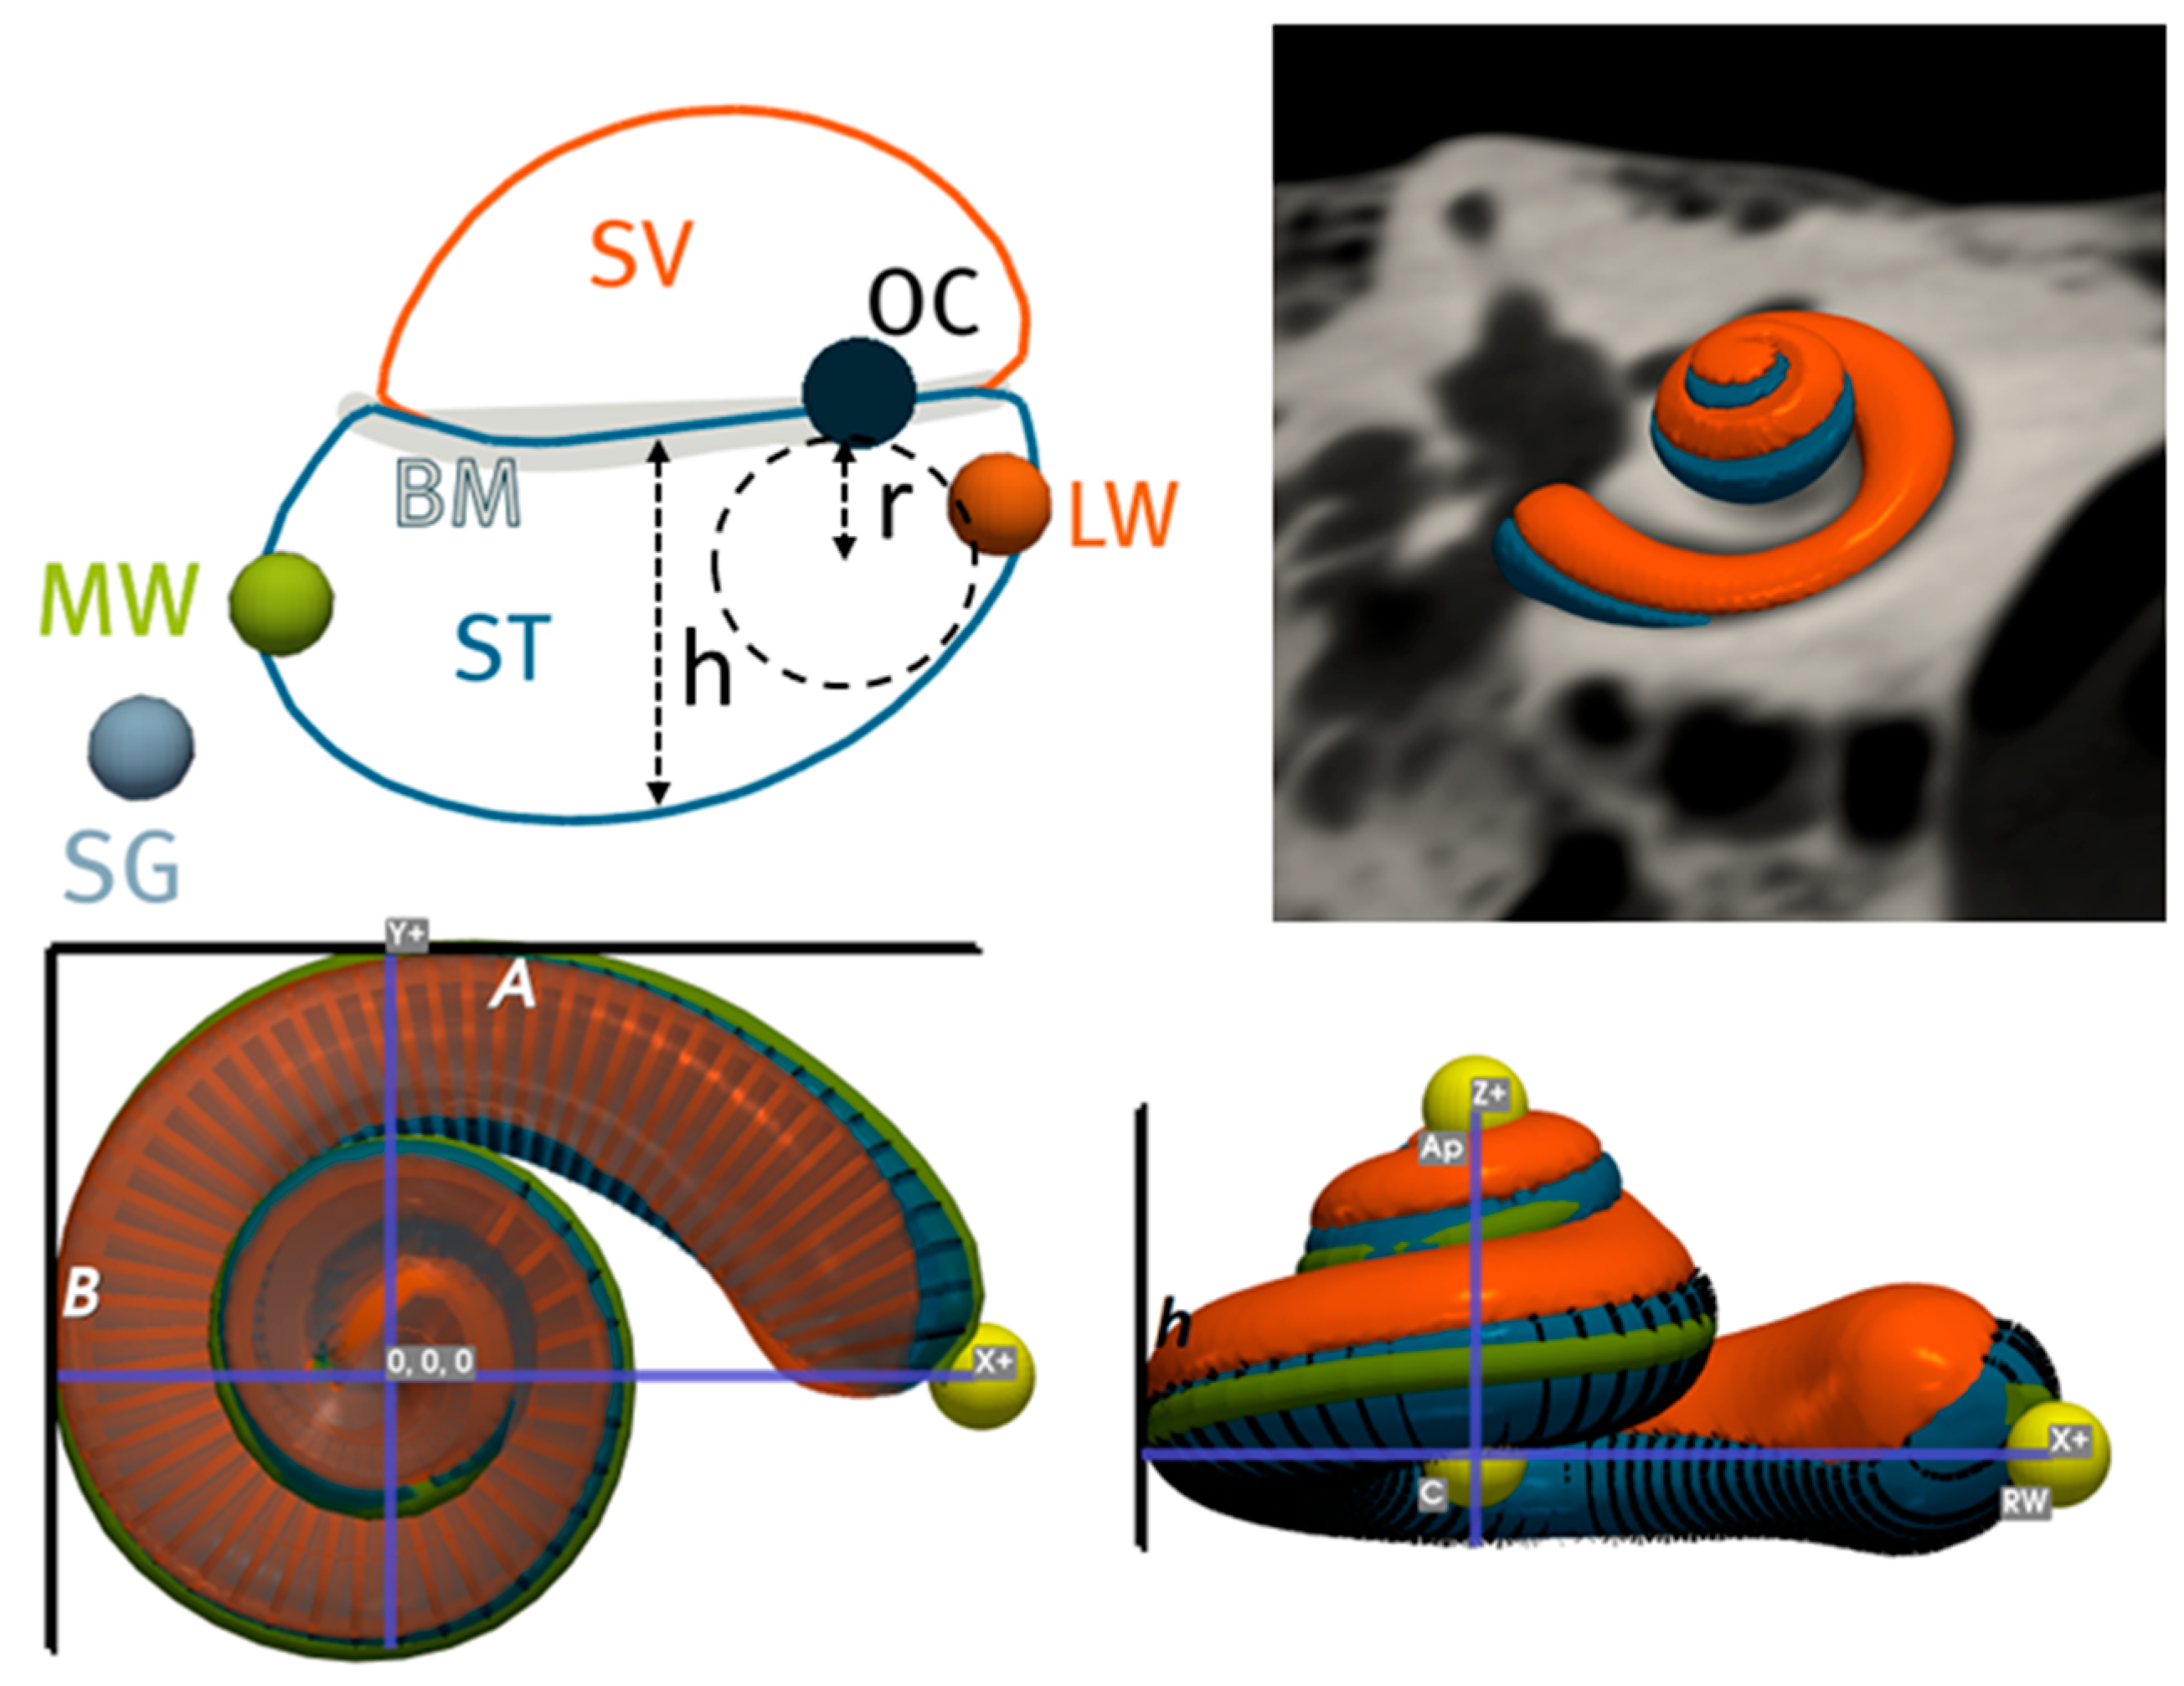
2.2. Image Analysis
2.3. Statistical Analysis
3. Results
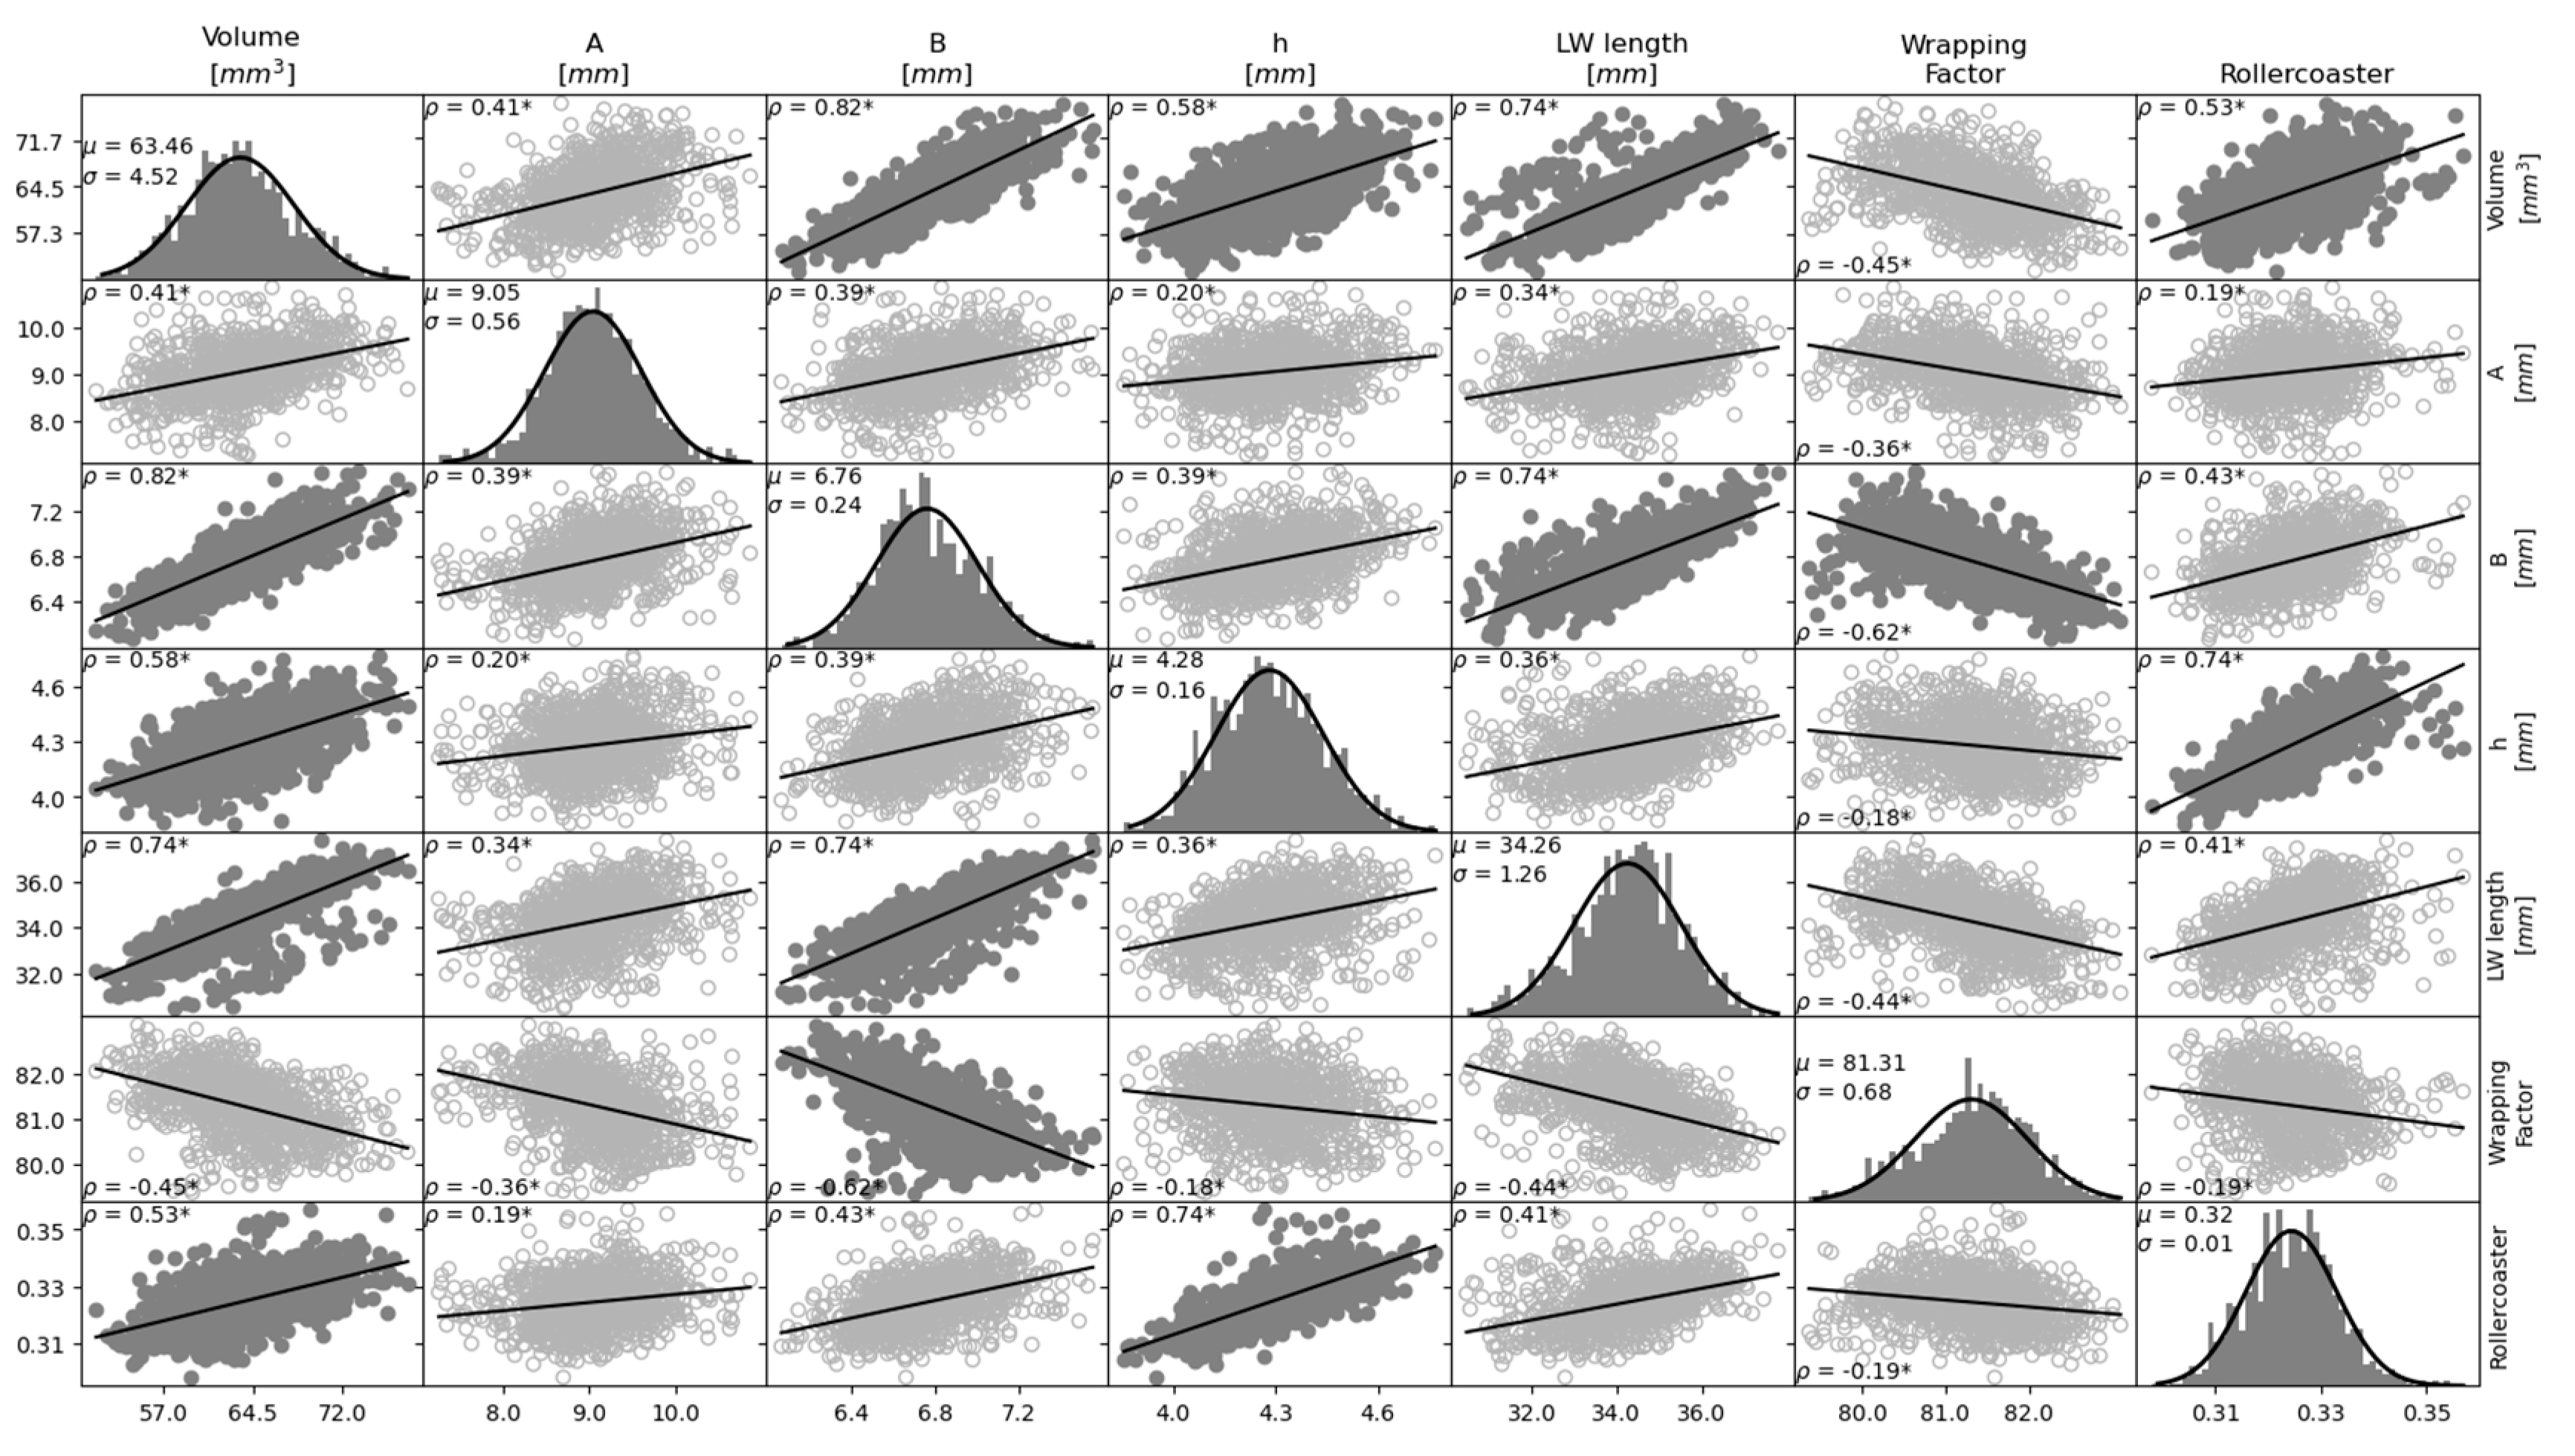
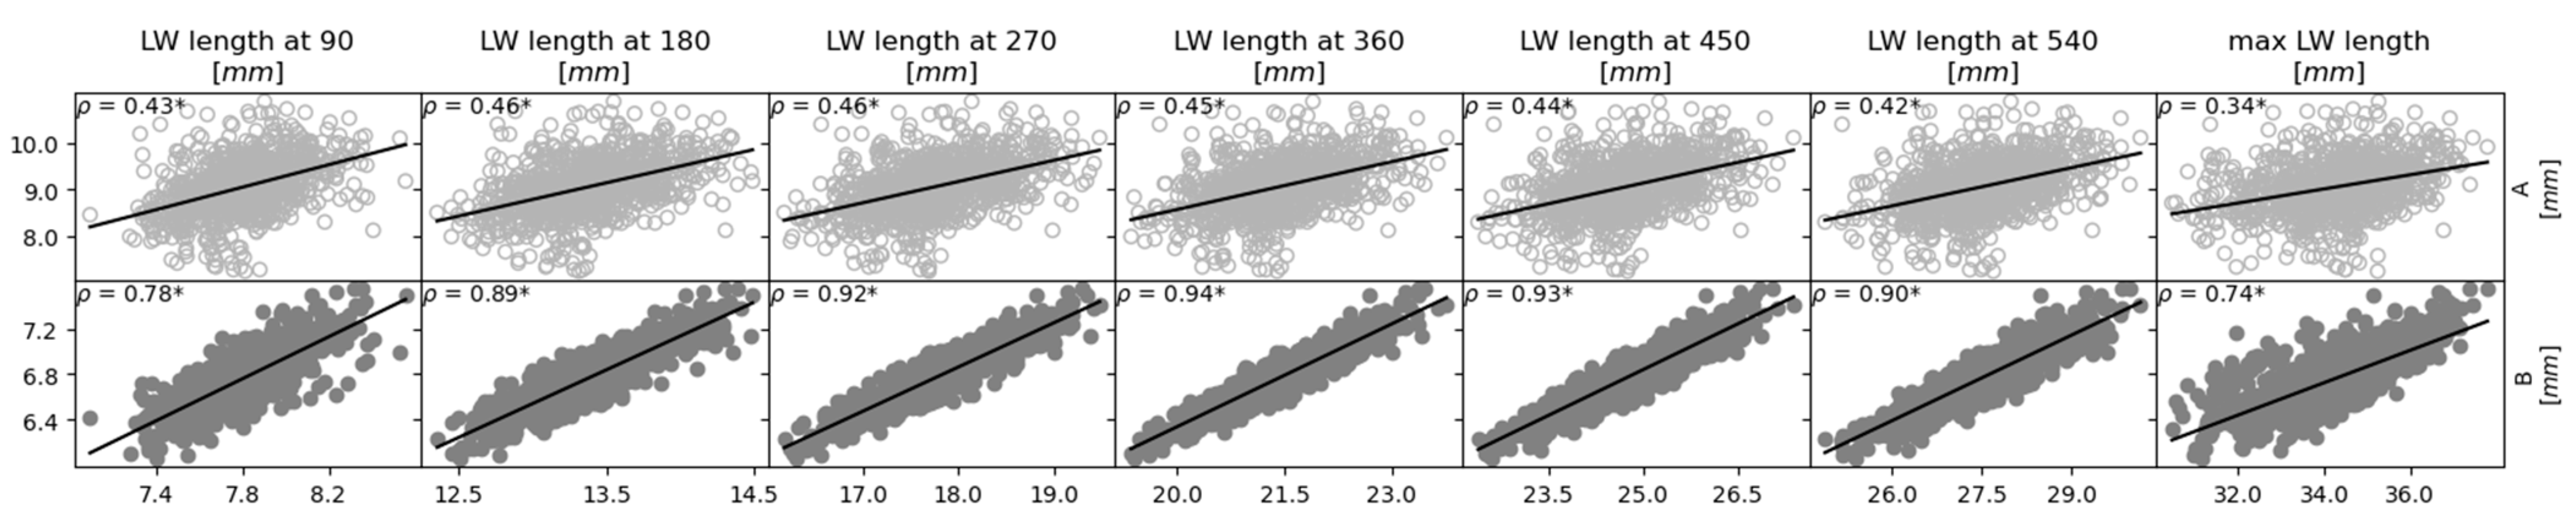
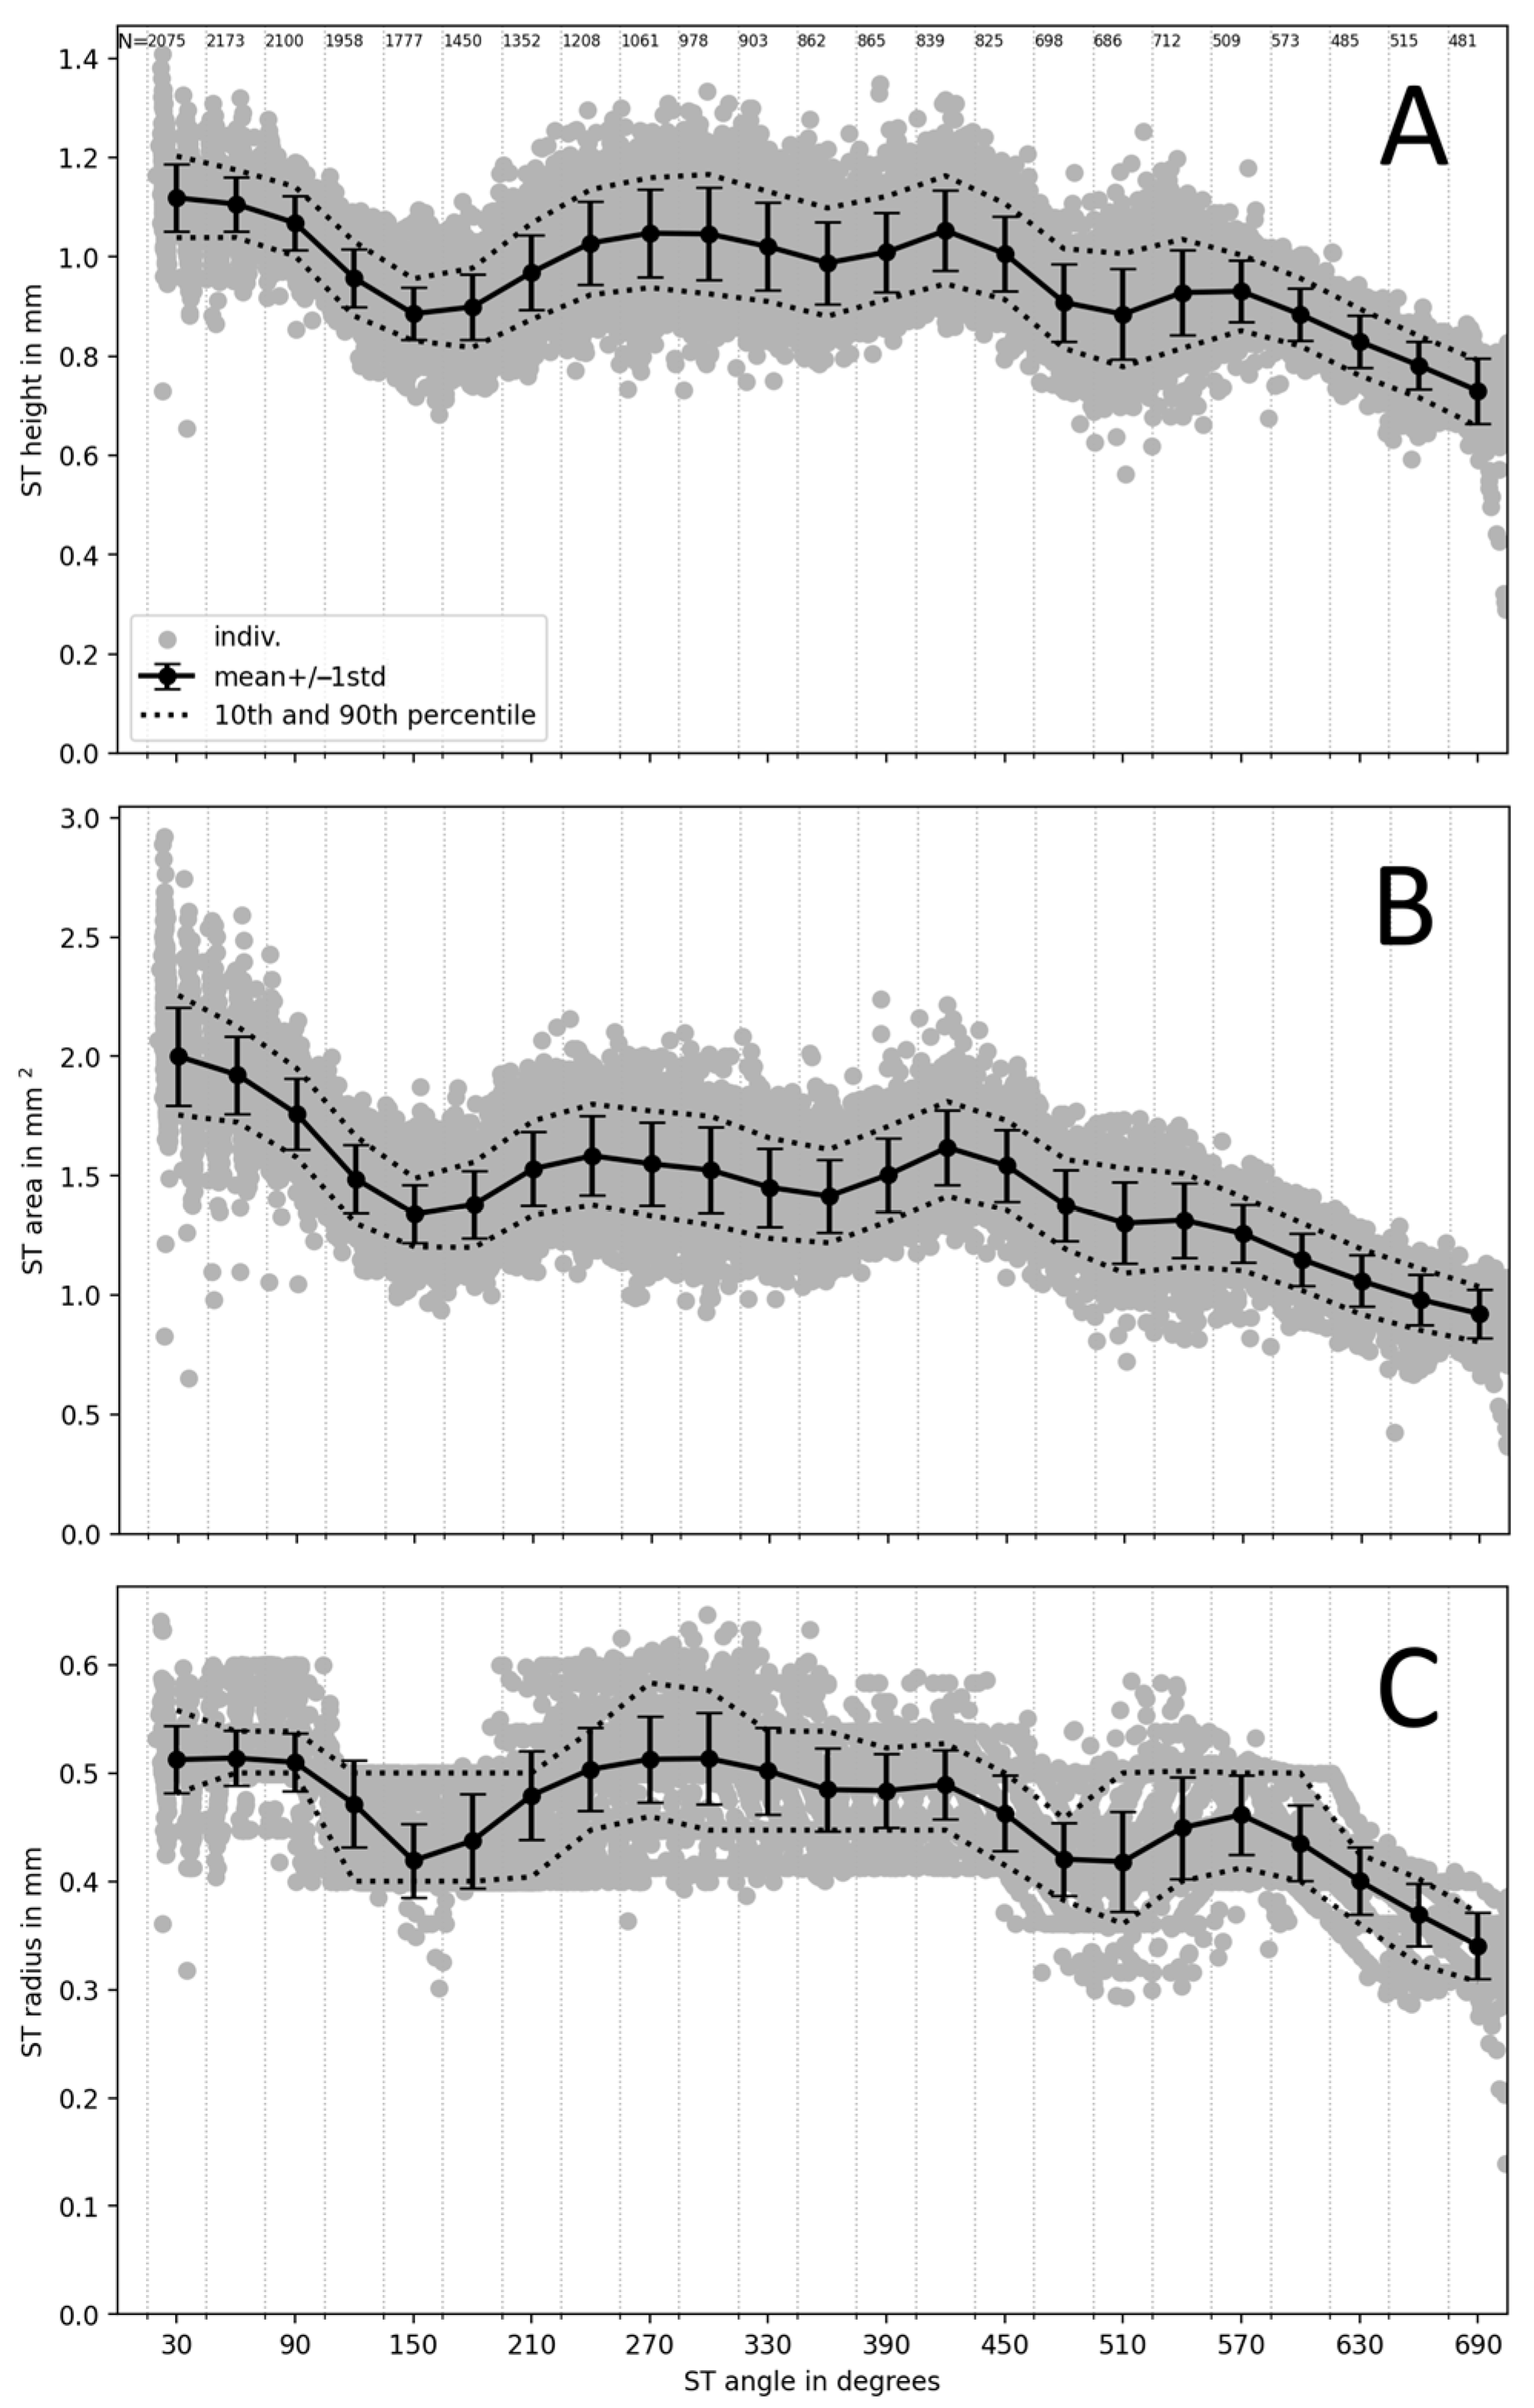
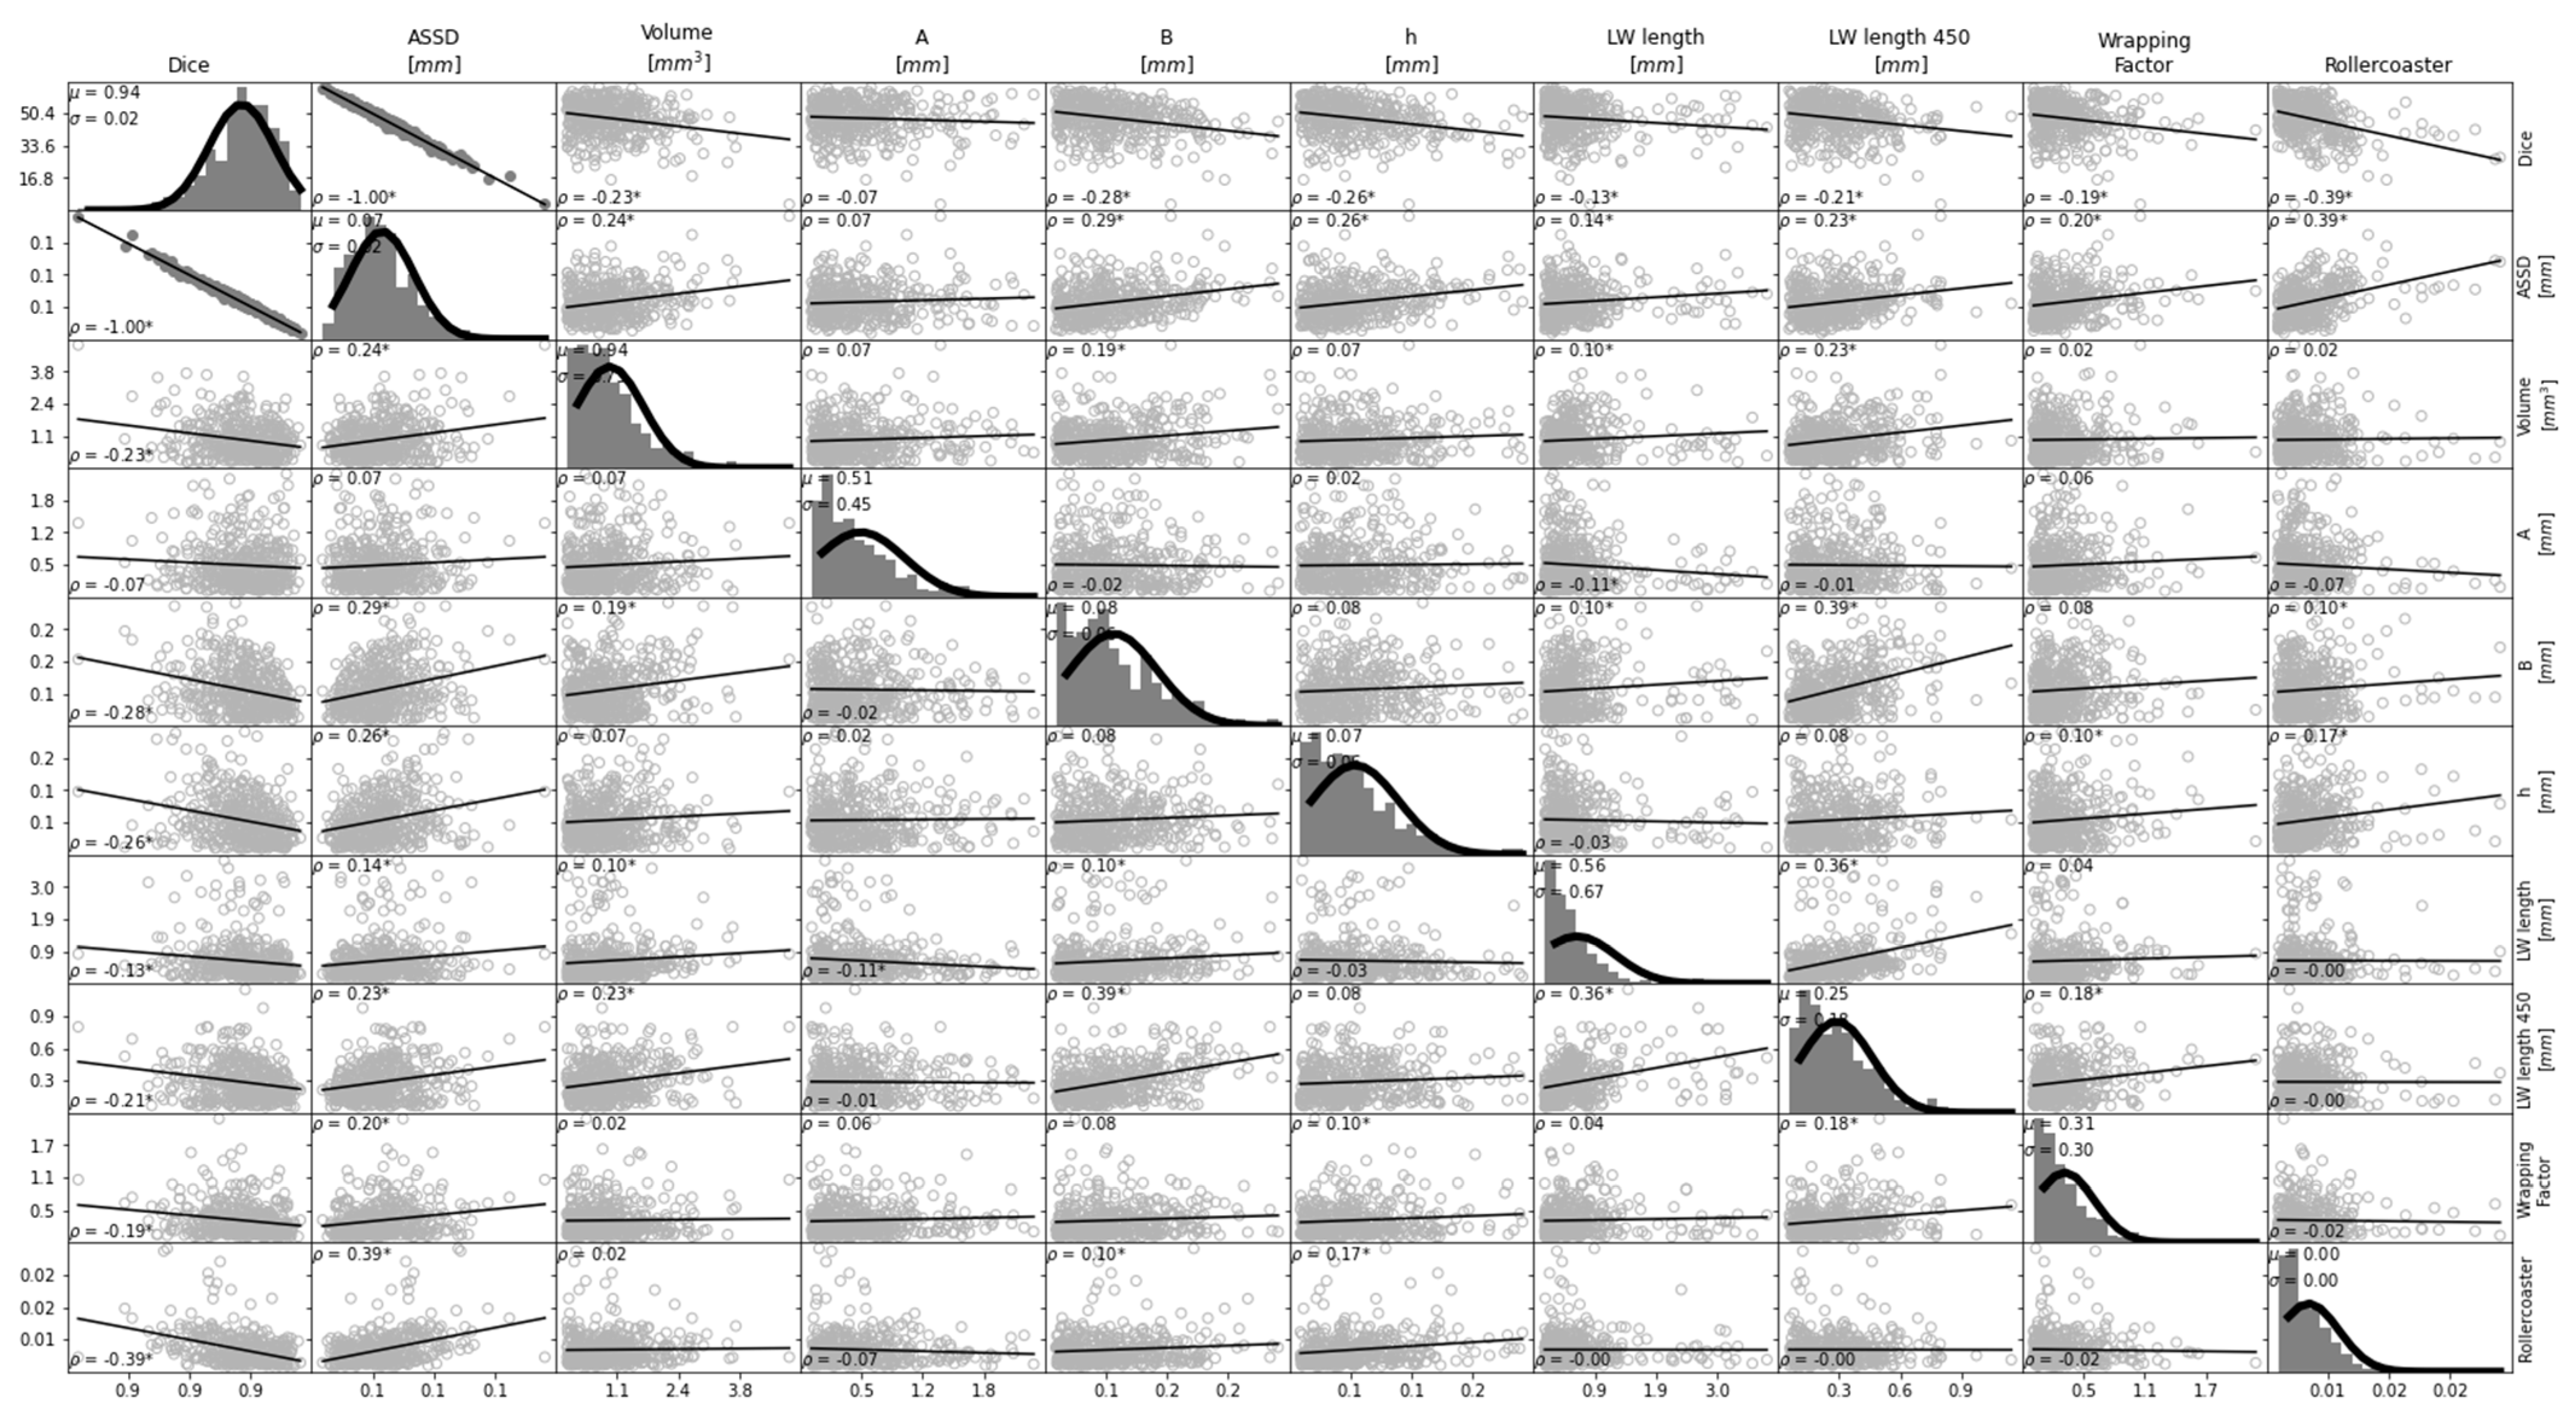
3.1. Population Statistics and Correlation Analysis
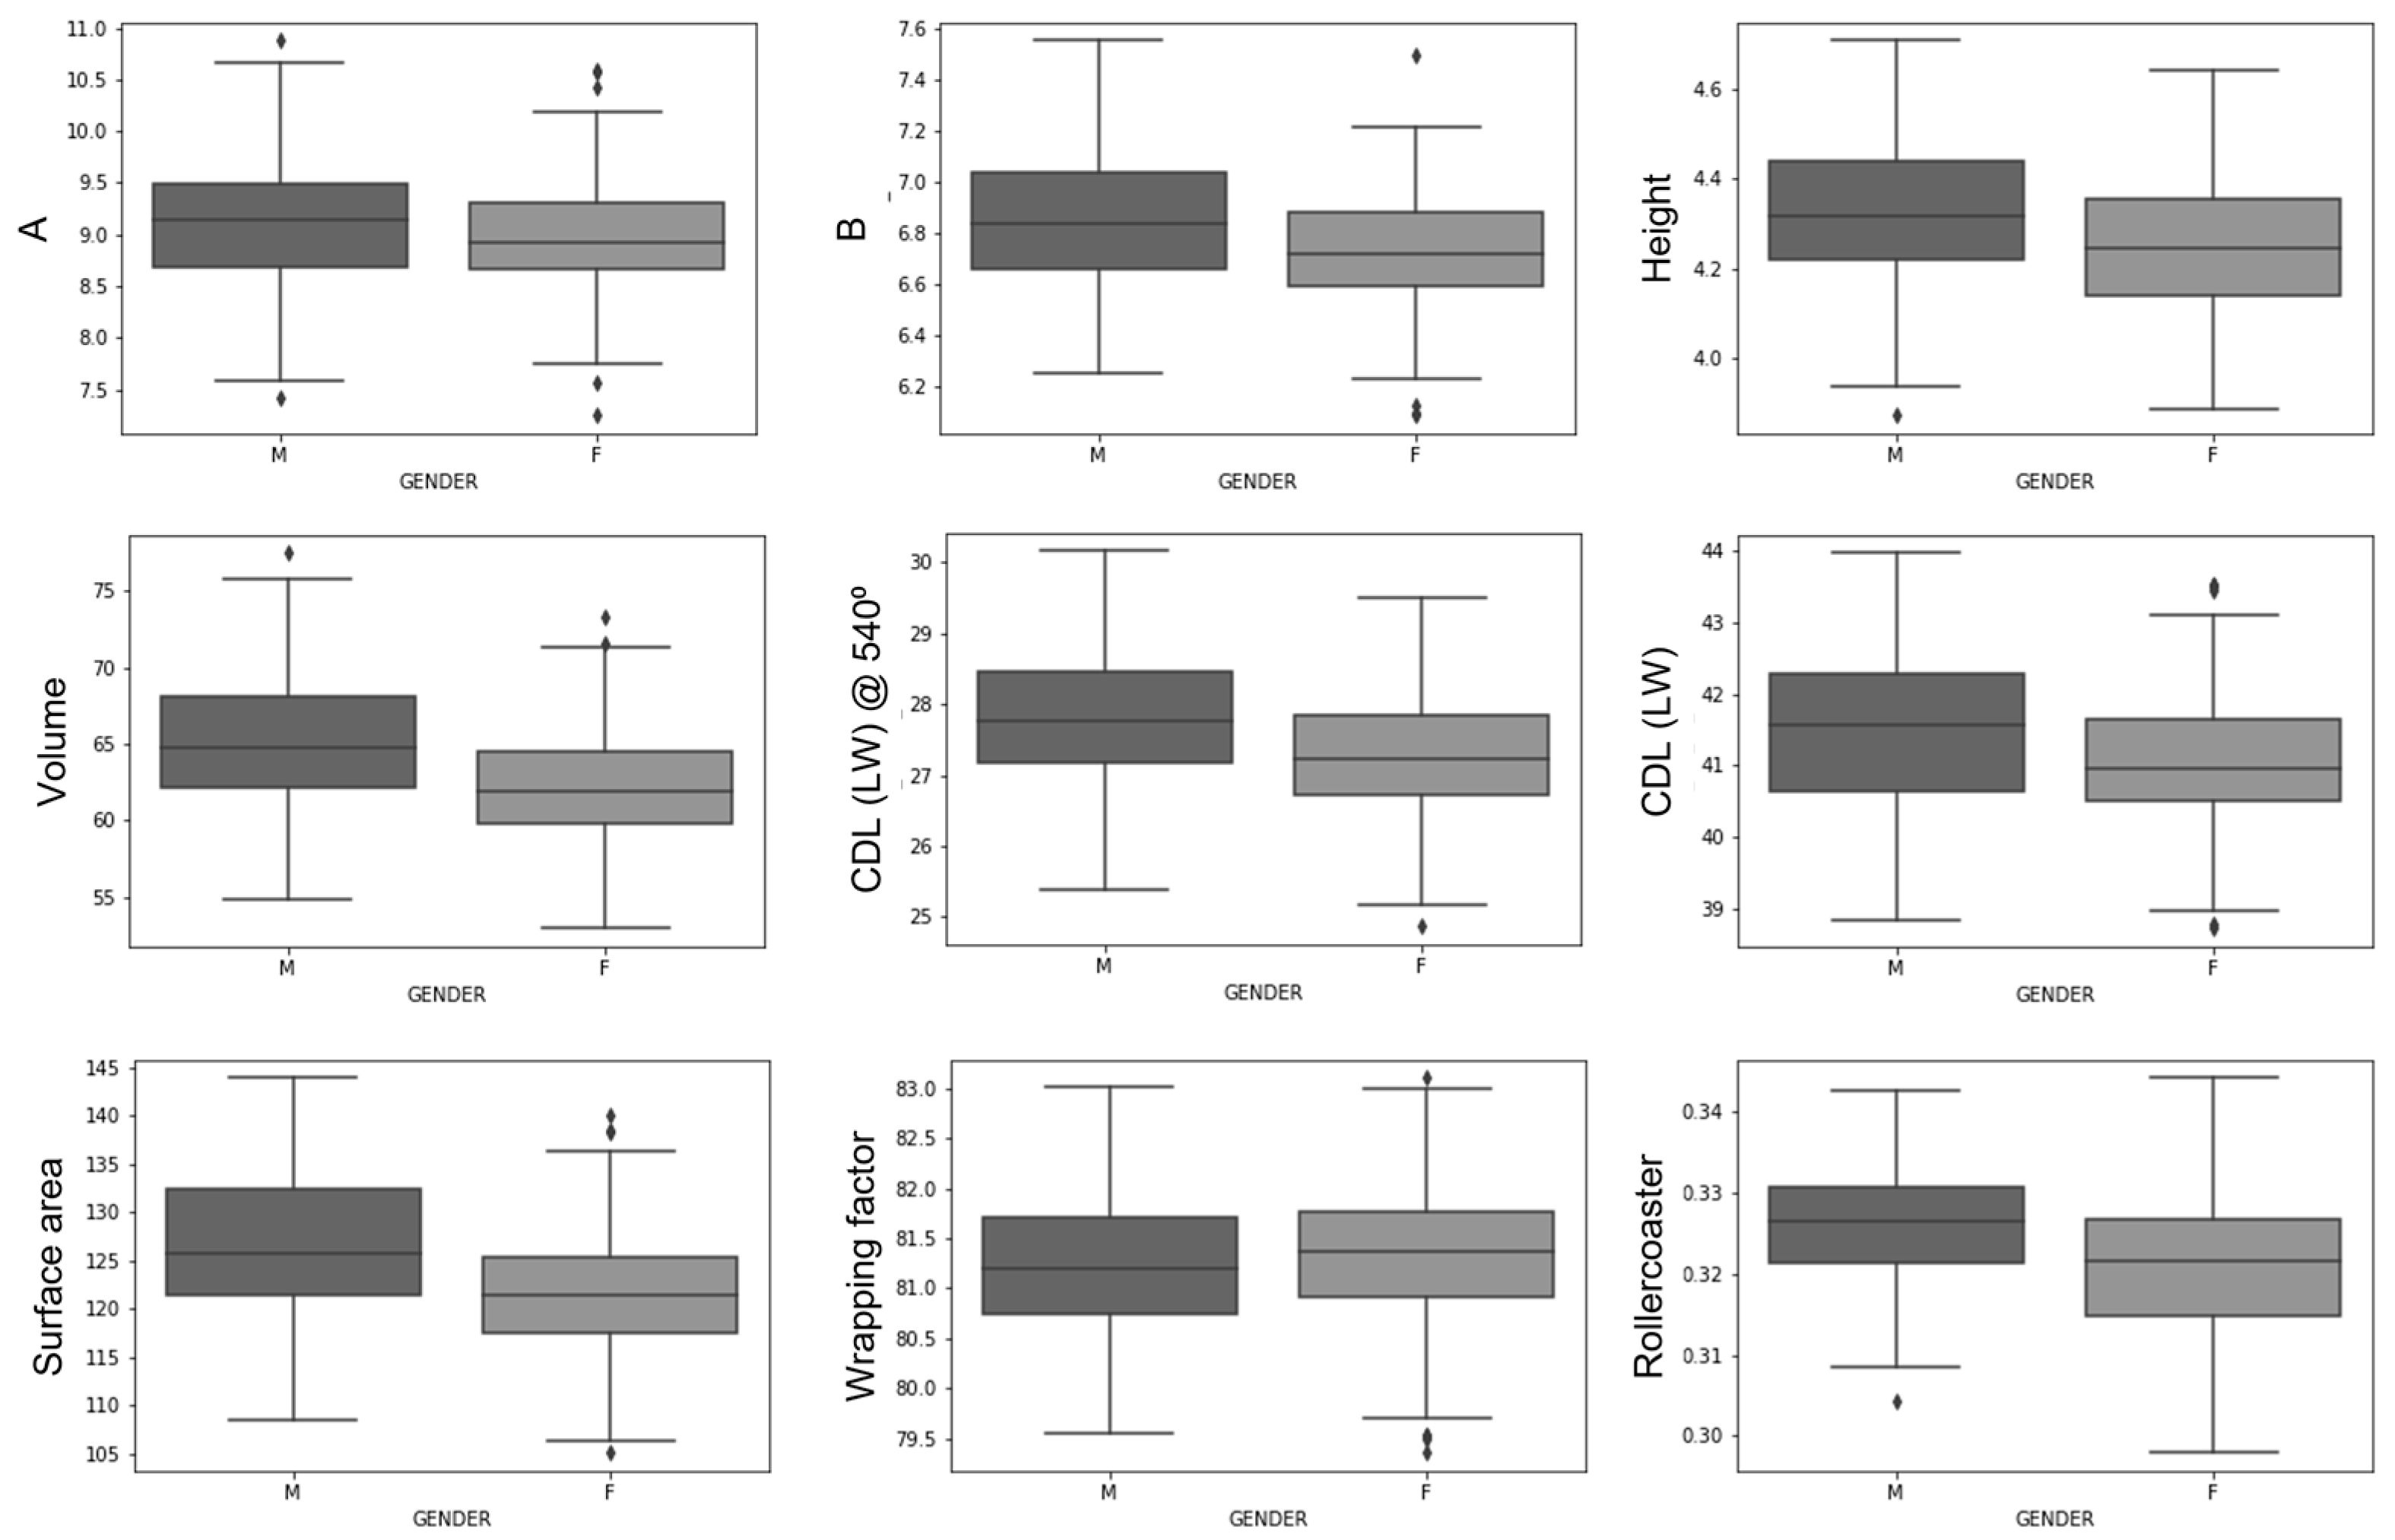
3.2. Inter-Sex Analysis
3.3. Intra- and Inter-Patient Analysis
4. Discussion
Author Contributions
Funding
Institutional Review Board Statement
Informed Consent Statement
Data Availability Statement
Acknowledgments
Conflicts of Interest
References
- Seyyedi, M.; Viana, L.M.; Nadol, J.B., Jr. Within-Subject Comparison of Word Recognition and Spiral Ganglion Cell Count in Bilateral Cochlear Implant Recipients. Otol. Neurotol. 2014, 35, 1446–1450. [Google Scholar] [CrossRef] [PubMed] [Green Version]
- Pfingst, B.E.; Zhou, N.; Colesa, D.J.; Watts, M.M.; Strahl, S.B.; Garadat, S.N.; Schvartz-Leyzac, K.C.; Budenz, C.L.; Raphael, Y.; Zwolan, T.A. Importance of Cochlear Health for Implant Function. Hear. Res. 2015, 322, 77–88. [Google Scholar] [CrossRef] [Green Version]
- Gstöttner, W.; Kiefer, J.; Baumgartner, W.D.; Pok, S.; Peters, S.; Adunka, O.F. Hearing Preservation in Cochlear Implantation for Electric Acoustic Stimulation. Acta Oto-Laryngol. 2004, 124, 348–352. [Google Scholar] [CrossRef] [PubMed]
- Sampaio, A.L.L.; Araújo, M.F.S.; Oliveira, C.A.C.P. New Criteria of Indication and Selection of Patients to Cochlear Implant. Int. J. Otolaryngol. 2011, 2011, 573968. [Google Scholar] [CrossRef] [Green Version]
- Adunka, O.F.; Dillon, M.T.; Adunka, M.C.; King, E.R.; Pillsbury, H.C.; Buchman, C.A. Hearing Preservation and Speech Perception Outcomes with Electric-Acoustic Stimulation after 12 Months of Listening Experience. Laryngoscope 2013, 123, 2509–2515. [Google Scholar] [CrossRef] [PubMed]
- Büchner, A.; Schüssler, M.; Battmer, R.D.; Stöver, T.; Lesinski-Schiedat, A.; Lenarz, T. Impact of Low-Frequency Hearing. Audiol. Neurotol. 2009, 14 (Suppl. 1), 8–13. [Google Scholar] [CrossRef] [PubMed]
- Gantz, B.J.; Turner, C.; Gfeller, K.E.; Lowder, M.W. Preservation of Hearing in Cochlear Implant Surgery: Advantages of Combined Electrical and Acoustical Speech Processing. Laryngoscope 2005, 115, 796–802. [Google Scholar] [CrossRef] [PubMed] [Green Version]
- Gifford, R.H.; Dorman, M.F.; Skarzynski, H.; Lorens, A.; Polak, M.; Driscoll, C.L.W.; Roland, P.; Buchman, C.A. Cochlear Implantation with Hearing Preservation Yields Significant Benefit for Speech Recognition in Complex Listening Environments. Ear Hear. 2013, 34, 413–425. [Google Scholar] [CrossRef] [Green Version]
- Irving, S.; Gillespie, L.; Richardson, R.; Rowe, D.; Fallon, J.B.; Wise, A.K. Electroacoustic Stimulation: Now and into the Future. BioMed Res. Int. 2014, 2014, 350504. [Google Scholar] [CrossRef] [Green Version]
- Freni, F.; Gazia, F.; Slavutsky, V.; Scherdel, E.P.; Nicenboim, L.; Posada, R.; Portelli, D.; Galletti, B.; Galletti, F. Cochlear Implant Surgery: Endomeatal Approach versus Posterior Tympanotomy. Int. J. Environ. Res. Public Health 2020, 17, 4187. [Google Scholar] [CrossRef]
- Helbig, S.; Settevendemie, C.; Mack, M.; Baumann, U.; Helbig, M.; Stöver, T. Evaluation of an Electrode Prototype for Atraumatic Cochlear Implantation in Hearing Preservation Candidates: Preliminary Results from a Temporal Bone Study. Otol. Neurotol. 2011, 32, 419–423. [Google Scholar] [CrossRef] [PubMed]
- Kha, H.; Chen, B. Finite Element Analysis of Damage by Cochlear Implant Electrode Array’s Proximal Section to the Basilar Membrane. Otol. Neurotol. 2012, 33, 1176–1180. [Google Scholar] [CrossRef] [PubMed]
- Wardrop, P.; Whinney, D.; Rebscher, S.J.; Luxford, W.; Leake, P. A Temporal Bone Study of Insertion Trauma and Intracochlear Position of Cochlear Implant Electrodes. II: Comparison of Spiral Clarion and HiFocus II Electrodes. Hear. Res. 2005, 203, 68–79. [Google Scholar] [CrossRef] [PubMed]
- Adunka, O.; Kiefer, J. Impact of Electrode Insertion Depth on Intracochlear Trauma. Otolaryngol. Head Neck Surg. 2006, 135, 374–382. [Google Scholar] [CrossRef] [PubMed]
- Roland, P.S.; Wright, C.G. Surgical Aspects of Cochlear Implantation: Mechanisms of Insertional Trauma. Adv. Otorhinolaryngol. 2006, 64, 11–30. [Google Scholar] [CrossRef]
- Cullen, R.D.; Higgins, C.; Buss, E.; Clark, M.; Pillsbury, H.C., 3rd; Buchman, C.A. Cochlear Implantation in Patients with Substantial Residual Hearing. Laryngoscope 2004, 114, 2218–2223. [Google Scholar] [CrossRef]
- Gantz, B.J.; Turner, C.W. Combining Acoustic and Electrical Hearing. Laryngoscope 2003, 113, 1726–1730. [Google Scholar] [CrossRef]
- Ishiyama, A.; Doherty, J.; Ishiyama, G.; Quesnel, A.M.; Lopez, I.; Linthicum, F.H. Post Hybrid Cochlear Implant Hearing Loss and Endolymphatic Hydrops. Otol. Neurotol. 2016, 37, 1516–1521. [Google Scholar] [CrossRef] [Green Version]
- Ishiyama, A.; Ishiyama, G.; Lopez, I.A.; Linthicum, F.H., Jr. Temporal Bone Histopathology of First-Generation Cochlear Implant Electrode Translocation. Otol. Neurotol. 2019, 40, e581–e591. [Google Scholar] [CrossRef]
- Lehnhardt, E. Intracochlear Placement of Cochlear Implant Electrodes in Soft Surgery Technique. HNO 1993, 41, 356–359. [Google Scholar]
- Friedland, D.R.; Runge-Samuelson, C. Soft Cochlear Implantation: Rationale for the Surgical Approach. Trends Amplif. 2009, 13, 124–138. [Google Scholar] [CrossRef]
- Briggs, R.J.S.; Tykocinski, M.; Xu, J.; Risi, F.; Svehla, M.; Cowan, R.; Stover, T.; Erfurt, P.; Lenarz, T. Comparison of Round Window and Cochleostomy Approaches with a Prototype Hearing Preservation Electrode. Audiol. Neurotol. 2006, 11 (Suppl. 1), 42–48. [Google Scholar] [CrossRef] [PubMed]
- Hochmair, I.; Hochmair, E.; Nopp, P.; Waller, M.; Jolly, C. Deep Electrode Insertion and Sound Coding in Cochlear Implants. Hear. Res. 2015, 322, 14–23. [Google Scholar] [CrossRef] [PubMed] [Green Version]
- Helbig, S.; Adel, Y.; Rader, T.; Stöver, T.; Baumann, U. Long-Term Hearing Preservation Outcomes after Cochlear Implantation for Electric-Acoustic Stimulation. Otol. Neurotol. 2016, 37, e353–e359. [Google Scholar] [CrossRef] [PubMed] [Green Version]
- Erixon, E.; Högstorp, H.; Wadin, K.; Rask-Andersen, H. Variational Anatomy of the Human Cochlea: Implications for Cochlear Implantation. Otol. Neurotol. 2009, 30, 14–22. [Google Scholar] [CrossRef]
- Rask-Andersen, H.; Liu, W.; Erixon, E.; Kinnefors, A.; Pfaller, K.; Schrott-Fischer, A.; Glueckert, R. Human Cochlea: Anatomical Characteristics and Their Relevance for Cochlear Implantation. Anat. Rec. 2012, 295, 1791–1811. [Google Scholar] [CrossRef]
- Avci, E.; Nauwelaers, T.; Lenarz, T.; Hamacher, V.; Kral, A. Variations in Microanatomy of the Human Cochlea: Variations in Microanatomy of the Human Cochlea. J. Comp. Neurol. 2014, 522, 3245–3261. [Google Scholar] [CrossRef] [PubMed] [Green Version]
- Escudé, B.; James, C.; Deguine, O.; Cochard, N.; Eter, E.; Fraysse, B. The Size of the Cochlea and Predictions of Insertion Depth Angles for Cochlear Implant Electrodes. Audiol. Neurootol. 2006, 11 (Suppl. 1), 27–33. [Google Scholar] [CrossRef]
- Rebscher, S.J.; Hetherington, A.; Bonham, B.; Wardrop, P.; Whinney, D.; Leake, P.A. Considerations for Design of Future Cochlear Implant Electrode Arrays: Electrode Array Stiffness, Size, and Depth of Insertion. J. Rehabil. Res. Dev. 2008, 45, 731–747. [Google Scholar] [CrossRef]
- Pietsch, M.; Aguirre Dávila, L.; Erfurt, P.; Avci, E.; Lenarz, T.; Kral, A. Spiral Form of the Human Cochlea Results from Spatial Constraints. Sci. Rep. 2017, 7, 7500. [Google Scholar] [CrossRef] [PubMed] [Green Version]
- Margeta, J.; Hussain, R.; López Diez, P.; Morgenstern, A.; Demarcy, T.; Wang, Z.; Gnansia, D.; Martinez Manzanera, O.; Vandersteen, C.; Delingette, H.; et al. A Web-Based Automated Image Processing Research Platform for Cochlear Implantation-Related Studies. J. Clin. Med. 2022, 11, 6640. [Google Scholar] [CrossRef] [PubMed]
- López Diez, P.; Sundgaard, J.V.; Patou, F.; Margeta, J.; Paulsen, R.R. Facial and Cochlear Nerves Characterization Using Deep Reinforcement Learning for Landmark Detection. In Medical Image Computing and Computer Assisted Intervention—MICCAI 2021; Springer International Publishing: Cham, Switzerland, 2021; pp. 519–528. [Google Scholar]
- Leroy, G.; Rueckert, D.; Alansary, A. Communicative Reinforcement Learning Agents for Landmark Detection in Brain Images. In Machine Learning in Clinical Neuroimaging and Radiogenomics in Neuro-Oncology; Springer International Publishing: Cham, Switzerland, 2020; pp. 177–186. [Google Scholar]
- Virtanen, P.; Gommers, R.; Oliphant, T.E.; Haberland, M.; Reddy, T.; Cournapeau, D.; Burovski, E.; Peterson, P.; Weckesser, W.; Bright, J.; et al. Author Correction: SciPy 1.0: Fundamental Algorithms for Scientific Computing in Python. Nat. Methods 2020, 17, 352. [Google Scholar] [CrossRef] [PubMed] [Green Version]
- Pedregosa, F.; Varoquaux, G.; Gramfort, A.; Michel, V.; Thirion, B.; Grisel, O.; Blondel, M.; Müller, A.; Nothman, J.; Louppe, G.; et al. Scikit-Learn: Machine Learning in Python. J. Mach. Learn. Res. 2011, 12, 2825–2830. Available online: https://jmlr.org/papers/v12/pedregosa11a.html (accessed on 5 July 2022).
- Yaniv, Z.; Lowekamp, B.C.; Johnson, H.J.; Beare, R. SimpleITK Image-Analysis Notebooks: A Collaborative Environment for Education and Reproducible Research. J. Digit. Imaging 2018, 31, 290–303. [Google Scholar] [CrossRef] [PubMed] [Green Version]
- Hussain, R.; Lalande, A.; Marroquin, R.; Guigou, C.; Bozorg Grayeli, A. Video-Based Augmented Reality Combining CT-Scan and Instrument Position Data to Microscope View in Middle Ear Surgery. Sci. Rep. 2020, 10, 6767. [Google Scholar] [CrossRef] [Green Version]
- Taha, A.A.; Hanbury, A. Metrics for Evaluating 3D Medical Image Segmentation: Analysis, Selection, and Tool. BMC Med. Imaging 2015, 15, 29. [Google Scholar] [CrossRef] [Green Version]
- Mei, X.; Atturo, F.; Wadin, K.; Larsson, S.; Agrawal, S.; Ladak, H.M.; Li, H.; Rask-Andersen, H. Human Inner Ear Blood Supply Revisited: The Uppsala Collection of Temporal Bone-an International Resource of Education and Collaboration. Upsala J. Med. Sci. 2018, 123, 131–142. [Google Scholar] [CrossRef]
- Schurzig, D.; Timm, M.E.; Batsoulis, C.; Salcher, R.; Sieber, D.; Jolly, C.; Lenarz, T.; Zoka-Assadi, M. A Novel Method for Clinical Cochlear Duct Length Estimation toward Patient-Specific Cochlear Implant Selection. OTO Open 2018, 2, 4. [Google Scholar] [CrossRef] [Green Version]
- Goupell, M.J.; Stoelb, C.A.; Kan, A.; Litovsky, R.Y. The Effect of Simulated Interaural Frequency Mismatch on Speech Understanding and Spatial Release from Masking. Ear Hear. 2018, 39, 895–905. [Google Scholar] [CrossRef]
- Thomas, J.; Klein, H.; Dazert, S.; Völter, C. Length Measurement of Cochlear Parameters Prior to Cochlear Implantation—Comparison of CT- vs. MRI-Based Results. In Abstract- und Posterband—93. Jahresversammlung der Deutschen Gesellschaft für HNO-Heilkunde, Kopf- und Hals-Chirurgie e.V., Bonn Interface—Fokus Mensch im Zeitalter der Technisierten Medizin; Georg Thieme: Leipzig, Germany, 2022. [Google Scholar]
- Pirruccello, J.P.; Di Achille, P.; Nauffal, V.; Nekoui, M.; Friedman, S.F.; Klarqvist, M.D.R.; Chaffin, M.D.; Weng, L.-C.; Cunningham, J.W.; Khurshid, S.; et al. Genetic Analysis of Right Heart Structure and Function in 40,000 People. Nat. Genet. 2022, 54, 792–803. [Google Scholar] [CrossRef]
- Alexiades, G.; Dhanasingh, A.; Jolly, C. Method to Estimate the Complete and Two-Turn Cochlear Duct Length. Otol. Neurotol. 2015, 36, 904–907. [Google Scholar] [CrossRef] [PubMed]
- Reda, F.A.; McRackan, T.R.; Labadie, R.F.; Dawant, B.M.; Noble, J.H. Automatic Segmentation of Intra-Cochlear Anatomy in Post-Implantation CT of Unilateral Cochlear Implant Recipients. Med. Image Anal. 2014, 18, 605–615. [Google Scholar] [CrossRef] [PubMed]


| Left vs. Right (n = 458) | Absolute Mean | Standard Deviation | Mean | Maximum | Minimum |
|---|---|---|---|---|---|
| Dice (ST) | 91.51 | 0.02 | - | 96.34 | 81.91 |
| ASSD (ST) | 0.05 | 0.01 | - | 0.11 | 0.03 |
| HD (ST) | 0.34 | 0.11 | - | 1.17 | 0.14 |
| Dice (CO) | 94.15 | 0.01 | - | 97.17 | 85.74 |
| ASSD (CO) | 0.07 | 0.01 | - | 0.15 | 0.04 |
| HD (CO) | 0.39 | 0.12 | - | 1.20 | 0.16 |
| A (ST) | 0.50 | 0.44 | −0.03 | 2.38 | −2.32 |
| A (CO) | 0.51 | 0.44 | −0.01 | 2.21 | −2.31 |
| B (CO) | 0.08 | 0.05 | 0.05 | 0.30 | −0.29 |
| Height | 0.07 | 0.05 | 0.01 | 0.29 | −0.27 |
| Volume | 0.95 | 0.76 | −0.06 | 5.38 | −4.85 |
| Surface area | 1.66 | 1.21 | 0.63 | 8.39 | −5.26 |
| Wrapping factor | 0.31 | 0.29 | −0.08 | 1.58 | −2.22 |
| Wrapping ratio | 0.44 | 0.57 | −0.01 | 3.09 | −3.31 |
| Roller coaster | 0.004 | 0.004 | −0.001 | 0.01 | −0.03 |
| CDL_LW@90° | 0.08 | 0.07 | −0.02 | 0.36 | −0.58 |
| CDL_LW@180° | 0.10 | 0.10 | 0.01 | 0.63 | −0.64 |
| CDL_LW@270° | 0.17 | 0.13 | 0.06 | 0.80 | −0.73 |
| CDL_LW@360° | 0.22 | 0.17 | 0.09 | 0.97 | −0.96 |
| CDL_LW@450° | 0.25 | 0.18 | 0.11 | 1.14 | −1.15 |
| CDL_LW@540° | 0.25 | 0.20 | 0.08 | 1.42 | −1.19 |
| CDL_LW | 0.56 | 0.66 | 0.09 | 3.86 | −3.6 |
| CDL@540° approx. [28] | 1.61 | 1.40 | −0.05 | 6.92 | −7.23 |
| CDL approx. [40] | 0.71 | 0.61 | 0.068 | 3.08 | −3.02 |
| Insertion angle@17 mm | 3.33 | 2.70 | −1.15 | 15.32 | −14.88 |
| Insertion angle@19 mm | 4.57 | 3.56 | −1.81 | 20.79 | −18.81 |
| Insertion angle@21 mm | 5.37 | 4.10 | −2.26 | 24.50 | −20.83 |
| Insertion angle@23 mm | 6.35 | 4.75 | −2.77 | 28.17 | −26.46 |
| Insertion angle@25 mm | 7.53 | 5.58 | −3.11 | 34.74 | −29.05 |
| Insertion angle@27 mm | 8.17 | 6.27 | −2.85 | 35.87 | −35.41 |
Disclaimer/Publisher’s Note: The statements, opinions and data contained in all publications are solely those of the individual author(s) and contributor(s) and not of MDPI and/or the editor(s). MDPI and/or the editor(s) disclaim responsibility for any injury to people or property resulting from any ideas, methods, instructions or products referred to in the content. |
© 2023 by the authors. Licensee MDPI, Basel, Switzerland. This article is an open access article distributed under the terms and conditions of the Creative Commons Attribution (CC BY) license (https://creativecommons.org/licenses/by/4.0/).
Share and Cite
Hussain, R.; Frater, A.; Calixto, R.; Karoui, C.; Margeta, J.; Wang, Z.; Hoen, M.; Delingette, H.; Patou, F.; Raffaelli, C.; et al. Anatomical Variations of the Human Cochlea Using an Image Analysis Tool. J. Clin. Med. 2023, 12, 509. https://0-doi-org.brum.beds.ac.uk/10.3390/jcm12020509
Hussain R, Frater A, Calixto R, Karoui C, Margeta J, Wang Z, Hoen M, Delingette H, Patou F, Raffaelli C, et al. Anatomical Variations of the Human Cochlea Using an Image Analysis Tool. Journal of Clinical Medicine. 2023; 12(2):509. https://0-doi-org.brum.beds.ac.uk/10.3390/jcm12020509
Chicago/Turabian StyleHussain, Raabid, Attila Frater, Roger Calixto, Chadlia Karoui, Jan Margeta, Zihao Wang, Michel Hoen, Herve Delingette, François Patou, Charles Raffaelli, and et al. 2023. "Anatomical Variations of the Human Cochlea Using an Image Analysis Tool" Journal of Clinical Medicine 12, no. 2: 509. https://0-doi-org.brum.beds.ac.uk/10.3390/jcm12020509