Metabolic Dysregulation and Psychosocial Stress in Patients with Schizophrenia Spectrum Disorders: A Case-Control Study

 , ,
, ,
Abstract
:1. Introduction
2. Materials and Methods
2.1. Recruitment Procedures
2.2. The Measures of Stress
2.3. Biochemical Parameters
2.4. Data Analysis
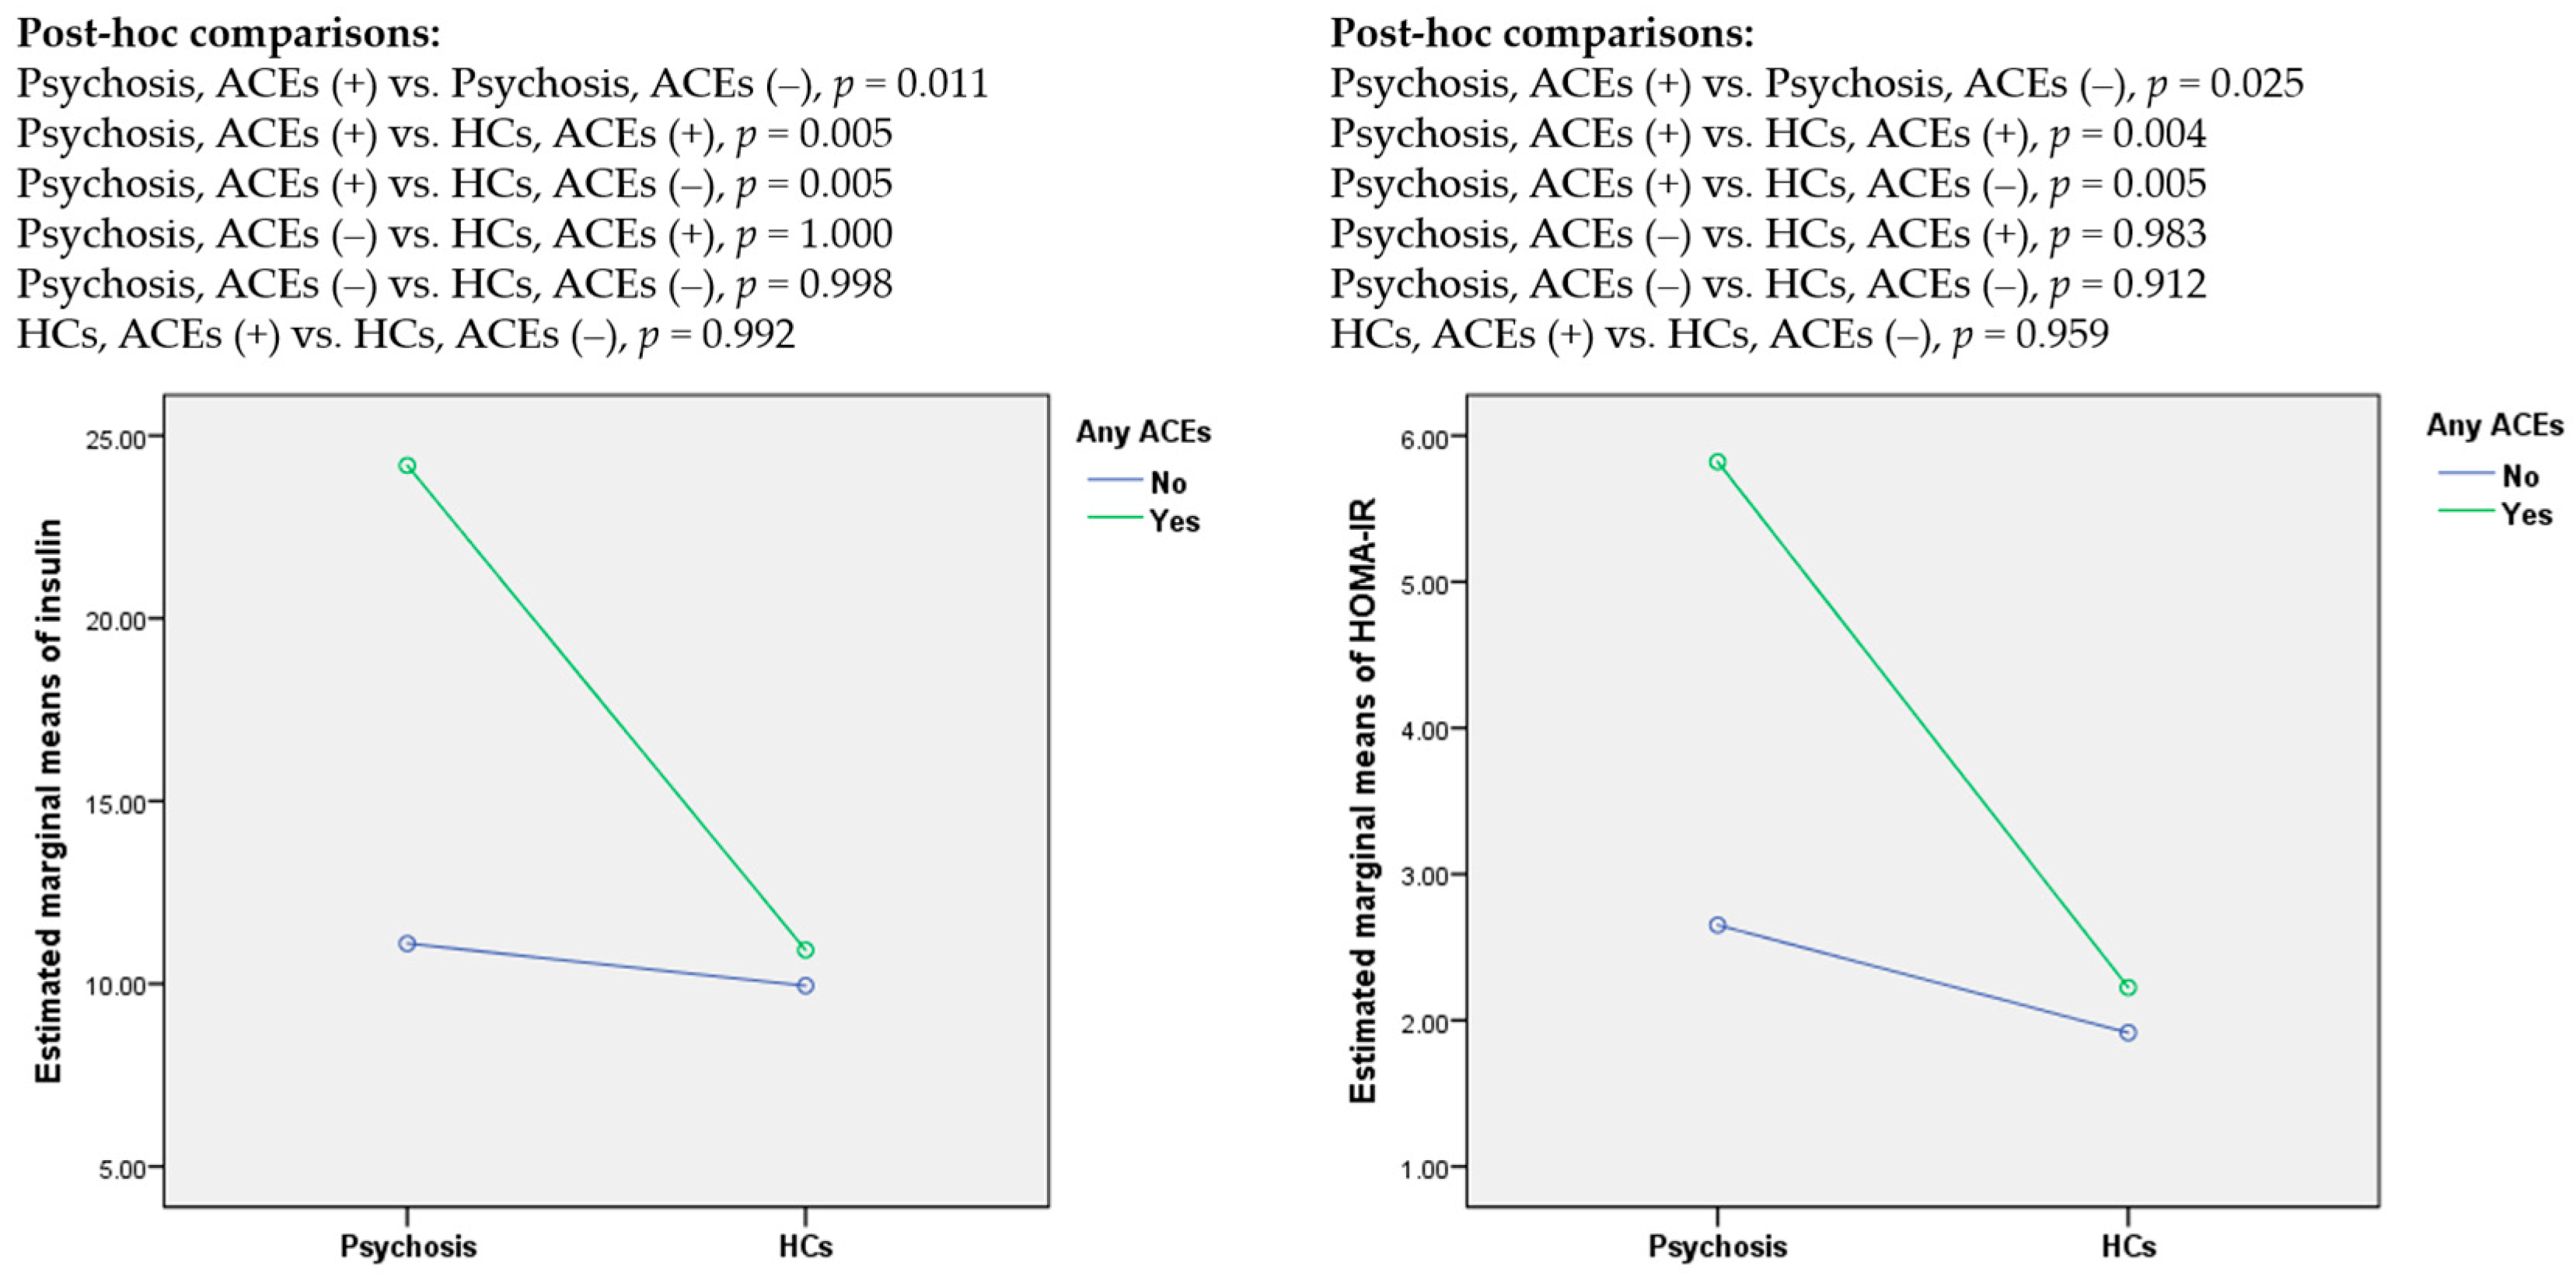
3. Results
4. Discussion
Author Contributions
Funding
Acknowledgments
Conflicts of Interest
References
- Mitchell, A.J.; Vancampfort, D.; De Herdt, A.; Yu, W.; De Hert, M. Is the prevalence of metabolic syndrome and metabolic abnormalities increased in early schizophrenia? a comparative meta-analysis of first episode, untreated and treated patients. Schizophr. Bull. 2013, 39, 295–305. [Google Scholar] [CrossRef] [PubMed] [Green Version]
- Vancampfort, D.; Firth, J.; Correll, C.U.; Solmi, M.; Siskind, D.; De Hert, M.; Carney, R.; Koyanagi, A.; Carvalho, A.F.; Gaughran, F.; et al. The impact of pharmacological and non-pharmacological interventions to improve physical health outcomes in people with schizophrenia: A meta-review of meta-analyses of randomized controlled trials. World Psychiatry 2019, 18, 53–66. [Google Scholar] [CrossRef] [PubMed]
- Hjorthøj, C.; Stürup, A.E.; McGrath, J.J.; Nordentoft, M. Years of potential life lost and life expectancy in schizophrenia: A systematic review and meta-analysis. Lancet Psychiatry 2017, 4, 295–301. [Google Scholar] [CrossRef]
- Misiak, B.; Bartoli, F.; Stramecki, F.; Samochowiec, J.; Lis, M.; Kasznia, J.; Jarosz, K.; Stańczykiewicz, B. Appetite regulating hormones in first-episode psychosis: A systematic review and meta-analysis. Neurosci. Biobehav. Rev. 2019, 102, 362–370. [Google Scholar] [CrossRef]
- Misiak, B.; Stańczykiewicz, B.; Łaczmański, Ł.; Frydecka, D. Lipid profile disturbances in antipsychotic-naive patients with first-episode non-affective psychosis: A systematic review and meta-analysis. Schizophr. Res. 2017, 190, 18–27. [Google Scholar] [CrossRef]
- Perry, B.I.; McIntosh, G.; Weich, S.; Singh, S.; Rees, K. The association between first-episode psychosis and abnormal glycaemic control: Systematic review and meta-analysis. Lancet Psychiatry 2016, 3, 1049–1058. [Google Scholar] [CrossRef] [Green Version]
- Misiak, B.; Łaczmański, Ł.; Słoka, N.K.; Szmida, E.; Piotrowski, P.; Loska, O.; Ślezak, R.; Kiejna, A.; Frydecka, D. Metabolic dysregulation in first-episode schizophrenia patients with respect to genetic variation in one-carbon metabolism. Psychiatry Res. 2016, 238, 60–67. [Google Scholar] [CrossRef]
- Upthegrove, R.; Manzanares-Teson, N.; Barnes, N.M. Cytokine function in medication-naive first episode psychosis: A systematic review and meta-analysis. Schizophr. Res. 2014, 155, 101–108. [Google Scholar] [CrossRef]
- Cordes, J.; Bechdolf, A.; Engelke, C.; Kahl, K.G.; Balijepalli, C.; Lösch, C.; Klosterkötter, J.; Wagner, M.; Maier, W.; Heinz, A.; et al. Prevalence of metabolic syndrome in female and male patients at risk of psychosis. Schizophr. Res. 2017, 181, 38–42. [Google Scholar] [CrossRef]
- Misiak, B.; Wiśniewski, M.; Lis, M.; Samochowiec, J.; Stańczykiewicz, B. Glucose homeostasis in unaffected first-degree relatives of schizophrenia patients: A systematic review and meta-analysis. Schizophr. Res. 2020. [Google Scholar] [CrossRef]
- Andreassen, O.A.; Djurovic, S.; Thompson, W.K.; Schork, A.J.; Kendler, K.S.; O’Donovan, M.C.; Rujescu, D.; Werge, T.; Van De Bunt, M.; Morris, A.P.; et al. Improved detection of common variants associated with schizophrenia by leveraging pleiotropy with cardiovascular-disease risk factors. Am. J. Hum. Genet. 2013, 92, 197–209. [Google Scholar] [CrossRef] [PubMed] [Green Version]
- Maj, C.; Tosato, S.; Zanardini, R.; Lasalvia, A.; Favaro, A.; Leuci, E.; De Girolamo, G.; Ruggeri, M.; Gennarelli, M.; Bocchio-Chiavetto, L. Correlations between immune and metabolic serum markers and schizophrenia/bipolar disorder polygenic risk score in first-episode psychosis. Early Interv. Psychiatry 2019, 14, 507–511. [Google Scholar] [CrossRef] [PubMed]
- Misiak, B. Stress, Allostatic Load, and Psychosis: One Step Forward in Research But Where to Go Next? Front. Psychiatry 2020, 10, 937. [Google Scholar] [CrossRef] [PubMed] [Green Version]
- Varese, F.; Smeets, F.; Drukker, M.; Lieverse, R.; Lataster, T.; Viechtbauer, W.; Read, J.; Van Os, J.; Bentall, R.P. Childhood adversities increase the risk of psychosis: A meta-analysis of patient-control, prospective-and cross-sectional cohort studies. Schizophr. Bull. 2012, 38, 661–671. [Google Scholar] [CrossRef] [PubMed]
- Beards, S.; Gayer-Anderson, C.; Borges, S.; Dewey, M.E.; Fisher, H.L.; Morgan, C. Life events and psychosis: A review and meta-analysis. Schizophr. Bull. 2013, 39, 740–747. [Google Scholar] [CrossRef] [PubMed] [Green Version]
- Rosmond, R. Stress induced disturbances of the HPA axis: A pathway to type 2 diabetes? Med. Sci. Monit. 2003, 9, RA35–RA39. [Google Scholar]
- Aas, M.; Dieset, I.; Hope, S.; Hoseth, E.; Mørch, R.; Reponen, E.; Steen, N.E.; Laskemoen, J.F.; Ueland, T.; Aukrust, P.; et al. Childhood maltreatment severity is associated with elevated C-reactive protein and body mass index in adults with schizophrenia and bipolar diagnoses. Brain Behav. Immun. 2017, 65, 342–349. [Google Scholar] [CrossRef] [Green Version]
- Hepgul, N.; Pariante, C.M.; Dipasquale, S.; Diforti, M.; Taylor, H.; Marques, T.R.; Morgan, C.; Dazzan, P.; Murray, R.M.; Mondelli, V. Childhood maltreatment is associated with increased body mass index and increased C-reactive protein levels in first-episode psychosis patients. Psychol. Med. 2012, 42, 1893–1901. [Google Scholar] [CrossRef] [Green Version]
- Tosato, S.; Bonetto, C.; Tomassi, S.; Zanardini, R.; Faravelli, C.; Bruschi, C.; D’Agostino, A.; Minelli, A.; Scocco, P.; Lasalvia, A.; et al. Childhood trauma and glucose metabolism in patients with first-episode psychosis. Psychoneuroendocrinology 2020, 113, 104536. [Google Scholar] [CrossRef]
- Veru-Lesmes, F.; Rho, A.; King, S.; Joober, R.; Pruessner, M.; Malla, A.; Iyer, S.N. Social Determinants of Health and Preclinical Glycemic Control in Newly Diagnosed First-Episode Psychosis Patients. Can. J. Psychiatry 2018, 63, 547–556. [Google Scholar] [CrossRef]
- Misiak, B.; Kotowicz, K.; Loska, O.; Stramecki, F.; Beszłej, J.A.; Samochowiec, J.; Jabłoński, M.; Podwalski, P.; Waszczuk, K.; Wroński, M.; et al. Decreased use of active coping styles contributes to elevated allostatic load index in first-episode psychosis. Psychoneuroendocrinology 2018, 96, 166–172. [Google Scholar] [CrossRef] [PubMed]
- Piotrowski, P.; Frydecka, D.; Kotowicz, K.; Stańczykiewicz, B.; Samochowiec, J.; Szczygieł, K.; Misiak, B. A history of childhood trauma and allostatic load in patients with psychotic disorders with respect to stress coping strategies. Psychoneuroendocrinology 2020, 115, 104645. [Google Scholar] [CrossRef] [PubMed]
- Piotrowski, P.; Kotowicz, K.; Rymaszewska, J.; Beszłej, J.A.; Plichta, P.; Samochowiec, J.; Kalinowska, S.; Trześniowska-Drukała, B.; Misiak, B. Allostatic load index and its clinical correlates at various stages of psychosis. Schizophr. Res. 2019, 210, 73–80. [Google Scholar] [CrossRef] [PubMed]
- McGuffin, P. A Polydiagnostic Application of Operational Criteria in Studies of Psychotic Illness. Arch. Gen. Psychiatry 1991, 48, 764. [Google Scholar] [CrossRef]
- Woods, S.W. Chlorpromazine equivalent doses for the newer atypical antipsychotics. J. Clin. Psychiatry 2003, 64, 663–667. [Google Scholar] [CrossRef]
- Kay, S.R.; Fiszbein, A.; Opler, L.A. The positive and negative syndrome scale (PANSS) for schizophrenia. Schizophr. Bull. 1987, 13, 261–276. [Google Scholar] [CrossRef]
- Montgomery, S.A.; Asberg, M. A new depression scale designed to be sensitive to change. Br. J. Psychiatry 1979, 134, 382–389. [Google Scholar] [CrossRef]
- Young, R.C.; Biggs, J.T.; Ziegler, V.E.; Meyer, D.A. A rating scale for mania: Reliability, validity and sensitivity A Rating Scale for Mania: Reliability, Validity and Sensitivity. Br. J. Psychiatry J. Ment. Sci. 2011, 133, 429–435. [Google Scholar] [CrossRef]
- Hall, R.C.W. Global Assessment of Functioning. Psychosomatics 1995, 36, 267–275. [Google Scholar] [CrossRef]
- Bifulco, A.; Bernazzani, O.; Moran, P.M.; Jacobs, C. The childhood experience of care and abuse questionnaire (CECA.Q): Validation in a community series. Br. J. Clin. Psychol. 2005, 44, 563–581. [Google Scholar] [CrossRef]
- Fisher, H.L.; Craig, T.K.; Fearon, P.; Morgan, K.; Dazzan, P.; Lappin, J.; Hutchinson, G.; Doody, G.A.; Jones, P.B.; McGuffin, P.; et al. Reliability and comparability of psychosis patients’ retrospective reports of childhood abuse. Schizophr. Bull. 2011, 37, 546–553. [Google Scholar] [CrossRef] [PubMed] [Green Version]
- Brugha, T.S.; Cragg, D. The List of Threatening Experiences: The reliability and validity of a brief life events questionnaire. Acta Psychiatr. Scand. 1990, 82, 77–81. [Google Scholar] [CrossRef] [PubMed]
- Cohen, S.; Kamarck, T.; Mermelstein, R. A global measure of perceived stress. J. Health Soc. Behav. 1983, 24, 385–396. [Google Scholar] [CrossRef] [PubMed]
- Mitchell, A.J.; Vancampfort, D.; Sweers, K.; Van Winkel, R.; Yu, W.; De Hert, M. Prevalence of metabolic syndrome and metabolic abnormalities in schizophrenia and related disorders-a systematic review and meta-analysis. Schizophr. Bull. 2013, 39, 306–318. [Google Scholar] [CrossRef] [Green Version]
- De Hert, M.; Schreurs, V.; Vancampfort, D.; Van Winkel, R. Metabolic syndrome in people with schizophrenia: A review. World Psychiatry 2009, 8, 15–22. [Google Scholar] [CrossRef]
- Nordholm, D.; Krogh, J.; Mondelli, V.; Dazzan, P.; Pariante, C.; Nordentoft, M. Pituitary gland volume in patients with schizophrenia, subjects at ultra high-risk of developing psychosis and healthy controls: A systematic review and meta-analysis. Psychoneuroendocrinology 2013, 38, 2394–2404. [Google Scholar] [CrossRef]
- Girshkin, L.; Matheson, S.L.; Shepherd, A.M.; Green, M.J. Morning cortisol levels in schizophrenia and bipolar disorder: A meta-analysis. Psychoneuroendocrinology 2014, 49, 187–206. [Google Scholar] [CrossRef]
- Berger, M.; Kraeuter, A.K.; Romanik, D.; Malouf, P.; Amminger, G.P.; Sarnyai, Z. Cortisol awakening response in patients with psychosis: Systematic review and meta-analysis. Neurosci. Biobehav. Rev. 2016, 68, 157–166. [Google Scholar] [CrossRef]
- Ciufolini, S.; Dazzan, P.; Kempton, M.J.; Pariante, C.; Mondelli, V. HPA axis response to social stress is attenuated in schizophrenia but normal in depression: evidence from a meta-analysis of existing studies. Neurosci. Biobehav. Rev. 2014, 47, 359–368. [Google Scholar] [CrossRef]
- Cullen, A.E.; Rai, S.; Vaghani, M.S.; Mondelli, V.; McGuire, P. Cortisol responses to naturally occurring psychosocial stressors across the psychosis spectrum: A systematic review and meta-analysis. Front. Psychiatry 2020, 11, 513. [Google Scholar] [CrossRef]
- Guest, P.C.; Martins-de-Souza, D.; Vanattou-Saifoudine, N.; Harris, L.W.; Bahn, S. Abnormalities in Metabolism and Hypothalamic-Pituitary-Adrenal Axis Function in Schizophrenia. Int. Rev. Neurobiol. 2011, 101, 145–168. [Google Scholar] [PubMed]
- Spencer, S.J.; Tilbrook, A. The glucocorticoid contribution to obesity. Stress 2011, 14, 233–246. [Google Scholar] [CrossRef] [PubMed]
- Sinha, R.; Jastreboff, A.M. Stress as a common risk factor for obesity and addiction. Biol. Psychiatry 2013, 73, 827–835. [Google Scholar] [CrossRef] [PubMed]
- Rucci, P.; Gibertoni, D.; Rossi, A.; Mucci, A.; Rocca, P.; Bucci, P.; Galderisi, S.; Maj, M. Resilience in people with schizophrenia. Results from the Italian Network for Research on Psychoses. Eur. J. Public Health 2017, 27, ckx189.201. [Google Scholar] [CrossRef]
- Piotrowski, P.; Rymaszewska, J.; Stańczykiewicz, B.; Małecka, M.; Kotowicz, K.; Samochowiec, J.; Samochowiec, A.; Plichta, P.; Kalinowska, S.; Misiak, B. Stress coping strategies and their clinical correlates in patientswith psychosis at various stages of illness: A case-control study. Early Interv. Psychiatry 2019, 14, 559–567. [Google Scholar] [CrossRef]
- Stramecki, F.; Kotowicz, K.; Piotrowski, P.; Beszłej, J.A.; Rymaszewska, J.; Samochowiec, J.; Samochowiec, A.; Moustafa, A.A.; Jabłoński, M.; Podwalski, P.; et al. Coping styles and symptomatic manifestation of first-episode psychosis: Focus on cognitive performance. Psychiatry Res. 2019, 272, 246–251. [Google Scholar] [CrossRef]
- Lee, E.E.; Martin, A.S.; Tu, X.; Palmer, B.W.; Jeste, D.V. Childhood adversity and schizophrenia: The protective role of resilience in mental and physical health and metabolic markers. J. Clin. Psychiatry 2018, 79, 17m11776. [Google Scholar] [CrossRef]
- Li, Z.; Chen, J.; Yu, H.; He, L.; Xu, Y.; Zhang, D.; Yi, Q.; Li, C.; Li, X.; Shen, J.; et al. Genome-wide association analysis identifies 30 new susceptibility loci for schizophrenia. Nat. Genet. 2017, 49, 1576–1583. [Google Scholar] [CrossRef]
- Li, Z.; Chen, P.; Chen, J.; Xu, Y.; Wang, Q.; Li, X.; Li, C.; He, L.; Shi, Y. Glucose and Insulin-Related Traits, Type 2 Diabetes and Risk of Schizophrenia: A Mendelian Randomization Study. EBioMedicine 2018, 34, 182–188. [Google Scholar] [CrossRef] [Green Version]


| Psychosis (n = 85) | Healthy Controls (n = 56) | p | |
|---|---|---|---|
| Age, years | 37.1 ± 13.5 | 32.5 ± 8.2 | 0.120 |
| Sex, male | 52.9% | 39.3% | 0.124 |
| Education, years | 13.1 ± 2.8 | 15.8 ± 2.5 | <0.001 |
| BMI, kg/m2 | 25.1 ± 4.7 | 23.8 ± 3.5 | 0.074 |
| Cigarette smoking, yes | 46.2% | 8.9% | <0.001 |
| Any ACEs | 71.2% | 57.4% | 0.132 |
| LTE | 5.9 ± 2.7 | 3.6 ± 2.2 | <0.001 |
| PSS | 23.1 ± 6.4 | 22.5 ± 4.0 | 0.352 |
| SOFAS | 45.2 ± 16.3 | 96.3 ± 5.5 | <0.001 |
| PANSS-P | 14.1 ± 5.2 | - | - |
| PANSS-N | 20.9 ± 9.3 | - | - |
| MADRS | 8.1 ± 8.1 | - | - |
| YMRS | 2.1 ± 5.0 | - | - |
| FGAs | 7.1% | - | - |
| SGAs | 71.8% | - | - |
| FGAs and SGAs | 20.0% | - | - |
| CPZeq | 380.6 ± 211.6 | - | - |
| Illness duration, weeks | 314 ± 466.9 | - | - |
| Glucose, mg/dL | 90.3 ± 16.8 | 83.1 ± 10.6 | 0.004 |
| Insulin, uIU/mL | 20.2 ± 19.6 | 10.9 ± 5.5 | 0.006 |
| HOMA-IR | 4.8 ± 5.0 | 2.3 ± 1.3 | 0.002 |
| LDL, mg/dL | 109.3 ± 37.2 | 102.7 ± 34.4 | 0.491 |
| HDL, mg/dL | 46.9 ± 15.3 | 62.0 ± 16.2 | <0.001 |
| TC, mg/dL | 182.9 ± 39.7 | 177.7 ± 34.1 | 0.698 |
| Triglycerides, mg/dL | 133.0 ± 59.2 | 76.8 ± 31.0 | <0.001 |
| hsCRP, mg/L | 2.0 ± 2.6 | 1.6 ± 2.7 | 0.275 |
| Glucose | Insulin | HOMA-IR | LDL | HDL | TC | Triglycerides | hsCRP | |
|---|---|---|---|---|---|---|---|---|
| Group | F = 4.856 p = 0.030 | F = 1.585 p = 0.245 | F = 3.847 p = 0.053 | F = 0.025 p = 0.875 | F = 5.300 p = 0.023 | F = 0.008 p = 0.928 | F = 4.720 p = 0.032 | F = 7.499 p = 0.007 |
| ACEs | F = 0.352 p = 0.554 | F = 5.960 p = 0.016 | F = 5.586 p = 0.020 | F = 0.753 p = 0.388 | F < 0.001 p = 0.985 | F = 0.896 p = 0.346 | F = 1.688 p = 0.197 | F = 0.004 p = 0.947 |
| Group × ACEs | F = 0.266 p = 0.607 | F = 4.497 p = 0.036 | F = 3.987 p = 0.048 | F = 0.214 p = 0.645 | F = 0.001 p = 0.972 | F = 0.886 p = 0.349 | F = 1.547 p = 0.217 | F = 0.210 p = 0.647 |
| Age | F = 4.623 p = 0.034 | F = 0.454 p = 0.502 | F = 0.087 p = 0.769 | F = 21.688 p < 0.001 | F = 0.151 p = 0.699 | F = 22.183 p < 0.001 | F = 2.768 p = 0.099 | F = 0.045 p = 0.832 |
| Sex | F = 0.001 p = 0.977 | F = 1.917 p = 0.169 | F = 1.289 p = 0.259 | F = 0.341 p = 0.561 | F = 4.094 p = 0.046 | F = 0.051 p = 0.822 | F = 2.955 p = 0.089 | F = 0.361 p = 0.549 |
| BMI | F = 1.013 p = 0.317 | F = 0.589 p = 0.445 | F = 0.814 p = 0.369 | F = 1.761 p = 0.188 | F = 12.002 p = 0.001 | F = 0.081 p = 0.777 | F = 6.547 p = 0.012 | F = 0.848 p = 0.359 |
| CPZeq | F = 0.954 p = 0.331 | F = 0.052 p = 0.821 | F = 0.004 p = 0.951 | F = 2.371 p = 0.127 | F = 0.009 p = 0.923 | F = 3.254 p = 0.074 | F = 2.606 p = 0.110 | F = 4.047 p = 0.047 |
| Illness duration | F = 0.073 p = 0.787 | F = 0.010 p = 0.920 | F = 0.006 p = 0.937 | F = 9.096 p = 0.003 | F = 0.020 p = 0.888 | F = 7.628 p = 0.007 | F = 0.005 p = 0.945 | F = 4.425 p = 0.038 |
| Cigarette smoking | F = 0.001 p = 0.973 | F = 0.075 p = 0.785 | F = 0.168 p = 0.683 | F = 0.475 p = 0.492 | F = 2.240 p = 0.138 | F = 1.620 p = 0.206 | F = 0.012 p = 0.912 | F = 1.535 p = 0.218 |
| LTE | PSS | |||
|---|---|---|---|---|
| Psychosis | HCs | Psychosis | HCs | |
| Glucose | r = −0.087 | r = 0.028 | r = 0.138 | r = −0.129 |
| Insulin | r = −0.013 | r = −0.045 | r = 0.059 | r = 0.065 |
| HOMA-IR | r = −0.036 | r = −0.049 | r = 0.105 | r = 0.022 |
| LDL | r = 0.061 | r = 0.189 | r = 0.027 | r = 0.133 |
| HDL | r = −0.002 | r = −0.050 | r = −0.038 | r = 0.152 |
| TC | r = 0.113 | r = 0.260 | r = −0.026 | r = 0.181 |
| Triglycerides | r = 0.182 | r = −0.021 | r = −0.014 | r = −0.067 |
| hsCRP | r = 0.151 | r = 0.061 | r = 0.083 | r = −0.052 |
Publisher’s Note: MDPI stays neutral with regard to jurisdictional claims in published maps and institutional affiliations. |
© 2020 by the authors. Licensee MDPI, Basel, Switzerland. This article is an open access article distributed under the terms and conditions of the Creative Commons Attribution (CC BY) license (http://creativecommons.org/licenses/by/4.0/).
Share and Cite
Misiak, B.; Piotrowski, P.; Beszłej, J.A.; Kalinowska, S.; Chęć, M.; Samochowiec, J. Metabolic Dysregulation and Psychosocial Stress in Patients with Schizophrenia Spectrum Disorders: A Case-Control Study. J. Clin. Med. 2020, 9, 3822. https://0-doi-org.brum.beds.ac.uk/10.3390/jcm9123822
Misiak B, Piotrowski P, Beszłej JA, Kalinowska S, Chęć M, Samochowiec J. Metabolic Dysregulation and Psychosocial Stress in Patients with Schizophrenia Spectrum Disorders: A Case-Control Study. Journal of Clinical Medicine. 2020; 9(12):3822. https://0-doi-org.brum.beds.ac.uk/10.3390/jcm9123822
Chicago/Turabian StyleMisiak, Błażej, Patryk Piotrowski, Jan Aleksander Beszłej, Sylwia Kalinowska, Magdalena Chęć, and Jerzy Samochowiec. 2020. "Metabolic Dysregulation and Psychosocial Stress in Patients with Schizophrenia Spectrum Disorders: A Case-Control Study" Journal of Clinical Medicine 9, no. 12: 3822. https://0-doi-org.brum.beds.ac.uk/10.3390/jcm9123822