Article

Oral Microbiome Signatures in Hematological Cancers Reveal Predominance of Actinomyces and Rothia Species

by
Jean-Luc C. Mougeot
*,
Micaela F. Beckman
,
Holden C. Langdon
,
Michael T. Brennan
and
Farah Bahrani Mougeot
*
Carolinas Medical Center-Atrium Health, 1000 Blythe Blvd, Charlotte, NC 28203, USA
*
Authors to whom correspondence should be addressed.
J. Clin. Med. 2020, 9(12), 4068; https://0-doi-org.brum.beds.ac.uk/10.3390/jcm9124068
Submission received: 28 October 2020 / Revised: 9 December 2020 / Accepted: 14 December 2020 / Published: 17 December 2020
(This article belongs to the Special Issue The Oral Microbiome in Health and Disease)

Abstract

:
The endogenous microbiome of healthy individuals in oral cavities is diverse, representing over 700 bacterial species. Imbalance in oral and gut microbiome composition and associated gene expression has been linked to different forms of hematological (blood) cancers. Our objective is to compare oral microbiome profiles of patients with blood cancers (BC group: N = 39 patients, n = 124 oral samples) to those of healthy control subjects (HC group: N = 27 subjects, n = 100 oral samples). Saliva samples and swabs of buccal mucosa, supragingival plaque, and tongue were collected from blood cancer patients and healthy controls. Next-generation sequencing (16S-rRNA gene V3–V4 region) was used to determine the relative abundance of bacterial taxa present at the genus and species levels. Differences in oral microbiome beta-diversity were determined using multivariate permutational analysis of variance (PERMANOVA). Linear discriminant analysis (LDA) effect size (LEfSe) analysis was performed to identify differentiating bacterial taxa in pairwise comparisons. The PATRICv3.6.7 online tool was used to determine the predominance of potential pathogenicity in the BC group. The oral microbiome beta-diversities of the BC and HC groups differed and corresponded to a reduced alpha-diversity in the BC group. LEfSe analysis showed significant LDA scores for Actinomyces and Rothia spp., differentiating the BC group from the HC group. In silico analysis using PATRICv3.6.7 demonstrated that the groups of bacteria possessing traits of “antibiotic resistance”, “oral pathogen”, and “virulence” was enriched in the BC group. Although 56% of the BC patients received antibiotics within two weeks of the oral bacterial sampling, Actinomyces genus remained the top differentiating feature in the BC group regardless of the administration of antibiotics, while Rothia dentocariosa was detected as the top differentiating feature in the BC patients who did not receive antibiotics, but not in those who received antibiotics. Further investigation is needed to better understand the interactions of certain oral species with the host immune system to better characterize clinically relevant associations with hematological cancers.

1. Introduction

A recent review by Siegel et al. reported that in 2020, there will be approximately 180,000 new cases of hematological/blood cancers (i.e., Hodgkin and non-Hodgkin lymphomas, myeloma, and leukemia) and about one-third will succumb to the disease [1]. In spite of significant advancements in diagnostics and treatment protocols for cancer patients [2,3], there is still a gap in knowledge to understand the underlying factors contributing to the progression of many cancers. This is in part due to insufficient knowledge about the effects of the human microbiome on carcinogenesis and on host immune response [4].
Historically, most research has focused on the determination of associations between the oral and/or gut microbiome with solid-tumor cancers. Mohammed et al. [5] showed a significant increase in 31 bacterial species in saliva samples of pancreatic cancer patients, including Porphyromonas gingivalis and Aggregatibacter actinomycetemcomitans, the species known to be associated with tooth decay and infective endocarditis [6]. Additionally, an elevation in the blood serum antibodies against P. gingivalis has been suggested to be associated with an increased risk of pancreatic cancer and liver cirrhosis [5]. In another study of pancreatic cancer, an increase in the abundance of a Fusobacterium spp. in pancreatic cancer tissues was found to be associated with a worse prognosis [7]. Fusobacterium has also been identified as an indicator of colorectal carcinogenesis [8]. F. nucleatum has been found to be present in the stool samples and tumor biopsies of colorectal cancer patients [8]. Indeed, this species has been used in Japan as the biomarker for screening patients to determine their prognosis [9]. Furthermore, an increase in the relative abundance of Fusobacterium, Haemophilus, Neisseria, and Proteobacteria and a decrease in the relative abundance of Porphyromonas on the tongue have been associated with gastric cancer [10]. A possible link between the oral microbiome and carcinogenesis has also been shown in esophageal cancer [11]. Chen et al. [11] found an increase in Prevotella, Streptococcus, and Porphyromonas genera in saliva samples of patients with esophageal squamous cell carcinomas compared to healthy controls. The authors also identified the pathway through which Streptococcus contributes to carcinogenesis of esophageal tissue through the initiation of inflammation and development of dysplasia [11].
Unlike solid tumor cancers, there is little known about the association of the oral microbiome with the various types of hematological cancers. Distinct gut and oral (dental plaque) microbiome profiles associated with acute lymphoblastic leukemia (ALL) were identified in the pediatric population [12,13,14]. In this population, a reduction in gut microbial diversity, along with an increased abundance of phylum Actinobacteria, was associated with increased immune activation in ALL survivors who developed chronic inflammation [12]. In another study, Galloway-Pena JR et al. showed an unstable temporal microbial diversity in the gut and oral cavity of patients with acute myelogenous leukemia (AML) [15]. Furthermore, a study of patients undergoing hematopoietic stem cell transplants showed oral microbiome changes associated with respiratory signs and symptoms [16]. Additionally, we recently reported that lasting changes in oral Gammaproteobacteria profiles occur in hematopoietic stem cell transplant patients who develop ulcerative oral mucositis after conditioning therapy [17].
In the present study, we determine the differences between oral microbiome profiles of patients with hematological cancers of various types and healthy controls, based on multiple oral site sampling and next-generation sequencing of the 16S rRNA bacterial gene (V3–V4 region).

2. Materials and Methods

2.1. Patient Recruitment

Patients (pts; N = 39) diagnosed with hematological/blood cancers (BCs), who were scheduled for conditioning treatment prior to hematopoietic stem cell transplant, were recruited at Atrium Health’s Carolinas Medical Center, Charlotte, North Carolina, with the approval of the institutional review board. Additionally, healthy control subjects (HC; N = 27) were recruited for this study. All participants gave informed consent for the study. Hematological cancer diagnoses included acute lymphoblastic leukemia (ALL, N = 3), acute myelogenous leukemia (AML, N = 16), chronic myelogenous leukemia (CML, N = 1), lymphoma (LYM, N = 10), myelodysplastic syndrome (MDS, N = 2), myelofibrosis (MF, N = 2), and multiple myeloma (MM, N = 5). Samples were collected before conditioning therapy at baseline. Of the 39 hematological cancer patients, 22 were treated with antibiotics within two weeks before sample collection. None of the healthy controls were treated with antibiotics within this time frame. Demographics and clinical characteristics of BC pts, HCs, and the largest cancer subgroup, AML pts, are presented in Table 1. Although no significant difference was found for age and gender, black ethnicity was over-represented in the BC group of patients.

2.2. Sample Collection, Bacterial DNA Extraction and Sequencing

Oral samples, i.e., buccal mucosa (B), superficial supragingival plaque (P) and tongue (T) swabs, and saliva sample (S), were collected from BC pts at baseline (precancer treatment) and HCs.
Saliva collection was performed first while chewing unsweetened and unflavored gum (The Wrigley Company, Mars, Inc., Chicago, IL, USA) for a period of two minutes into a 50-mL conical BD FalconTM polypropylene centrifuge tube (Corning, NY, USA) and kept on ice for no longer than 30 min before processing or being stored at −80 °C. Buccal mucosa samples were subsequently collected by swabbing both sides of the buccal mucosa for 10 s each. Tongue samples were then obtained by swabbing a 1 cm 2 region on both sides of the middorsal region of the tongue for 5 s. Finally, superficial supragingival plaque (P) samples were obtained using OmniSwabs (GE Life Sciences-Buckinghamshire, UK) across the lateral surfaces of all maxillary and mandibular teeth at the junction of each tooth and gingiva.
Bacterial genomic DNA was extracted from oral samples using the QIAamp DNA Mini Kit procedure (QIAGEN, Valencia, CA, USA) per the manufacturer’s instructions. Identification of bacterial genera and species was performed by utilizing Human Oral Microbe Identification using Next Generation Sequencing (HOMINGS), which employs a ProbeSeq BLAST-type program for species/genera identification through recognition of the 16S rRNA gene (V3–V4 region). During sample preparation, 50 ng of genomic DNA was used for PCR, in which the 16S rRNA (V3–V4) region was amplified, followed by purification and processing methods described by Caporaso et al. using MiSeq (Illumina, Inc., San Diego, CA, USA) [18]. ProbeSeq sequence identification used rRNA-based in silico probes in a BLAST program to determine the species/genera counts. The sequence-reads were matched to 737 ProbeSeq taxon probes, i.e., to a species probe (n = 620) or a genus probe (n = 117) if not matched to a species probe, or were otherwise recorded as an unmatched read.

2.3. Data Preprocessing

Results were provided as Excel spreadsheets displaying total probe counts (matched reads) per taxon per patient ranging from 0–89,766 for species probes and 0–133,658 for genus probes (BC pts and HC data combined). Probe counts were summed for the species and genera identified through several probes, resulting in a dataset allowing the identification of 534 species and 78 genera from the initial 620 species and 117 genus probes, respectively. Probe counts per species or genus were converted into relative abundances, based on the total number of counts per patient for all the species and genus probes combined. HC subjects and BC pts were categorized per oral sample site combinations to perform PERMANOVA. The combinations BPST, BST, PST, and ST yielded the largest subcohort sizes associated with the largest number of successfully processed oral samples (spl.), i.e., BPST (20 HC/80 spl.; 13 BC/52 spl.), BST (24 HC/72 spl.; 17 BC/51 spl.), PST (23 HC/69 spl.; 29 BC/87 spl.), and ST (27 HC/54 spl.; 39 BC/78 spl.). The combinations BPT and BPS yielded 20 HC/13 BC and 19 HC/13 BC, respectively, with all BC samples stemming from the BPST cohort, and, therefore, were not considered for further analysis.
Overall, for the samples analyzed, there was no significant difference regarding unmatched reads between the HC group (range 4.00% to 49.20%, mean (SD) = 19.20 (10.37)) and the BC group (range 2.77% to 45.15%, mean (SD) = 20.37 (10.32)) (p > 0.05, Mann–Whitney U-test). In addition, there was no inverse correlation between the percentages of unmatched reads and the number of species and genera detected for both the HC and BC groups (Spearman’s r = +0.30772 and +0.3736, respectively, p < 0.05). These data indicate that an increase in unmatched reads did not result in a loss of detection of species due to the generation of spurious sequences (i.e., caused by lower bacterial DNA quality).

2.4. Statistical Analysis

2.4.1. PERMANOVA

PRIMERv7 software (PRIMER-E Ltd., Ivybridge, UK) was used to run a multivariate permutational analysis of variance (PERMANOVA) using unrestricted permutation of raw data (one factor) or permutation of residuals under a reduced model (2–3 factors), 9999 permutations, and type III partial sum of squares. Two types of analyses (AN) were performed: (i) blood cancer (BC) vs. healthy controls (HC) (AN1) and (ii) a subanalysis for the blood cancer type AML, which had the largest cancer subgroup sample size (AN2), to compare alpha- and beta-diversities based on relative abundance data and different sample site combinations. For the sample site combinations BPST, BST, PST, and ST, BC pts were compared to HCs within the limit of available data, i.e., N = 39 pts, n = 124 oral samples for the BC group and N = 27 pts, n = 100 oral samples for the HC group (AN1; Table 1). In AN2, AML subgroup (N = 16 pts, n = 49 samples) was compared to the HC group.
The PERMANOVA design consisted of the fixed variables “Group” (BC, HC) and “Site” for the abovementioned sample site combinations. To increase the degrees of freedom, the design also combined the random variables “antibiotics” (Yes/No) and “diagnosis” (HC, ALL, AML, CML, LYM, MDS, MF, MM) into a single variable designated as “AB-DIA” (i.e., coded as YAML or NMM, for example), which was nested into “Group” and “Site” in a three-factor PERMANOVA design. Indeed, AB treatment frequency was dependent on the type of blood cancer (ALL 2/3, AML 11/16, CML 0/1, LYM 6/10, MDS 1/2, MF 2/2, and MM 0/5), while the absence of AB treatment characterized the HC group. Secondary variables such as age, gender, and ethnicity, potentially affecting microbiome profiles, were not included in the analyses due to sample-size limitations.
Relative abundance data were squared-root transformed and converted to Bray–Curtis similarity matrices prior to PERMANOVA analysis. For all analyses performed, PERMANOVA Monte-Carlo-corrected p-values (p < 0.05) were obtained for both fixed and random variables.

2.4.2. Principal Coordinate Analysis (PCoA) and Nonmetric Multidimensional Scaling (nMDS)

For the selected comparisons, PST AN1, and AN2 that were statistically significant per PERMANOVA, nonmetric multidimensional scaling PCoA, and nMDS plots of BC and HC samples were generated using PRIMERv7 software (PRIMER-E Ltd.).

2.4.3. Linear Discriminant Analysis (LDA) Effect Size (LEfSe)

LEFSe was performed on BPST, PST, and ST cumulative relative abundance data in AN1 and PST in AN2 using the online tool Galaxyv1.2 [19] in order to determine differentiating features at the genus and species levels, as described by Segata et al. [20]. Taxonomy levels were manually added to all groupings within the text files that were formatted according to Galaxyv1.2 required formatting. Data formatting and input consisted of diagnosis (blood cancers and healthy control) as class and patient ID as subject. Analysis strategy “one-against-all” was used for multiclass analysis; the factorial Kruskal-Wallis test, as well as pairwise Wilcoxon signed-rank test for all groupings, were set at a Monte-Carlo (alpha = 0.05). Results were displayed as histograms and cladograms, representing taxa with an LDA > 3.0 threshold for the analyses AN1 BC vs. HC, AN1 BC—No Antibiotics vs. HC, AN1 BC—Antibiotics vs. HC, and AN2 AML vs. HC (AML subgroup, with or without the inclusion of antibiotic treatment).

2.4.4. Alpha-Diversity

The Shannon alpha-diversity index was determined using PRIMERv7 software for the AN1 and AN2 comparisons, based on relative abundance derived from cumulated counts for BPST and PST site combinations. Significance was determined by Mann–Whitney U-test (alpha = 0.05).

2.4.5. Association between Taxonomic Profiles and Pathogenicity

The PATRICv3.6.7 online tool [21] was used to link the taxonomic profiles to pathogenicity concepts (i.e., oral pathogen, virulence, and antibiotic resistance) for the AN1 and AN2 analyses based on LEfSe significant species and genera. Cumulative mean relative abundance data plots for species representing enriched pathogenicity concepts were generated using the PST site combination (i.e., representing the largest number of patients and associated oral samples).

2.5. Ethics

This study has been approved by the Institutional Review Board of Atrium Health, Charlotte, NC, USA (IRB# 05-14-18B). All patients participating in this study gave informed consent.

3. Results

Figure 1 presents the overall analytical strategy.

3.1. BC pts Were Found to Have a Reduction in Alpha-Diversity When Compared to HC

Considering patient demographics and clinical characteristics, no significant difference (alpha = 0.05) was found for age (Mann–Whitney U-test) or gender (chi-squared test). Black ethnicity was determined to be over-represented in the BC group of patients compared to healthy control subjects (p = 0.0046 per chi-squared test). Demographics and clinical characteristics of BC pts, HC, and the largest cancer subgroup, AML pts, are presented in Table 1. For our cohort of hematological/blood cancer patients (BC; N = 39) and healthy control subjects (HC, N = 27), considering the total possible identification of 534 species and 78 genera through the respective species and genus probes, the average number of species and genera detected per subject was determined for all sample site combinations (BPST, PST, BST, and ST). There were 396 species and 60.6 genera detected on average, with an average of 138 species and 17.4 genera not detected with the abovementioned combinations, whether or not abundance data were cumulated for the different sample site combinations (Table S1).
The average number of species and genera identified per subject in each group (HC, BC, and AML) for the different sample site combinations analyzed (with cumulated RA data) is described in Table S2. A significant reduction in the number of species and genera detected in the BC group/AML subgroup was observed compared to HC, regardless of the sample site combinations (Table S2). For the taxa detected in the PST oral site combination, which had the largest number of patients and associated oral samples (23 HC/69 spl.; 29 BC/87 spl.) based on cumulative PST RAs, there was a significant reduction of the number of species detected in BC per patient (mean = 118.48) compared to HC (mean = 172.78) (p < 0.00001; Mann–Whitney U-test). The total number of species detected in the cumulative PST combination was 360 in the HC group and 351 in the BC group. The Shannon index was, on average, significantly different between the BC and HC groups, with BC mean H’ (SD) = 2.59 (0.61) and HC mean H’ (SD) = 2.96 (0.41) (p = 0.03236; Mann–Whitney U-test). These results confirm the reduction in alpha-diversity in the BC group.

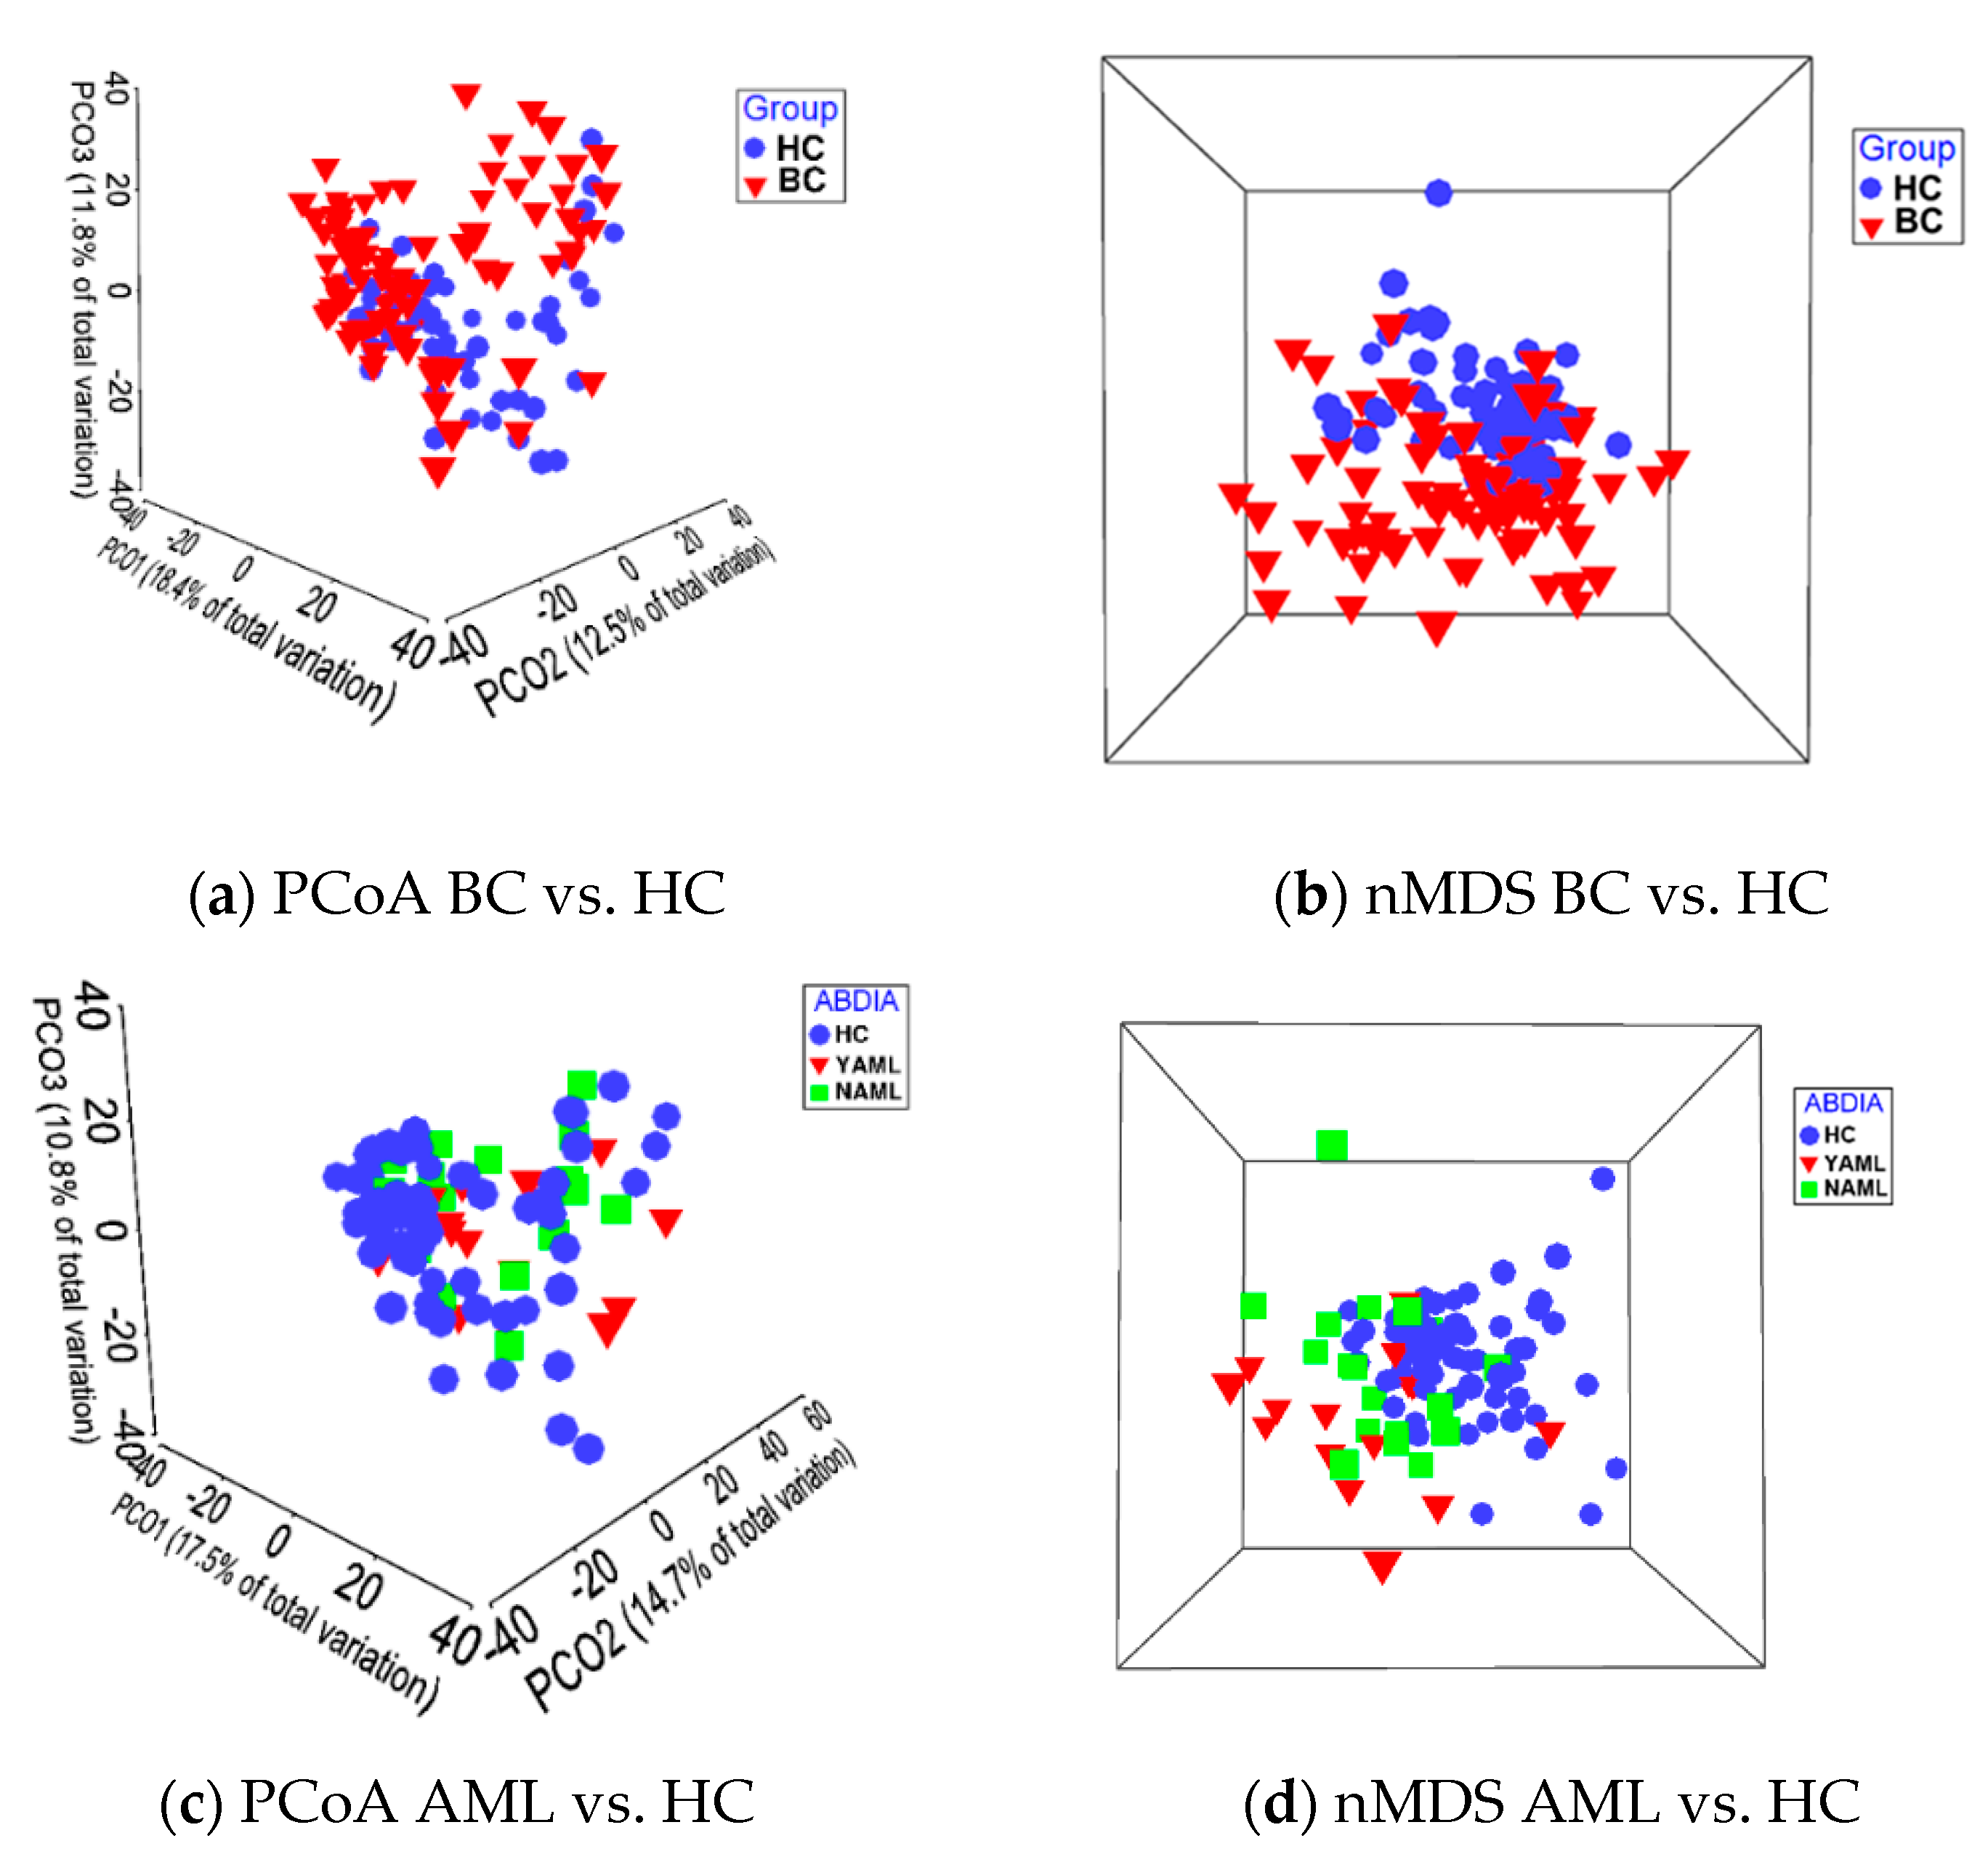
3.2. Beta-Diversity Shows Significant Difference between the BC and HC Groups

Results from PERMANOVA analyses are presented in Table 2. Noncumulative sample site combinations showed distinct beta-diversity between the BC vs. HC groups, regardless of the sample site combination (i.e., BPST, PST, BST, and ST) and antibiotic use. A significant loss of power was observed when reducing the sample sites analyzed for the secondary variables “Site” and “AB-DIA”. In the comparison AML vs. HC, PERMANOVAs were significant, regardless of whether samples from AB-treated or -untreated AML patients were analyzed in combination or separately (Table 2). Moreover, when removing diagnoses with very small sample sizes, there is little effect on the PERMANOVA p-value (Table 2). PCoA and nMDS plots for AN1 and AN2 (all AML), showing distinct clustering and significant variation between the BC and HC groups, are illustrated for the PST site combination (noncumulative RA data) in Figure 2.

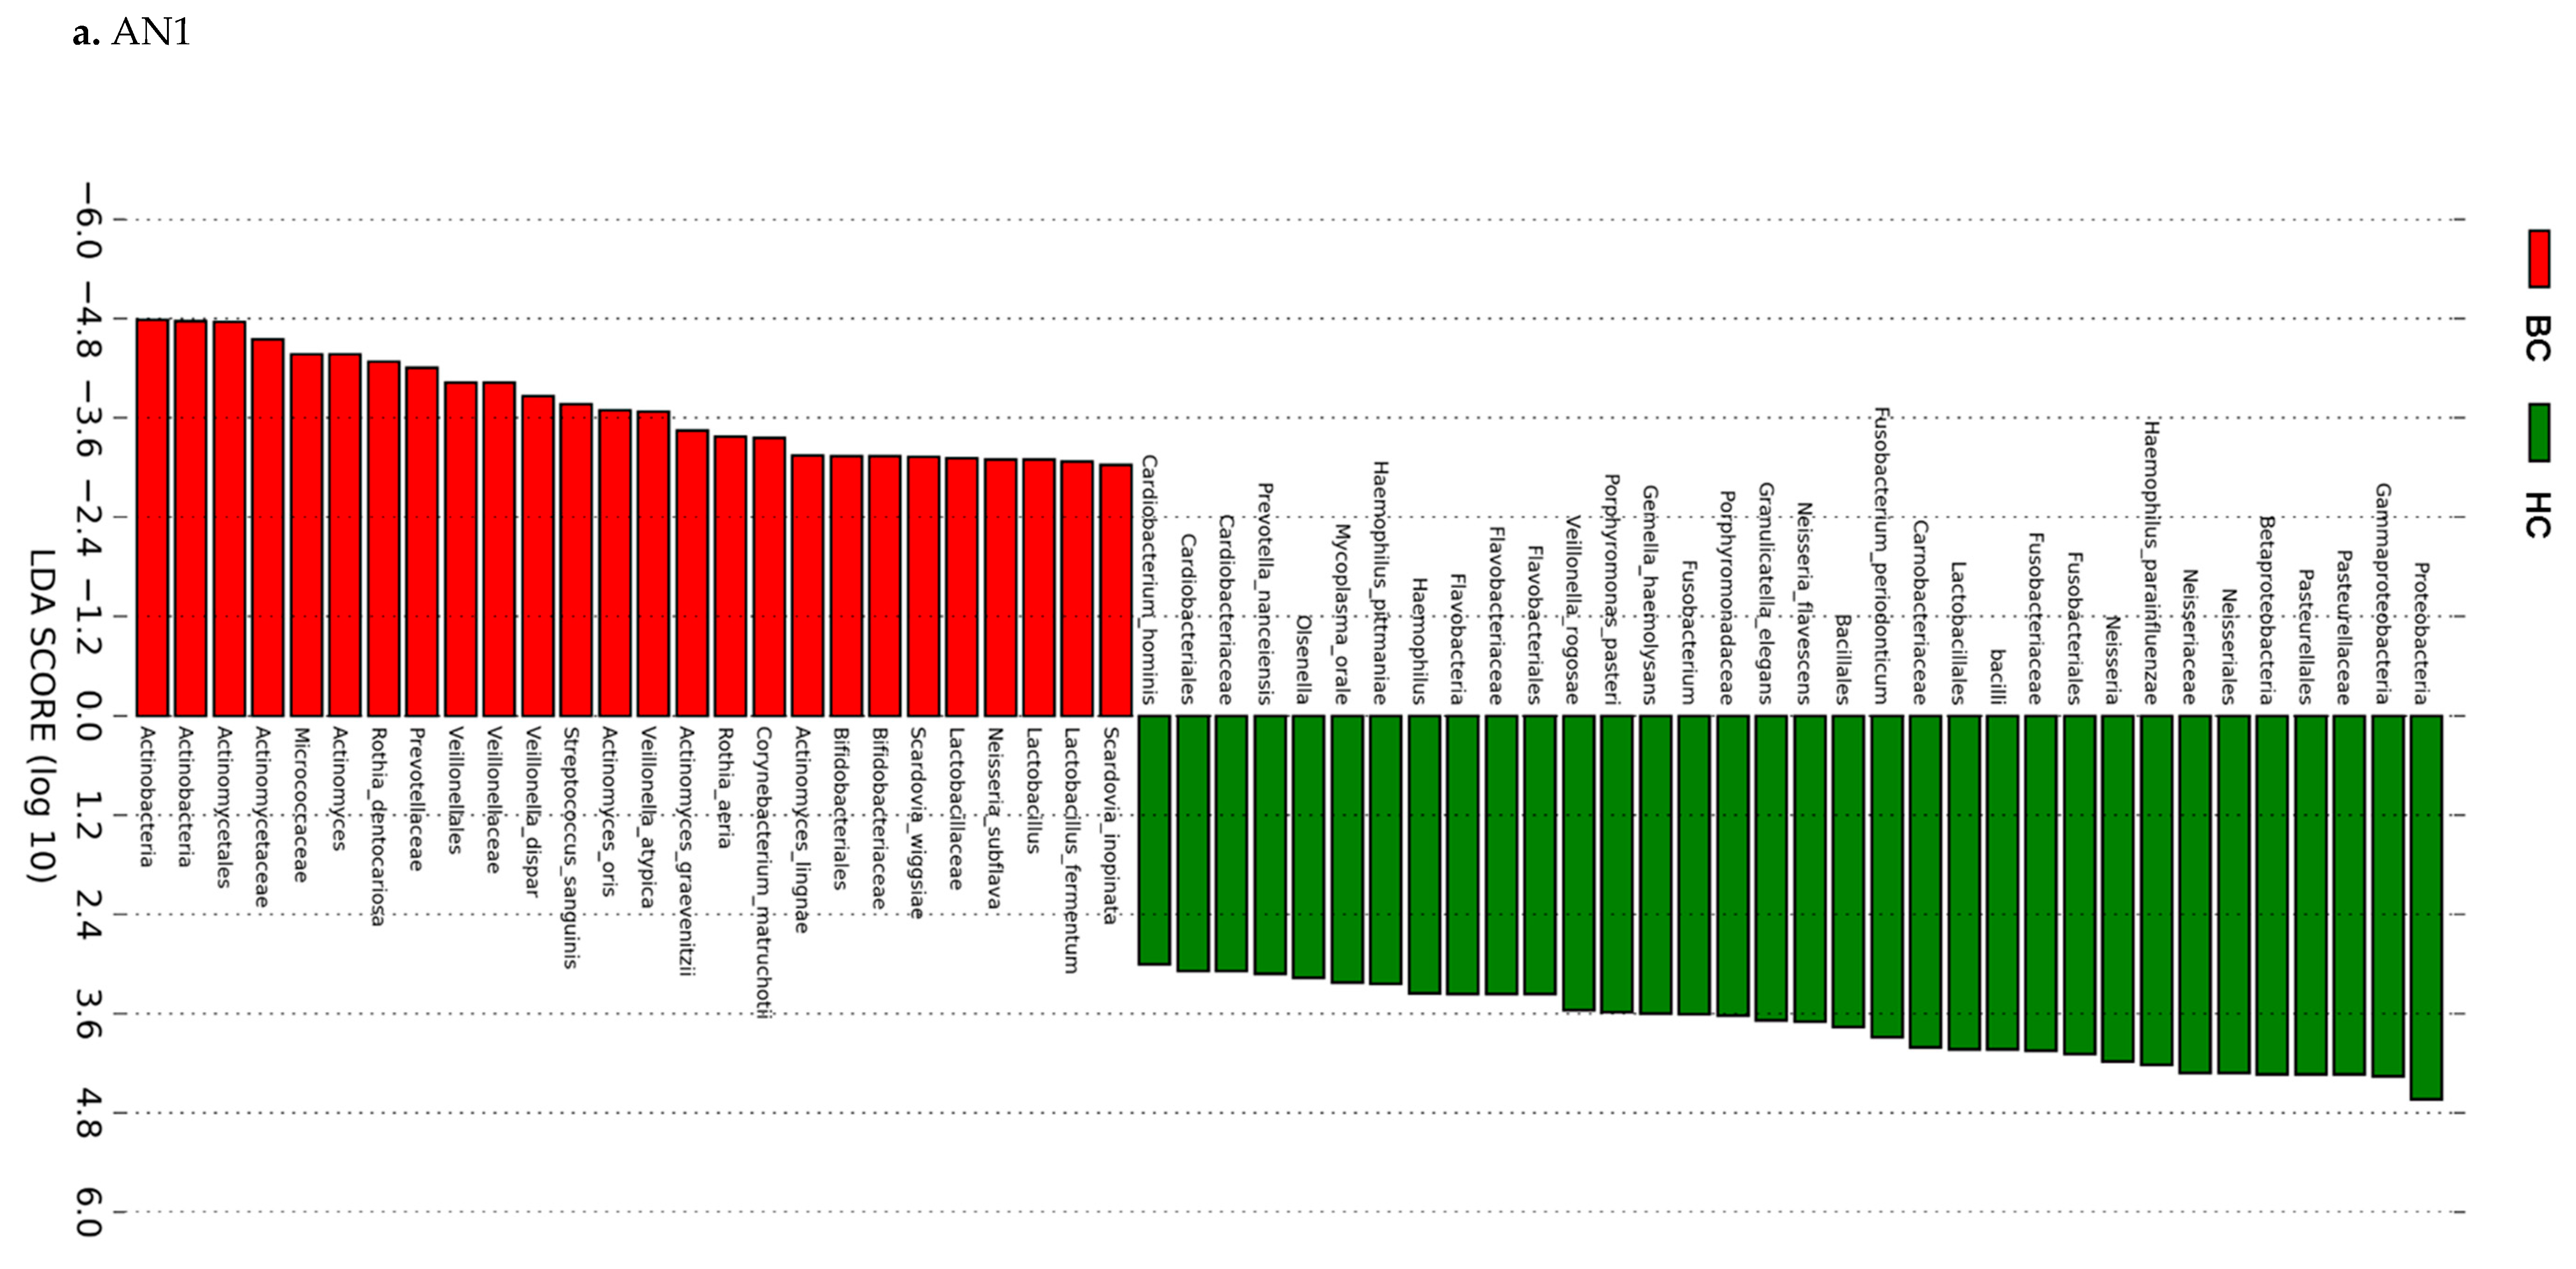
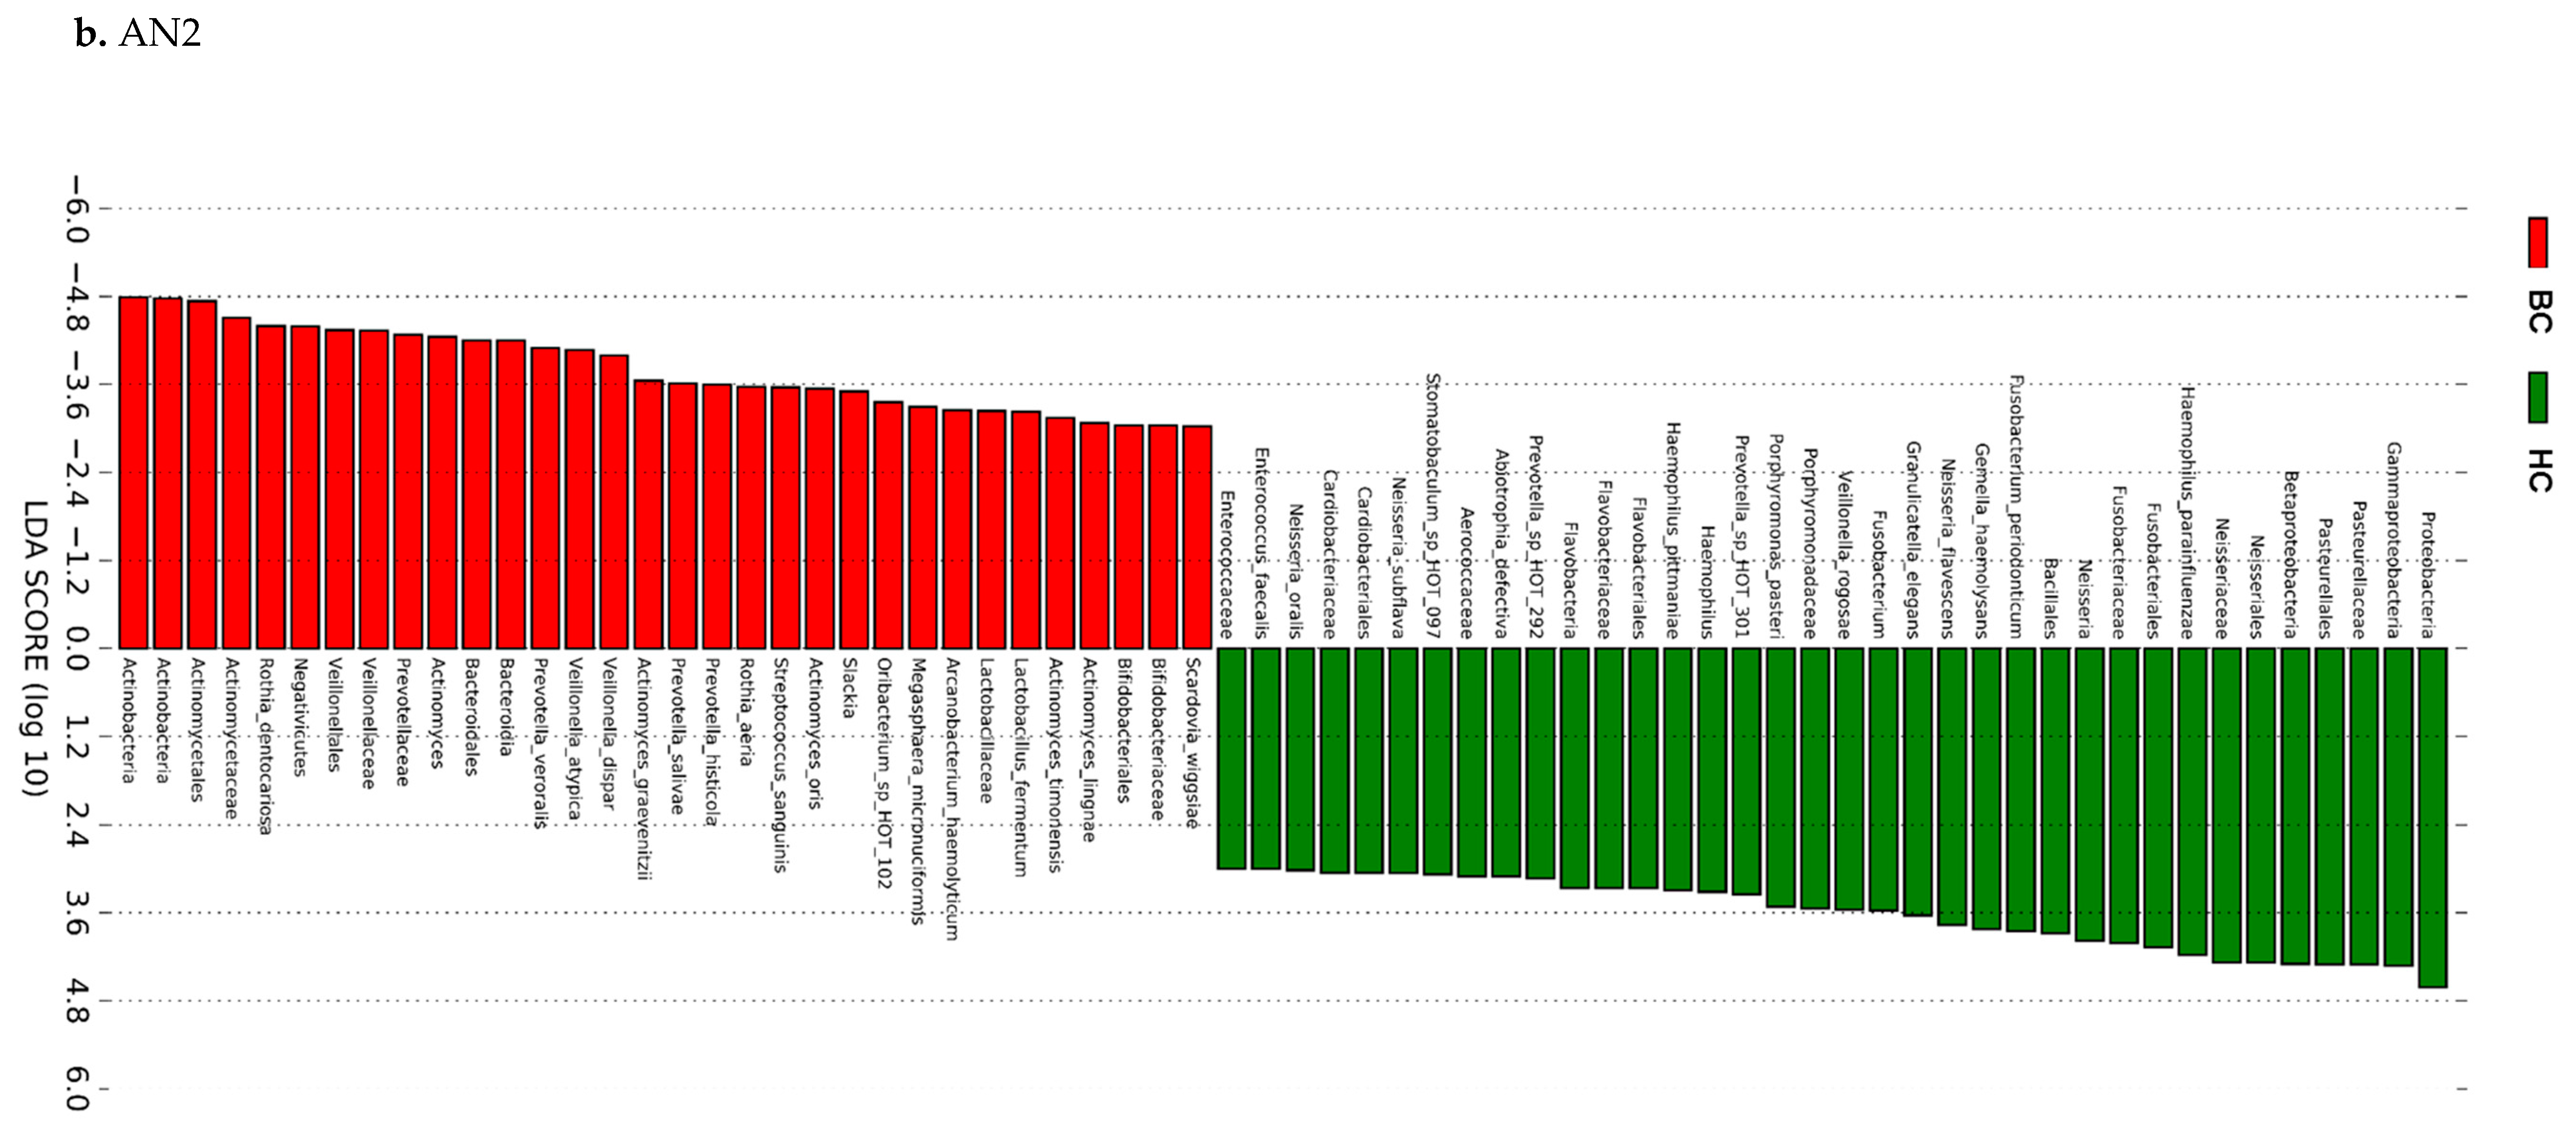
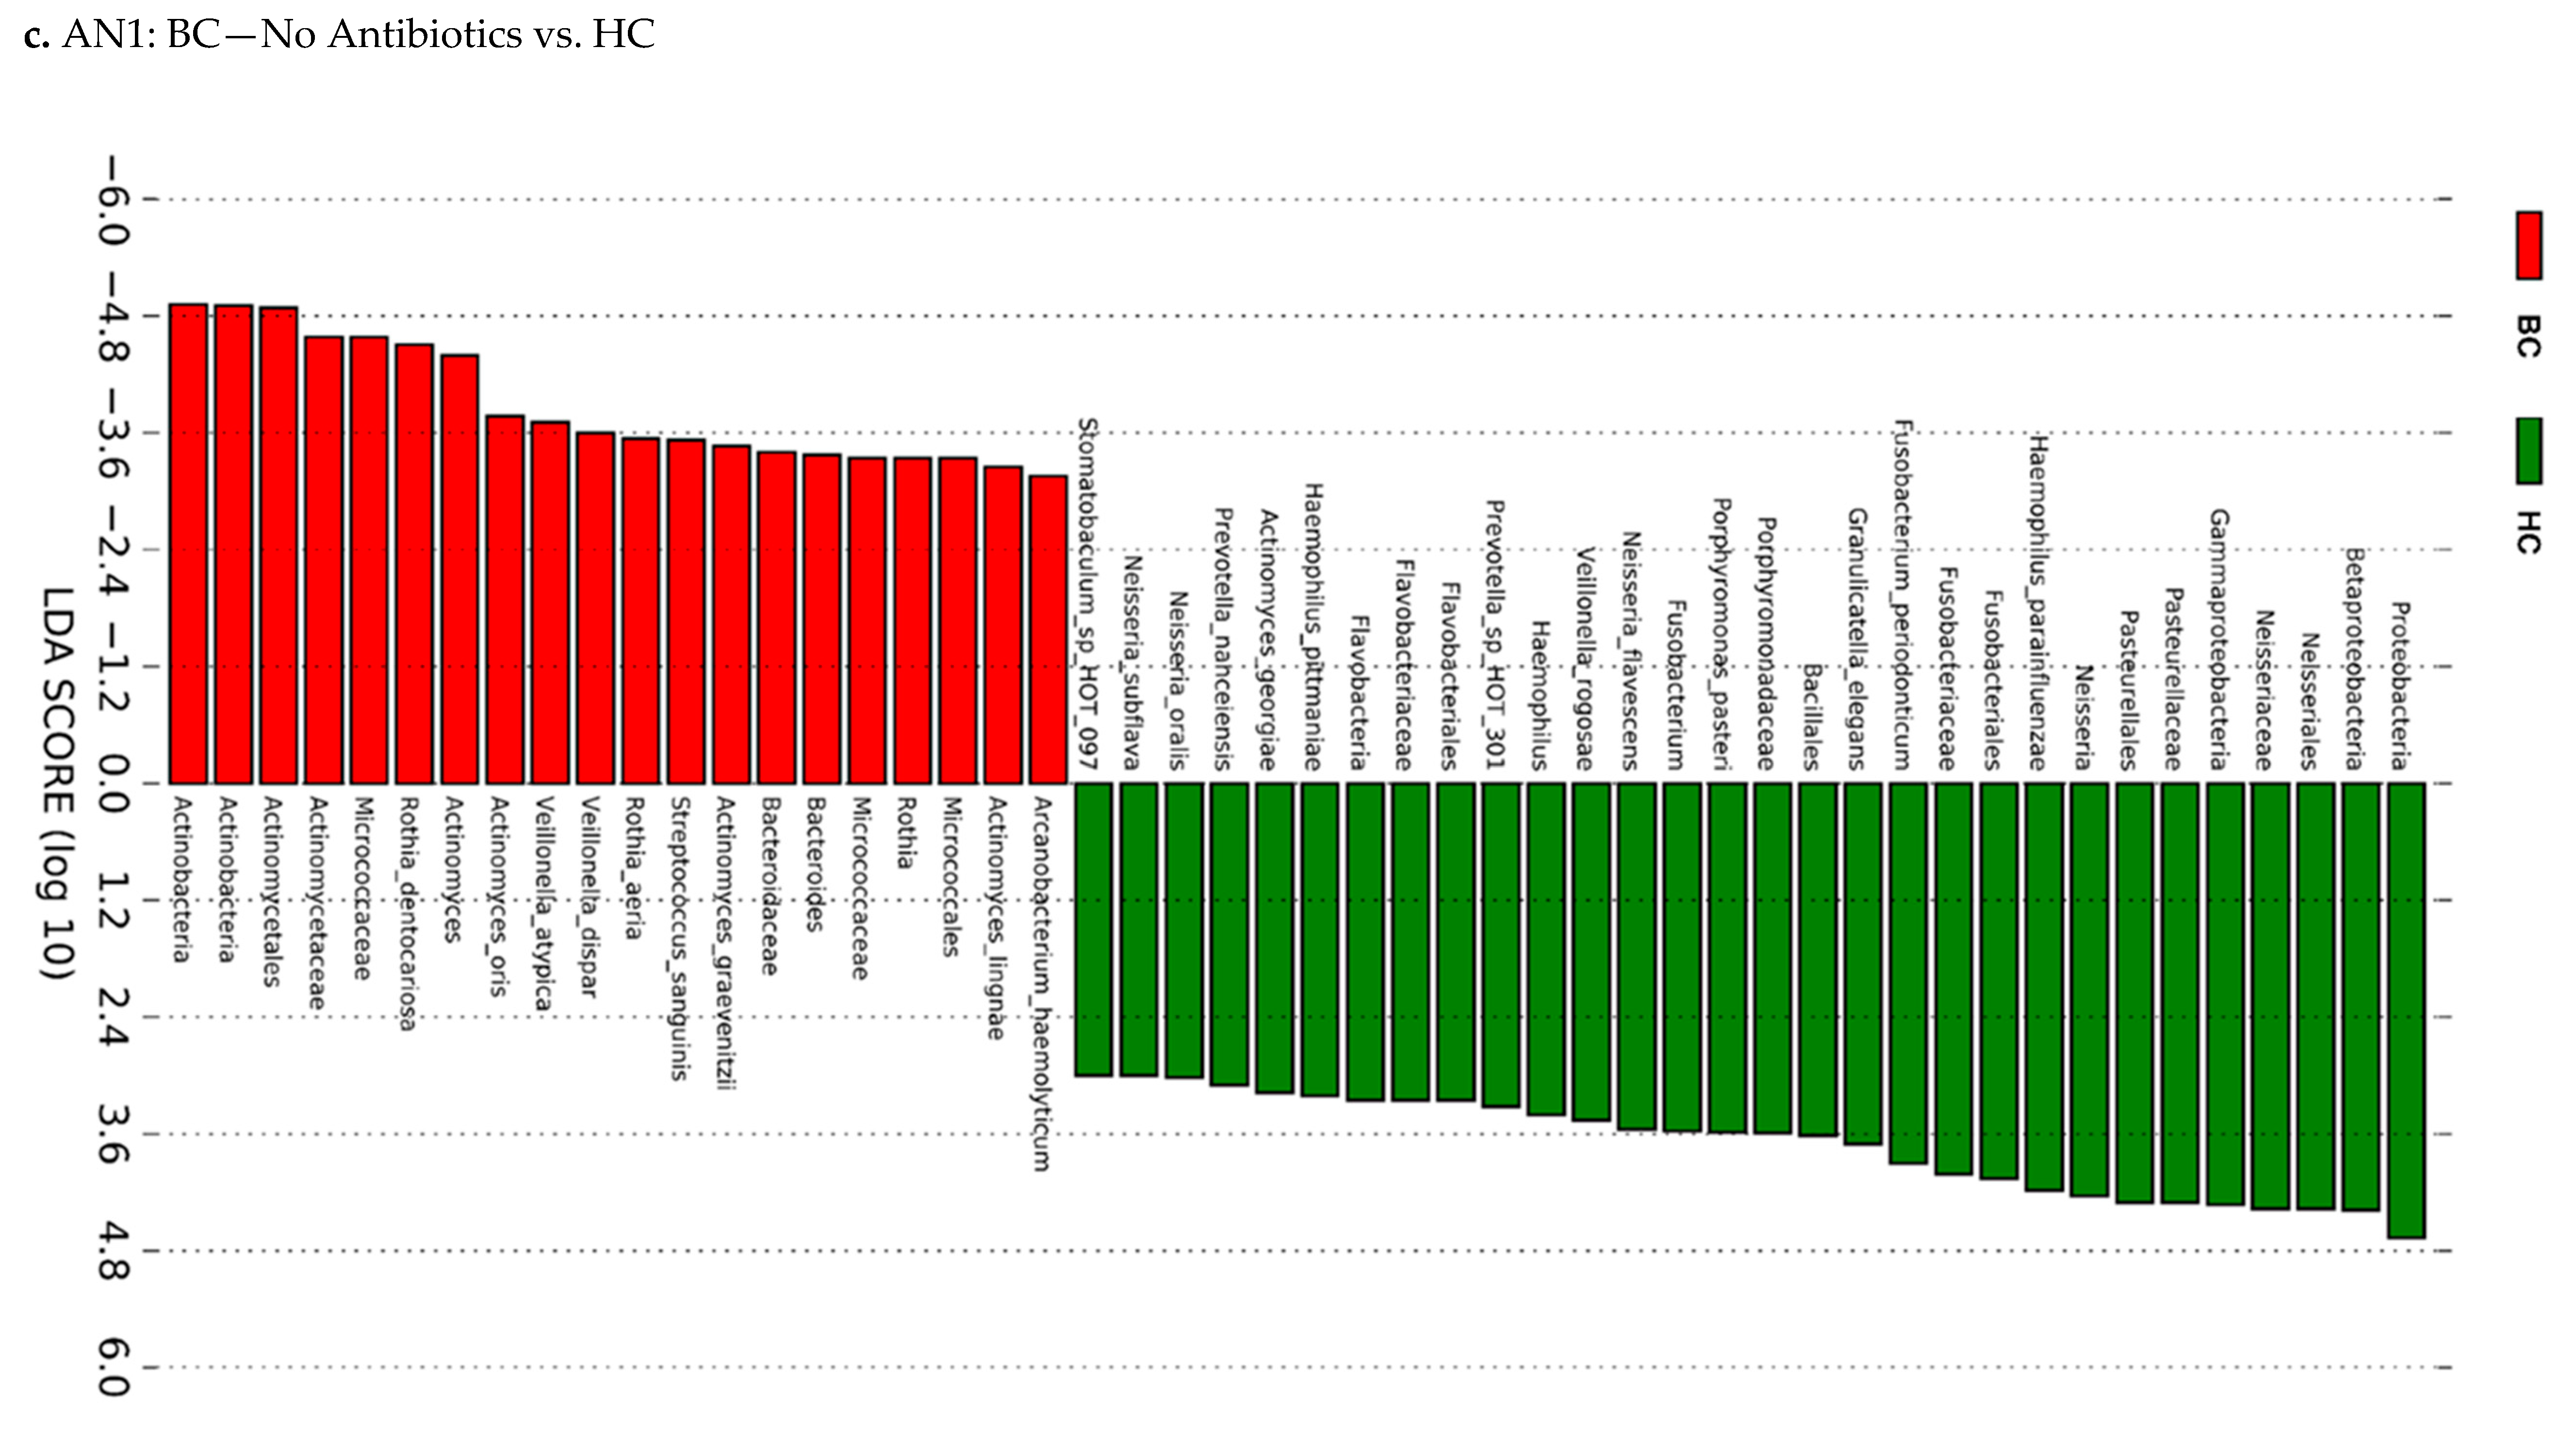
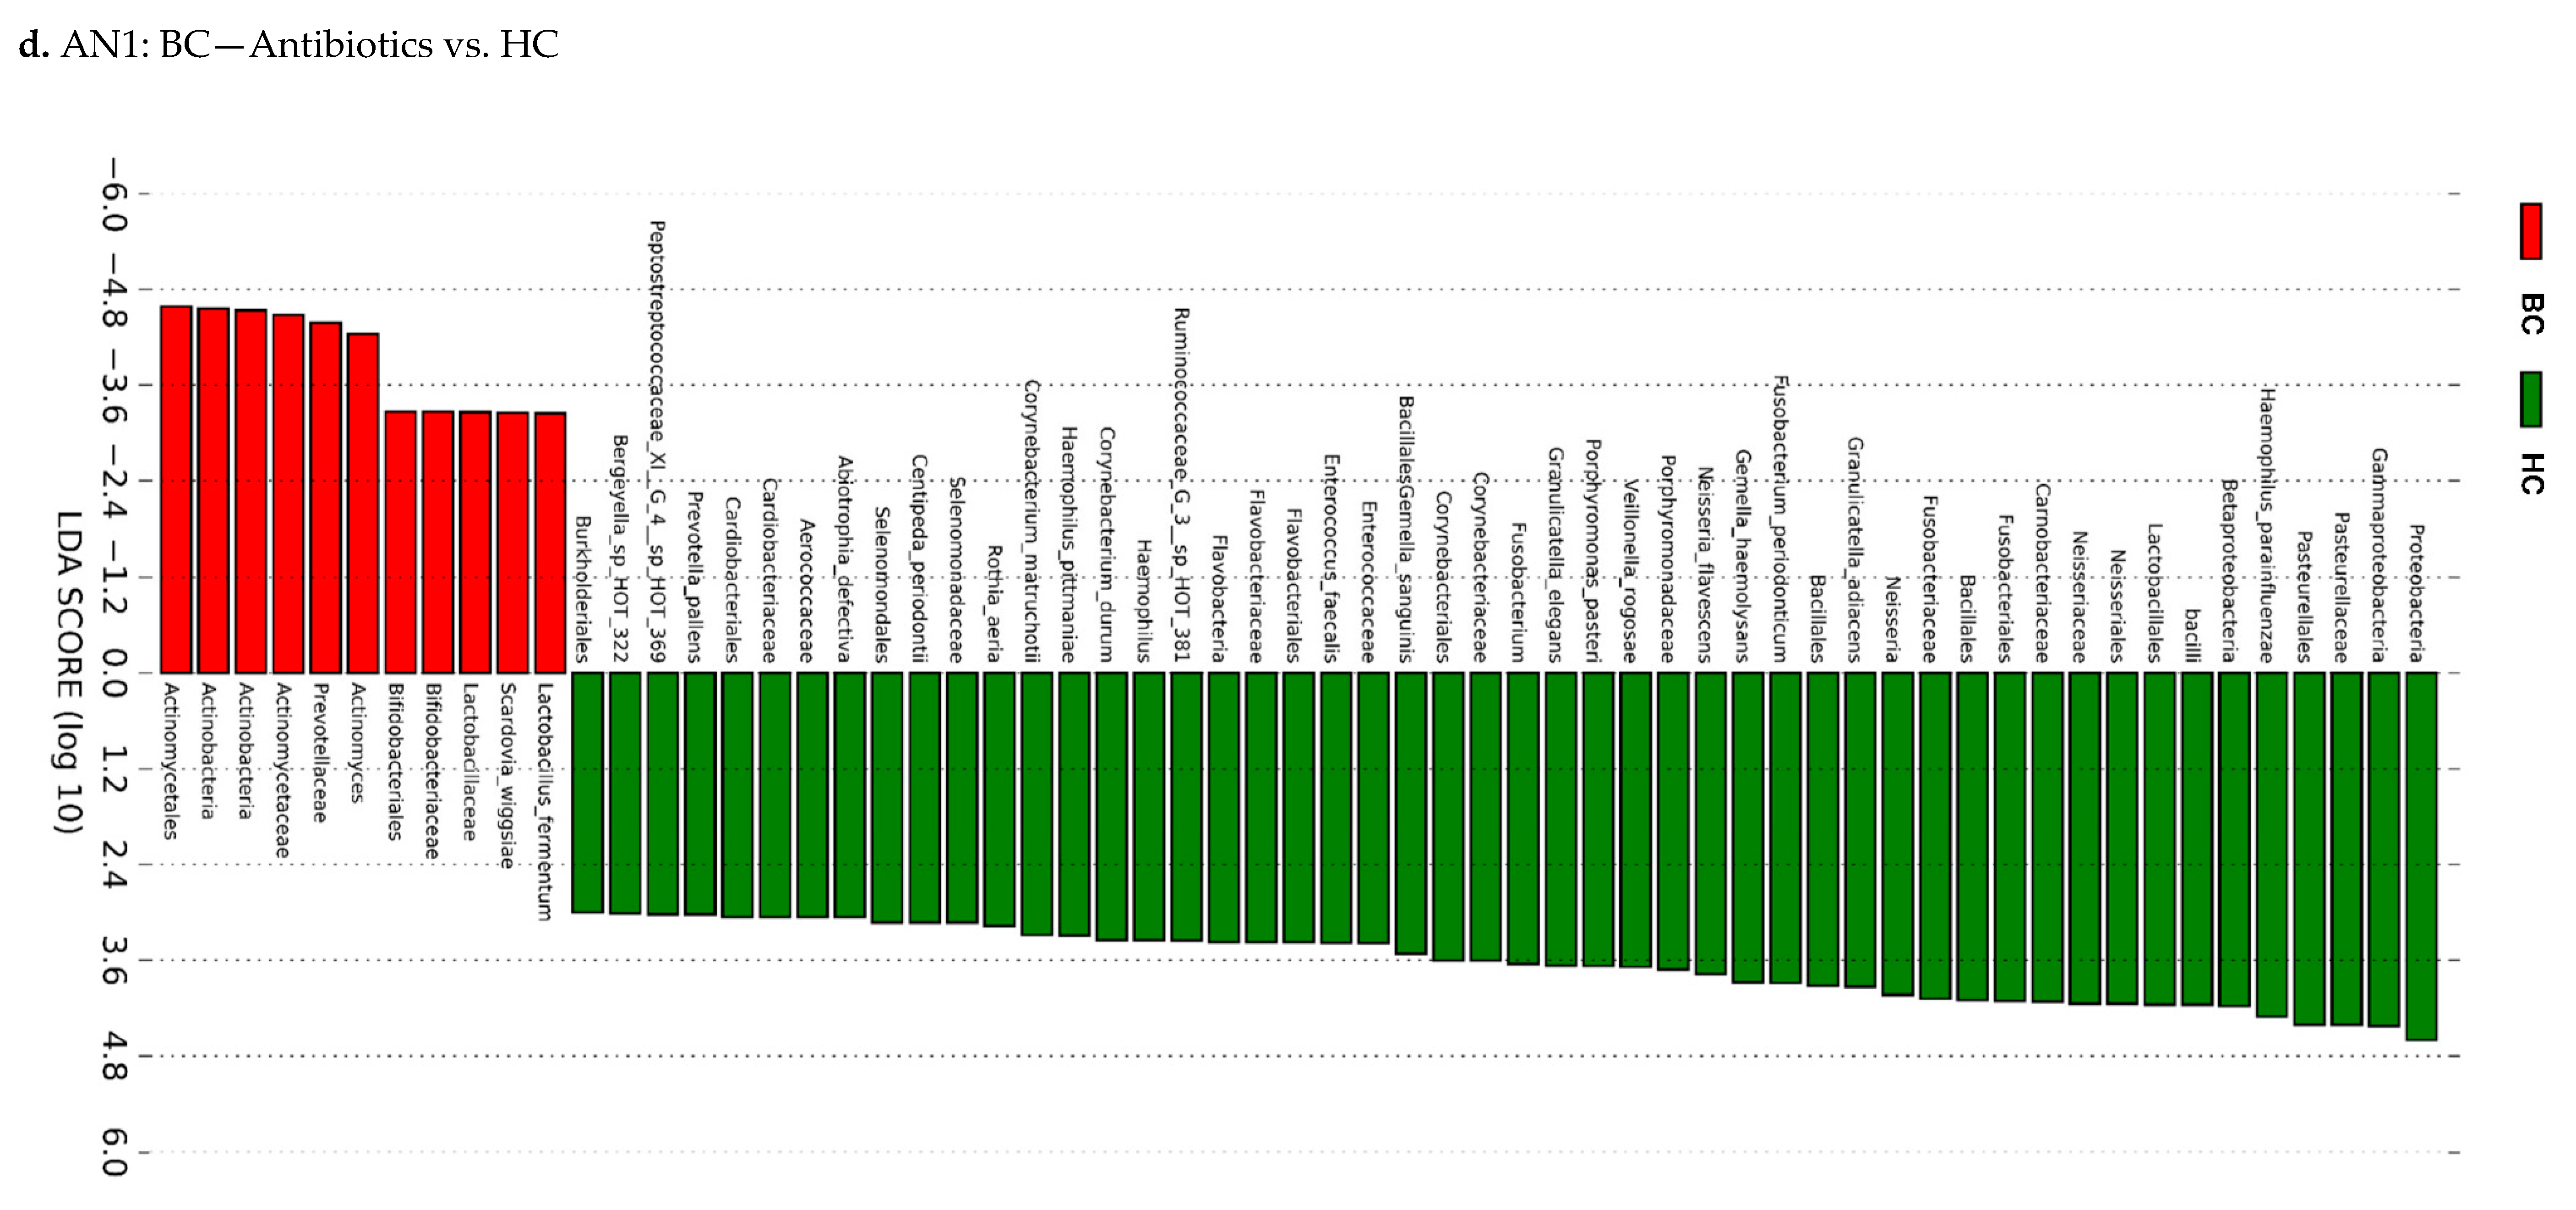
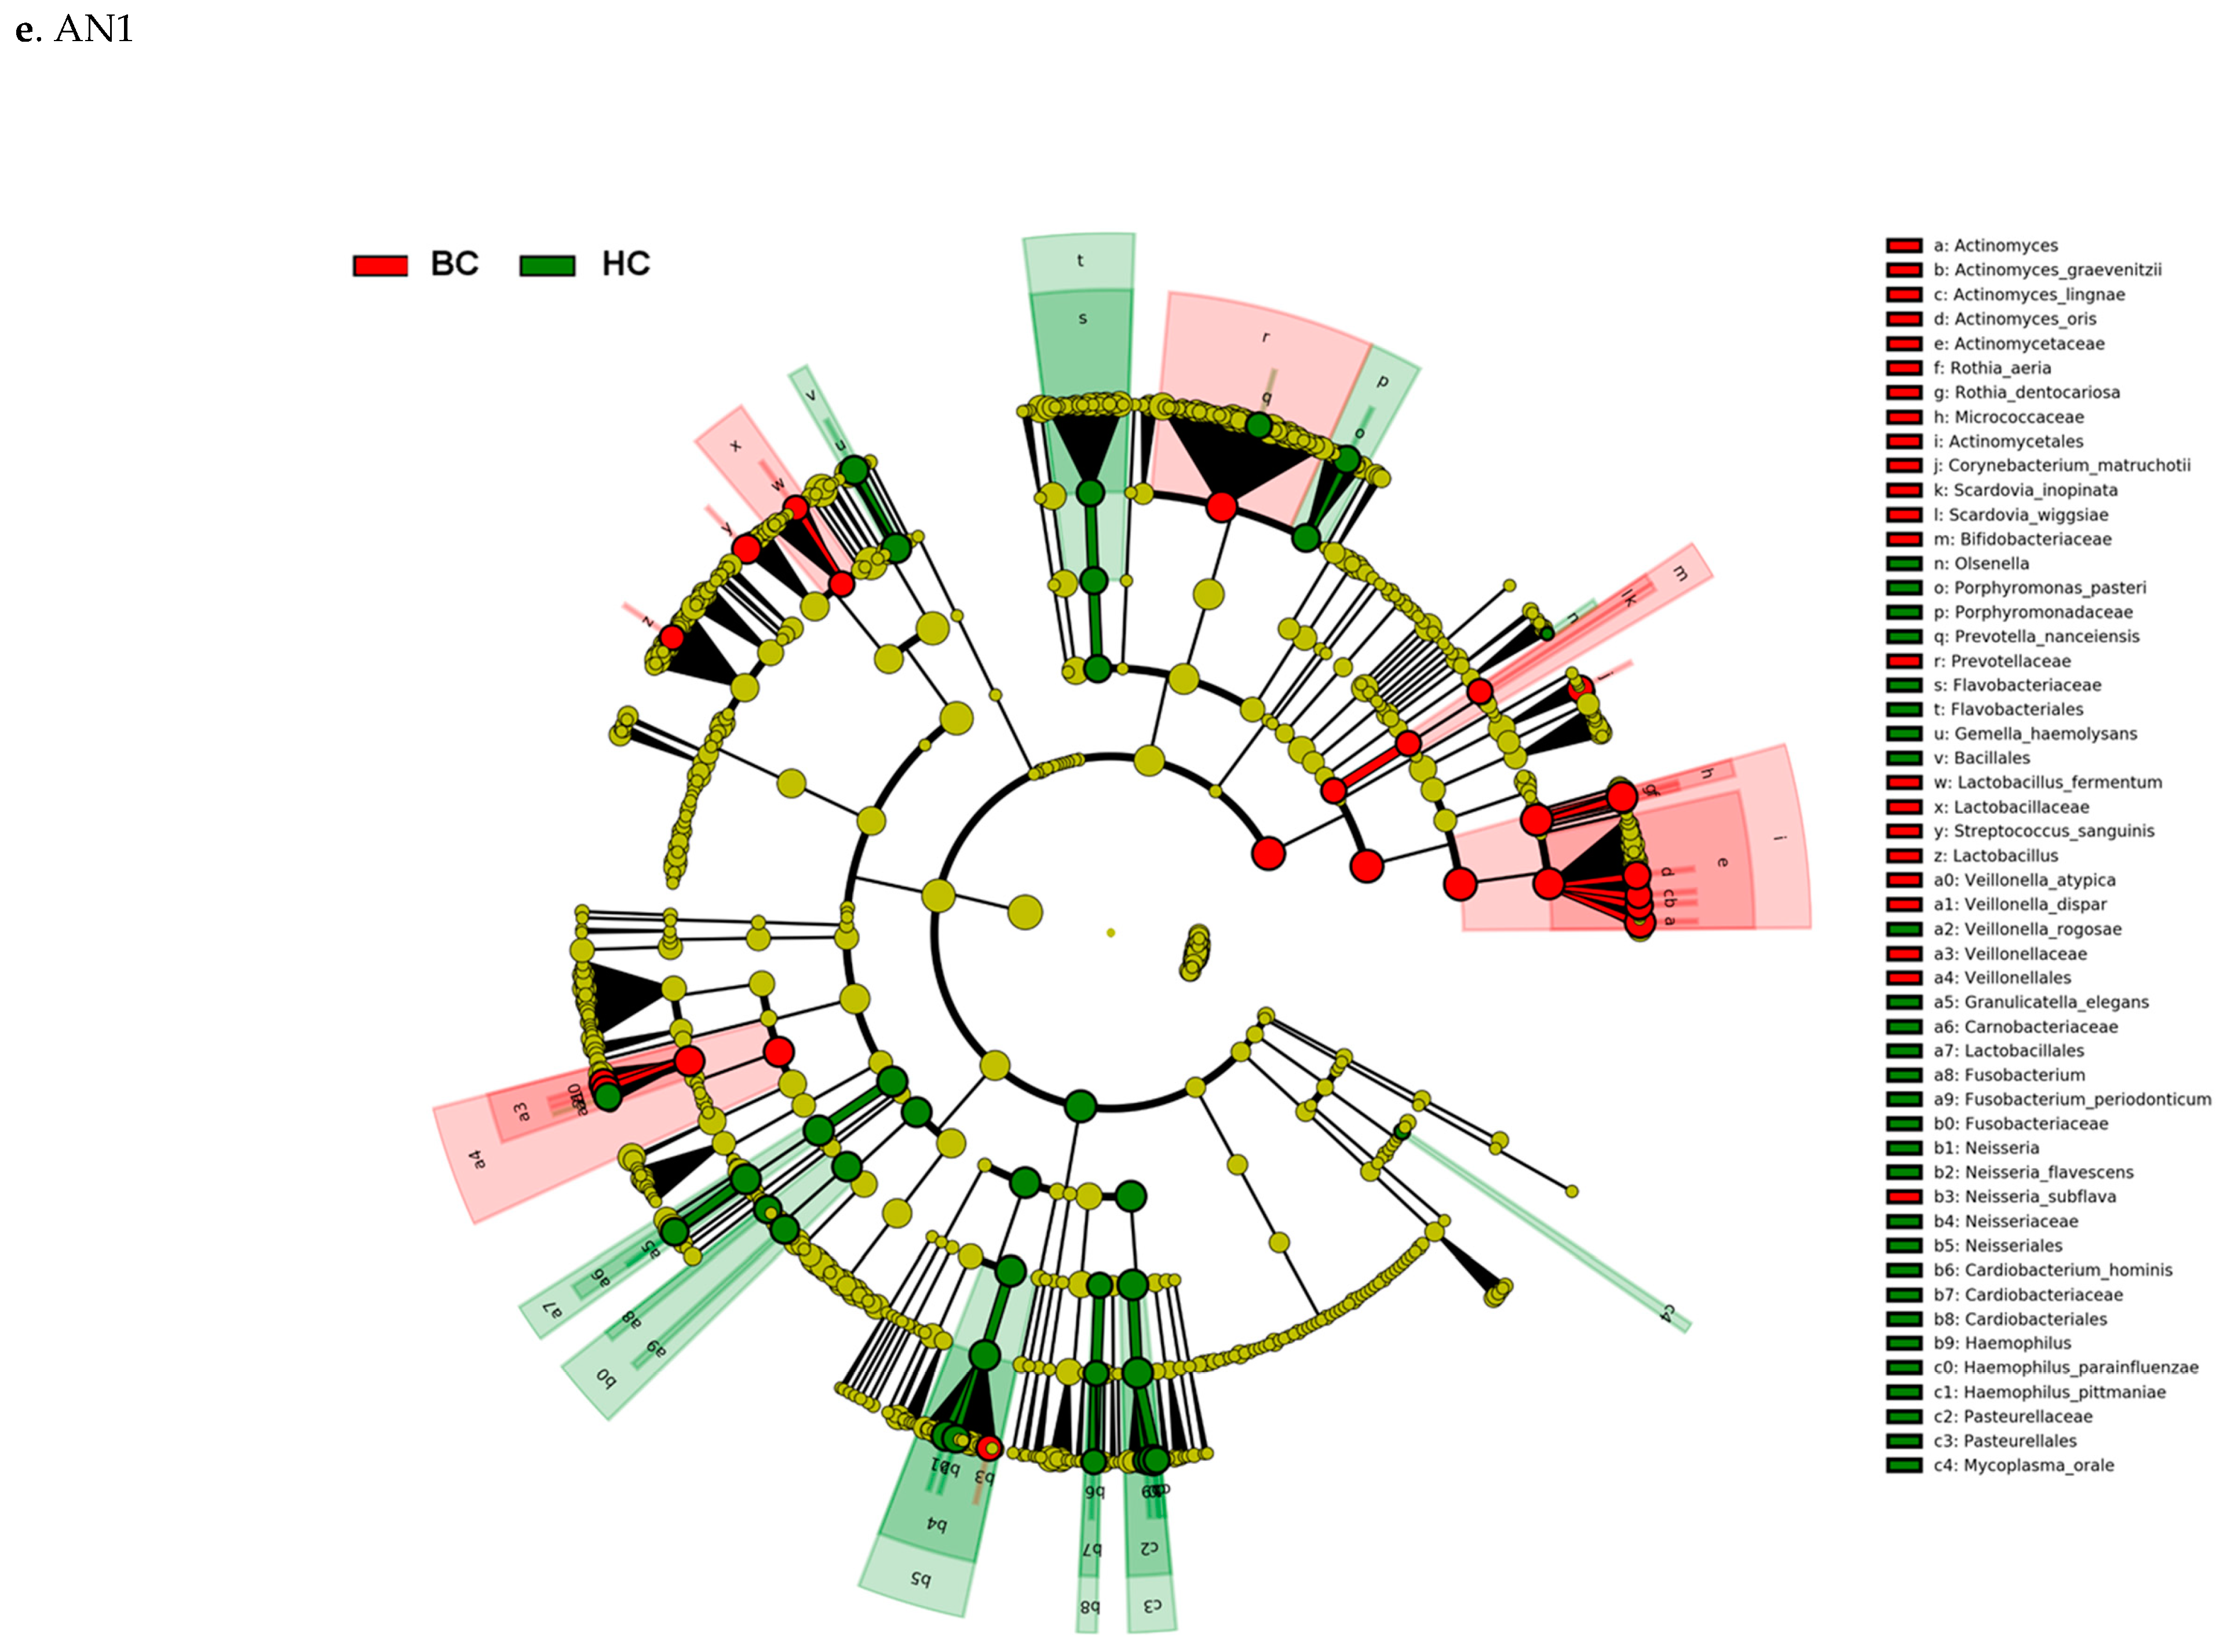
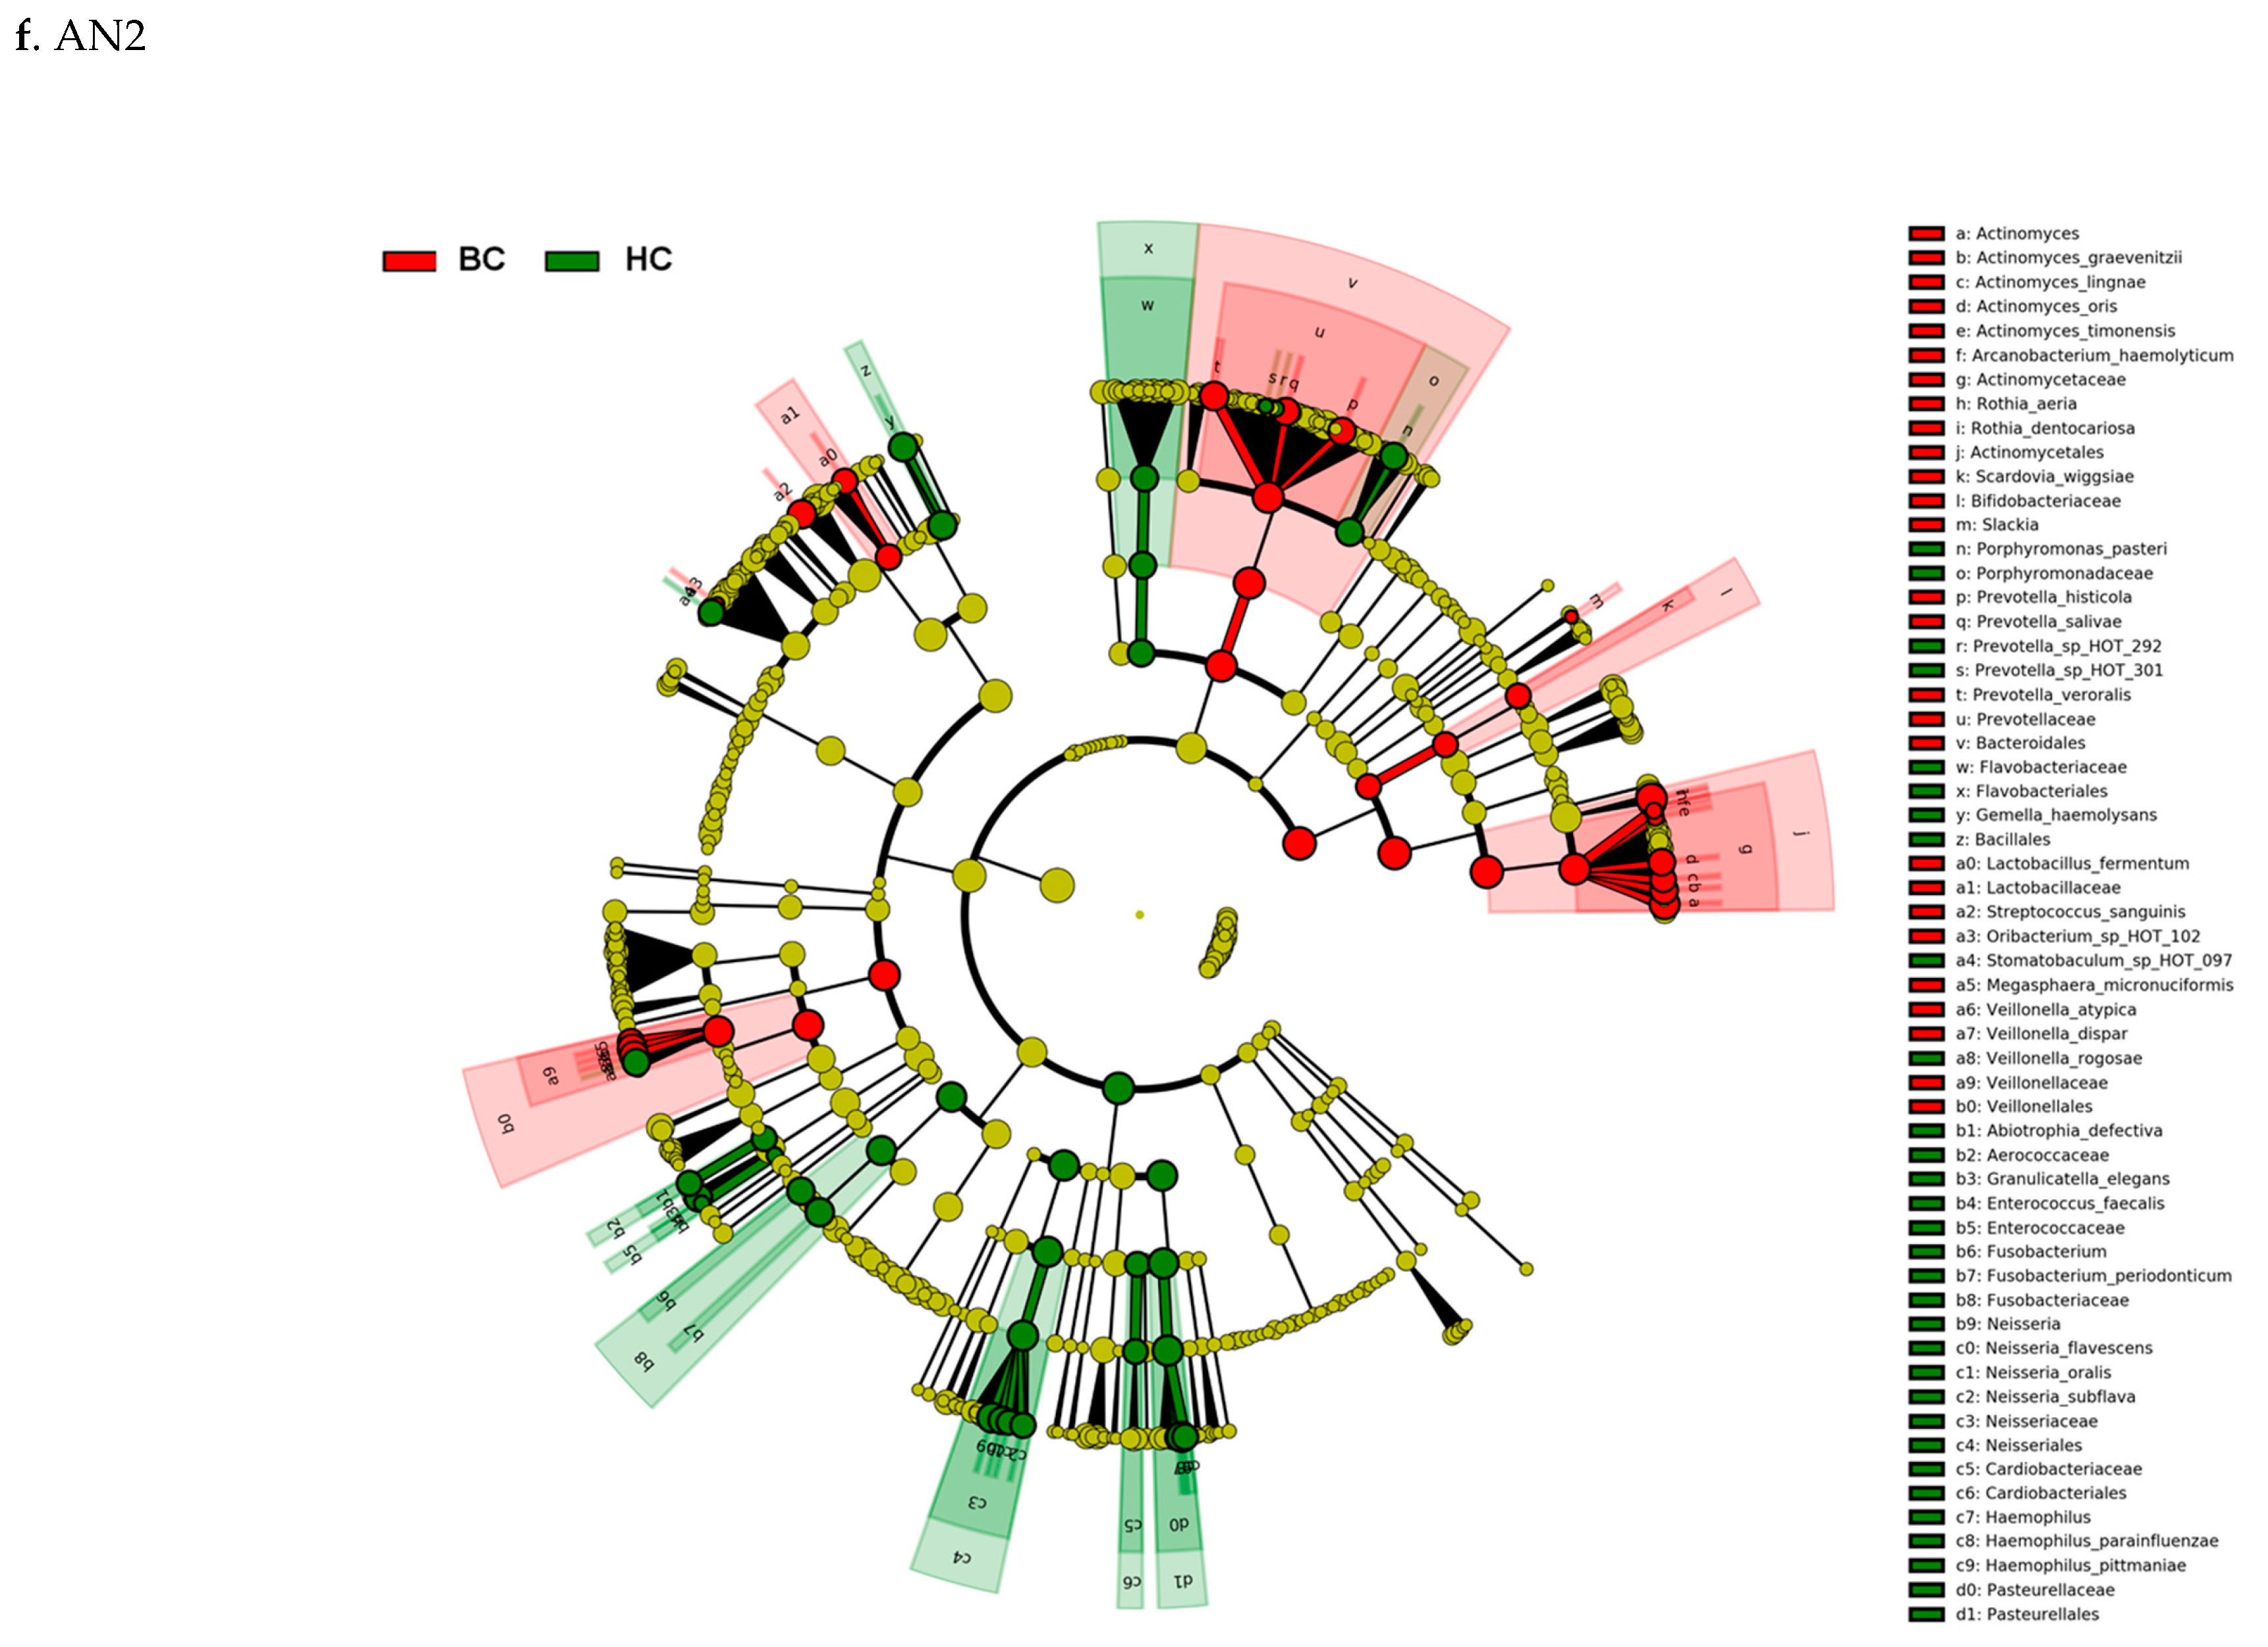
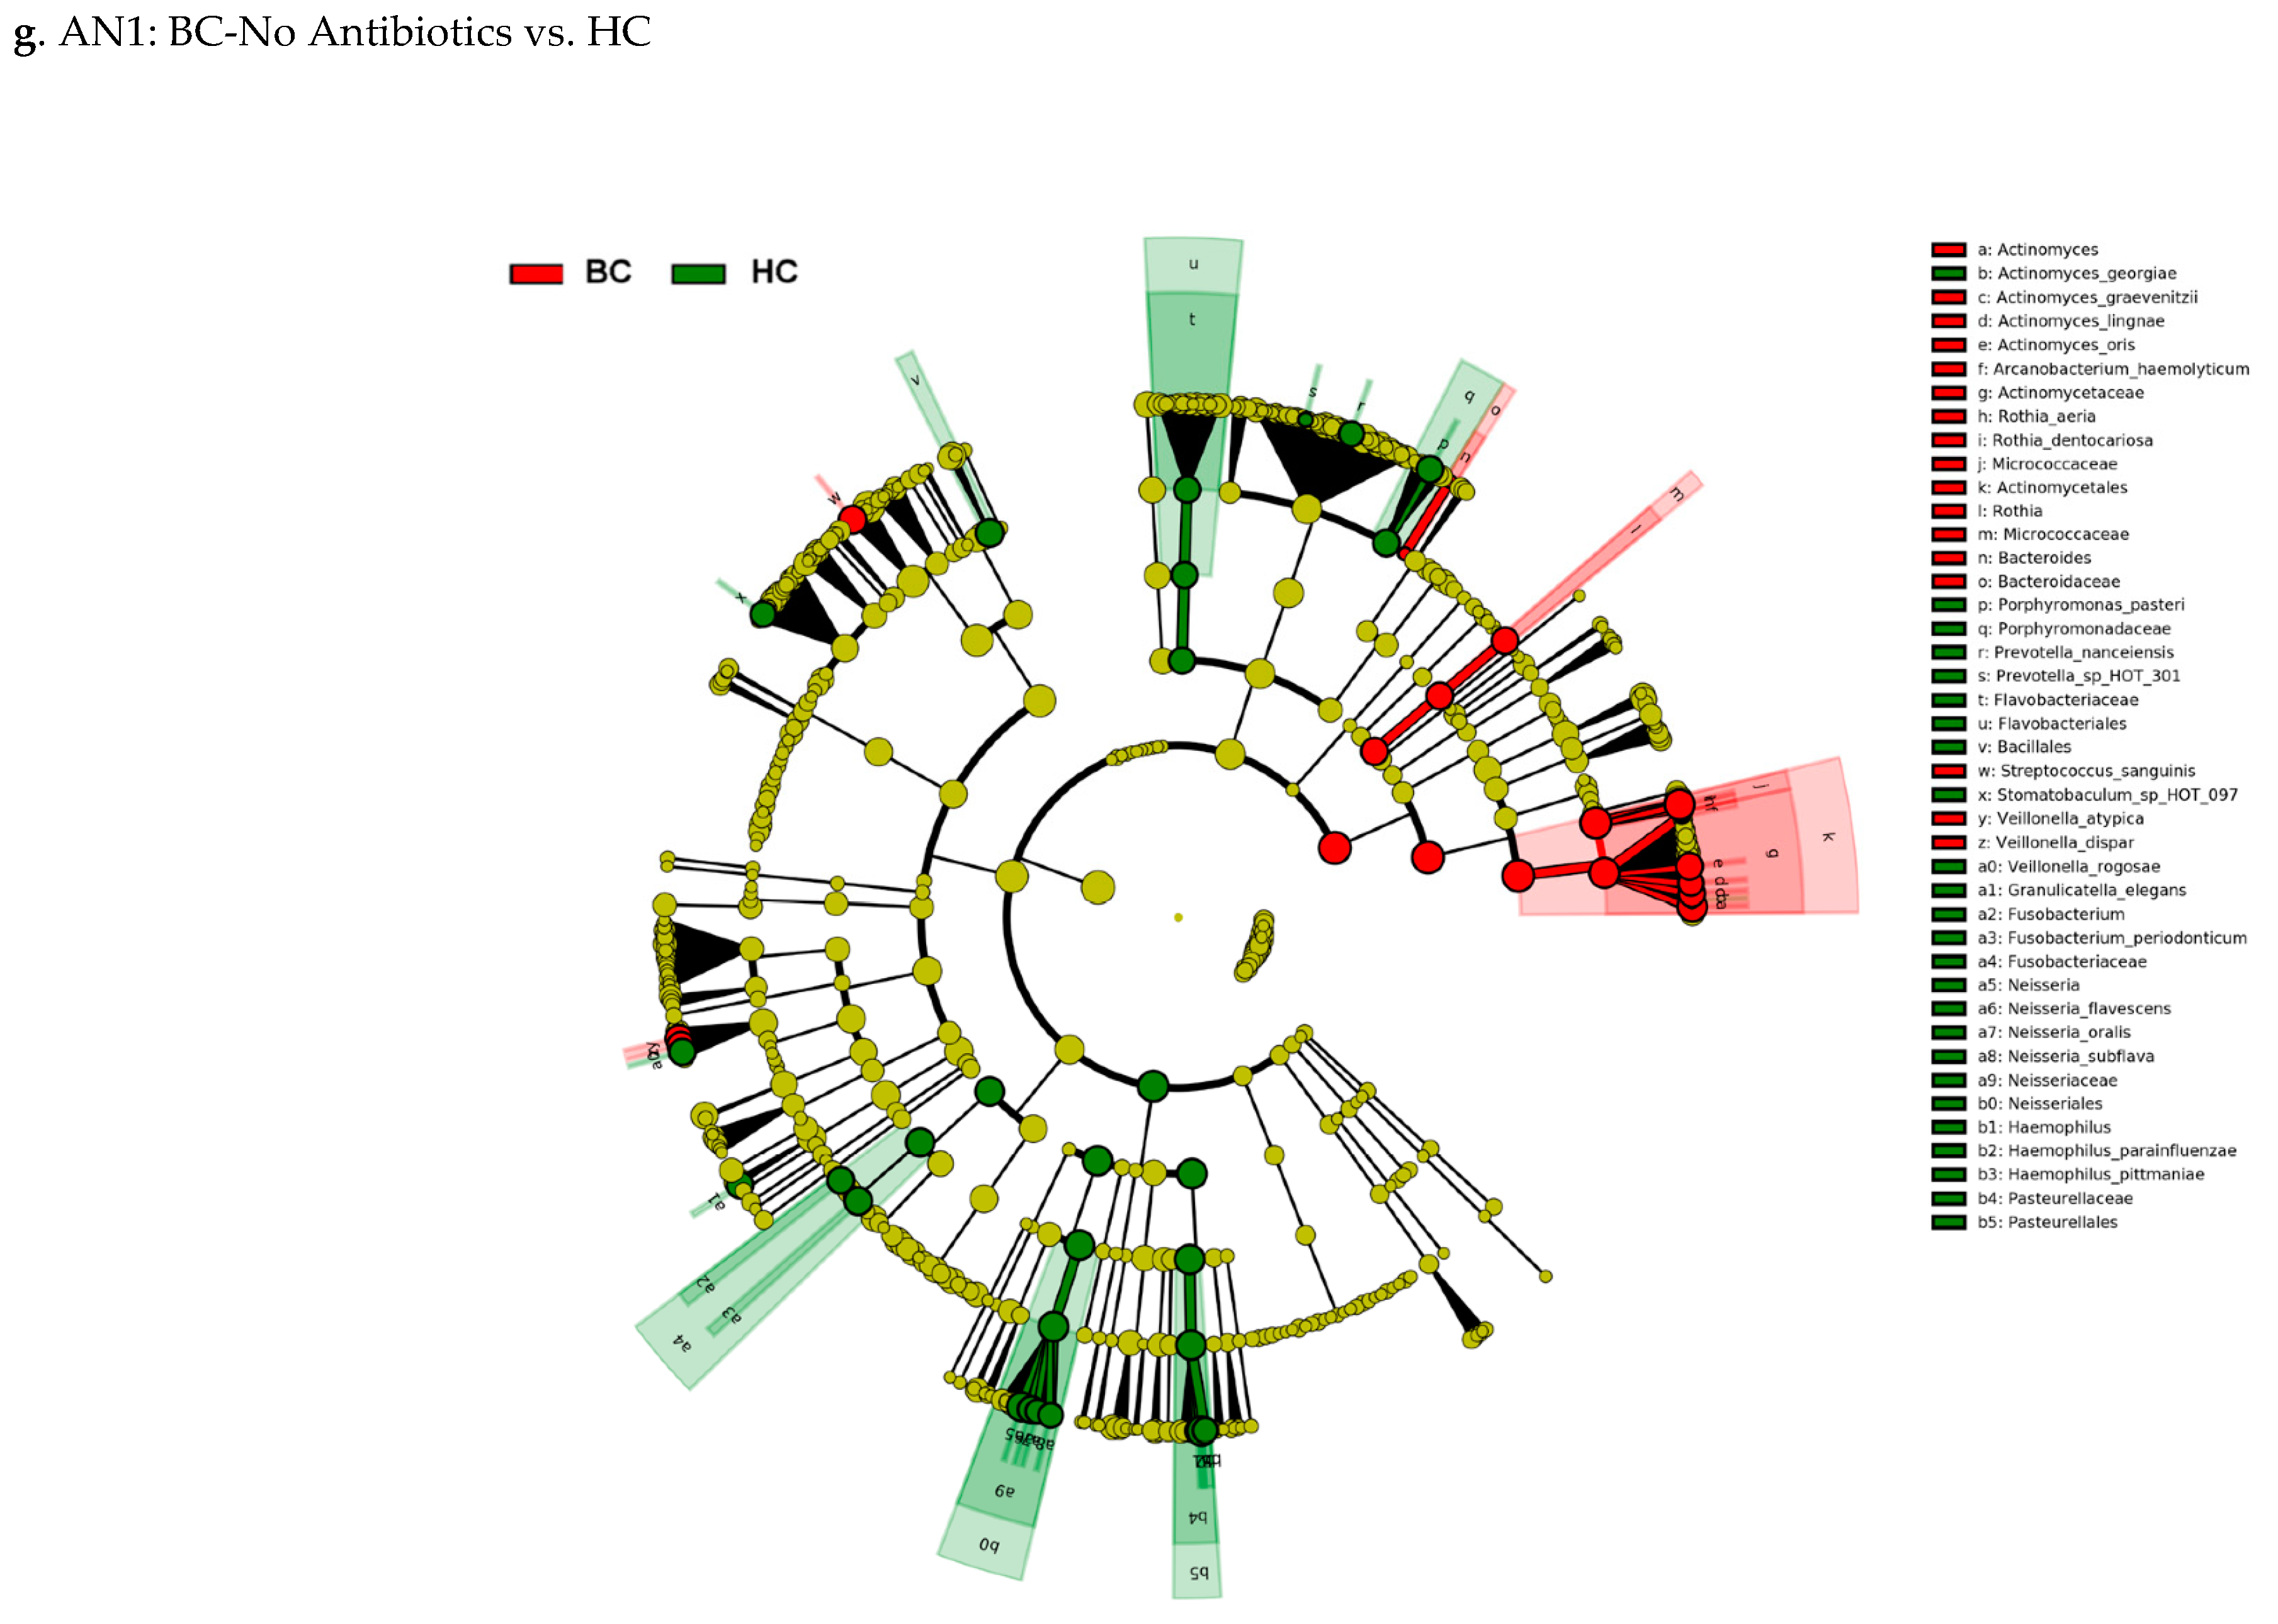
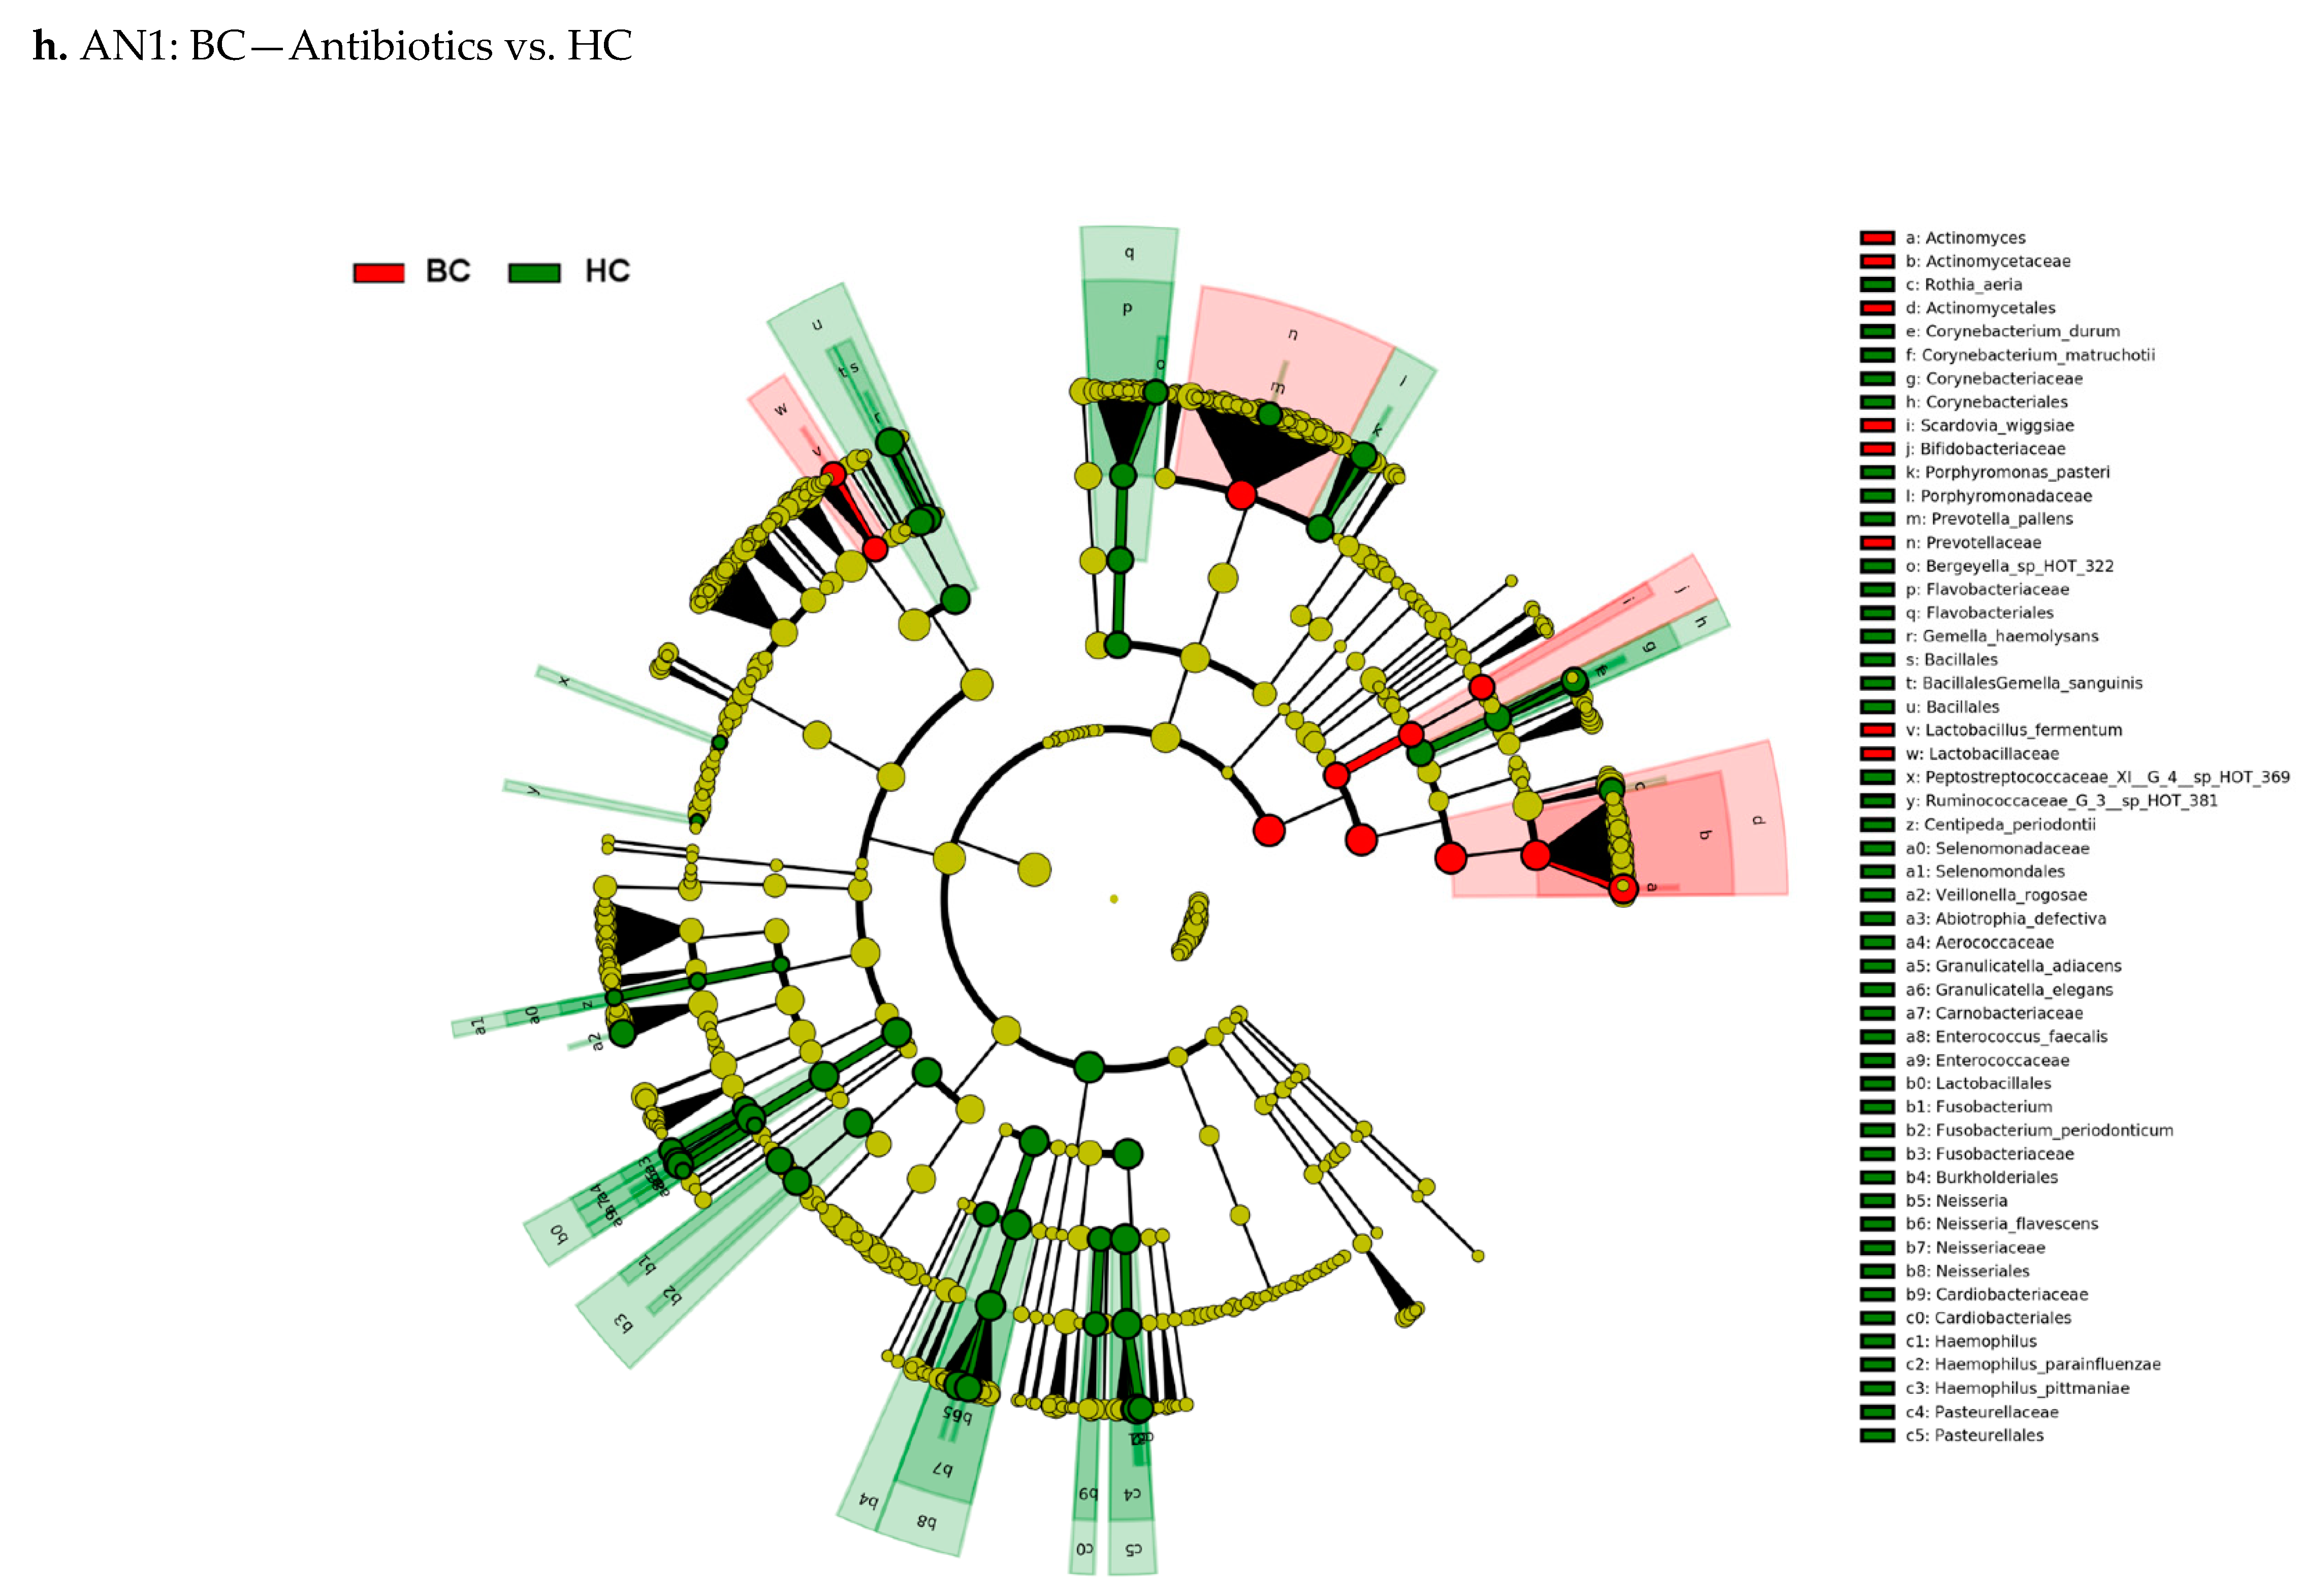
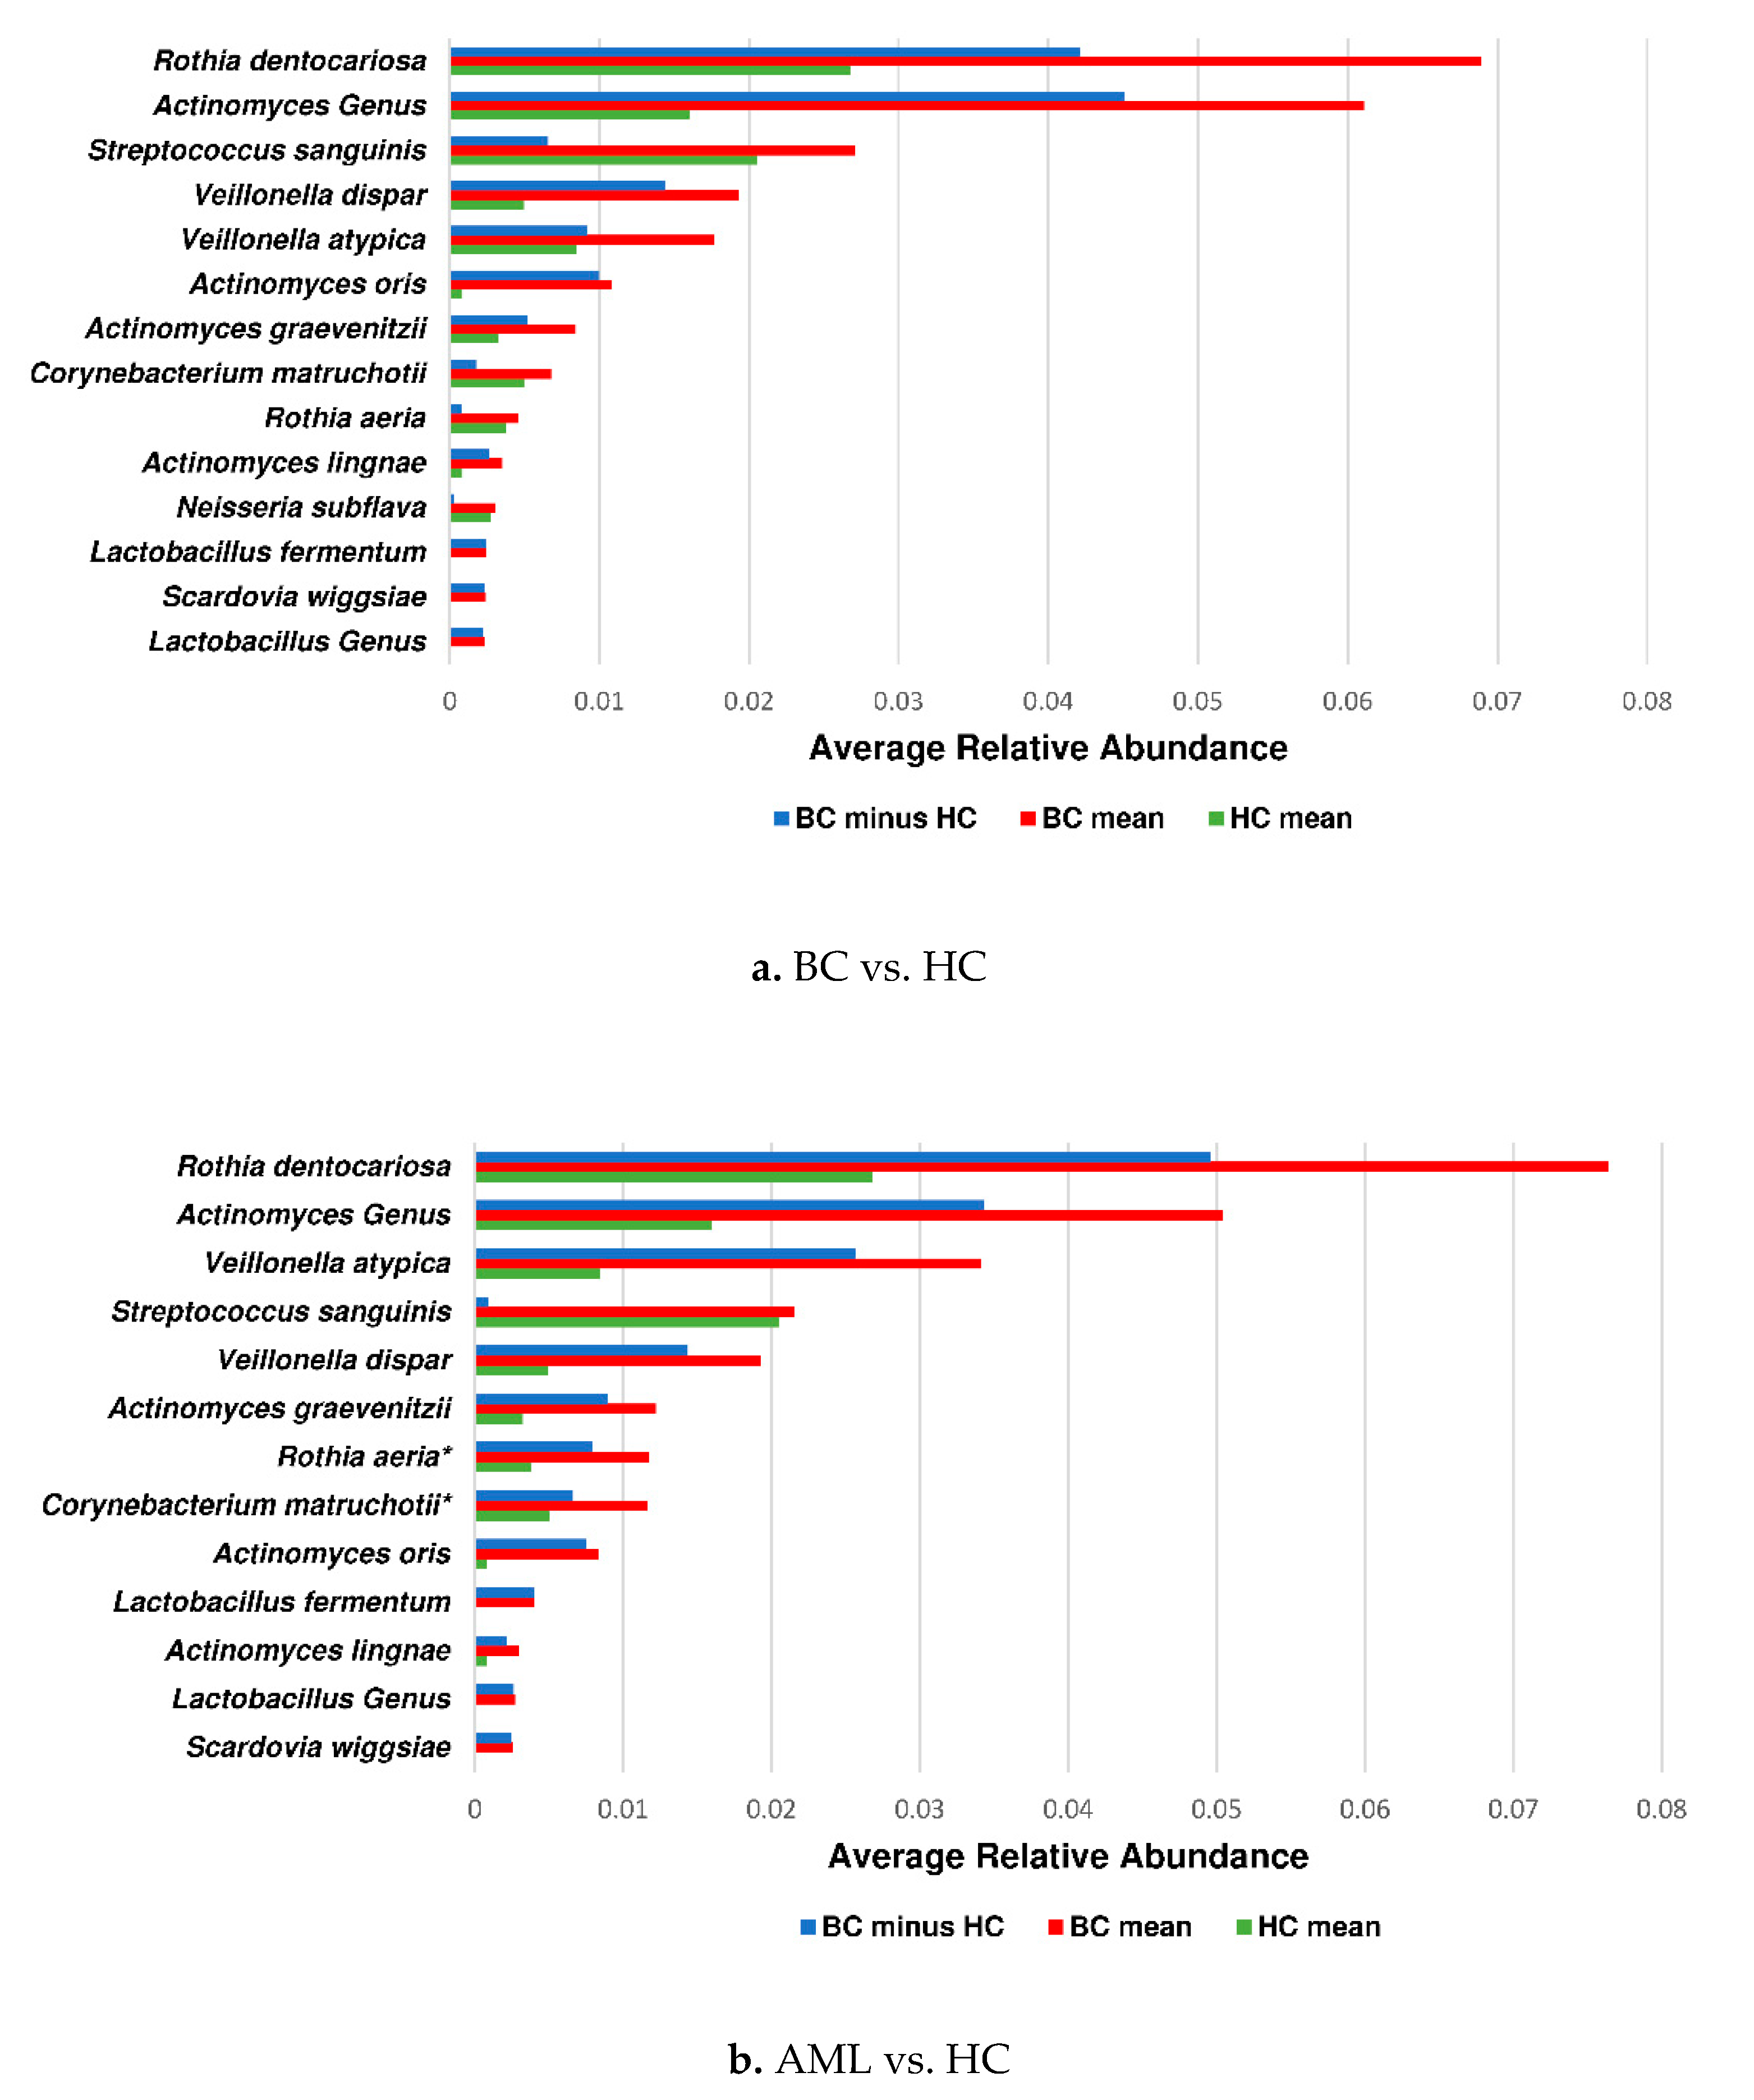
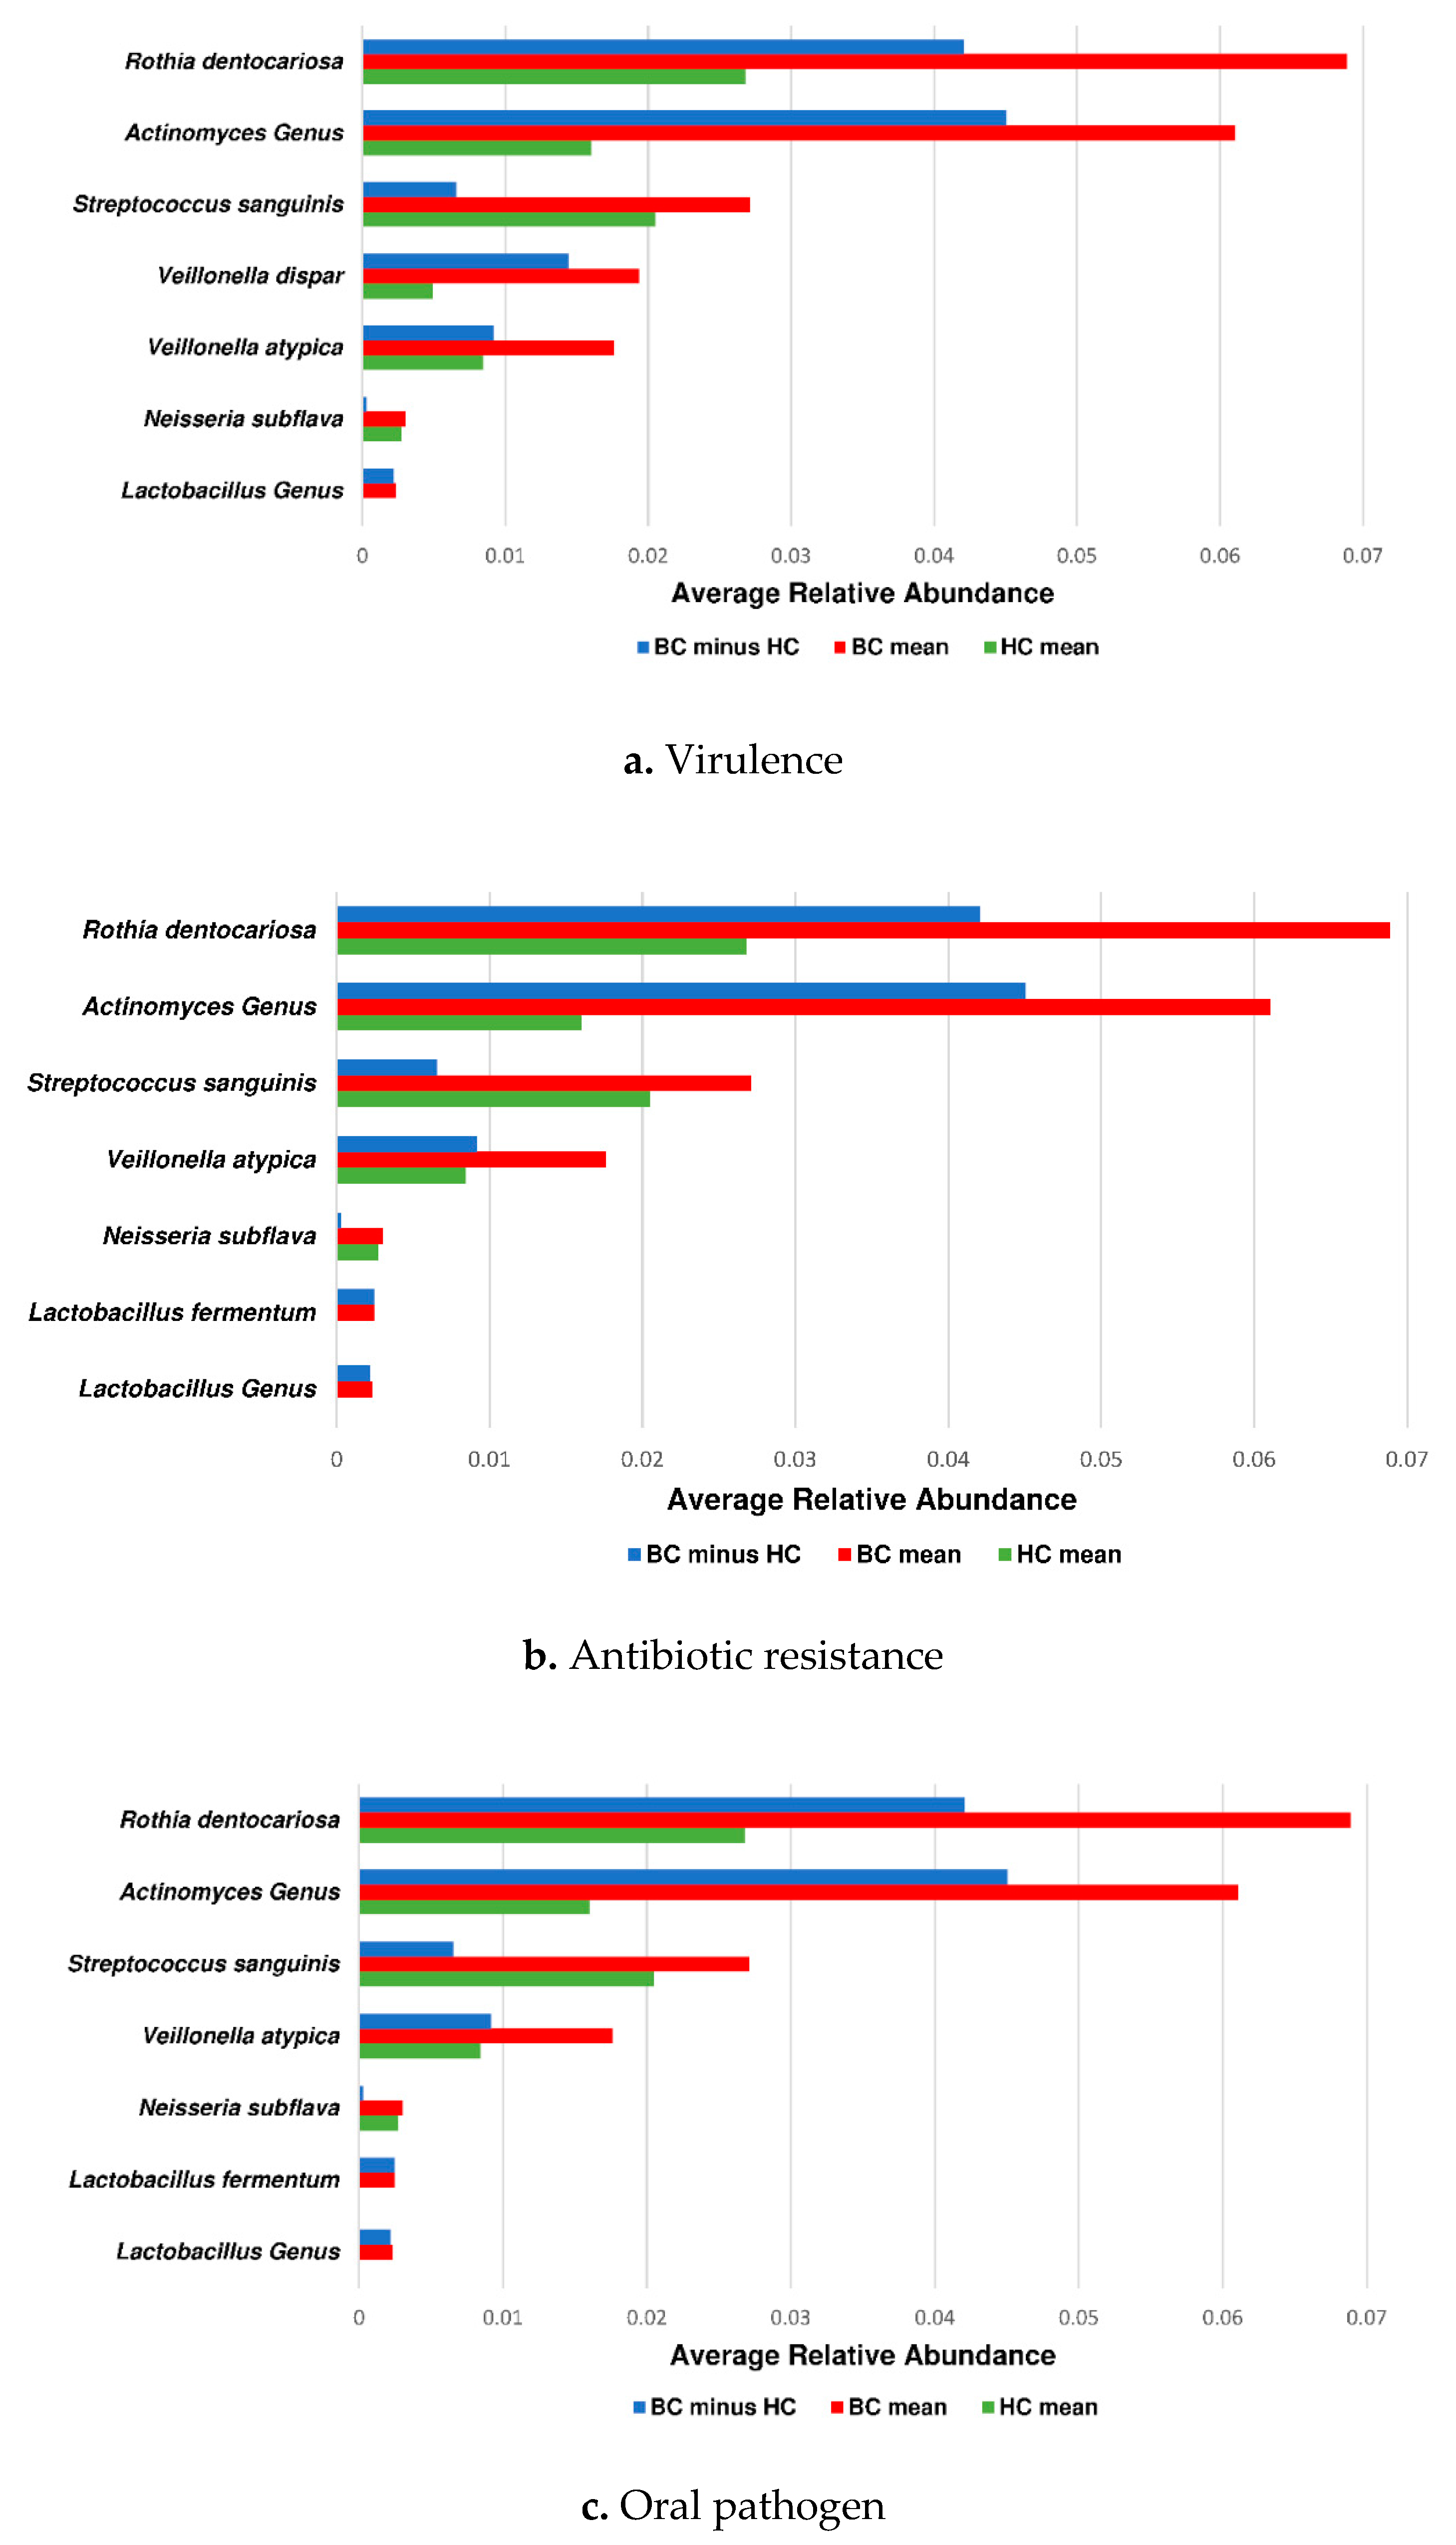
3.3. Actinomyces Genus and Rothia Dentocariosa Account for a Large Difference between the BC and HC Groups

Determination of microbial species that may influence the difference in beta-diversity among the two groups through LEfSe analysis identified 13 species and 2 genera differentiating hematological cancer patients from healthy controls (AN1) using the PST cumulative sample site combination. The most differential features for all sample site combinations considered for the BC group were Actinomyces genus, Rothia dentocariosa, and Veillonella atypica. LDA scores ranged from −4.8 to 4.8 for the BC and HC groups, respectively (Figure 3a). Further analysis indicated 17 species and 2 genera differentiating AML patients from healthy controls (AN2; Figure 3b). Subanalysis to show the consistency of previous AN1 results, regardless of antibiotic use, showed that Actinomyces genus and Rothia dentocariosa were top differentiating features for BC pts that did not receive antibiotics (Figure 3c). Additionally, Actinomyces genus remained the top genus-level differentiating feature in patients that had received antibiotics (Figure 3d). When diagnoses with very small sample sizes were removed from the PST cumulative sample site combination (leaving AML, LYM, and MM pts), Actinomyces remained the top genus-level differentiating feature of BC pts compared to HC. Furthermore, Actinomyces and Rothia dentocariosa were top features for the PST noncumulative sample site combination when only AML, LYM, and MM were used for comparison. LDA scores ranged from −4.8 to 4.8. Cladograms of AN1, AN1 subanalysis, and AN2 are shown in Figure 3e–h, illustrating taxa grouping representation for all BC subgroups.
We cumulated PST abundance data for the LEFSe features found significant in PST cumulative data to determine total “oral microbiome” relative abundances. Cumulative relative abundance data of LEFSe significant taxa for cumulative PST sample site data in AN1 and AN2 are illustrated in Figure 4a,b (AN1, AN2).
Furthermore, Rothia spp. and Actinomyces spp. accounted for large differences in cumulative relative abundance between the BC and HC groups in the PST sample site combination (Figure 4). A significant increase in relative abundance per oral sites P, S, and T in the BC group and the AML subgroup vs. the HC group was consistently observed for the Actinomyces genus (Figure S1a (AN1) and Figure S1b (AN2)).
No LEfSe-identified species were found to be at a lower relative abundance in the BC group compared to the HC group (AN1). Higher relative abundance was observed for Rothia dentocariosa, Actinomyces genus, and Streptococcus sanguinis (p < 0.05; Figure 4a). The AML subgroup in AN2 included lower relative abundance for the species Neisseria subflava and higher abundance differences for Rothia dentocariosa and Actinomyces genus (p < 0.05; Figure 4b).
Identification of significant differential features that may be involved in the changing microbial composition of BC pts was compared to HC warranted investigation of taxonomic profiles that may be related to pathogenicity concepts. Online program PATRICv3.6.7 showed that both Rothia dentocariosa and Actinomyces genus, differentiating the BC group from the HC group, had over 90% identity with virulent factor genes and 100% identity with antibiotic resistance genes. In total, seven taxa had genes at least 90% identical to virulent factor genes, seven taxa had genes 100% identical to antibiotic-resistant genes, and eleven taxa were identified as opportunistic pathogens (Table 3). PST-cumulative RA charts show the species/genus abundance found significant per LEfSe analysis in the comparison of the BC group vs. the HC group, regarding pathogenicity concepts (Figure 5).

4. Discussion

This is the largest study that has compared oral microbiome profiles of a variety of hematological cancers with those of healthy individuals by using oral samples, including saliva samples and buccal mucosa, superficial supragingival plaque, and tongue swabs, in a multivariate analysis. In agreement with Hu et al. [10], among the most prevalent genera in the oral cavities of our healthy control subjects were Prevotella, Neisseria, Streptococcus, Haemophilus, and Fusobacterium. In blood cancer patients, we also noted a significant decrease in Haemophilus parainfluenzae, a distinctive feature of healthy controls per LEfSe analysis (Figure 3). This species includes strains that are strong biofilm producers that are able to protect mucosal surfaces [17,22,23].
There were significant differences in the oral microbiome profile of hematological cancer patients (BC pts) regarding both alpha and beta-diversity when compared to HCs.
LEfSe analysis indicated there were 13 species and 2 genera differentiating BC pts from HCs. The most prominent of the differential features were Actinomyces genus, Rothia dentocariosa, and Veillonella dispar. The Actinomyces genus was present regardless of antibiotic use among the BC group as a differential feature, rejecting the possibility that antibiotic use alone accounts for the change in the microbial composition of BC pts compared to HCs. Furthermore, we identified 17 species and 2 genera differentiating AML pts from HCs. Rothia dentocariosa and Actinomyces were the most prevalent differentiating feature (log LDA below −4.0) for both AN1 and AN2 comparisons. Distinct clustering was achieved between the BC group/AML subgroup and the HC group in both AN1 and AN2 comparisons (Figure 2). As anticipated, AB treatment of AML patients moved the clustering of the oral samples further apart from the HC group. Actinomyces genus was the largest differential feature for the BC group/AML subgroup compared to healthy controls (Figure 3e–h).
In addition, relative abundance data comparison showed a significant increase of Rothia dentocariosa and Actinomyces genus in hematological cancer patients compared to healthy control subjects. The abundance of these species increased particularly in plaque and tongue samples (Figure S1). For the PST site combination with cumulative relative abundance, the increase was observed for AML (10/11 pts above HC mean), LYM (7/8 pts above HC mean), MM (4/4 pts above HC mean), ALL (3/3 pts above HC mean), but not for MDS (1 pt). Additionally, CML (1 pt) and MF (1 pt) showed an increase of Actinomyces but a decrease in Rothia dentocariosa. This overall increase in Actinomyces spp. in the BC group was independent of strong antibiotic treatment effects (since the mean relative abundances differed similarly with the HC group) and was most likely not significantly associated with secondary variables such as gender/ethnicity. For Actinomyces (per genus probe), the PST cumulated mean relative abundance percentage was 0.016 for the HC group, 0.066 for the non-AB BC group, and 0.056 for the AB BC group (p < 0.01; BC groups vs. HCs, Mann–Whitney U-test).
Actinomyces genus corresponds to filamentous, nonspore-forming, Gram-positive bacilli, consisting of mostly facultative anaerobic species, including opportunistic pathogens (e.g., strictly anaerobe Actinomyces israelli, facultative anaerobe A. gerencseriae) most well-known for causing oral, thoracic, and intra-abdominal abscesses on rare occasions [24]. In addition, Actinomyces infection, known as actinomycosis, was previously reported to mimic malignancy symptoms, in particular lymphoma [25,26], whereas Rothia dentocariosa was historically confounded with Actinomyces spp. in selective growth conditions [27]. Ames et al. have also described an increase in the species Rothia dentocariosa in the oral cavity of cancer patients after allogeneic transplants, although overall microbial composition was consistent and cancer types were not described [16]. These results support the notion that in the presence of hematological cancer, there may be host factors capable of favoring lymphoma development systemically as well as Actinomyces colonization in the oral cavity. Our findings, therefore, raise the question as to whether Actinomyces spp. interact with the host in a manner that, in fact, would contribute to lymphoma (or other hematological cancer) progression or if BC contributes to an overall dysbiosis of the oral microbiome, leading to the progression of cancer. As multiple studies have suggested, it is likely that dysbiosis contributes to the development of cancer [28,29,30]. Indeed, an oral transfer to gut of the Actinomyces species could potentially activate inflammatory processes, as suggested by the work of Chua et al., who showed that increased abundance in phylum Actinobacteria in the gut was associated with increased immune activation in ALL survivors experiencing chronic inflammation [12]. In this respect, Actinomyces spp., normally commensals, were previously shown to invade damaged mucosa [31], possibly in the context of reduced mucosal protection by certain Haemophilus parainfluenza strains [17,22,23], although an acute infection may not occur due to host immune response. In addition, Jian et al. have recently shown that an increase in nitrogen-recycling bacteria in the gut, such as Klebsiella and Streptococcus, contributes to the progression of multiple myeloma, and the enrichment is likely due to an increase of urea nitrogen during the progression of the disease [32]. This warrants more investigation into whether the transfer of oral species to the gut could influence the development or progression of cancer.
Finally, using PATRICv3.6.7 for the analysis of the pathogenicity concepts “antibiotic resistance”, “oral pathogen”, and “virulence”, based on LEfSe distinct oral microbiome profiles using cumulative PST data, we found that these concepts were significantly enriched in the blood cancer group (Table 3, Figure 5). The determination of potential for pathogenicity, based on oral microbiome profiles using PATRICv3.6.7, showed that 7/17 species had at least 90% identity in their association with virulence (Figure 5a), and 7/17 species had 100% identity in their association with antibiotic resistance (Figure 5b). Both genera (Actinomyces and Lactobacillus) matched with at least 90% identity regarding their association with virulent genes and 100% identity with antibiotic-resistant genes. A total of 11 species was identified as opportunistic pathogens (Figure 5c), confirming their relevance to pathogenicity enrichment in the BC group.
Our findings are nevertheless subject to limitations. Even though we found overall commonalities of biological significance, the limited sample size for most cancer subgroups did not allow the identification of distinctive subgroups features with confidence. In addition, next-generation sequencing identifies live and dead bacteria so that it is unclear the extent to which Actinomyces species detected in saliva samples and tongue swabs are active. Obtaining metatranscriptomics and full metagenome data will probably shed more light on the determination of functionally enriched bacterial activities.
In conclusion, we note significant differences in oral microbiome alpha and beta diversities when comparing hematological cancer patients to healthy controls. More research is necessary to better understand how the oral microbiome interacts with its microenvironment and the host immune system to elucidate possible mechanistic pathways potentially favoring cancer development. Moreover, it remains to be determined whether the initiation of specific systemic oral microbiome-associated molecular interactions could serve as a biomarker for diagnosis or response to treatment of hematological cancers.

Supplementary Materials

The following are available online at https://0-www-mdpi-com.brum.beds.ac.uk/2077-0383/9/12/4068/s1, Table S1: Species and genera identification for the BC and HC groups; Figure S1: Average number of taxa per subject and sample site combinations; Supplementary Data File: Raw taxa abundance data of BC and HC oral samples.

Author Contributions

Conceptualization, J.-L.C.M., F.B.M., and M.T.B.; manuscript preparation M.F.B., H.C.L., J.-L.C.M., and F.B.M.; data analysis M.F.B. and J.-L.C.M. All authors made significant contributions to writing and revisions of the main manuscript, tables, and figures. All authors have read and agreed to the published version of the manuscript.

Funding

This research received no external funding.

Acknowledgments

We would like to thank Jenene Noll and James Davis for their help with patient recruitment, collection of clinical data, and collection and transport of oral samples to the lab. We are grateful to Darla Morton for the initial steps of sample processing and Alexis Kokaras for conducting next-generation sequencing and providing the HOMINGS ProbeSeq data. We also thank Kathleen Sullivan for her excellent editorial skills. This work was supported by the Atrium Health-Carolinas Healthcare Research Fund.

Conflicts of Interest

The authors declare no conflict of interest.

References

  1. Siegel, R.L.; Miller, K.D.; Jemal, A. Cancer statistics, 2020. CA Cancer J. Clin. 2020, 70, 7–30. [Google Scholar] [CrossRef]
  2. Montagnana, M.; Lippi, G. Cancer diagnostics: Current concepts and future perspectives. Ann. Transl. Med. 2017, 5, 268. [Google Scholar] [CrossRef] [Green Version]
  3. Pucci, C.; Martinelli, C.; Ciofani, G. Innovative approaches for cancer treatment: Current perspectives and new challenges. Ecancermedicalscience 2019, 13, 961. [Google Scholar] [CrossRef]
  4. Karpinski, T.M. Role of Oral Microbiota in Cancer Development. Microorganisms 2019, 7, 20. [Google Scholar] [CrossRef] [PubMed] [Green Version]
  5. Mohammed, H.; Varoni, E.M.; Cochis, A.; Cordaro, M.; Gallenzi, P.; Patini, R.; Staderini, E.; Lajolo, C.; Rimondini, L.; Rocchetti, V. Oral Dysbiosis in Pancreatic Cancer and Liver Cirrhosis: A Review of the Literature. Biomedicines 2018, 6, 115. [Google Scholar] [CrossRef] [PubMed] [Green Version]
  6. Farrell, J.J.; Zhang, L.; Zhou, H.; Chia, D.; Elashoff, D.; Akin, D.; Paster, B.J.; Joshipura, K.; Wong, D.T. Variations of oral microbiota are associated with pancreatic diseases including pancreatic cancer. Gut 2012, 61, 582–588. [Google Scholar] [CrossRef]
  7. Mitsuhashi, K.; Nosho, K.; Sukawa, Y.; Matsunaga, Y.; Ito, M.; Kurihara, H.; Kanno, S.; Igarashi, H.; Naito, T.; Adachi, Y.; et al. Association of Fusobacterium species in pancreatic cancer tissues with molecular features and prognosis. Oncotarget 2015, 6, 7209–7220. [Google Scholar] [CrossRef] [Green Version]
  8. Brennan, C.A.; Garrett, W.S. Fusobacterium nucleatum—Symbiont, opportunist and oncobacterium. Nat. Rev. Microbiol. 2019, 17, 156–166. [Google Scholar] [CrossRef]
  9. Klimesova, K.; Jiraskova Zakostelska, Z.; Tlaskalova-Hogenova, H. Oral Bacterial and Fungal Microbiome Impacts Colorectal Carcinogenesis. Front. Microbiol. 2018, 9, 774. [Google Scholar] [CrossRef]
  10. Hu, J.; Han, S.; Chen, Y.; Ji, Z. Variations of Tongue Coating Microbiota in Patients with Gastric Cancer. Biomed. Res. Int. 2015, 2015, 173729. [Google Scholar] [CrossRef] [Green Version]
  11. Chen, X.; Winckler, B.; Lu, M.; Cheng, H.; Yuan, Z.; Yang, Y.; Jin, L.; Ye, W. Oral Microbiota and Risk for Esophageal Squamous Cell Carcinoma in a High-Risk Area of China. PLoS ONE 2015, 10, e0143603. [Google Scholar] [CrossRef] [PubMed]
  12. Chua, L.L.; Rajasuriar, R.; Azanan, M.S.; Abdullah, N.K.; Tang, M.S.; Lee, S.C.; Woo, Y.L.; Lim, Y.A.; Ariffin, H.; Loke, P. Reduced microbial diversity in adult survivors of childhood acute lymphoblastic leukemia and microbial associations with increased immune activation. Microbiome 2017, 5, 35. [Google Scholar] [CrossRef] [PubMed] [Green Version]
  13. Wang, Y.; Xue, J.; Zhou, X.; You, M.; Du, Q.; Yang, X.; He, J.; Zou, J.; Cheng, L.; Li, M.; et al. Oral microbiota distinguishes acute lymphoblastic leukemia pediatric hosts from healthy populations. PLoS ONE 2014, 9, e102116. [Google Scholar] [CrossRef] [PubMed] [Green Version]
  14. Gao, X.; Miao, R.; Zhu, Y.; Lin, C.; Yang, X.; Jia, R.; Linghan, K.; Wan, C.; Deng, J. A new insight into acute lymphoblastic leukemia in children: Influences of changed intestinal microfloras. BMC Pediatr. 2020, 20, 290. [Google Scholar] [CrossRef]
  15. Galloway-Pena, J.R.; Smith, D.P.; Sahasrabhojane, P.; Wadsworth, W.D.; Fellman, B.M.; Ajami, N.J.; Shpall, E.J.; Daver, N.; Guindani, M.; Petrosino, J.F.; et al. Characterization of oral and gut microbiome temporal variability in hospitalized cancer patients. Genome Med. 2017, 9, 21. [Google Scholar] [CrossRef] [Green Version]
  16. Ames, N.J.; Sulima, P.; Ngo, T.; Barb, J.; Munson, P.J.; Paster, B.J.; Hart, T.C. A characterization of the oral microbiome in allogeneic stem cell transplant patients. PLoS ONE 2012, 7, e47628. [Google Scholar] [CrossRef]
  17. Mougeot, J.C.; Beckman, M.F.; Stevens, C.B.; Almon, K.G.; Morton, D.S.; Von Bultzingslowen, I.; Brennan, M.T.; Mougeot, F.B. Lasting Gammaproteobacteria profile changes characterized hematological cancer patients who developed oral mucositis following conditioning therapy. J. Oral Microbiol. 2020, 12, 1761135. [Google Scholar] [CrossRef]
  18. Caporaso, J.G.; Lauber, C.L.; Walters, W.A.; Berg-Lyons, D.; Lozupone, C.A.; Turnbaugh, P.J.; Fierer, N.; Knight, R. Global patterns of 16S rRNA diversity at a depth of millions of sequences per sample. Proc. Natl. Acad. Sci. USA 2011, 108 (Suppl. 1), 4516–4522. [Google Scholar] [CrossRef] [Green Version]
  19. Afgan, E.; Baker, D.; Batut, B.; van den Beek, M.; Bouvier, D.; Cech, M.; Chilton, J.; Clements, D.; Coraor, N.; Gruning, B.A.; et al. The Galaxy platform for accessible, reproducible and collaborative biomedical analyses: 2018 update. Nucleic Acids Res. 2018, 46, W537–W544. [Google Scholar] [CrossRef] [Green Version]
  20. Segata, N.; Izard, J.; Waldron, L.; Gevers, D.; Miropolsky, L.; Garrett, W.S.; Huttenhower, C. Metagenomic biomarker discovery and explanation. Genome Biol. 2011, 12, R60. [Google Scholar] [CrossRef] [Green Version]
  21. Davis, J.J.; Wattam, A.R.; Aziz, R.K.; Brettin, T.; Butler, R.; Butler, R.M.; Chlenski, P.; Conrad, N.; Dickerman, A.; Dietrich, E.M.; et al. The PATRIC Bioinformatics Resource Center: Expanding data and analysis capabilities. Nucleic Acids Res. 2020, 48, D606–D612. [Google Scholar] [CrossRef] [PubMed] [Green Version]
  22. Kosikowska, U.; Rybojad, P.; Stepien-Pysniak, D.; Zbikowska, A.; Malm, A. Changes in the prevalence and biofilm formation of Haemophilus influenzae and Haemophilus parainfluenzae from the respiratory microbiota of patients with sarcoidosis. BMC Infect. Dis. 2016, 16, 449. [Google Scholar] [CrossRef] [PubMed] [Green Version]
  23. Wang, K.; Lu, W.; Tu, Q.; Ge, Y.; He, J.; Zhou, Y.; Gou, Y.; Van Nostrand, J.D.; Qin, Y.; Li, J.; et al. Preliminary analysis of salivary microbiome and their potential roles in oral lichen planus. Sci. Rep. 2016, 6, 22943. [Google Scholar] [CrossRef] [PubMed]
  24. Valour, F.; Senechal, A.; Dupieux, C.; Karsenty, J.; Lustig, S.; Breton, P.; Gleizal, A.; Boussel, L.; Laurent, F.; Braun, E.; et al. Actinomycosis: Etiology, clinical features, diagnosis, treatment, and management. Infect. Drug Resist. 2014, 7, 183–197. [Google Scholar] [CrossRef] [Green Version]
  25. Roh, Y.H.; Park, K.J.; Byun, K.D.; Roh, M.S.; Choi, H.J. Abdominal actinomycosis misconceived as intestinal lymphoma: Report of a case. Int. J. Surg. Case Rep. 2019, 60, 171–174. [Google Scholar] [CrossRef]
  26. Savoca, E.; Mehra, S.; Waldman, E.H. A case of pediatric cervicofacial actinomyces masquerading as malignancy: Case report and review of the literature. Int. J. Pediatr. Otorhinolaryngol. 2019, 116, 204–208. [Google Scholar] [CrossRef]
  27. von Graevenitz, A. Rothia dentocariosa: Taxonomy and differential diagnosis. Clin. Microbiol. Infect. 2004, 10, 399–402. [Google Scholar] [CrossRef] [Green Version]
  28. Zhang, S.; Kong, C.; Yang, Y.; Cai, S.; Li, X.; Cai, G.; Ma, Y. Human oral microbiome dysbiosis as a novel non-invasive biomarker in detection of colorectal cancer. Theranostics 2020, 10, 11595–11606. [Google Scholar] [CrossRef]
  29. Bhatt, A.P.; Redinbo, M.R.; Bultman, S.J. The role of the microbiome in cancer development and therapy. CA Cancer J. Clin. 2017, 67, 326–344. [Google Scholar] [CrossRef] [Green Version]
  30. Shen, X.J.; Rawls, J.F.; Randall, T.; Burcal, L.; Mpande, C.N.; Jenkins, N.; Jovov, B.; Abdo, Z.; Sandler, R.S.; Keku, T.O. Molecular characterization of mucosal adherent bacteria and associations with colorectal adenomas. Gut Microbes 2010, 1, 138–147. [Google Scholar] [CrossRef] [Green Version]
  31. Clarridge, J.E., 3rd; Zhang, Q. Genotypic diversity of clinical Actinomyces species: Phenotype, source, and disease correlation among genospecies. J. Clin. Microbiol. 2002, 40, 3442–3448. [Google Scholar] [CrossRef] [PubMed] [Green Version]
  32. Jian, X.; Zhu, Y.; Ouyang, J.; Wang, Y.; Lei, Q.; Xia, J.; Guan, Y.; Zhang, J.; Guo, J.; He, Y.; et al. Alterations of gut microbiome accelerate multiple myeloma progression by increasing the relative abundances of nitrogen-recycling bacteria. Microbiome 2020, 8, 74. [Google Scholar] [CrossRef]
Figure 1. Analytical design to assess differences in oral microbiome alpha- and beta-diversities and distinctive taxon features in patients with hematological cancers. Oral microbiome alpha- and/or beta-diversity differences were determined through two categories of analyses: BC vs. HC (AN1) and AML (largest BC patient subgroup) vs. HC. Sample site combinations considered for analysis were BPST, BST, PST, and/or ST. For these sample site combinations, abundance data were cumulative or not for conversion into relative abundance (RA). PRIMERv7 software, the Galaxyv1.2 online tool, and the PATRICv3.6.7 online tool were used to determine bacterial diversity, distinctive features, and enriched pathogenicity. Oral microbiome sample sites were buccal mucosa (B), superficial supragingival plaque (P), saliva (S), and tongue (T). BC is blood cancer; HC is healthy control; AML is acute myelogenous leukemia.
Jcm 09 04068 g001
Figure 2. Clustering of oral samples from healthy controls and patients with hematological cancers. Cluster analysis by principal coordinates analysis nonmetric multidimensional scaling was performed in PRIMERv7 software using the PST sample site combination. PERMANOVA testing for the PCoA and nMDS comparisons shown in the figure resulted in Monte-Carlo p < 0.05. PERMANOVA was based on the initial detection capability of all 737 probes, comprised of 620 species and 117 genus probes. Patients had next-generation sequencing data for saliva sample, buccal mucosa, tongue, and superficial supragingival plaque swabs. (a) AN1: BC vs. HC, with a total of three principal coordinates of 30.9% variation; (c) AN2: AML vs. HC, with a total of three principal coordinates of 43% variation. (b,d) 3D nMDs stress value was less than 0.2 for AN1 and AN2. YAML: patients diagnosed with AML that were treated with antibiotics within 2 weeks of sampling; NAML: patients diagnosed with AML that were not treated with antibiotics.
Jcm 09 04068 g002
Figure 3. Linear discriminant analysis effect size (LEfSe) histograms and cladograms for the comparisons of hematological cancers (BCs) versus healthy controls (HCs). LEfSe was performed to determine distinct oral microbiome features in samples (saliva sample, buccal mucosa, tongue, and superficial supragingival plaque swabs) from the BC and HC groups. Data formatting and input consisted of diagnosis (BC and HC) as class and patient ID as subject, with an LDA threshold of 3.0. (a) AN1: LEfSe results showing a horizontal histogram of hematological cancer patient samples using cumulative PST data. There were 34 HC features and 26 BC features. (b) AN2: horizontal histogram comparing differential features of AML patients (red) and HCs (green), representing top 68 differential features using cumulative PST data. (c) AN1: BC—No Antibiotics vs. HC horizontal histogram of cumulative PST data where patients with BC were not treated with antibiotics, representing the top 50 differential features. (d) AN1: BC—Antibiotics vs. HC horizontal histogram of cumulative PST data where patients with BC were treated with antibiotics, representing the top 61 differential features. (e) AN1: LEfSe Cladogram with 60 differential features identified by LEfSe using PST cumulative data. The largest (genus/species level) differentiating features for BC pts were Actinomyces genus and Rothia dentocariosa. (f) AN2: LEfSe cladogram with 68 differential features identified by LEfSe using PST cumulative data. The largest differentiating features for BC pts were Actinomyces genus and Rothia dentocariosa. (g) AN1: BC—No Antibiotics vs. HC LEfSe cladogram, with 50 differential features identified by LEfSe using PST cumulative data, where BC pts were not treated with antibiotics. The largest differentiating (genus/species level) features for BC pts were Actinomyces genus and Rothia dentocariosa. (h) AN1: BC—Antibiotics vs. HC LEfSe cladogram with 61 differential features identified by LEfSe using PST cumulative data, where BC pts were treated with antibiotics. The largest differentiating (genus/species level) features for BC pts were Actinomyces and Scardovia wiggsiae. Note: genus probe results, representative of family, order, class, and phylum, were included in histograms and cladograms.
Jcm 09 04068 g003aJcm 09 04068 g003bJcm 09 04068 g003cJcm 09 04068 g003dJcm 09 04068 g003eJcm 09 04068 g003fJcm 09 04068 g003gJcm 09 04068 g003h
Figure 4. Differences in cumulative relative abundance between BC/AML pts and HC of select LEfSe identified distinctive species and genera. (a,b) Cumulative PST relative abundance data were used for bar chart representation for species and genera found significant by LEfSe, based on cumulative relative abundance data. * Nonsignificant distinguishing features per post-LEfSe Mann–Whitney test are marked by an asterisk (p ≥ 0.05). Mean represents cumulative PST mean.
Jcm 09 04068 g004
Figure 5. Average relative abundance of healthy controls compared to blood cancer patients for taxa associated with pathogenicity. Cumulative mean relative abundance data plots are shown for species/genera determined to be significant by LEfSe and associated with (a) at least 90% identity with virulence genes and (b) 100% identity with antibiotic resistance using the PATRICv3.6.7 online tool. (c) Species/genera determined to represent oral pathogens by completing a manual search using PubMed and Google. These taxa were distinguishing features that were also found significant per post-LEfSe Mann–Whitney U-Test in the cumulative mean relative abundance BC vs. HC comparison. Mean represents cumulative PST mean.
Jcm 09 04068 g005
Table 1. Demographics, clinical characteristics, and sample site combinations.
Variable BC HC AML
(N = 39) (N = 27) (N = 16)
Age yrs (mean (SD)) * 52.2 (15.08) 53.2 (14.07) 53.2 (14.97)
Age range yrs 25–76 24–84 27–76
Gender (M/F) & 15/24 7/19 9/7
Ethnicity $
Caucasian 24 24 10
Black 15 2 6
AB treatment 22 0 10
Sample site combinations
BPST (n = 132) 13 20
BST (n = 24) 4 3 2
PST (n = 57) 16 3 7
ST (n = 12) 6 1 3
Total # of samples n = 124 n = 100 n = 49
Blood cancers (BC, N = 39, n = 124) of the patient cohort included acute lymphoblastic leukemia (N = 3), acute myelogenous leukemia (AML; N = 16), chronic myelogenous leukemia (CML, N = 1), lymphoma (N = 10), myelodysplastic syndrome (N = 2), myelofibrosis (N = 2), and multiple myeloma (N = 5). Patients with AML represented the largest hematological cancer subgroup. BC pts may have been treated with antibiotics (AB) within two weeks prior to sampling, whereas none of the healthy control subjects were (HC; N = 27, n = 100). Oral microbiome sample sites were buccal mucosa (B), superficial supragingival plaque (P), saliva (S), and tongue (T). Statistics BC vs. HC group; * p = 0.9124 per Mann–Whitney U-test; & p = 0.3355 per chi-squared test; $ p = 0.0046 per chi-squared test; pts is patients; M/F is gender male/female; # is number; SD is standard deviation, yrs is years.
Table 2. PERMANOVA analysis results for patients with hematological cancers or AML compared to healthy control subjects.
PERMANOVA p-Value a,*
AN1 bGroup a,dSite a,eAB-DIA a,f
BPST c0.00080.00230.0001
HC vs. BC-No AB d0.00040.00030.1113
HC vs. BC-AB e0.00360.61550.0001
PST f0.00020.000010.00001
HC vs. BC-No AB g0.00010.00010.1544
HC vs. BC-AB h0.00320.01820.0002
HC vs. BC-AML, LYM, MM i0.00010.00010.1401
BST j0.00150.00560.0171
HC vs. BC-No AB k0.0050.00310.2208
HC vs. BC-AB l0.00440.51880.0004
ST m0.00430.95240.0747
HC vs. BC-No AB n0.01070.05790.1245
HC vs. BC-AB o0.00170.38940.0083
BPST cumulative p0.1978ND0.0023
HC vs. BC-No AB q0.0909ND0.2512
HC vs. BC-AB r0.4825ND0.0012
PST cumulative s0.0857ND0.0028
HC vs. BC-No AB t0.04ND0.2687
HC vs. BC-AB u0.2548ND0.0026
HC vs. BC- AML, LYM, MM v0.0039ND0.2074
ST cumulative w0.0666ND0.1244
HC vs. BC-No AB x0.528ND0.0136
HC vs. BC-AB y0.0557ND0.2245
AN2 zGroup cSite dAB-DIA e
HC vs. AML a,a0.00020.00020.1087
HC vs. NAML a,b0.0001NDND
HC vs. YAML a,c0.0001NDND
a PERMANOVA Monte-Carlo corrected p-values (p < 0.05) using PRIMERv7 software for multivariate permutational analysis of variance (PERMANOVA) show the microbial composition of the HC and BC groups are not equal by using a reducing model with unrestricted permutations of raw data (one factor) or permutation of residuals under a reduced model (2–3 factors), 9999 permutations, and type III partial sum of squares on two analyses for possible site combinations of buccal mucosa (B), superficial supragingival plaque (P), tongue (T) swabs, and saliva (S) samples. b Analyses 1 (AN1), where patients with blood cancer (BC) were compared to healthy control subjects (HC), with a subanalysis comparing HC with BC pts that did not receive or received antibiotics (AB). AN1 subcohort comparisons are as follows: c BPST: 20 HC/80 samples; 13 BC pts/52 samples; d BPST subanalysis of 20 HC/80 samples vs. 8 BC pts/32 samples that did not receive antibiotics (AB); e BPST subanalysis of 20 HC/80 samples vs. 5 BC pts/20 samples that did receive AB; f PST: 23 HC/69 samples; 29 BC pts/87 samples; g PST subanalysis of 23 HC/69 samples vs. 9 BC pts/45 samples that did not receive AB; h PST subanalysis of 23 HC/69 samples vs. 14 BC pts/42 samples that did receive AB; i PST subanalysis of 23 HC/69 samples vs. 23 BC pts/69 samples of BC type AML, LYM, and MM; j BST: 24 HC/72 samples; 17 BC pts/51 samples; k BST subanalysis of 24 HC/72 samples vs. 10 BC pts/30 samples that did not receive AB; l BST subanalysis of 24 HC/72 samples vs. 7 BC pts/21 samples that did receive AB; m ST: 26 HC/52 samples and 39 BC pts/78 samples; n ST subanalysis of 26 HC/52 samples vs. 17 BC pts/34 samples that did not receive AB; o ST subanalysis of 26 HC/52 samples vs. 22 BC pts/44 samples that did receive AB; p BPST cumulative: 20 HC/20 cumulative samples; 13 BC pts/13 cumulative samples; q BPST subanalysis of 20 HC/20 cumulative samples vs. 8 BC pts/8 cumulative samples; r BPST subanalysis of 20 HC/20 cumulative samples vs. 5 BC pts/5 cumulative samples; s PST: 23 HC/23 cumulative samples; 29 BC/29 cumulative samples; t PST subanalysis of 23 HC/23 cumulative samples vs. 15 BC/15 cumulative samples; u PST subanalysis of 23 HC/23 cumulative samples vs. 14 BC/14 cumulative samples; v PST subanalysis of 23 HC/23 cumulative samples vs. 23 BC pts/23 samples of BC type AML, LYM, and MM; w ST: 26 HC/26 samples; 39 BC pts/39 samples; x ST subanalysis of 26 HC/26 cumulative samples vs. 17 BC/17 cumulative samples; y ST subanalysis of 26 HC/26 cumulative samples vs. 22 BC/22 cumulative samples; z Analyses 2 (AN2) where acute myelogenous leukemia (AML) patients were compared to healthy control subjects; AN2 subcohort comparisons are as follows: a,a PST subcohort consisting of all AML pts regardless of AB use (23 HC/69 samples; 11 AML/33 samples); a,b PST subcohort where HC were compared to AML patients that had not received antibiotics (NAML; 23 HC/69 samples; 6 NAML/18 samples); a,c PST subcohort where the HC group was compared to AML patients who received antibiotics (YAML; 23 HC/69 samples; 6 YAML/18 samples); The following describe the PERMANOVA design: a,d fixed variable “Group” (BC, HC); a,e fixed variable “Site” (B, P, S, T); a,f random variable “AB-DIA” corresponding to “Antibiotics” (Y, N) combined with “Diagnosis” (HC, ALL, AML, CML, LYM, MDS, MF, MM) and nested into “Group” and “Site”. For example, no antibiotic use and healthy control subjects correspond to NHC. * Significance level was set at alpha = 0.05; ND is not determined.
Table 3. PATRICv3.6.7 virulence, antibiotic resistance, and oral pathogen determination of LEfSe-identified blood cancer features.
Species/Genus aVirulence bSource cPMID dABR eSource f Accession IDs gOral Pathogen hPMID i
ActinomycesYesPATRIC_VF; Victors10456927; 14600232; 1500984YesNDARO; CARDWP_000804064.1; WP_002586627.1; WP_063856422.1; WP_000691759.1; WP_000027050.1 Yes30225251
23673380
Actinomyces graevenitziiNo No ND
Actinomyces lingnaeND ND ND
Actinomyces orisNo No ND
Corynebacterium matruchotiiNo No ND
LactobacillusYesVFDB; Victors; PATRIC_VF12207705; 15937179; 14569030; 8063392; 19818015 YesARDB; NDARO; CARD; WP_002352254.1; WP_001038795.1; WP_002328813.1; ABI81768.1; WP_000027050.1Yes25758458
Lactobacillus fermentumNo YesNDARO; CARDAAF86220.1; WP_002328813.1; WP_011100845.1Yes19088910
Neisseria subflavaYesVictors; VFDB; 11062540; 19481311; 16988225; 19050914; 18680551YesNDARO; CARDWP_063856397.1; CAD09800.1; WP_000027057.1; AAL59753.1; WP_000480968.1Yes12324342
Rothia aeriaNo No Yes24951810
Rothia dentocariosaYesVictors20485570; 9383163; YesNDARO; CARDCAJ67339.1; WP_000691727.1Yes27303245
Scardovia inopinataNo NoYes32401932
Scardovia wiggsiaeNo No Yes29104444
Streptococcus sanguinisYesVictors; PATRIC_VF8820650; 12207705; 15731074; 10768978; 10998175; YesNDARO; CARDCAA45935.1; WP_000420317.1; WP_000420313.1; WP_000417519.1; WP_000691736.1Yes32082276
Veillonella atypicaYesVictors11062540YesNDARO; CARDWP_000018329.1; CAA45935.1; WP_001038790.1; WP_000196697.1; Yes28473967
Veillonella disparYesVictors11062540; 12207705No Yes28473967
a Species/genus based on LEfSe results of the BC group (HC distinguishing taxa not shown). b Virulence associated with at least a 90% identity with one or more virulent factor genes using the search term “virulence” under “special features” in the PATRICv3.6.7 online database. c,f Source database for which identity was determined. d PATRICv3.6.7 PubMed identification numbers (PMIDs) associated with the concept “virulence”. e Antibiotic resistance (ABR) association with a 100% identity, with one or more antibiotic-resistant genes, using the search term “antibiotic resistance” under “special features” in PATRICv3.6.7. g Accession identification (ID) codes of antibiotic-resistant geness matching 100% identity. h Manual search results for determining the association with the concept “oral pathogenesis” of species/genera; i PMIDs associated with the concept “oral pathogenesis” of species/genera. CARD stands for Comprehensive Antibiotic Resistance Database (https://card.mcmaster.ca); NDARO stands for National Database of Antibiotic-Resistant Organisms (https://0-www-ncbi-nlm-nih-gov.brum.beds.ac.uk/pathogens/antimicrobial-resistance). ND is not determined.
Publisher’s Note: MDPI stays neutral with regard to jurisdictional claims in published maps and institutional affiliations.

