Environmental, Health and Sociodemographic Determinants Related to Common Mental Disorders in Adults: A Spanish Country-Wide Population-Based Study (2006–2017)


Abstract
:
1. Introduction
2. Materials and Methods
2.1. Study Design
2.2. Data Source and Study Population
2.3. Variables
2.3.1. Dependent Variable
2.3.2. Sociodemographic Variables
2.3.3. Lifestyle Behavior
2.3.4. Clinical Variables
2.3.5. Social Support
2.3.6. Perception of Environmental Problems
2.4. Ethical Aspects
2.5. Statistical Analysis
3. Results
3.1. Sociodemographic, Clinical and Lifestyle Habits Variables
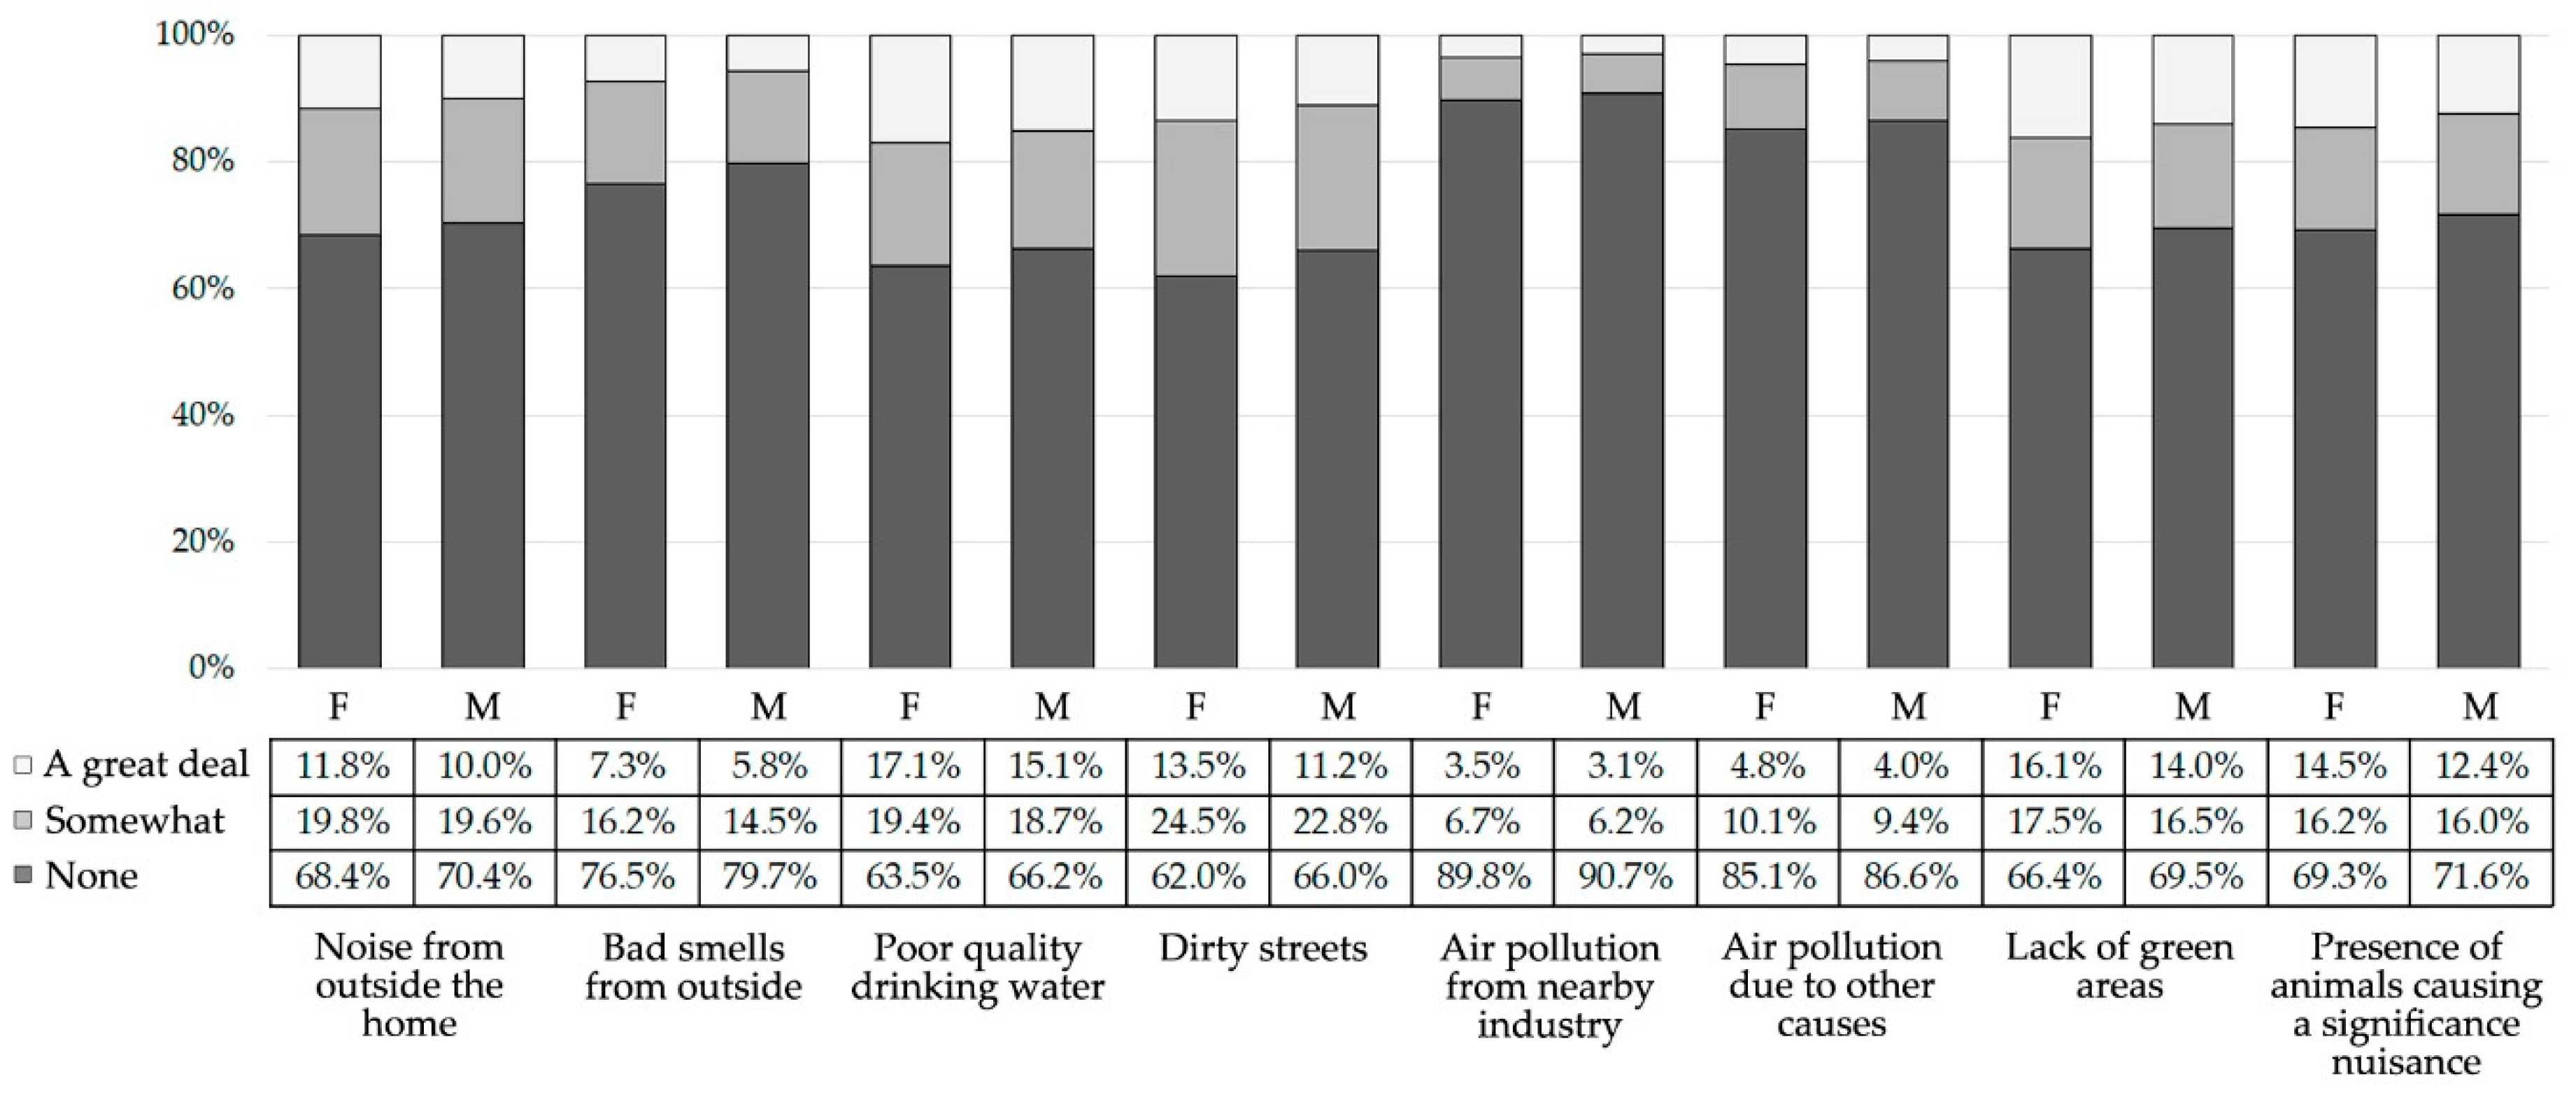
3.2. Perception of Environmental Problems
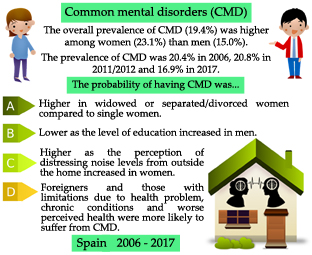
3.3. Common Mental Disorders
3.4. Evolution of Sociodemographic, Clinical and Lifestyle Habits Variables and Perception of Environmental Problems
3.5. Association between Sociodemographic, Clinical and Lifestyle Habits Variables, Perception of Environmental Problems and Common Mental Disorders
4. Discussion
4.1. Main Findings
4.2. Strengths and Limitations
4.3. Implications for Research and Practice
5. Conclusions
Supplementary Materials
Author Contributions
Funding
Acknowledgments
Conflicts of Interest
References
- World Health Organization (WHO). Mental Health Action Plan 2013–2020. Available online: https://apps.who.int/iris/bitstream/handle/10665/89966/9789241506021_eng.pdf?sequence=1 (accessed on 15 April 2020).
- GBD 2017 DALYs and HALE Collaborators. Global, regional, and national disability-adjusted life-years (DALYs) for 359 diseases and injuries and healthy life expectancy (HALE) for 195 countries and territories, 1990–2017: A systematic analysis for the Global Burden of Disease Study 2017. Lancet 2018, 392, 1859–1922. [Google Scholar] [CrossRef] [Green Version]
- Murray, C.J.; Ezzati, M.; Flaxman, A.D.; Lim, S.; Lozano, R.; Michaud, C.; Naghavi, M.; Salomon, J.A.; Shibuya, K.; Vos, T.; et al. GBD 2010: Design, definitions, and metrics. Lancet 2012, 380, 2063–2066. [Google Scholar] [CrossRef]
- Whiteford, H.A.; Degenhardt, L.; Rehm, J.; Baxter, A.J.; Ferrari, A.J.; Erskine, H.E.; Charlson, F.J.; Norman, R.E.; Flaxman, A.D.; Johns, N.; et al. Global burden of disease attributable to mental and substance use disorders: Findings from the Global Burden of Disease Study 2010. Lancet 2013, 382, 1575–1586. [Google Scholar] [CrossRef]
- Lommerse, K.; Stewart, R.C.; Rahman, A. Psychiatric diseases. In Hunter’s Tropical Medicine and Emerging Infectious Diseases, 10th ed.; Ryan, E.T., Hill, D.R., Solomon, T., Aronson, N.E., Endy, T.P., Eds.; Elsevier: London, UK, 2020; pp. 99–104. [Google Scholar] [CrossRef]
- Wittchen, H.-U.; Jacobi, F. Size and burden of mental disorders in Europe—A critical review and appraisal of 27 studies. Eur. Neuropsychopharmacol. 2005, 15, 357–376. [Google Scholar] [CrossRef] [Green Version]
- Wittchen, H.-U.; Jacobi, F.; Rehm, J.; Gustavsson, A.; Svensson, M.; Jönsson, B.; Olesen, J.; Allgulander, C.; Alonso, J.; Faravelli, C.; et al. The size and burden of mental disorders and other disorders of the brain in Europe 2010. Eur. Neuropsychopharmacol. 2011, 21, 655–679. [Google Scholar] [CrossRef] [PubMed] [Green Version]
- Nielsen, T.R.; Vogel, A.; Phung, T.K.; Gade, A.; Waldemar, G. Over- and under-diagnosis of dementia in ethnic minorities: A nationwide register-based study. Int. J. Geriatr. Psychiatry 2011, 26, 1128–1135. [Google Scholar] [CrossRef] [PubMed]
- Bongards, E.N.; Zaman, R.; Agius, M. Can we prevent under-diagnosis and misdiagnosis of bipolar affective disorder? Repeat audits to assess the epidemiological change in the caseload of a community mental health team when bipolar disorder is accurately assessed and diagnosed. Psychiatr. Danub. 2013, 25, S129–S134. [Google Scholar]
- Lao, C.-K.; Chan, Y.-M.; Tong, H.H.-Y.; Pharm Chan, A. Underdiagnosis of depression in an economically deprived population in Macao, China: Underdiagnosis of depression among the poor. Asia Pac. Psychiatry 2016, 8, 70–79. [Google Scholar] [CrossRef]
- World Health Organization (WHO). Depression and Other Common Mental Disorders: Global Health Estimates. 2017. Available online: https://apps.who.int/iris/bitstream/handle/10665/254610/WHO-MSD-MER-2017.2-eng.pdf (accessed on 16 April 2020).
- Steel, Z.; Marnane, C.; Iranpour, C.; Chey, T.; Jackson, J.W.; Patel, V.; Silove, D. The global prevalence of common mental disorders: A systematic review and meta-analysis 1980–2013. Int. J. Epidemiol. 2014, 43, 476–493. [Google Scholar] [CrossRef]
- Gustavson, K.; Knudsen, A.K.; Nesvåg, R.; Knudsen, G.P.; Vollset, S.E.; Reichborn-Kjennerud, T. Prevalence and stability of mental disorders among young adults: Findings from a longitudinal study. BMC Psychiatry 2018, 18, 65. [Google Scholar] [CrossRef]
- Arias de la Torre, J.; Artazcoz, L.; Molina, A.J.; Fernández Villa, T.; Martín, V. Inequalities in mental health in the working population of Spain: A National Health Survey-based study. Gac. Sanit. 2016, 30, 339–344. [Google Scholar] [CrossRef] [PubMed] [Green Version]
- Ruiz Pérez, I.; Bermúdez Tamayo, C.; Rodríguez Barranco, M. Socio-economic factors linked with mental health during the recession: A multilevel analysis. Int. J. Equity Health 2017, 16, 45. [Google Scholar] [CrossRef] [PubMed] [Green Version]
- Henares Montiel, J.; Ruiz Pérez, I.; Sordo, L. Mental health in Spain and differences by sex, and by autonomous communities. Gac. Sanit. 2020, 34, 114–119. [Google Scholar] [CrossRef] [PubMed]
- World Health Organization (WHO). From Burden to “Best Buys”: Reducing the Economic Impact of Non-Communicable Disease in Low-and Middle-Income Countries. 2011. Available online: https://www.who.int/nmh/publications/best_buys_summary.pdf?ua=1 (accessed on 19 April 2020).
- Organization for Economic Co-operation and Development (OECD). Sick on the Job? Myths and Realities about Mental Health and Work. 2012. Available online: https://0-read-oecd--ilibrary-org.brum.beds.ac.uk/social-issues-migration-health/mental-health-and-work_9789264124523-en#page1 (accessed on 19 April 2020).
- World Health Organization (WHO). Investing in Mental Health: Evidence for Action. 2013. Available online: https://www.mhinnovation.net/sites/default/files/downloads/resource/WHO_Investing%20in%20Mental%20Health_eng.pdf (accessed on 19 April 2020).
- Finnes, A.; Enebrink, P.; Ghaderi, A.; Dahl, J.; Nager, A.; Öst, L.-G. Psychological treatments for return to work in individuals on sickness absence due to common mental disorders or musculoskeletal disorders: A systematic review and meta-analysis of randomized-controlled trials. Int. Arch. Occup. Environ. Health 2019, 92, 273–293. [Google Scholar] [CrossRef] [PubMed] [Green Version]
- Organization for Economic Co-operation and Development (OECD). Fit Mind, Fit Job: From Evidence to Practice in Mental Health and Work. 2015. Available online: https://www.oecd.org/els/fit-mind-fit-job-9789264228283-en.htm (accessed on 16 June 2020).
- Cairns, K.E.; Yap, M.B.; Pilkington, P.D.; Jorm, A.F. Risk and protective factors for depression that adolescents can modify: A systematic review and meta-analysis of longitudinal studies. J. Affect. Disord. 2014, 169, 61–75. [Google Scholar] [CrossRef] [PubMed]
- Meng, X.; Brunet, A.; Turecki, G.; Liu, A.; D’Arcy, C.; Caron, J. Risk factor modifications and depression incidence: A 4-year longitudinal Canadian cohort of the Montreal Catchment Area Study. BMJ Open 2017, 7, e015156. [Google Scholar] [CrossRef] [PubMed] [Green Version]
- Ahmadvand, A.; Sepehrmanesh, Z.; Ghoreishi, F.S.; Afshinmajd, S. Prevalence of Psychiatric Disorders in General Population of Kashan, Iran. Arch. Iran. Med. 2012, 15, 205–209. [Google Scholar] [CrossRef]
- Kestens, Y.; Wasfi, R.; Naud, A.; Chaix, B. “Contextualizing context”: Reconciling environmental exposures, social networks, and location preferences in health research. Curr. Environ. Health Rep. 2017, 4, 51–60. [Google Scholar] [CrossRef]
- Diez Roux, A.V.; Mair, C. Neighborhoods and health. Ann. N. Y. Acad. Sci. 2010, 1186, 125–145. [Google Scholar] [CrossRef] [Green Version]
- Blair, A.; Ross, N.A.; Gariepy, G.; Schmitz, N. How do neighborhoods affect depression outcomes? A realist review and a call for the examination of causal pathways. Soc. Psychiatry Psychiatr. Epidemiol. 2014, 49, 873–887. [Google Scholar] [CrossRef]
- Tost, H.; Champagne, F.A.; Meyer-Lindenberg, A. Environmental influence in the brain, human welfare and mental health. Nat. Neurosci. 2015, 18, 1421–1431. [Google Scholar] [CrossRef]
- Helbich, M. Toward dynamic urban environmental exposure assessments in mental health research. Environ. Res. 2018, 161, 129–135. [Google Scholar] [CrossRef]
- Hartig, T.; Mitchell, R.; de Vries, S.; Frumkin, H. Nature and health. Annu. Rev. Public Health 2014, 35, 207–228. [Google Scholar] [CrossRef] [PubMed] [Green Version]
- Gascon, M.; Triguero Mas, M.; Martínez, D.; Dadvand, P.; Forns, J.; Plasència, A.; Nieuwenhuijsen, M.J. Mental health benefits of long-term exposure to residential green and blue spaces: A systematic review. Int. J. Environ. Res. Public Health 2015, 12, 4354–4379. [Google Scholar] [CrossRef] [PubMed] [Green Version]
- Klompmaker, J.O.; Hoek, G.; Bloemsma, L.D.; Wijga, A.H.; van den Brink, C.; Brunekreef, B.; Lebret, E.; Gehring, U.; Janssen, N.A.H. Associations of combined exposures to surrounding green, air pollution and traffic noise on mental health. Environ. Int. 2019, 129, 525–537. [Google Scholar] [CrossRef] [PubMed]
- Echeverría, S.; Diez-Roux, A.V.; Shea, S.; Borrell, L.N.; Jackson, S. Associations of neighborhood problems and neighborhood social cohesion with mental health and health behaviors: The Multi-Ethnic study of atherosclerosis. Health Place 2008, 14, 853–865. [Google Scholar] [CrossRef] [Green Version]
- Barnes, J.; Belsky, J.; Frost, M.; Melhuish, E. Neighbourhood characteristics and mental health: The relevance for mothers of infants in deprived English neighbourhoods. Soc. Psychiatry Psychiatr. Epidemiol. 2011, 46, 1243–1249. [Google Scholar] [CrossRef]
- Mair, C.; Diez Roux, A.V.; Shen, M.; Shea, S.; Seeman, T.; Echeverría, S.; O’Meara, E.S. Cross-sectional and longitudinal associations of neighbourhood cohesion and stressors with depressive symptoms in the multiethnic study of atherosclerosis. Ann. Epidemiol. 2009, 19, 49–57. [Google Scholar] [CrossRef]
- Molarius, A.; Berglund, K.; Eriksson, C.; Eriksson, H.G.; Lindén-Boström, M.; Nordström, E.; Persson, C.; Sahlqvist, L.; Starrin, B.; Ydreborg, B. Mental health symptoms in relation to socio-economic conditions and lifestyle factors—A population-based study in Sweden. BMC Public Health 2009, 9, 302. [Google Scholar] [CrossRef] [Green Version]
- Virtanen, M.; Koskinen, S.; Kivimäki, M.; Honkonen, T.; Vahtera, J.; Ahola, K.; Lönnqvist, J. Contribution of non-work and work-related risk factors to the association between income and mental disorders in a working population: The Health 2000 Study. Occup. Environ. Med. 2008, 65, 171–178. [Google Scholar] [CrossRef] [Green Version]
- Ministerio de Sanidad Servicios Sociales e Igualdad; Instituto Nacional de Estadística. Encuesta Europea de Salud en España ENSE 2006; Ministerio de Sanidad, Servicios Sociales e Igualdad: Madrid, Spain, 2007. Available online: https://www.mscbs.gob.es/estadEstudios/estadisticas/encuestaNacional/encuesta2006.htm (accessed on 1 April 2020).
- Ministerio de Sanidad Servicios Sociales e Igualdad; Instituto Nacional de Estadística. Encuesta Nacional de Salud España ENSE 2011/12; Ministerio de Sanidad, Servicios Sociales e Igualdad: Madrid, Spain, 2013. Available online: https://www.mscbs.gob.es/estadEstudios/estadisticas/encuestaNacional/encuesta2011.htm (accessed on 1 April 2020).
- Ministerio de Sanidad Servicios Sociales e Igualdad; Instituto Nacional de Estadística. Encuesta Nacional de Salud España ENSE 2017; Ministerio de Sanidad, Servicios Sociales e Igualdad: Madrid, Spain, 2018. Available online: https://www.mscbs.gob.es/estadEstudios/estadisticas/encuestaNacional/encuesta2017.htm (accessed on 1 April 2020).
- Goldberg, D.P.; Hillier, V.F. A scaled version of the General Health Questionnaire. Psychol. Med. 1979, 9, 139–145. [Google Scholar] [CrossRef] [PubMed]
- Goldberg, D.P.; Williams, P. Cuestionario de Salud General GHQ: Guía Para el Usuario de las Distintas Versiones, 1st ed.; Masson: Barcelona, Spain, 1996. [Google Scholar]
- Sánchez López, M.P.; Dresch, V. The 12-Item General Health Questionnaire (GHQ-12): Reliability, external validity and factor structure in the Spanish population. Psicothema 2008, 20, 839–843. [Google Scholar]
- Goldberg, D.P.; Gater, R.; Sartorius, N.; Ustun, T.B.; Piccinelli, M.; Gureje, O.; Rutter, C. The validity of two versions of the GHQ in the WHO study of mental illness in general health care. Psychol. Med. 1997, 27, 191–197. [Google Scholar] [CrossRef] [PubMed]
- International Labour Organization (ILO). 2012 Decent Work Indicators: Concepts and Definitions. Available online: https://www.ilo.org/wcmsp5/groups/public/---dgreports/---integration/documents/publication/wcms_229374.pdf (accessed on 9 April 2020).
- Domingo-Salvany, A.; Bacigalupe, A.; Carrasco, J.M.; Espelt, A.; Ferrando, J.; Borrell, C. Proposals for social class classification based on the Spanish National Classification of Occupations 2011 using neo-Weberian and neo-Marxist approaches. Gac. Sanit. 2011, 27, 263–272. [Google Scholar] [CrossRef] [PubMed] [Green Version]
- National Health Survey 2006 (SNHS 2006). Adult Questionnaire. Available online: https://www.mscbs.gob.es/estadEstudios/estadisticas/encuestaNacional/encuestaNac2006/ENS_06_Adultos_definitivo.pdf (accessed on 11 June 2020).
- National Health Survey 2011–2012 (SNHS 2011–2012). Adult Questionnaire. Available online: https://www.mscbs.gob.es/estadEstudios/estadisticas/encuestaNacional/encuestaNac2011/Cuestionario_Adultos.pdf (accessed on 11 June 2020).
- National Health Survey 2017 (SNHS 2017). Adult Questionnaire. Available online: https://www.mscbs.gob.es/estadEstudios/estadisticas/encuestaNacional/encuestaNac2017/ENSE17_ADULTO_.pdf (accessed on 11 June 2020).
- Broadhead, W.E.; Gehlbach, S.H.; Degruy, F.V.; Kaplan, B.H. The Duke-UNK functional social support questionnaire: Measurement of social support in family medicine patients. Med. Care 1988, 26, 709–723. [Google Scholar] [CrossRef] [PubMed]
- de la Revilla Ahumada, L.; Bailón, E.; de Dios Luna, J.; Delgado, A.; Prados, M.A.; Fleitas, L. Validación de una escala de apoyo social funcional para su uso en la consulta del médico de familia. Aten. Primaria 1991, 8, 688–692. [Google Scholar]
- Bellón Saameño, J.A.; Delgado Sánchez, A.; Luna del Castillo, J.D.; Lardelli Claret, P. Validity and reliability of the Duke-UNC-11 questionnaire of functional social support. Aten. Primaria 1996, 18, 153–156. [Google Scholar] [PubMed]
- National Health Survey 2006 (SNHS 2006). Household Questionnaire. Available online: https://www.mscbs.gob.es/estadEstudios/estadisticas/encuestaNacional/encuestaNac2006/ENS_06_Hogar_definitivo.pdf (accessed on 11 June 2020).
- National Health Survey 2011–2012 (SNHS 2011–2012). Household Questionnaire. Available online: https://www.mscbs.gob.es/estadEstudios/estadisticas/encuestaNacional/encuestaNac2011/Cuestionario_Hogar.pdf (accessed on 11 June 2020).
- National Health Survey 2017 (SNHS 2017). Household Questionnaire. Available online: https://www.mscbs.gob.es/estadEstudios/estadisticas/encuestaNacional/encuestaNac2017/ENSE17_HOGAR.pdf (accessed on 11 June 2020).
- Cortès, I.; Artazcoz, L.; Rodriguez Sanz, M.; Borrell, C. Inequalities in mental health in the working population. Gac. Sanit. 2004, 18, 351–359. [Google Scholar] [CrossRef]
- Cortès, I.; Escribà Agüir, V.; Benach, J.; Artazcoz, L. Employment stability and mental health in Spain: Towards understanding the influence of gender and partner/marital status. BMC Public Health 2018, 18, 425. [Google Scholar] [CrossRef] [Green Version]
- Rocha, K.B.; Pérez, K.; Rodríguez Sanz, M.; Borrell, C.; Obiols, J.E. Prevalence of mental health problems and their association with socioeconomic, work and health variables: Findings from the Spain National Health Survey. Psicothema 2010, 22, 389–395. [Google Scholar]
- Rocha, K.B.; Pérez, K.; Rodríguez Sanz, M.; Obiols, J.E.; Borrell, C. Perception of environmental problems and common mental disorders (CMD). Soc. Psychiatry Psychiatr. Epidemiol. 2012, 47, 1675–1684. [Google Scholar] [CrossRef] [PubMed]
- Bartoll, X.; Palència, L.; Malmusi, D.; Suhrcke, M.; Borrell, C. The evolution of mental health in Spain during the economic crisis. Eur. J. Public Health 2014, 24, 415–418. [Google Scholar] [CrossRef] [PubMed] [Green Version]
- Moncho, J.; Pereyra Zamora, P.; Tamayo Fonseca, N.; Giron, M.; Gómez Beneyto, M.; Nolasco, A. Is recession bad for your mental health? The answer could be complex: Evidence from the 2008 crisis in Spain. BMC Med. Res. Methodol. 2018, 18, 78. [Google Scholar] [CrossRef] [PubMed] [Green Version]
- Riecher Rössler, A. Sex and gender differences in mental disorders. Lancet Psychiatry 2016, 4, 8–9. [Google Scholar] [CrossRef]
- Li, S.H.; Graham, B.M. Why are women so vulnerable to anxiety, trauma-related and stress-related disorders? The potential role of sex hormones. Lancet Psychiatry 2016, 4, 73–82. [Google Scholar] [CrossRef]
- Oram, S.; Khalifeh, H.; Howard, L.M. Violence against women and mental health. Lancet Psychiatry 2017, 4, 159–170. [Google Scholar] [CrossRef] [Green Version]
- Seedat, S.; Scott, K.M.; Angermeyer, M.C.; Berglund, P.; Bromet, E.J.; Brugha, T.S.; Demyttenaere, K.; de Girolamo, G.; Haro, J.M.; Jin, R.; et al. Cross-national associations between gender and mental disorders in the World Health Organization World Mental Health Surveys. Arch. Gen. Psychiatry 2009, 66, 785–795. [Google Scholar] [CrossRef]
- Cortina, L.M.; Leskinen, E.A. Workplace harassment based on sex: A risk factor for women’s mental health problems. In Violence against Women and Mental Health, 1st ed.; García Moreno, C., Riecher Rössler, A., Eds.; Karger Publisher: Basel, Switzerland, 2013; pp. 139–147. [Google Scholar] [CrossRef]
- Van Droogenbroeck, F.; Spruyt, B.; Keppens, G. Gender differences in mental health problems among adolescents and the role of social support: Results from the Belgian health interview surveys 2008 and 2013. BMC Psychiatry 2018, 18, 6. [Google Scholar] [CrossRef] [Green Version]
- Rosenfield, S.; Mouzon, D. Gender and mental health. In Handbook of the Sociology of Mental Health, 2nd ed.; Aneshensel, C.S., Phelan, J.C., Bierman, A., Eds.; Springer Netherlands: Dordrecht, The Netherlands, 2013; pp. 277–296. [Google Scholar] [CrossRef]
- Pattyn, E.; Verhaeghe, M.; Bracke, P. The gender gap in mental health service use. Soc. Psychiatry Psychiatr. Epidemiol. 2015, 50, 1089–1095. [Google Scholar] [CrossRef]
- Stuckler, D.; Basu, S.; Suhrcke, M.; Coutts, A.; Mckee, M. The public health effect of economic crises and alternative policy responses in Europe: An empirical analysis. Lancet 2009, 374, 315–323. [Google Scholar] [CrossRef]
- García, A.M. Labor market and health. SESPAS report 2010. Gac. Sanit. 2010, 24, 62–67. [Google Scholar] [CrossRef] [Green Version]
- Gili, M.; Roca, M.; Basu, S.; McKee, M.; Stuckler, D. The mental health risks of economic crisis in Spain: Evidence from primary care centres, 2006 and 2010. Eur. J. Public Health 2013, 23, 103–108. [Google Scholar] [CrossRef]
- Martín-Carrasco, M.; Evans-Lacko, S.; Dom, G.; Christodoulou, N.G.; Samochowiec, J.; González-Fraile, E.; Bienkowski, P.; Gómez-Beneyto, M.; Dos Santos, M.J.H.; Wasserman, D. EPA guidance on mental health and economic crises in Europe. Eur. Arch. Psychiatry Clin. Neurosci. 2016, 266, 89–124. [Google Scholar] [CrossRef] [PubMed]
- Gil-Alonso, F.; Thiers-Quintana, J. Population and economic cycles in the main Spanish urban areas: The migratory component. Comp. Popul. Stud. 2019, 44, 317–350. [Google Scholar] [CrossRef]
- Moreno-Küstner, B.; Masedo Gutiérrez, I. Economic crisis and mental health–findings from Spain. Die Psychiatr. 2017, 14, 95–102. [Google Scholar]
- Zapata Moya, A.R.; Buffel, V.; Navarro Yáñez, C.J.; Bracke, P. Social inequality in morbidity, framed within the current economic crisis in Spain. Int. J. Equity Health 2015, 14, 131. [Google Scholar] [CrossRef] [PubMed] [Green Version]
- Bacigalupe, A.; Esnaola, S.; Martín, U. The impact of the Great Recession on mental health and its inequalities: The case of a Southern European region, 1997–2013. Int. J. Equity Health 2016, 15–17. [Google Scholar] [CrossRef] [Green Version]
- Córdoba-Doña, J.A.; Escolar-Pujolar, A.; San Sebastián, M.; Gustafsson, P.E. How are the employed and unemployed affected by the economic crisis in Spain? Educational inequalities, life conditions and mental health in a context of high unemployment. BMC Public Health 2016, 16, 267. [Google Scholar] [CrossRef] [Green Version]
- Stoyanova, A.; Pinilla, J. Socioeconomic burden of mental disorders in Spain 2006–2017. In UB Economics Working Papers E19/389; Faculty of Economics and Business, University of Barcelona: Barcelona, Spain, 2019. [Google Scholar] [CrossRef] [Green Version]
- Cui, S.; Wang, R.; Lu, L.; Wang, H.; Zhang, Y. Influence of education level on mental health and medical coping modes: A correlation analysis in the elderlies. Am. J. Nurs. Sci. 2019, 8, 324–328. [Google Scholar] [CrossRef]
- Pérez Romero, S.; Gascón Cánovas, J.J.; de la Cruz Sánchez, E.; Sánchez Ruiz, J.F.; Parra Hidalgo, P.; Monteagudo Piqueras, O. Recesión económica (2006–2012) y cambios en el estado de salud de la población española. Salud Publica Mex. 2016, 58, 41–48. [Google Scholar] [CrossRef] [Green Version]
- Rivera, B.; Casal, B.; Currais, L. The healthy immigrant effect on mental health: Determinants and implications for mental health policy in Spain. Adm. Policy Ment. Health 2016, 43, 616–627. [Google Scholar] [CrossRef] [PubMed]
- Hupcey, J.E. Clarifying the social support theory-research linkage. J. Adv. Nurs. 1998, 27, 1231–1241. [Google Scholar] [CrossRef] [PubMed]
- Dour, H.J.; Wiley, J.F.; Roy-Byrne, P.; Stein, M.B.; Sullivan, G.; Sherbourne, C.D.; Bystritsky, A.; Rose, R.D.; Craske, M.G. Perceived social support mediates anxiety and depressive symptom changes following primary care intervention. Depress. Anxiety 2014, 31, 436–442. [Google Scholar] [CrossRef] [PubMed]
- Cohen, S.; Gottlieb, B.H.; Underwood, L.G. Social relationship and health. In Social Support Measurement and Intervention: A Guide for Health and Social Scientist; Cohen, S., Underwood, L.G., Gottlieb, B.H., Eds.; Oxford University Press: Oxford, UK, 2000; pp. 3–25. [Google Scholar] [CrossRef]
- Caron, J.; Guay, S. Soutien social et santé mentale: Concept, mesures, recherches récentes et implications pour les cliniciens. Santé Mentale au Québec 2005, 30, 15–41. [Google Scholar] [CrossRef] [Green Version]
- Agudelo Suárez, A.A.; Ronda, E.; Vázquez Navarrete, M.L.; García, A.M.; Martínez, J.M.; Benavides, F.G. Impact of economic crisis on mental health of migrant workers: What happened with migrants who came to Spain to work? Int. J. Public Health 2013, 58, 627–731. [Google Scholar] [CrossRef]
- Robert, G.; Martínez, J.M.; García, A.M.; Benavides, F.G.; Ronda, E. From the boom to the crisis: Changes in employment conditions of immigrants in Spain and their effects on mental health. Eur. J. Public Health 2014, 24, 404–409. [Google Scholar] [CrossRef] [Green Version]
- Arici, C.; Ronda Pérez, E.; Tamhid, T.; Absekava, K.; Porru, S. Occupational health and safety of immigrant workers in Italy and Spain: A scoping review. Int. J. Environ. Res. Public Health 2019, 16, 4416. [Google Scholar] [CrossRef] [Green Version]
- Gold, M.; Franks, P.; Erickson, P. Assessing the health of the nation. The predictive validity of a preference-based measure and self-rated health. Med. Care 1996, 34, 163–177. [Google Scholar] [CrossRef]
- Joustra, M.L.; Janssens, K.A.; Bultmann, U.; Rosmalen, J.G. Functional limitations in functional somatic syndromes and well-defined medical diseases. Results from the general population cohort LifeLines. J. Psychosom. Res. 2015, 79, 94–99. [Google Scholar] [CrossRef] [Green Version]
- Brown, R.L. Understanding the influence of stigma and discrimination for the functional limitation severity–psychological distress relationship: A stress and coping perspective. Soc. Sci. Res. 2017, 62, 150–160. [Google Scholar] [CrossRef] [Green Version]
- Schneiderman, N.; Ironson, G.; Siegel, S.D. Stress and health: Psychological, behavioral, and biological determinants. Annu. Rev. Clin. Psychol. 2005, 1, 607–628. [Google Scholar] [CrossRef] [Green Version]
- Edmans, J.; Bradshaw, L.; Gladman, J.R.; Franklin, M.; Berdunov, V.; Elliott, R.; Conroy, S.P. The Identification of Seniors at Risk (ISAR) score to predict clinical outcomes and health service costs in older people discharged from UK acute medical units. Age Ageing 2013, 42, 747–753. [Google Scholar] [CrossRef] [PubMed] [Green Version]
- Gale, C.R.; Harris, A.; Deary, I.J. Reaction time and onset of psychological distress: The UK Health and Lifestyle Survey. J. Epidemiol. Commun. Health 2016, 70, 813–817. [Google Scholar] [CrossRef] [PubMed] [Green Version]
- Agborsangaya, C.B.; Lau, D.; Lahtinen, M.; Cooke, T.; Johnson, J.A. Health-related quality of life and healthcare utilization in multimorbidity: Results of a cross-sectional survey. Qual. Life Res. 2013, 22, 791–799. [Google Scholar] [CrossRef] [PubMed]
- Kessler, R.C.; Bromet, E.J. The epidemiology of depression across cultures. Annu. Rev. Public Health 2013, 34, 119–138. [Google Scholar] [CrossRef] [Green Version]
- Picco, L.; Subramaniam, M.; Abdin, E.; Vaingankar, J.A.; Chong, S.A. Gender differences in major depressive disorder: Findings from the Singapore Mental Health Study. Singap. Med. J. 2017, 58, 649–655. [Google Scholar] [CrossRef] [Green Version]
- Senicato, C.; Cruz Soares de Azevedo, R.; Berti de Azevedo Barros, M. Common mental disorders in adult women: Identifying the most vulnerable segments. Cien. Saude Colet. 2018, 23, 2543–2554. [Google Scholar] [CrossRef] [PubMed]
- Sbarra, D.A.; Hasselmo, K.; Bourassa, K.J. Divorce and health: Beyond individual differences. Curr. Dir. Psychol. Sci. 2015, 24, 109–113. [Google Scholar] [CrossRef] [Green Version]
- Bulloch, A.G.; Williams, J.V.; Lavorato, D.H.; Patten, S.B. The relationship between major depression and marital disruption is bidirectional. Depress. Anxiety 2009, 26, 1172–1177. [Google Scholar] [CrossRef] [PubMed]
- Gibb, S.J.; Fergusson, D.M.; Horwood, L.J. Relationship separation and mental health problems: Findings from a 30-year longitudinal study. Aust. N. Z. J. Psychiatry 2011, 45, 163–169. [Google Scholar] [CrossRef]
- Blanner Kristiansen, C.; Nørgaard Kjær, J.; Hjorth, P.; Andersen, K.; Prina, A.M. Prevalence of common mental disorders in widowhood: A systematic review and meta-analysis. J. Affect. Disord. 2019, 245, 1016–1023. [Google Scholar] [CrossRef] [Green Version]
- Wójcik, G.; Zawisza, K.; Jabłońska, K.; Grodzicki, T.; Tobiasz-Adamczyk, B. Transition out of marriage and its effects on health and health-related quality of life among females and males. COURAGE and COURAGE-POLFUS-Population based follow-up study in Poland. Appl. Res. Qual. Life 2019. [Google Scholar] [CrossRef] [Green Version]
- Marks, N.F.; Lambert, J.D. Marital status continuity and change among young and midlife adults: Longitudinal effects on psychological well-being. J. Fam. Issues 1998, 19, 652–686. [Google Scholar] [CrossRef]
- Hammersen, F.; Niemann, H.; Hoebel, J. Environmental noise annoyance and mental health in adults: Findings from the cross-sectional German Health Update (GEDA) Study 2012. Int. J. Environ. Res. Public Health 2016, 13, 954. [Google Scholar] [CrossRef] [PubMed] [Green Version]
- Knobel, K.A.; Lima, M.C. Influences of age, gender, and parents’ educational level in knowledge, behavior, and preferences regarding noise, from childhood to adolescence. Noise Health 2014, 16, 350–360. [Google Scholar] [CrossRef]
- Warner-Czyz, A.D.; Cain, S. Age and gender differences in children and adolescents’ attitudes toward noise. Int. J. Audiol. 2016, 55, 83–92. [Google Scholar] [CrossRef]
- Seidler, A.; Hegewald, J.; Seidler, A.L.; Schubert, M.; Wagner, M.; Dröge, P.; Haufe, E.; Schmitt, J.; Swart, E.; Zeeb, H. Association between aircraft, road and railway traffic noise and depression in a large case-control study based on secondary data. Environ. Res. 2017, 152, 263–271. [Google Scholar] [CrossRef]
- Orban, E.; McDonald, K.; Sutcliffe, R.; Hoffmann, B.; Fuks, K.B.; Dragano, N.; Viehmann, A.; Erbel, R.; Jöckel, K.-H.; Pundt, N.; et al. Residential road traffic noise and high depressive symptoms after five years of follow-up: Results from the Heinz Nixdorf recall study. Environ. Health Perspect. 2016, 124, 578–585. [Google Scholar] [CrossRef] [Green Version]
- McCay, L.; Bremer, I.; Endale, T.; Jannati, M.; Yi, J. Urban design and mental health. In Mental Health and Illness in the City; Okkels, N., Blanner Kristiansen, C., Munk-Jørgensen, P., Eds.; Springer: Singapore, 2017; pp. 421–444. [Google Scholar] [CrossRef]
- Jones, K. Environmental Noise and Health: A Review; Civil Aviation Authority Environmental Research and Consultancy Department: London, UK, 2010. [Google Scholar]
- Beutel, M.E.; Jünger, C.; Klein, E.M.; Wild, P.; Lackner, K.; Blettner, M.; Binder, H.; Michal, M.; Wiltink, J.; Brähler, E.; et al. Noise annoyance is associated with depression and anxiety in the general population—The contribution of aircraft noise. PLoS ONE 2016, 11, e0155357. [Google Scholar] [CrossRef]
- Jensen, H.A.R.; Rasmussen, B.; Ekholm, O. Neighbour and traffic noise annoyance: A nationwide study of associated mental health and perceived stress. Eur. J. Public Health 2018, 28, 1050–1055. [Google Scholar] [CrossRef]
- Jensen, H.A.R.; Rasmussen, B.; Ekholm, O. Neighbour noise annoyance is associated with various mental and physical health symptoms: Results from a nationwide study among individuals living in multi-storey housing. BMC Public Health 2019, 19, 1508. [Google Scholar] [CrossRef] [PubMed]
- Basner, M.; Babisch, W.; Davis, A.; Brink, M.; Clark, C.; Janssen, S.; Stansfeld, S. Auditory and non-auditory effects of noise on health. Lancet 2014, 383, 1325–1332. [Google Scholar] [CrossRef] [Green Version]
- Hu, C.-S.; Tkebuchava, T. E-noise: An increasingly relevant health risk. J. Integr. Med. 2019, 17, 311–314. [Google Scholar] [CrossRef] [PubMed]
- Basner, M.; McGuire, S. WHO environmental noise guidelines for the European region: A systematic review on environmental noise and effects on sleep. Int. J. Environ. Res. Public Health 2018, 15, 519. [Google Scholar] [CrossRef] [PubMed] [Green Version]
- Hong, J.; Kim, J.; Lim, C.; Kim, K.; Lee, S. The effects of long-term exposure to railway and road traffic noise on subjective sleep disturbance. J. Acoust. Soc. Am. 2010, 28, 2829–2835. [Google Scholar] [CrossRef] [PubMed] [Green Version]
- Halonen, J.I.; Vahtera, J.; Stansfeld, S.; Yli-Tuomi, T.; Salo, P.; Pentti, J.; Kivimäki, M.; Lanki, T. Associations between nighttime traffic noise and sleep: The Finnish public sector study. Environ. Health Perspect. 2012, 120, 1391–1396. [Google Scholar] [CrossRef]
- Lin, C.-Y.; Tsai, P.-J.; Lin, K.-Y.; Chen, C.-Y.; Chung, L.-H.; Wu, J.-L.; Leon Guo, Y. Will daytime occupational noise exposures induce nighttime sleep disturbance? Sleep. Med. 2018, 50, 87–96. [Google Scholar] [CrossRef]
- Radun, J.; Hongisto, V.; Suokas, M. Variables associated with wind turbine noise annoyance and sleep disturbance. Build. Environ. 2019, 150, 339–348. [Google Scholar] [CrossRef]
- He, S.; Smargiassi, A.; Low, N.; Bilodeau-Bertrand, M.; Ayoub, A.; Auger, N. Residential noise exposure and the longitudinal risk of hospitalization for depression after pregnancy: Postpartum and beyond. Environ. Res. 2019, 170, 26–32. [Google Scholar] [CrossRef]
- McKee-Ryan, F.; Song, Z.; Wanberg, C.R.; Kinicki, A. Psychological and physical well-being during unemployment: A meta-analytic study. J. Appl. Psychol. 2005, 90, 53–76. [Google Scholar] [CrossRef] [Green Version]
- Lim, V.K.G.; Chen, D.; Aw, S.S.Y.; Tan, M.Z. Unemployed and exhausted? Job-search fatigue and reemployment quality. J. Vocat. Behav. 2016, 92, 68–78. [Google Scholar] [CrossRef]
- Wang, J.; Mann, F.; Lloyd-Evans, B.; Ma, R.; Johnson, S. Associations between loneliness and perceived social support and outcomes of mental health problems: A systematic review. BMC Psychiatry 2018, 18, 156. [Google Scholar] [CrossRef] [PubMed] [Green Version]
- Johnson, S. Social interventions in mental health: A call to action. Soc. Psychiatry Psychiatr. Epidemiol. 2017, 52, 245–247. [Google Scholar] [CrossRef] [Green Version]
- National Health Service of the United Kingdom (NHS). Five Year forward View. 2014. Available online: https://www.england.nhs.uk/wp-content/uploads/2014/10/5yfv-web.pdf (accessed on 9 April 2020).
- Van Renterghem, T.; Botteldooren, D. View on outdoor vegetation reduces noise annoyance for dwellers near busy roads. Landscape Urban Plan. 2016, 148, 203–215. [Google Scholar] [CrossRef] [Green Version]


| Variables | 2006 n = 19,868 (%) | 2011/2012 n = 13,798 (%) | 2017 n = 14,839 (%) | β | R2 | p for Trend |
|---|---|---|---|---|---|---|
| Gender | ||||||
| Female | 11,788 (59.3) | 7014 (50.8) | 7660 (51.6) | −0.67 | 0.62 | 0.42 |
| Male | 8080 (40.7) | 6784 (49.2) | 7179 (48.4) | 0.67 | 0.62 | 0.42 |
| Age group | ||||||
| 16–24 years | 1979 (10.0) | 1354 (9.8) | 1294 (8.7) | −0.12 | 0.88 | 0.23 |
| 25–44 years | 9602 (48.3) | 6256 (45.3) | 6072 (40.9) | −0.68 | 0.92 | 0.03 |
| 45–64 years | 8287 (41.7) | 6188 (44.9) | 7473 (50.4) | 0.79 | 0.97 | 0.07 |
| Marital status | ||||||
| Single | 6079 (30.6) | 4770 (34.6) | 4694 (31.6) | 0.07 | 0.04 | 0.87 |
| Married | 11,914 (60.0) | 7607 (55.1) | 8455 (57.0) | −0.25 | 0.32 | 0.61 |
| Widowed | 611 (3.1) | 367 (2.7) | 357 (2.4) | −0.06 | 0.96 | 0.12 |
| Separated or divorced | 1264 (6.3) | 1054 (7.6) | 1333 (9.0) | 0.24 | 0.99 | 0.02 |
| Social class | ||||||
| Upper class | 4235 (21.3) | 2795 (20.3) | 2972 (20.0) | −0.11 | 0.84 | 0.26 |
| Middle class | 10,363 (52.2) | 4753 (34.4) | 4964 (33.5) | −1.65 | 0.75 | 0.34 |
| Lower class | 5270 (26.5) | 6250 (45.3) | 6903 (46.5) | 1.76 | 0.75 | 0.33 |
| Level of education | ||||||
| Without studies | 1072 (5.4) | 648 (4.7) | 516 (3.5) | −0.18 | 0.98 | 0.07 |
| Primary | 6007 (30.2) | 1155 (8.4) | 1645 (11.1) | −1.67 | 0.59 | 0.44 |
| Secondary or PT | 9030 (45.4) | 9355 (67.8) | 9259 (62.4) | 1.46 | 0.48 | 0.52 |
| University | 3759 (19) | 2640 (19.1) | 3419 (23.0) | 0.38 | 0.83 | 0.27 |
| Nationality | ||||||
| Spanish | 18,085 (91.0) | 12,676 (92.0) | 14,678 (99.0) | 0.73 | 0.87 | 0.24 |
| Foreigner | 1783 (9.0) | 1122 (8.0) | 161 (1.0) | −0.73 | 0.87 | 0.24 |
| Size of town of residence | ||||||
| <10,000 inhab. | 4965 (25.0) | 3021 (21.9) | 3215 (21.7) | −0.29 | 0.76 | 0.33 |
| 10,000–100,000 inhab. | 7184 (36.2) | 5013 (36.3) | 5535 (37.3) | 0.11 | 0.89 | 0.21 |
| >100,000 inhab. | 7719 (38.8) | 5764 (41.8) | 6089 (41.0) | 0.19 | 0.46 | 0.52 |
| Employment situation | ||||||
| Employment | 12,133 (61.1) | 9064 (65.7) | 9504 (64.0) | 0.25 | 0.35 | 0.59 |
| Unemployment | 7735 (38.9) | 4734 (34.3) | 5335 (36.0) | −0.25 | 0.35 | 0.59 |
| Self-perceived health status | ||||||
| Very good | 3446 (17.3) | 3108 (22.5) | 3461 (23.3) | 0.53 | 0.81 | 0.29 |
| Good | 10,620 (53.5) | 7601 (55.1) | 7793 (52.5) | −0.10 | 0.16 | 0.73 |
| Fair | 4392 (22.1) | 2375 (17.2) | 2716 (18.3) | −0.33 | 0.50 | 0.50 |
| Poor | 1047 (5.3) | 577 (4.2) | 681 (4.6) | −0.06 | 0.33 | 0.61 |
| Very poor | 363 (1.8) | 137 (1.0) | 188 (1.3) | −0.05 | 0.38 | 0.58 |
| Number of chronic conditions | ||||||
| None | 6284 (31.6) | 5151 (37.3) | 5539 (37.3) | 0.50 | 0.70 | 0.37 |
| 1–2 | 7446 (37.4) | 5073 (36.8) | 5363 (36.2) | −0.12 | 0.99 | 0.06 |
| ≥3 | 6138 (31.0) | 3574 (25.9) | 3937 (26.5) | −0.38 | 0.59 | 0.44 |
| Limitations due to a health problem for at least 6 months | ||||||
| Not limited | 15,879 (79.9) | 11,675 (84.6) | 11,852 (79.9) | −0.03 | 0.004 | 0.96 |
| Limited | 3989 (20.1) | 2123 (15.4) | 2987 (20.1) | 0.03 | 0.004 | 0.96 |
| Physical activity during leisure time | ||||||
| No, I do not physical activity | 7941 (40.0) | 5790 (42.0) | 5326 (35.9) | −0.39 | 0.49 | 0.51 |
| Yes, I do physical activity | 11,927 (60.0) | 8008 (58.0) | 9513 (64.1) | 0.39 | 0.49 | 0.51 |
| Perceived personal social support | ||||||
| Low social support | 557 (2.8) | 402 (2.9) | 518 (3.5) | 0.06 | 0.90 | 0.21 |
| Normal social support | 19,311 (97.2) | 13,396 (97.1) | 14,321 (96.5) | −0.06 | 0.90 | 0.21 |
| GHQ-12 score | ||||||
| Absence of common mental disorders | 15,817 (79.6) | 10,931 (79.2) | 12,331 (83.1) | 0.33 | 0.72 | 0.36 |
| Presence of common mental disorders | 4051 (20.4) | 2867 (20.8) | 2508 (16.9) | −0.33 | 0.72 | 0.36 |
| Noise from outside the home | ||||||
| A great deal | 2513 (12.6) | 1441 (10.4) | 1377 (9.3) | −0.29 | 0.94 | 0.15 |
| Somewhat | 4048 (20.4) | 2756 (20.0) | 2766 (18.6) | −0.16 | 0.93 | 0.16 |
| None | 13,307 (67.0) | 9601 (69.6) | 10,696 (72.1) | 0.46 | 0.99 | 0.04 |
| Bad smells from outside | ||||||
| A great deal | 1644 (8.3) | 747 (5.4) | 816 (5.5) | −0.24 | 0.67 | 0.38 |
| Somewhat | 3327 (16.7) | 2005 (14.5) | 2150 (14.5) | −0.19 | 0.70 | 0.37 |
| None | 14,897 (75.0) | 11,046 (80.1) | 11,873 (80.0) | 0.44 | 0.69 | 0.38 |
| Poor quality drinking water | ||||||
| A great deal | 3831 (19.3) | 1717 (12.4) | 2323 (15.6) | −0.31 | 0.24 | 0.67 |
| Somewhat | 3889 (19.6) | 2387 (17.3) | 2961 (20.0) | 0.05 | 0.03 | 0.88 |
| None | 12,148 (61.1) | 9694 (70.3) | 9555 (64.4) | 0.26 | 0.09 | 0.80 |
| Dirty streets | ||||||
| A great deal | 3023 (15.2) | 1193 (8.7) | 1829 (12.3) | −0.23 | 0.15 | 0.73 |
| Somewhat | 5246 (26.4) | 2859 (20.7) | 3413 (23.0) | −0.28 | 0.30 | 0.63 |
| None | 11,599 (58.4) | 9746 (70.6) | 9597 (64.7) | 0.52 | 0.22 | 0.69 |
| Air pollution from nearby industry | ||||||
| A great deal | 923 (4.6) | 337 (2.4) | 367 (2.5) | −0.18 | 0.66 | 0.39 |
| Somewhat | 1432 (7.2) | 875 (6.4) | 829 (5.6) | −0.14 | 0.99 | 0.03 |
| None | 17,513 (88.2) | 12,586 (91.2) | 13,643 (91.9) | 0.33 | 0.85 | 0.25 |
| Air pollution due to other causes | ||||||
| A great deal | 1055 (5.3) | 558 (4.1) | 543 (3.7) | −0.14 | 0.89 | 0.21 |
| Somewhat | 2174 (10.9) | 1246 (9.0) | 1334 (9.0) | −0.16 | 0.70 | 0.36 |
| None | 16,639 (83.8) | 11,994 (86.9) | 12,962 (87.3) | 0.31 | 0.79 | 0.30 |
| Lack of green areas | ||||||
| A great deal | 4191 (21.1) | 1441 (10.4) | 1722 (11.6) | −0.83 | 0.60 | 0.43 |
| Somewhat | 3882 (19.5) | 2177 (15.8) | 2205 (14.9) | −0.41 | 0.85 | 0.25 |
| None | 11,795 (59.4) | 10,180 (73.8) | 10,912 (73.5) | 1.23 | 0.69 | 0.38 |
| Presence of animals causing a significance nuisance | ||||||
| A great deal | 2961 (14.9) | 1549 (11.2) | 2055 (13.8) | −0.08 | 0.05 | 0.84 |
| Somewhat | 3094 (15.6) | 2213 (16.0) | 2516 (17.0) | 0.13 | 0.96 | 0.12 |
| None | 13,813 (69.5) | 10,036 (72.8) | 10,268 (69.2) | −0.05 | 0.02 | 0.92 |
| Overall number of environmental problems perceived (Median ± Standard Deviation) | 2.4 (1.9) | 1.9 (1.9) | 2.0 (1.8) | −0.03 | 0.52 | 0.49 |
| Total (CMD) | Female (N = 26,462) | Male (N = 22,043) | ||||||||
|---|---|---|---|---|---|---|---|---|---|---|
| n (%) | OR (95% CI) | p-Value | ORa (95% CI) | p-Value | n (%) | OR (95% CI) | p-Value | ORa (95% CI) | p-Value | |
| 6114 (23.1) | 3312 (15.03) | |||||||||
| Years of the surveys | ||||||||||
| 2006 | 2891 (24.5) | Reference | <0.01 | Reference | <0.001 | 1160 (14.4) | Reference | <0.001 | Reference | <0.001 |
| 2011/2012 | 1687 (24.1) | 0.89 (0.88–1.11) | 0.91 (0.87–1.15) | 1180 (17.4) | 1.26 (1.15–1.37) | 1.52 (1.37–1.68) | ||||
| 2017 | 1536 (20.1) | 0.77 (0.72–0.83) | 0.89 (0.83–0.97) | 972 (13.5) | 0.93 (0.85–1.02) | 0.94 (0.85–1.04) | ||||
| Age group | <0.001 | <0.001 | ||||||||
| 16–24 years | 451 (19.2) | Reference | 246 (10.8) | Reference | ||||||
| 25–44 years | 2555 (21.3) | 1.14 (1.02–1.28) | 1441 (14.5) | 1.40 (1.22–1.62) | ||||||
| 45–64 years | 3108 (25.6) | 1.45 (1.30–1.62) | 1625 (16.5) | 1.64 (1.42–1.89) | ||||||
| Marital status | ||||||||||
| Single | 1560 (21.2) | Reference | Reference | 1258 (15.4) | Reference | |||||
| Married | 3419 (21.8) | 1.03 (0.97–1.11) | 0.34 | 0.75 (0.69–0.81) | 0.21 | 1687 (13.8) | 0.88 (0.81–0.95) | 0.001 | ||
| Widowed | 396 (36.2) | 2.11 (1.84–2.41) | <0.001 | 1.10 (1.08–1.25) | <0.001 | 56 (23.2) | 1.67 (1.23–2.26) | 0.001 | ||
| Separated or divorced | 739 (32.2) | 1.76 (1.59–1.96) | <0.001 | 1.16 (1.03–1.31) | <0.001 | 311 (23.0) | 1.64 (1.43–1.89) | <0.001 | ||
| Social class | ||||||||||
| Upper class | 955 (17.3) | Reference | <0.001 | 570 (12.7) | Reference | <0.001 | ||||
| Middle class | 2469 (22.8) | 1.41 (1.30–1.53) | 1321 (14.3) | 1.15 (1.03–1.27) | ||||||
| Lower class | 2690 (26.7) | 1.74 (1.60–1.89) | 1421 (17.0) | 1.41 (1.27–1.56) | ||||||
| Level of education | ||||||||||
| Without studies | 485 (37.1) | Reference | <0.001 | 168 (18.1) | Reference | <0.001 | Reference | <0.001 | ||
| Primary | 1335 (26.4) | 0.61 (0.53–0.69) | 642 (17.1) | 0.94 (0.78–1.13) | 0.96 (0.85–0.98) | |||||
| Secondary or PT | 3344 (23.4) | 0.52 (0.46–0.58) | 2016 (15.1) | 0.81 (0.68–0.96) | 0.80 (0.70–0.93) | |||||
| University | 950 (16.5) | 0.33 (0.29–0.38) | 486 (12.0) | 0.62 (0.51–0.75) | 0.53 (0.43–0.66) | |||||
| Nationality | ||||||||||
| Spanish | 5636 (22.7) | Reference | <0.001 | Reference | 3068 (14.9) | Reference | <0.01 | Reference | <0.001 | |
| Foreigner | 478 (28.5) | 1.35 (1.21–1.51) | 1.51 (1.33–1.71) | <0.001 | 244 (17.6) | 1.23 (1.06–1.41) | 1.56 (1.33–1.83) | |||
| Size of town of residence | ||||||||||
| <10000 inhab. | 1269 (21.6) | Reference | <0.001 | 742 (13.9) | Reference | <0.001 | ||||
| 10000–100000 inhab. | 2315 (23.7) | 1.12 (1.04–1.22) | 1269 (15.9) | 1.17 (1.07–1.30) | ||||||
| >100000 inhab. | 2530 (23.4) | 1.10 (1.02–1.19) | 1301 (14.9) | 1.08 (1.03–1.22) | ||||||
| Employment situation | ||||||||||
| Employment | 3293 (28.4) | Reference | <0.001 | Reference | 1761 (11.1) | Reference | <0.001 | Reference | <0.001 | |
| Unemployment | 2821 (19.0) | 1.69 (1.59–1.79) | 1.25 (1.17–1.34) | <0.001 | 1551 (25.1) | 2.68 (2.48–2.89) | 1.93 (1.77–2.10) | |||
| Self-perceived health status | ||||||||||
| Very good | 468 (9.3) | Reference | <0.001 | Reference | <0.001 | 301 (6.0) | Reference | <0.001 | Reference | <0.001 |
| Good | 2148 (15.7) | 1.82 (1.63–2.02) | 1.49 (1.34–1.67) | 1367 (11.1) | 1.94 (1.71–2.21) | 1.65 (1.44–1.87) | ||||
| Fair | 2277 (38.6) | 6.13 (5.50–6.84) | 3.10 (2.75–3.51) | 1016 (28.3) | 6.15 (5.40–7.05) | 3.17 (2.71–3.71) | ||||
| Poor | 873 (62.0) | 15.87 (13.75–18.32) | 5.76 (4.89–6.79) | 474 (52.9) | 17.49 (14.67–20.84) | 6.23 (5.06–7.67) | ||||
| Very poor | 348 (76.8) | 32.29 (25.45–40.97) | 10.93 (8.46–14.13) | 154 (65.5) | 29.60 (22.08–39.68) | 8.88 (6.42–12.28) | ||||
| Number of chronic conditions | ||||||||||
| None | 858 (10.8) | Reference | <0.001 | Reference | <0.001 | 772 (8.5) | Reference | <0.001 | Reference | <0.001 |
| 1–2 | 1746 (18.6) | 1.89 (1.73–2.06) | 1.43 (1.30–1.57) | 1202 (14.1) | 1.77 (1.60–1.94) | 1.28 (1.16–1.43) | ||||
| ≥ 3 | 3510 (38.2) | 5.09 (4.69–5.53) | 2.20 (1.99–2.42) | 1338 (29.9) | 4.59 (4.16–5.06) | 1.70 (1.51–1.92) | ||||
| Limitations due to a health problem for at least 6 months | ||||||||||
| Not limited | 3524 (16.8) | 0.23 (0.21–0.24) | <0.001 | 0.56 (0.52–0.61) | <0.001 | 1967 (10.7) | 0.20 (0.19–0.22) | <0.001 | 0.48 (0.43–0.53) | <0.001 |
| Limited | 2590 (47.2) | Reference | Reference | 1345 (37.2) | Reference | Reference | ||||
| Physical activity during leisure time | ||||||||||
| No, I do not physical activity | 2949 (26.9) | 1.43 (1.35–1.52) | <0.001 | 1.31 (1.23–1.40) | <0.001 | 1518 (18.8) | 1.56 (1.45–1.69) | <0.001 | 1.35 (1.24–1.46) | <0.001 |
| Yes, I do physical activity | 3165 (20.4) | Reference | Reference | 1794 (12.9) | Reference | Reference | ||||
| Perceived personal social support | ||||||||||
| Low social support | 470 (59.8) | 5.28 (4.56–6.11) | <0.001 | 3.55 (3.01–4.19) | <0.001 | 289 (41.8) | 4.36 (3.73–5.10) | <0.001 | 3.15 (2.63–3.76) | <0.001 |
| Normal social support | 5644 (22.0) | Reference | Reference | 3023 (14.2) | Reference | Reference | ||||
| Noise from outside the home | ||||||||||
| A great deal | 1014 (32.6) | 1.84 (1.69–1.99) | <0.001 | 1.17 (1.05–1.30) | <0.001 | 484 (21.8) | 1.79 (1.60–2.01) | <0.001 | ||
| Somewhat | 1335 (25.4) | 1.30 (1.21–1.40) | 1.05 (1.02–1.10) | 734 (17.0) | 1.31 (1.20–1.44) | |||||
| None | 3765 (20.8) | Reference | Reference | 2094 (13.5) | Reference | |||||
| Bad smells from outside | ||||||||||
| A great deal | 655 (33.9) | 1.90 (1.72–2.10) | <0.001 | 276 (21.6) | 1.69 (1.47–1.95) | <0.001 | ||||
| Somewhat | 1157 (27.0) | 1.37 (1.27–1.48) | 572 (17.9) | 1.34 (1.21–1.48) | ||||||
| None | 4302 (21.2) | Reference | 2464 (14.0) | Reference | ||||||
| Poor quality drinking water | ||||||||||
| A great deal | 1278 (28.2) | 1.50 (1.39–1.62) | <0.001 | 624 (18.7) | 1.41 (1.28–1.56) | <0.001 | ||||
| Somewhat | 1350 (26.3) | 1.37 (1.27–1.47) | 643 (15.6) | 1.14 (1.03–1.25) | ||||||
| None | 3486 (20.7) | Reference | 2045 (14.0) | Reference | ||||||
| Dirty streets | ||||||||||
| A great deal | 1077 (30.1) | 1.65 (1.52–1.79) | <0.001 | 465 (18.8) | 1.42 (1.27–1.59) | <0.001 | ||||
| Somewhat | 1635 (25.2) | 1.29 (1.20–1.38) | 810 (16.1) | 1.18 (1.08–1.29) | ||||||
| None | 3402 (20.8) | Reference | 2037 (14.0) | Reference | ||||||
| Air pollution from nearby industry | ||||||||||
| A great deal | 276 (29.6) | 1.44 (1.25–1.67) | <0.001 | 141 (20.3) | 1.48 (1.22–1.79) | <0.001 | ||||
| Somewhat | 484 (27.3) | 1.29 (1.16–1.44) | 232 (17.0) | 1.19 (1.03–1.38) | ||||||
| None | 5354 (22.5) | Reference | 2939 (14.7) | Reference | ||||||
| Air pollution due to other causes | ||||||||||
| A great deal | 412 (32.6) | 1.71 (1.51–1.93) | <0.001 | 203 (22.7) | 1.77 (1.50–2.08) | <0.001 | ||||
| Somewhat | 727 (27.1) | 1.31 (1.20–1.43) | 385 (18.6) | 1.37 (1.22–1.54) | ||||||
| None | 4975 (22.1) | Reference | 2724 (14.3) | Reference | ||||||
| Lack of green areas | ||||||||||
| A great deal | 1252 (29.3) | 1.57 (1.45–1.69) | <0.001 | 567 (18.4) | 1.40 (0.86–1.55) | <0.001 | ||||
| Somewhat | 1178 (25.4) | 1.29 (1.19–1.39) | 619 (17.0) | 1.27 (1.16–1.41) | ||||||
| None | 3684 (21.0) | Reference | 2126 (13.9) | Reference | ||||||
| Presence of animals causing a significance nuisance | ||||||||||
| A great deal | 1113 (29.0) | 1.48 (1.37–1.60) | <0.001 | 498 (18.3) | 1.34 (1.21–1.49) | <0.001 | ||||
| Somewhat | 1044 (24.4) | 1.17 (1.08–1.27) | 559 (15.8) | 1.13 (1.02–1.25) | ||||||
| None | 3957 (21.6) | Reference | 2255 (14.3) | Reference | ||||||
| Number of environmental problems perceived | Mean (SD) | 1.16 (1.14–1.18) | <0.001 | 1.29 (1.17–1.43) | <0.01 | Mean (SD) | 1.13 (1.11–1.51) | <0.001 | 1.18 (1.0.7–1.32) | 0.01 |
| 2.19 (1.89) | 1.99 (1.83) | |||||||||
© 2020 by the authors. Licensee MDPI, Basel, Switzerland. This article is an open access article distributed under the terms and conditions of the Creative Commons Attribution (CC BY) license (http://creativecommons.org/licenses/by/4.0/).
Share and Cite
Cebrino, J.; Portero de la Cruz, S. Environmental, Health and Sociodemographic Determinants Related to Common Mental Disorders in Adults: A Spanish Country-Wide Population-Based Study (2006–2017). J. Clin. Med. 2020, 9, 2199. https://0-doi-org.brum.beds.ac.uk/10.3390/jcm9072199
Cebrino J, Portero de la Cruz S. Environmental, Health and Sociodemographic Determinants Related to Common Mental Disorders in Adults: A Spanish Country-Wide Population-Based Study (2006–2017). Journal of Clinical Medicine. 2020; 9(7):2199. https://0-doi-org.brum.beds.ac.uk/10.3390/jcm9072199
Chicago/Turabian StyleCebrino, Jesús, and Silvia Portero de la Cruz. 2020. "Environmental, Health and Sociodemographic Determinants Related to Common Mental Disorders in Adults: A Spanish Country-Wide Population-Based Study (2006–2017)" Journal of Clinical Medicine 9, no. 7: 2199. https://0-doi-org.brum.beds.ac.uk/10.3390/jcm9072199