1. Introduction
In the United States, many dairy farms, particularly small dairy farms, have faced severe economic challenges in recent years [
1]. The total number of operating dairy farms in the country has decreased by 74.1% over the past 25 years, from 155,339 in 1992 to 40,219 in 2017 [
2]. This loss of farms has been matched by an equally dramatic increase in farm size among surviving operations as managers expand their herds to benefit from economies of scale. For example, from 1987 to 2012, the midpoint herd size (the number at which half of all cows come from larger farms and half from smaller farms) increased from 80 to 800 cows [
1]. Low, volatile milk prices, high input costs and quota reductions resulting from market oversupply are the primary factors contributing to these trends [
1].
In the state of Vermont, the dairy industry reflects the larger trends described above. For example, from 2009 to 2017, the number of dairy farms in Vermont decreased from 1051 to 780. At the same time, the average number of cows per farm increased from 128 to 164, with a simultaneous 66% increase in the number of farms with over 700 cows from 18 to 27 [
2]. Despite this increase in farm size, Vermont dairy herds are still much smaller than the national average, making them vulnerable to financial difficulties. In 2012, 61.1% of Vermont dairy cows were in herds smaller than 499 cows, compared with a national average of only 40% [
1]. In pursuit of financial viability, an increasing number of American dairy farmers in Vermont and many other states have decided to adopt organic production practices. In the United States, dairy farms are certified as organic according to federal standards set by the National Organic Program (NOP). The NOP requires that organic dairy cows spend at least 120 days on pasture and receive at least 30 percent of dry matter intake from pasture each year. It also limits synthetic inputs and mandates strict restrictions on antibiotic use. These requirements lead to generally reduced yields from certified farms, and require increased attention to pasture management and animal health. From 1997 to 2018, the number of certified organic dairies in Vermont increased from 35 to 198 [
3]. During this time, organic dairy farmers have typically received a significant premium over the conventional milk price [
4]. However, high organic grain prices and decreased yields under organic management have kept margins tight in this sector. Since 2017, the U.S. organic dairy industry has entered into a prolonged oversupply crisis, leading to low prices, quota reductions, and loss of contracts for organic dairy farms across the country [
5,
6]. Similar to conventional dairy farms, there are significant variations in management and profitability among organic dairy farms.
In this context, many farmers are looking for information on the management practices most strongly associated with profitability in organic dairy production. While much peer reviewed research has been published on the management variables influencing profitability in the dairy sector, little has focused on the organic dairy sector specifically. To address this gap in the literature, this paper analyzes financial panel data collected from Vermont organic dairy farms from 2006 to 2016. Specifically, this study identifies specific factors associated with the variation in profitability in organic dairy production, as measured by the return on assets (ROA), and quantifies the impact of each factor. The empirical findings may be useful for other organic dairy farmers, especially those in the Northeastern United States, looking to increase profitability. The findings could also be useful for policymakers, researchers, and extension staff concerned with organic dairy production in policy and research objectives, as well as for many conventional dairy farmers who are interested in organic operation.
This paper is organized into six sections. Following this section of introduction,
Section 2 presents an analytical framework-based literature review,
Section 3 describes the dataset and econometric methods,
Section 4 presents the empirical results,
Section 5 discusses the empirical findings in the context of the literature, and
Section 6 summarizes the conclusions and primary implications of this study.
2. Analytical Framework
To address the relative lack of dairy profitability research focused specifically on organic production, this article adapts theories and methods commonly used in analysis of conventional farms to an organic context. The objective of this study is to answer the following research question: are there farm management variables associated with the variation in profitability among Vermont organic dairy farms?
Farm management research has long focused on trying to understand the variables influencing farm profitability. To do so, it is necessary to choose an appropriate functional form. Gloy, Hyde, and Leduc have developed a useful economic model of profit maximization in dairy production [
7]. In their production function, “
pi is the price of output
i,
qi is the production function for output
i which determines the amount of product
i produced”,
x is a vector of
n inputs including farm asset endowment, labor and rented land, and α is a vector of farm characteristics and management practices. The cost of inputs (
w) and amount of output (
qi) determine the total cost. The constraining condition in the model reflects the fact that initial conditions including factor endowments affect the profit maximization decision. According to function
gj, “total demands for n inputs (
xj) subject to these conditions cannot be greater than the initial endowments of the inputs (
Xj)”. This model is shown below.
This model suggests that farm profitability is determined by farm assets and farmer management and that their variation across farms determines the variation in profitability. In order to determine the factors influencing variation in profitability across farms, it is thus necessary to account for variation in farm size, farm management, input costs, and milk price.
While farm profitability can be measured by alternative variables, this study uses the return on assets (ROA), defined below, as previous research has identified it as one of the most effective measurements for comparing dairy profitability across farms in this context.
ROA is an indicator used to address the limitations of standard farm profitability indicators like net farm income. ROA is often favored as an indicator of profitability because it is a relative measure that allows researchers to compare farms of diverse size, number of operators, and financing [
7]. In the formula above, net farm earnings (NFE) are defined as the combined cash and accrual income of a farm business after all production expenses have been subtracted, including unpaid labor and management. In order to make the ROA variable independent of debt/equity ratios, yearly interest payments are also subtracted from net farm earnings. Finally, farm assets are averaged from the beginning to the end of each year to get an estimate of the value of the actual assets used in production [
8]. Because farm assets are accounted for, variations in ROA make it possible to analyze changes in farm profitability as a difference in percentage return on investment. Changes in ROA can reflect management changes, price shifts, asset liquidation, and other factors.
ROA is used here as the dependent variable in farm profitability because it makes it possible to isolate the profitability effects of management factors independent of farm asset endowment, which is the goal of this study. Another important consideration in selecting ROA is to preserve continuity with other analyses of this dataset, particularly in the work of Parsons et al. [
9], Dalton et al. [
10], and Krug [
8]. By using this dependent variable, it is much easier to compare the results of this analysis to yearly profitability reports and other materials prepared and published by previous researchers.
The primary independent variables common in the literature on dairy profitability can be divided into six categories, shown below.
These categories fit in well with the dairy production function described above, with feeding management, general management and farm characteristics comprising α, milk price represented by pi, and input costs and year variables combined as w. The literature on each variable type is described below.
Feeding management variables are common independent variables in much of the dairy profitability literature. According to the 2017 data from the Economic Research Service (ERS) of U.S. Department of Agriculture (USDA), homegrown and purchased feed costs made up 51.3% of total milk production costs in 2017 [
2]. For this reason, how feed is managed has been shown to have a significant impact on total costs and net revenues. In numerous studies, an increase in fed grain was correlated strongly with both increased milk production per cow and increased profitability [
7,
11,
12]. As a higher milk output per cow is often a result of increased grain feeding, this is a useful variable when quantifying feeding management practices. To be effective, however, use of this variable must be accompanied by information on purchased and homegrown feed costs [
10,
13]. As such, purchased feed costs are also included this study, along with hay and grain accrual income.
Other feeding management variables that have been shown to be significant include forage quality [
14], stocking rate [
15], pasture yield and utilization [
16] and the value of homegrown forages [
2]. These are not available in the Vermont organic dairy dataset and are not considered. However, their inclusion would strengthen any future model.
Farmer management ability has been identified as another key independent variable. Rougoor et al. argue that much variation in farm profitability can be attributed to this factor [
17]. Some variables that have been used to estimate management ability include the adoption of financial management practices [
7], use of technology, and demographic factors like age, gender, education level, farm location, family size, race, and off farm income [
8,
9].
While all of the above variables are useful proxies for management ability, they are not available in the UVM dataset. For this reason, the following available management variables are considered. Changes in depreciation costs reflect purchasing and other management decisions [
18]. High government payments indicate farmer willingness and capacity to spend time applying for grants and other programs [
1]. Those farms that have higher levels of government payments are those who have prioritized participation in conservation or margin support programs, both primary sources of government funds. Debt level, repairs, and veterinary costs are other available management variables in the dataset. These variables are consistent with economic theory and are also included in this study.
Farm size is also strongly correlated with farm profitability. This has held true in a number of studies on both conventional [
7,
19], and organic production [
8]. This is due to economies of scale and the ability of larger farms to spread fixed costs across more animals, decreasing costs per cow and enabling smaller profit margins [
1]. While most studies include size as a variable, some have utilized a farm matching methodology to control for this variable [
20].
Milk price and input costs are also important independent variables in most profitability models because both directly affect revenues and costs. Milk prices and input costs (including feed, fuel, supplies, custom harvest and labor costs) are included in some way in most of the studies discussed above models. Milk price data also helps to account for milk quality since received prices include quality and components bonuses. A final variable often included in dairy profitability analysis is the year data were collected. Due to broad weather and climate constraints, the inclusion of dummy variables for each year makes it possible to control for industrywide yearly variation not explained by price and input costs [
7,
21].
3. Materials and Methods
The variables described in the above literature review have all been used effectively in previous analyses of dairy profitability. While some research has used experimental, farm simulation, and case study approaches to collecting quantitative farm management information, survey-based methods remain the most common in farm profitability research. A review of previous research reveals multi-year financial panel data as the best approach to answer questions about variables impacting farm profitability.
Survey-based techniques are useful because they enable researchers to assess the effects of various factors on profitability while holding other variables equal across a population of farms. These approaches are dependent upon a sufficiently rich dataset involving a large population (N) and tend to involve cross-sectional data analysis. Most dairy profitability researchers have focused on gathering representative data from as large a group of farmers as possible. Recent projects have focused on dairy farmers at national [
20,
22], regional [
23,
24] and statewide [
12,
15] scales. National survey projects have tended to rely on ARMS and NASS data, while regional and state projects have designed their own survey instruments. Regional and state level studies have the advantage of less climate and geographic variation, although they are not representative of national economic conditions.
Survey research on organic dairy specifically has focused on profitability differences among various production systems [
20,
24], on factors associated with the adoption of alternative practices [
25,
26], and on the costs of organic dairy production [
22,
23]. Despite this rich comparative literature, none of the above studies have examined the effects of specific management and industry factors on organic dairy farm profitability. In a thorough review of the literature on organic dairy, only a few authors [
8,
11] focus on this topic in any detail, leaving this important matter largely untouched.
To address this research gap, it is necessary to turn to research in the conventional dairy context. The most common approach that has been used in evaluating specific factors associated with dairy profitability is the collection and analysis of financial panel data from multiple farms over time. Hsiao reviews the various advantages of panel data [
27]. In the case of farm budget data, panel data makes it possible to track farms under the same management and resource conditions over time and variations in weather and input and output prices. These advantages give dairy profitability studies based on panel data unique value. Several recent studies have taken this approach [
8,
10,
28,
29].
In Vermont, the University of Vermont (UVM) and the Northeast Organic Farming Association of Vermont (NOFA), Richmond, VT, USA) have compiled panel data on organic dairy farm finances since 2004, with an average yearly N of 35. Data are collected by UVM extension staff and outside consultants who utilize a combination of in-person farm visits, farm budgets and tax documents to ensure accuracy. While early uses of this data were limited to assessing dairy profitability in general, subsequent analysis has started to focus on identifying specific management and demographic factors associated with profitability. Krug identifies use of feed mixing machinery, amount of grain fed, use of Holstein cows, and animal health as significant variables associated with the profitability of organic dairy farms in this dataset [
8]. However, a comprehensive analysis of the full 10 years of financial data has not yet been published. This type of analysis will be a useful contribution to the literature on organic dairy profitability in northern New England.
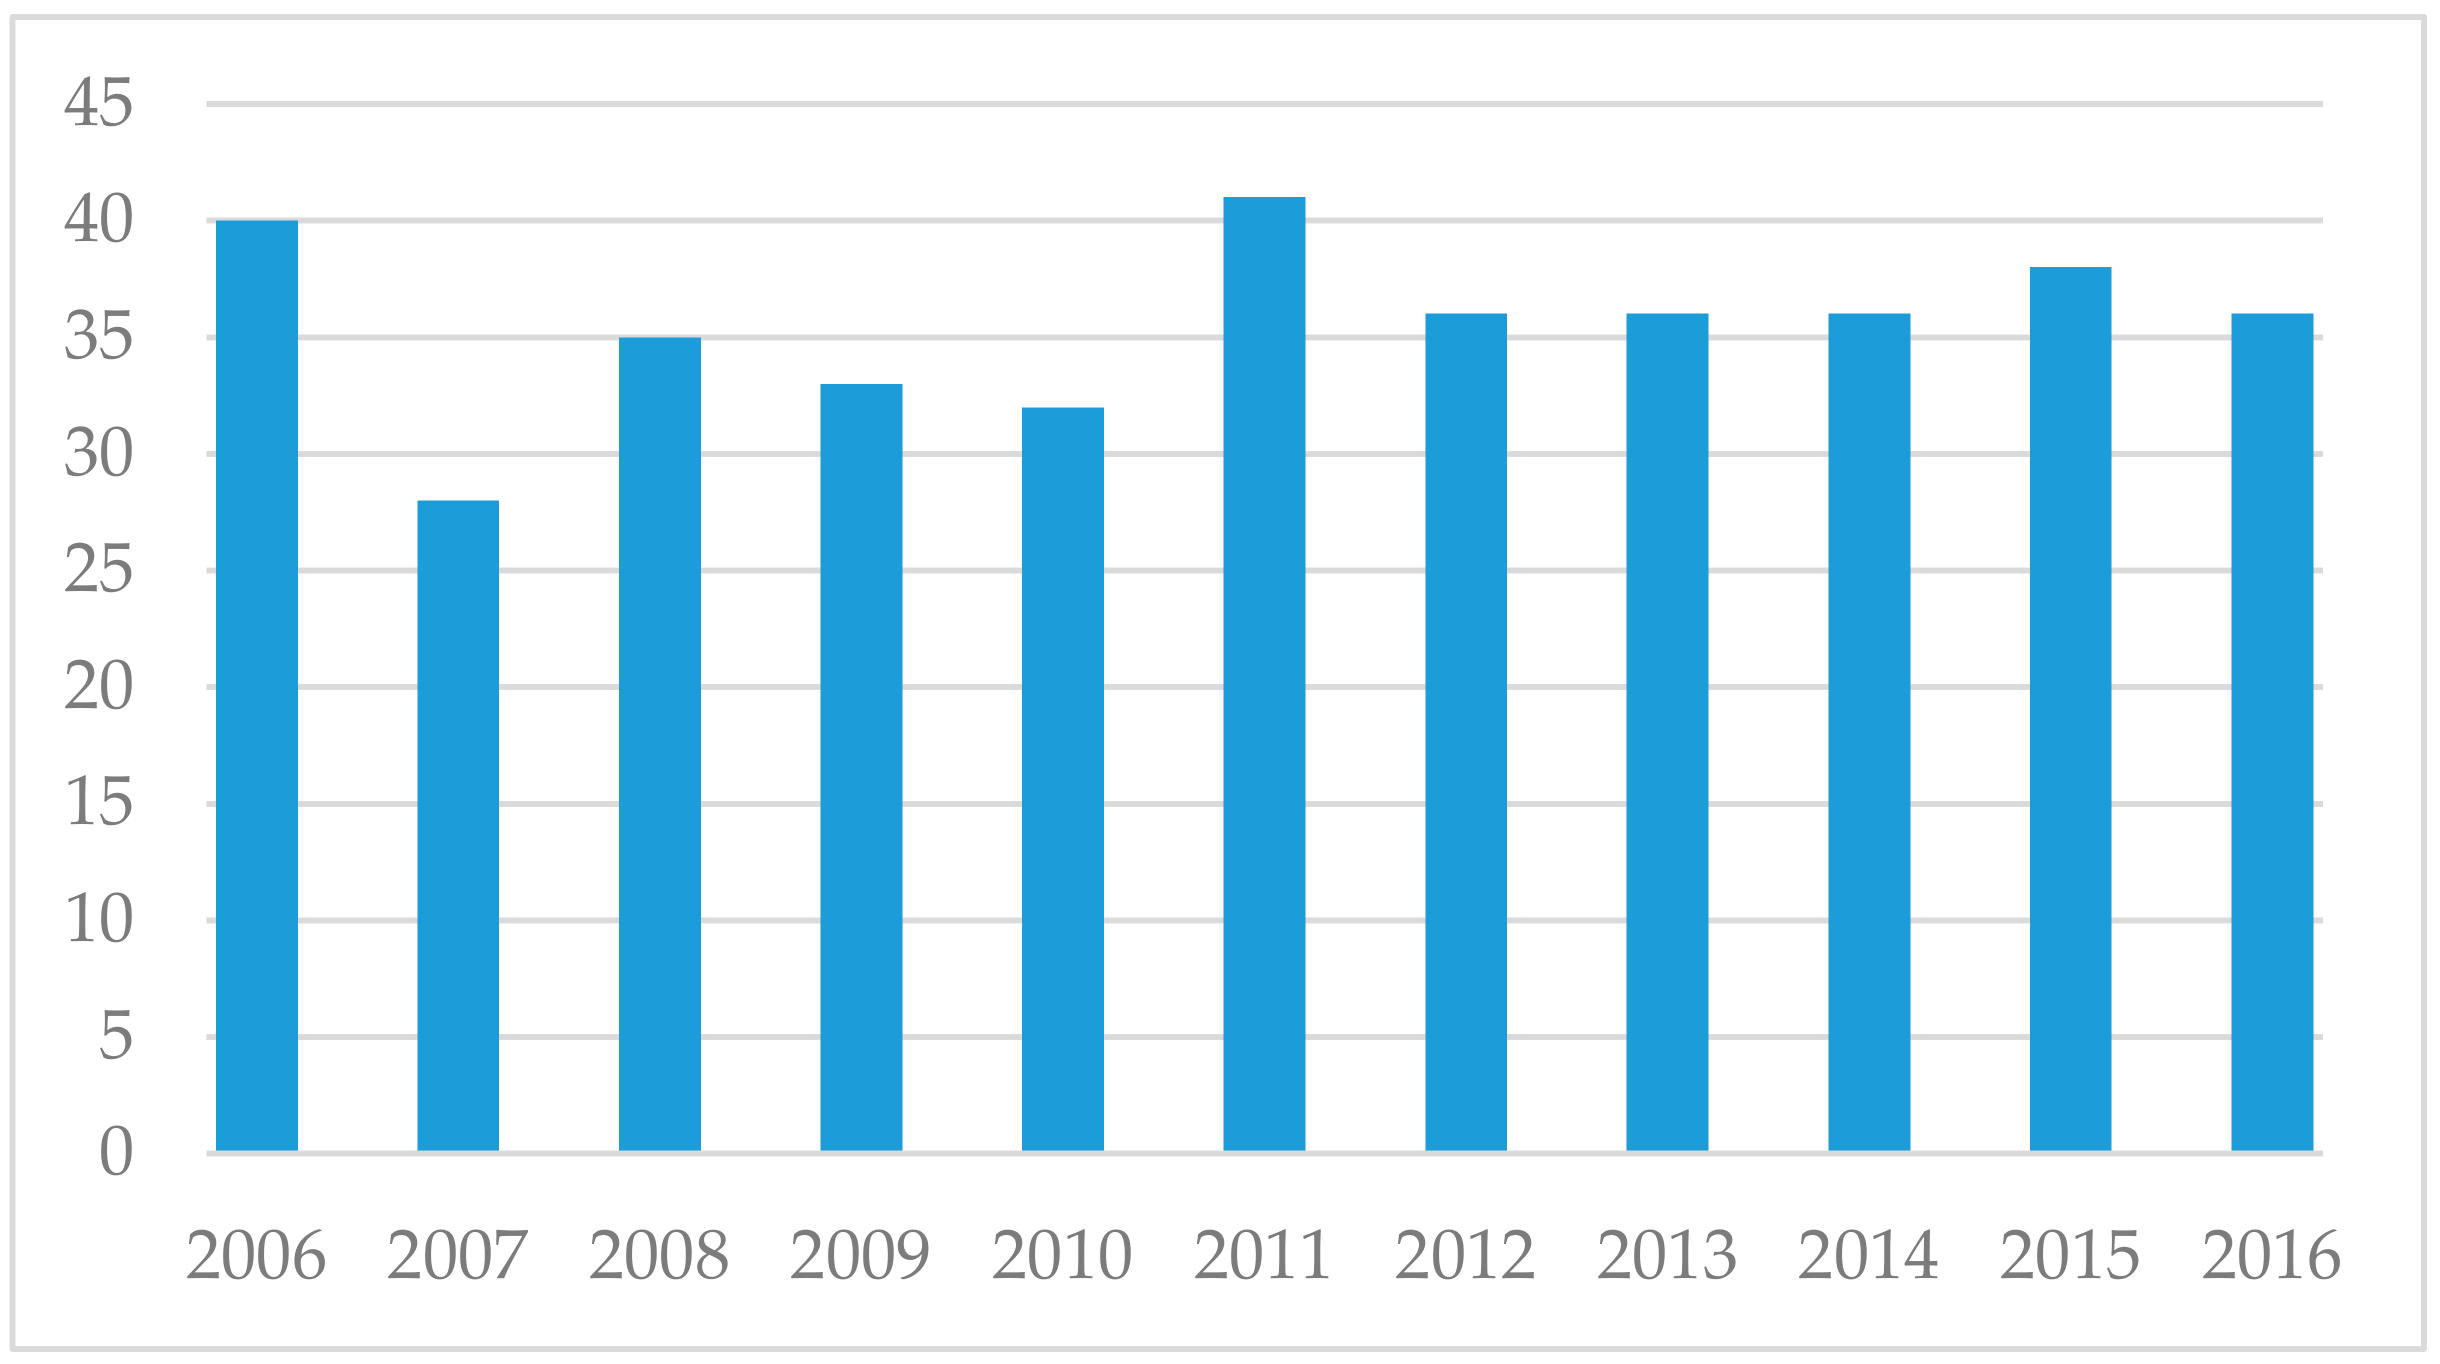
Given the difficulties of scheduling interviews and the busy schedules of farmers, various farms have entered and left the study over the years, leading to an unbalanced panel of farms. While a core group of 10 farms has participated in all 10 years of the study, all other farms missed at least one year, with 13 farms participating in less than three years.
Figure 1 shows the number of farms in the dataset for each year of the study.
While useful, the dataset used in this analysis does have some significant drawbacks. First is the unbalanced nature of the panel dataset. As farm entry and exit into the study may be correlated with both dependent and independent production variables, a biased model could result. Methodological responses to this issue are addressed later in this section. A second drawback of this dataset is the small sample size of farmers for each year. Given the involved nature of data collection, it is possible that certain types of organic dairy operations were more likely to participate, introducing bias. While the data collection team made effort to randomly sample farms, this was in many cases, not possible. This small sample size means that the dataset is not representative of any large population of dairy farmers. At most, this dataset can only be interpreted as representative of the experiences of small organic dairy farmers in Vermont. Summary statistics reflect the typical profile of an average study participant.
Analysis of the 10-year dataset was conducted to generate descriptive statistics for the study population during the time period 2006–2016. Each participating farm in each year was used as a datapoint. Data are divided into farm production, income, expense, and financial benchmark categories.
Table 1 contains key production variables for farms participating in the Vermont organic dairy study. Farms in the study were relatively small, with 66.33 cows on average. The smallest farm in the study milked an average of 19.5 cows, while the largest milked 321. By comparison, the average conventional dairy in northern New England milked 403 cows in 2016 (NDFS 2016). The mean number of pounds shipped per cow was 13,261.31, with a total average yearly herd production of 904,081 pounds. Received milk price ranged between 25.80 and 46.76 USD per hundredweight, with an average of 32.73 USD. Notably, even the lowest organic price was higher than the 2011–2016 average conventional price of 20.06 USD per cwt.
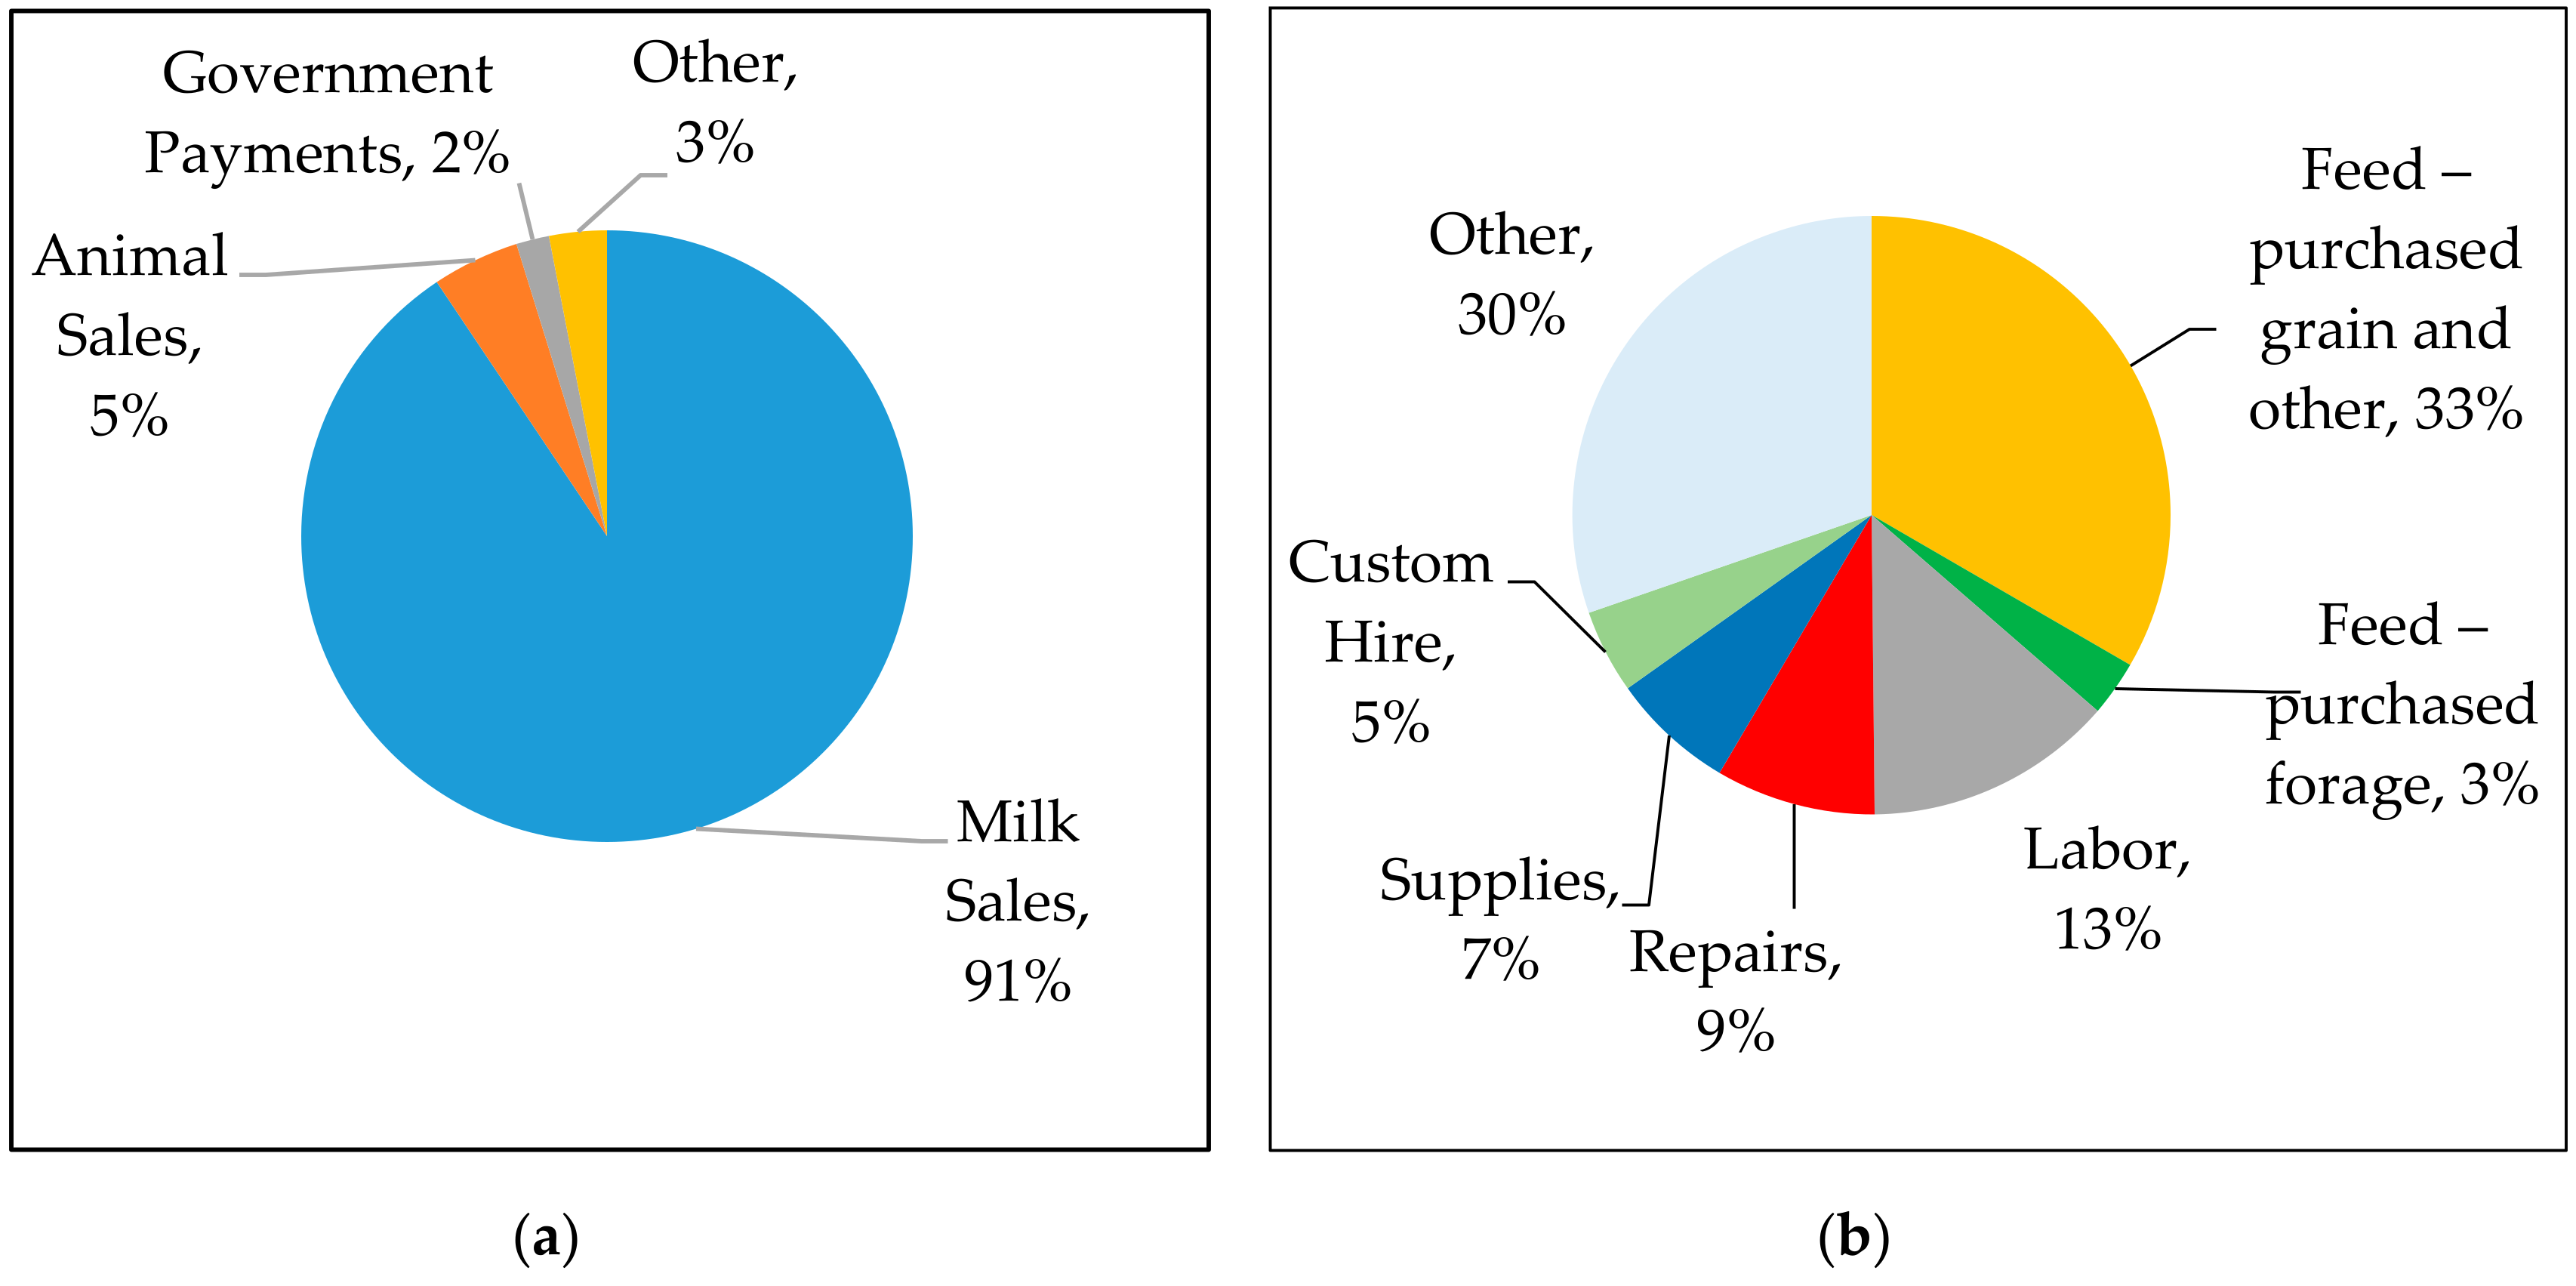
The distributions of average organic farm revenues and cash expenses are reported in
Figure 2 with more detained data presented in
Table A1 and
Table A2 in the
Appendix A.
Figure 2a and
Table A1 in the
Appendix A document itemized mean farm earnings among organic dairy farms in this study. Farms received income from a variety of sources. The largest portion of farm earnings by far was milk sales, with an average of 294,813.15 USD per farm, followed by cull cow sales at 7882.48 USD. Dairy cow sales totaled 5769.55 USD. After milk and animal sales, the next highest income source was government payments at 5687.86 USD. This category includes NRCS cost share programs, certification refunds, and other government support. Other income categories are shown below. In total, total cash receipts per farm averaged 326,307.38 USD.
Figure 2b and
Table A2 in the
Appendix A show average cost of production information for farms in the study, While the study group is not perfectly representative of conditions in Vermont or the US, this information is likely to be useful for farmers and extension staff in making farm business decisions. Some highlights are worth mentioning. Purchased feed was by far the biggest expense for organic dairy farms, with purchased grain averaging at 81,675.70 USD and purchased forages at 7,358.14 USD. Cost data on farm-grown forages were not collected in this study, but are reflected in other expense categories. Labor was the next biggest expense at 33,014.14 USD, followed by repairs at 21,174.14 USD and supplies at 16,403.01 USD. Utilities, fuel, and custom hire were the next highest cash expenses.
The last category of data collected in the organic dairy study concerns farm financial performance, and can be seen in
Table A3 in the
Appendix A. In general, participating farms were somewhat profitable across the 10 years of the study. Yearly Net Cash Farm Earnings averaged 81,363.53 USD, with Net Farm Revenue (including accruals) somewhat lower at 55,309.70 USD. To accurately compare financial performance across farms with varying degrees of capitalization, average assets and equity were recorded for each farm and year and used to generate ROA and ROE. Mean ROA in this study group was 2.4%, with ROE averaging 1.1%.
Dairy profitability studies based on panel data tend to utilize a few common methodological approaches. Some studies do not use econometric analysis at all, focusing instead on summarizing key variable averages and performing basic financial analysis on farms by cluster [
10,
23]. The most common econometric approach taken when a panel dataset is available is to develop a fixed effects model in order to control for unobserved farm attributes that might affect profitability. In the case of dairy production, profitability is strongly influenced by innate, non-time variant factors like land quality, location and management ability. These factors are also likely highly correlated with the regressors in the model. This can lead to a biased Ordinary Least Squares (OLS) estimator [
7,
8,
30,
31]. In order to remove these fixed effects from the model and obtain a nonbiased estimator using OLS, it is necessary to mathematically transform the regression equation. One common method is a time demeaning fixed effects (FE model). Time demeaning works by subtracting each farm’s yearly cost and income data from the average values of all datapoints for that farm across time. This shifts the model from measuring the effects of the absolute value of each dependent variable to measuring the effects of deviation in each variable from the farm average.
Through the above process, the demeaning transformation is able to eliminate time-invariant unobserved factors for each farm. If it is also possible to assume that the remaining idiosyncratic error is uncorrelated with the dependent variables, and that that the error term is a homoscedastic and serially uncorrelated across t, this fixed effects model can yield an unbiased Ordinary Least Squares (OLS) estimator [
31]. A similar outcome can also be achieved through first differencing (FD), in which each year’s equation for each farm is subtracted from that of the year before. When compared with time demeaned fixed effects, FD estimators lose more information in a situation of unbalanced panel data. With an FD model, each missing year value represents a loss of two years’ worth of data rather than one. When a dataset is unbalanced, there is a compelling argument for focusing on a fixed effects model using time demeaning. Given the unbalanced nature of the study panel, this is the approach utilized in this paper.
Running a time demeaned fixed effects model on a panel dataset of dairy farms makes it possible to effectively measure the impact of different variables on farm profitability as measured by ROA. This study performs such an analysis on an updated version of the Vermont organic dairy dataset previously collected by UVM researchers. Specific methods of econometric analysis are discussed below.
In preparation for analysis, data were collected from each farm and consolidated into spreadsheets by year. These sheets were further consolidated so that each farm in each year made up a separate row in preparation for fixed effects analysis. The data were then analyzed using a pooled OLS regression on the variables described in the above production model. Once the data were recorded, each variable for each farm was time demeaned across the total number of years the farm was a part of the study. The outputs of this demeaning were saved in a separate dataset. At this time, dummy variables for each study year were generated and included in the demeaned dataset. Next, the time demeaned data were put through a standard regression model as described above. Residuals (u) of this regression were recorded and squared, and then regressed on the independent variables to check for heteroscedasticity. Collinearity statistics were also recorded. In accordance with the study plan, variables found to be insignificant at the 0.05 level were next removed from the model. F tests were performed to see if this restricted model lost any explanatory power. Dummy variables for each year were kept in the model after an F test revealed them to be significant as a group of variables.
5. Discussion
The R
2 and Adjusted R
2 values for the above model are fairly low at around 0.3. Given the complex factors affecting farm profitability, this is unsurprising, as variables have likely been omitted that would increase the predictive value of the model. This R
2 is similar to those in other dairy farm profitability studies [
8,
12], although some use a non-financial parameters approach 0.5 [
7]. Despite their low predictive value, the results do show a significant relationship between farm management factors and profitability as measured by ROA. This is reflected in the F statistic for no fixed effects, which shows significance at the 0.01 level. Significant relationships between specific management factors and profitability also exist across all variable categories. In feeding management, results reflect past research findings that increased lbs milk per cow is associated with profitability [
7]. Milk per cow is strongly influenced by feeding management.
The value of both grain and non-grain purchased forages have a negative relationship with profitability in this study, consistent with economic theory that increased input costs per cow is likely to decrease profitability. While not typically included in the literature, hay accrual income is positively correlated with profitability in this dataset, reflecting the positive effects of successful harvest and storage of farm grown forages. In general, results confirm that farms that increase per cow milk output and those that reduce purchased feed costs tend to be more profitable.
General management characteristics indicated by depreciation, government payments and debt are also all significant in the regression model. Depreciation is difficult to interpret because this value is based on scheduled accrual reductions, but farms who purchase more new equipment and buildings in a year tend to have increased depreciation for several years, until depreciation is complete. The data shows a negative relationship with profitability. Debt level and government payments both display a significant positive relationship with profitability. While inclusion of these variables is not common in the literature, their significance in this model suggests the use of their consideration in future studies.
Farm size is one of the most commonly included variables in dairy profitability analysis, and typically displays a positive relationship with ROA [
7,
8,
21]. This is also the case in this study—each one cow increase in size is associated with a 0.001 increase in ROA, the strongest estimated relationship in the model. This finding is unsurprising given the broad consensus in the literature that economies of scale represent a profitable management approach for many dairy farmers [
1].
As a direct component of total milk sales, it is unsurprising that average milk price received demonstrates a strong relationship with profitability in this dataset. With a B value of 0.0003 and a significance of 0.000, milk price is a key variable in this model. This is consistent with the profitability maximization model described in
Section 2, which includes milk price (
pi) as a variable [
7].
The final independent variables in the model are input costs, represented through Utilities and Fuel and Oil costs. Increases in either input are associated with significant decreases in profitability, consistent with the economic model in
Figure 1. Both included input cost variables are significant at the 0.01 level. In general, these results reject the null hypothesis of no relationship between farm management factors and profitability. More importantly, they provide evidence for statistically significant relationships between ROA and particular management variables across several categories. This finding is in line with the findings of previous researchers cited in the literature review.
Given the complex factors associated with farm profitability, the variables identified in this research represent only part of the picture. While eliminating fixed effects like management ability and capitalization makes it possible to isolate specific management factors, these effects are likely some of the most important determinants of farm financial success. In addition, due to a small sample size and imperfect randomization, results cannot be interpreted as representative of national or regional dairy farm populations. However, given the lack of published Vermont-specific econometric analysis, results are likely to be useful in the context of organic dairy in Vermont.
6. Conclusions and Implications
Research into dairy profitability tends to focus on isolating and identifying the effects of various management factors on farm profitability. Most of this research has been focused on conventional dairy operations, leading to a gap in the literature on organic dairy profitability. This study addresses this gap by analyzing a 10-year panel dataset of Vermont organic dairy farm finances using OLS regression on a time demeaned fixed effects model of dairy profitability. This analysis finds evidence of significant relationships between ROA and feeding management, farm management, farm characteristic, input cost, and milk price variables on Vermont organic dairy farms.
The above results point to several important implications of this article for researchers, farmers, and policymakers. First, from a research perspective, the evidence outlined above indicates that the factors associated with profitability on the organic farms analyzed in this study are consistent with those identified in the previous literature on conventional dairy profitability. While continued econometric research into organic dairy production may identify subtle differences, this analysis demonstrates that conventional dairy research can be useful in designing future studies on organic dairy. In addition, the results presented here demonstrate the limitations of a purely financial approach to farm management research. Future studies would do well to incorporate non-financial variables like feeding efficiency, total land under production, cow breed, DMI intake from various sources, farmer demographics, and labor utilization. The addition of this type of variable would likely increase the explanatory power of any econometric model for dairy production.
These results also have implications for applied farm management. While many key variables were not able to be included in the model, results suggest that shifts in farm management can improve farm profitability outcomes. As shown above, reducing feed costs, improving milk quality (and thus price), and leveraging debt are all associated with increased profitability. While these variables are not easy to change, results may be useful in setting farm management goals and objectives.
Finally, policymakers in Vermont and across the United States may find the results of this research useful. In line with previous research into dairy farming, this thesis provides evidence that milk price is one of the most important variables determining the financial success or failure of dairy farms in Vermont. In looking to maintain the viability of Vermont’s traditional dairy industry, policymakers should consider price supports or supply management programs focused on keeping milk prices up for both organic and conventional producers. In addition, increased funding for extension education in pasture and feeding management may help to improve the farm management factors shown to have a strong influence on farm profitability.
Oversupply and price reductions in 2017, 2018 and 2019 have plunged American organic dairy producers into a new profitability crisis. As farmers look for ways to stay in business, economic research measuring factors associated with profitability will remain important for farmers, extension educators, and policymakers. Future research should build upon the work presented here by combining farm finance data with detailed production and demographic information to identify more nuanced management variables associated with increased profitability.


