Biodiversity of Weeds and Arthropods in Five Different Perennial Industrial Crops in Eastern Poland


Department of Systems and Economics of Crop Production, Institute of Soil Science and Plant Cultivation—State Research Institute, Czartoryskich 8, 24-100 Puławy, Poland
*
Author to whom correspondence should be addressed.
Agriculture 2020, 10(12), 636; https://0-doi-org.brum.beds.ac.uk/10.3390/agriculture10120636
Submission received: 28 October 2020
/
Revised: 4 December 2020
/
Accepted: 9 December 2020
/
Published: 14 December 2020
(This article belongs to the Special Issue Innovations and Perspectives of Industrial and Bioenergy Crops for Bioeconomy Development)
Abstract
:A growing interest in the cultivation of non-food crops on marginal lands has been observed in recent years in Poland. Marginal lands are a refuge of agroecosystems biodiversity. The impact of the cultivation of perennial industrial plants on the biodiversity of weeds and arthropods have been assessed in this study. The biodiversity monitoring study, carried out for three years, included five perennial crops: miscanthus Miscanthus × giganteus, cup plant Silphium perfoliatum, black locust Robinia pseudoacacia, poplar Populus × maximowiczii, and willow Salix viminalis. As a control area, uncultivated fallow land was chosen. The experiment was set up in eastern Poland. A decrease in plant diversity was found for miscanthus and black locust. The diversity of arthropods was the lowest for the cup plant. No decrease in the number of melliferous plants and pollinators was observed, except for the miscanthus. The biodiversity of plants and arthropods was affected by the intensity of mechanical treatments, the fertilization dose, and the use of herbicides. The biodiversity also decreased with the age of plantation.
1. Introduction
There are many commonly accepted definitions of marginal (fallow) lands. This category includes a wide range of lands that historically has been used for agricultural purposes, but for some reason, their cultivation has been abandoned. The reasons for land marginalization in Poland are of different nature, including local agricultural decline, infrastructural changes, and soil pollution. However, the most important factor of land abandonment is the low productivity potential of the soils. The area of agricultural land excluded from agricultural use reached over two million hectares in Poland in 2018, more than half of which are located on low-quality soils [1]. Perennial industrial crops might be a promising alternative to marginal land utilization. The cultivation of the most productive species, such as willow and poplar, on marginal lands, can be economically viable and bring some environmental benefits [2,3]. On the other hand, some studies indicate perennial industrial crops lead to environmental changes and a decline in biodiversity [4,5,6]. The impact on biodiversity may vary on the species grown and the used technology. The biodiversity of agroecosystems is largely related to the landscape and crop diversity. On a homogeneous agricultural landscape, perennial industrial crops can introduce an element of landscape enrichment and create new habitats [7,8,9]. On the other hand, cultivation of such crops might be carried out on lands that are valuable from the perspective of biodiversity conservation. Marginal lands are known to be the biodiversity hotspots in agroecosystems, therefore, the way of their management should take it into consideration [10,11,12,13].
Biodiversity plays an important role for agriculture by providing ecosystem services. Marginal lands are the habitat of melliferous plants that provide pollen and nectar for the honeybee Apis mellifera L., as well as for wild pollinators. The feed collected from fallow lands is not contaminated with pesticides, in contrast to that collected from most crops and orchards [14]. The fallow lands are also a living habitat for wild pollinators. Wild bees are crucial for certain crops and there are endangered by habitat loss. Many beneficial organisms such as ladybird beetles Coccinellidae and parasitic wasps Ichneumonidae, Aphidiinae live and reproduce in such habitats [15]. Simultaneously, the management of these lands can be quite challenging. The establishment of the new perennial industrial crop plantation requires intensive weed management both by mechanical and chemical means in the year before plantation establishment. This results in an immediate loss of biodiversity. In general, regardless of the choice of the crop species, it is recommended to increase the density of plantings, due to the expected losses of plants (survival rate). There is no doubt that the cultivation of industrial crops on marginal lands (mostly of poor agricultural quality) will require more inputs than on the land of better agricultural quality [16,17,18].
The introduction of industrial plants to fallow land does not necessarily lead to a loss of biodiversity in the long term. In most cases, perennial crops require less input than annual crops. In particular, species cultivated in long production cycles reduce the use of plant protection products, fertilizers, and soil disturbances such as tillage. Native crops, such as willow, are the basis of the trophic chain, feeding numerous arthropod taxa. Most fast-growing plants provide benefits for bees and wild pollinators. The litter, formed under perennial crops, can be a convenient habitat for animals that are not able to survive on arable lands [19,20,21]. The impact of the cultivation of these plants on biodiversity depends on many factors, including the adopted indicators and assessment methods used [22].
The study aims at closing existing knowledge gaps about the impact of industrial perennial crops on biodiversity. The biodiversity of such crops is usually compared to other industrial crops or other annual crops. Moreover, the evaluation of different crops is often made at different sites. Additionally, studies rarely use marginal lands as a control object. Consequently, the added value of the work is the comparison of biodiversity impact of industrial species cultivation under the marginal ground conditions, including the variant with no agricultural management.
As the first hypothesis (H1), it was presumed that perennial industrial crops can significantly affect the diversity of flora and fauna of marginal lands. This hypothesis is strongly supported by previous studies, especially in the case of floral diversity [6,7]. However, the outputs may be different on marginal lands, as such sites are of insufficient agricultural quality. Cultivation of common agricultural crops on soils of such quality carries the risk of crop cultivation failure. This might open the living space for wild flora, and other wild organisms that benefit biodiversity. On the other hand, the cultivation of crops on marginal lands with increased cultivation intensity may lead to biodiversity loss. The commonly known and accepted dependencies may prove to be missed in those specific conditions.
The study aims at closing knowledge gaps on biodiversity levels on marginal lands which most likely differs under different industrial crop cultivation conditions [16,17,18]. Marginal lands are usually managed in a different way than agricultural lands of good quality. The impact of the cultivation of crops commonly considered to be beneficial for wild biodiversity, such as willow, can differ when grown under optimal conditions, or under marginal land conditions. Therefore, the second hypothesis was constructed (H2): The diversity of plants and arthropods will be different in each of the tested crops under the conditions of marginal lands. Therefore, choosing the right crop species should mitigate the loss of biodiversity.
The agricultural management used in specific crops is entirely dependent on farmer management strategy. In order to obtain an optimal yield, basic agrotechnical recommendations must be followed, as well as the adaptation of agrotechnology to marginal soil conditions. Literature study shows that cultivation technology and the intensification of agrotechnical treatments significantly impact biodiversity [4,5,6,7,8]. However, it is not certain whether the same mechanical and chemical treatments will have a similar effect on marginal lands as on other agricultural lands. These uncertainties were the foundations of the third hypothesis (H3): The level of biodiversity of fauna and flora will depend on the intensity of agricultural management practices of perennial industrial crops cultivated on marginal lands.
2. Materials and Methods
2.1. Experiment Setup
The research was conducted in the years of 2018–2020 in the Experimental Station of Institute of Soil Science and Plant Cultivation in Osiny near Puławy in Lublin Province in the eastern part of Poland (51°27′59.2” N 22°02′48.7” E). Soil-water conditions were typical for marginal land in Poland. The soil was classified to the 5th class (1st—the best soil class, 6th—the poorest soil class), weak rye soil complex. The groundwater surface was located at an average depth of 2–2.5 m. The acidity (pH in KCl) of cultivated soils near the direct vicinity of the experiment was on average 5.5; however, the soil under industrial crops had lower values of soil acidity (pH = 4.5). The soil was with the prevalence of medium and weakly clay sands as well as small deposits of gravel. In the soil profile, there was a poorly permeable layer of clay at the depth from 50 to 100 cm. The average humus content was 1.06%. At the time of the experiment, the average nitrogen content in soil was 37.8 mg N-NO3 100 g−1, phosphorus 22.4 mg P2O5100 g−1, and potassium 12.4 mg K2O 100 g−1. The content of magnesium in soil was 4.9 mg MgO 100g−1 and calcium 70 mg CaO 100 g−1. The maximum water capacity at the depth of 15 cm was 36%, but during the drought, soil humidity was below 5%. The sum of rainfall in the growing season, which in Eastern Poland is from April to late October was 492.2 mm in 2018 and only 380.9 mm in 2019.
2.2. Structure of Field Experiment
The experiment was carried out on 5 plots with industrial species cultivation and on one control plot. Miscanthus × giganteus Greef and Deuter was cultivated on a 280 m2 plot, at a distance of 135 m from the control area. Prior to the beginning of the experiment, different miscanthus cultivars were grown on that plot for the last 10 years (and were still there when the experiment started). The density of crops at the time of planting was 15 thousand plants ha−1, in a 0.75 × 1 m spacing. Over time, the surface of the experiment was almost completely covered with miscanthus. There were few spots covered with perennial weeds as a result of frost damage to miscanthus. In each year of cultivation, the sum of NPK fertilization was 78-60-90. The fertilization consisted of two treatments. In early April, a multicomponent fertilizer Polifoska 6 (NPK: 6-20-30) was applied at a dose of 300 kg ha−1. Another fertilization was applied in mid-May at a dose of 188 kg ha−1 ammonium nitrate (N = 32). At the end of April, chemical weed control using the herbicide MCPA (Chwastox Extra 300SL) was applied at a dose of 1 kg ha−1. The was no mechanical weed control between rows of miscanthus during the time of the experiment. The plant biomass was harvested in the first week of March. An average dry biomass yield was 17.7 Mg ha−1 in 2018 and 10.3 Mg ha−1 in 2019.
The cup plant Silphium perfoliatum L. plot was of 300 m2 and was not differentiated into varieties. The cultivation of cup plant was directly adjacent to the control object. The year 2018 was the first year of growing this plant. The plantings were obtained from seeds. They were grown under greenhouse conditions from January 2017. In mid-April of 2018, the plants were planted in the field. A spacing of 0.5 × 1m was applied, in order to reach 20 thousand plants per ha. Losses of seedlings on the plantation were replenished from the reserves. The seedlings were irrigated, a total of 1000 dm3 of water per 300 m2 of cultivation was used. In the first and second year of cultivation, inter-row cultivation was performed with a soil tiller. Weeds were also removed by hand. The fertilization scheme was exactly the same as in the miscanthus cultivation. The biomass was harvested in January. In the first year, 2.4 Mg ha−1 of dry mass was obtained, and in the second year 7.5 Mg ha−1 was obtained.
Black locust Robinia pseudoacacia L. was cultivated on an area of 3300 m2. Cultivation of black locust was separated from control by a distance of 850 m, but the soil conditions were very similar. The cultivation was established 9 years before the beginning of the monitoring. The trees were spaced at 1.5 × 0.5 m, achieving a density of 13 thousand plants per hectare. No mineral fertilization or chemical plant protection treatments were used in black locust cultivation. In May, weeding was carried out between the rows with a mulching mower and by a power scythe. The field was cultivated in a 9-year cycle, the yield was harvested in three phases. Over a period of 3 years, one-third of the plantation was harvested annually. An average annual dry biomass yield was 12.0 Mg ha−1.
Poplar Populus × maximowiczii Henry plantation was grown on 4500 m2 area and consisted of 14 varieties. Cultivation of poplar was directly adjacent to the control object and to the cup plant plot. The plantation was established in April 2017 at a density of 18 thousand plants per ha. The cuttings were planted in two-row strips with rows spaced every 0.75 m. The strips were spaced every 1.5 m. The cuttings in each row were planted every 0.50 m. At the beginning of May of the first year of the cultivation, 30 kg N ha−1 of ammonium nitrate was applied. In 2018, NPK fertilization in the dose of 78-60-90 ha−1, using Polifoska 6 fertilizer and ammonium nitrate was applied, along with miscanthus and cup plant fields fertilizations. In 2019 and 2020, no fertilizers were used. In the beginning of May 2018, the herbicide Quizalofop-p-ethyl (Supero 05EC) at dose of 50 g ha−1 was applied. In the late May, the treatment was repeated using Quizalofop-p-ethyl at the same dose, combined with neonicotinoid insecticide Acetamiprid (Mospilan 20SP) at a dose of 20 g ha−1. Between 2019 and 2020, chemical weed control was no longer necessary. The biomass harvest was performed in February, dry biomass yield was 9.6 Mg ha−1 in 2018 and 11.1 Mg ha−1 in 2019.
Willow Salix viminalis L. was cultivated on an area of 3400 m2. Distance between willow crop and control plot was 150 m. The plantation was established in April 2016 and consisted of 11 varieties. The same planting technology was used as for poplar. In May 2018, a dose of 300 kg ha−1 of Polifoska 6 multi-compound fertilizer was applied, introducing a total of 18 kg N, 60 kg P2O5 and 90 kg K2O per ha. In 2019 no fertilization was used. In 2020, fertilization in the same dose as in 2018 was applied again. In 2018and 2019, no chemical plant protection products or agrotechnical treatments were used in willow cultivation. In January 2020, biomass was collected from the entire field, so there was a risk of higher weed infestation during the regrowing of the willow. Soil tillage was carried out in the paths using a soil tiller in the mid-April and mowing between rows using power scythe in the first decade of June. In mid-June, the insecticide deltamethrin (Decis Mega 50 EW) was applied at a dose of 12.5 g ha−1, due to strong pressure from the Amphimallon solstitiale L. beetle on the regrowing willow. In the first week of May, a herbicide quizalofop-p-ethyl (Labrador Extra) at a dose of 50 g ha−1 was applied.
An uncultivated area in the direct vicinity of industrial crops has been selected as a control plot. The area of the fallow land was 450 m2. In the recent years, it was an arable land, the use of which was suspended in 2017, for the purpose of the experiment. There were no fertilization or chemical weed control treatments on this area during the experiment. The spontaneous development of wild vegetation was allowed. Only in the mid-June 2019 cultivation was a tractor flail mulcher carried out. The control plot was designed to simulate marginal land conditions.
2.3. Fauna and Flora Monitoring
The species richness of the flora was examined in mid-June from 2018 to 2020. Five measurements were taken annually in each crop and in the control plot, using a 0.5 × 1 m botanical frame. Measurements were taken every 5 m. Samples were taken in one, 30-meter long transect. In smaller plots, e.g., in a miscanthus and a cup plant, the transect was taken across the plot. All plant specimens in the frame were identified to the species at the place of the experiment. In total, 15 repetitions were obtained for each variant.
The study of arthropod fauna took place over a period of two weeks in mid-June in three consecutive years. Monitoring of the fauna consisted of a system of two types of traps. The fauna living on the soil surface was collected by pitfall traps, 8 cm in diameter and 300 cm3 capacity. Each trap was filled up with 100 cm3 of glycol with a detergent, which was grey liquid soap. The container was covered with a 12 cm diameter canopy to protect against precipitation. In each crop, three traps were set up, with 10 m spacing between traps. The traps were set for a period of two weeks. After each invertebrate collection (harvests) the traps were removed and washed. Three harvest cycles were made, one per year. In each year the traps were set over again, in the same locations. In three years, nine repetitions were obtained from each plot. The traps were set in the place where vegetation measurements were taken (Table 1).
The second type of traps were yellow bowls (30 cm wide). The bowls were filled with 1:1 solution of glycol and water in the amount of 2 dm3. As a detergent, gray liquid soap was added. The solution was supplemented if the hot weather caused evaporation. Yellow traps were placed on a platform. The height of placing of the traps was adjusted to the height of the vegetation, (it varied from 30 to 100 cm). In each crop, two yellow bowls were placed at a distance of 10 m from each other (Table 1). The collection was carried out for two weeks, just as in the case of pitfall traps. After monitoring, bowls and platforms were removed from the fields. During three years of the experiment, six samples were obtained from each plot. After a period of two weeks, the collected material was filtered through a sieve (1 × 1 mm) and preserved with 75% ethanol solution. The collected invertebrates were sorted and determined into orders, families, and species. The material was determined using standard identification keys.
2.4. Statistical Analysis
Species were assigned to families and orders. Ecological functions of individual species were determined. Identified plant species were divided according to their suitability for pollinators, as melliferous and non-melliferous. The arthropods were divided due to their impact on crops as pests and natural enemies of them (serving as biological pest control). For bowl traps also a category of pollinators was added, for pitfall traps detritivores category was added. The data were accompanied by crop parameters such as: the age of the crop, the plot area, the fertilizer doses, the number of mechanical and chemical treatments, and the dry mass yield (DM) of the crop. The results of flora monitoring were also compared with the results of fauna monitoring, in order to identify the impact of wild plant diversity on the arthropod population. The biodiversity indicators, including Shannon’s Index and the Dominance Index, were counted using the Past3 software. For most data sets, a distribution different from normal was observed, therefore non-parametric tests were chosen for statistical analysis. The differences between the data distributions were analyzed using the Kruskal–Wallis test, followed by the post-hoc Tukey’s test in STATISTICA 10 software. The values of Shannon’s Index and Simpson’s Dominance Index in subsequent years were compared using the Hutcheson’s t-test. The influence of factors on the obtained results was described by means of a multiple regression model. Only statistically significant results were presented. The control object was excluded from factor analyses.
3. Results
3.1. Diversity of Weeds
A total of 90 weed flora measurements were made during the three consecutive years of the study. A total of 66 species of weeds were found, representing 22 families within 16 orders. Almost all specimens were identified to species level (Table 2).
The number of species in different crops was found to vary significantly (chi2 = 62.06, p < 0.01). In the control site, which was fallow land, 32 species were found in total, while the median of the species number was 9. The average (median) number of species was the highest on the control site. The total number of species found in cup plant plantation was the same as on the control site (32), but on average (median) there were 2 weed species less in the cup plant than on fallow land. Ten species were found in total in miscanthus (with a median value of 3 species). Fourteen weed species were found in black locust, with a median value of 3. In poplar, 24 species were found in total, with an average (median) of five. Twenty-eight species were found in total in willow, with 7 species average (median). Cup plant and willow did not differ significantly in weed species number between with the control object (fallow land). The average number of species found in miscanthus, black locust and poplar were significantly lower than those obtained in the control. In addition, some significant differences in weed number were observed for different crops (chi2 = 23.68, p < 0,01). The average number of species was significantly greater for the cup plant than for the miscanthus, black locust, and poplar. The number of weed species of willow was significantly greater than for miscanthus and black locust. There was significantly more weed species found in Poplar than in miscanthus. There were no significant differences in species number between willow and poplar, black locust and poplar, and black locust and miscanthus (Table 2). Significant differences were found between miscanthus and other tested objects, with the exception of the black locust. The results indicate that weed diversity of willow, poplar, and cup plant is lower than the control object, but the differences are low (Table 2). In the case of all crops, the number of wild plants (weeds) per m2 was significantly lower than in the control object (fallow land). This is undoubtedly the effect of the domination of crops over weeds. The number of melliferous plants in the tested crops was also analyzed (chi2 = 35.99, p < 0.01). Only the miscanthus had a significantly lower number of melliferous plants than the control. Additionally, significantly more melliferous plants were found in the cup plant than in the miscanthus. The remaining crops did not differ significantly. Significantly more plants which were not beneficial for pollinators were found on the unmanaged fallow land than in the cultivation of perennial industrial plants (chi2 = 41.13, p < 0.01). On the basis of these observations, it can be concluded that there are fewer wild plants in perennial crops than on fallow land, but weeds of fallow land represent mostly species that are not suitable for pollinating insects. This means that tested perennial crops, with the exception of miscanthus, should provide at least the same level of food for pollinators as fallow land. The results of the comparison of plant biodiversity indicators using the Kruskal-Wallis ANOVA test are shown in Table 3.
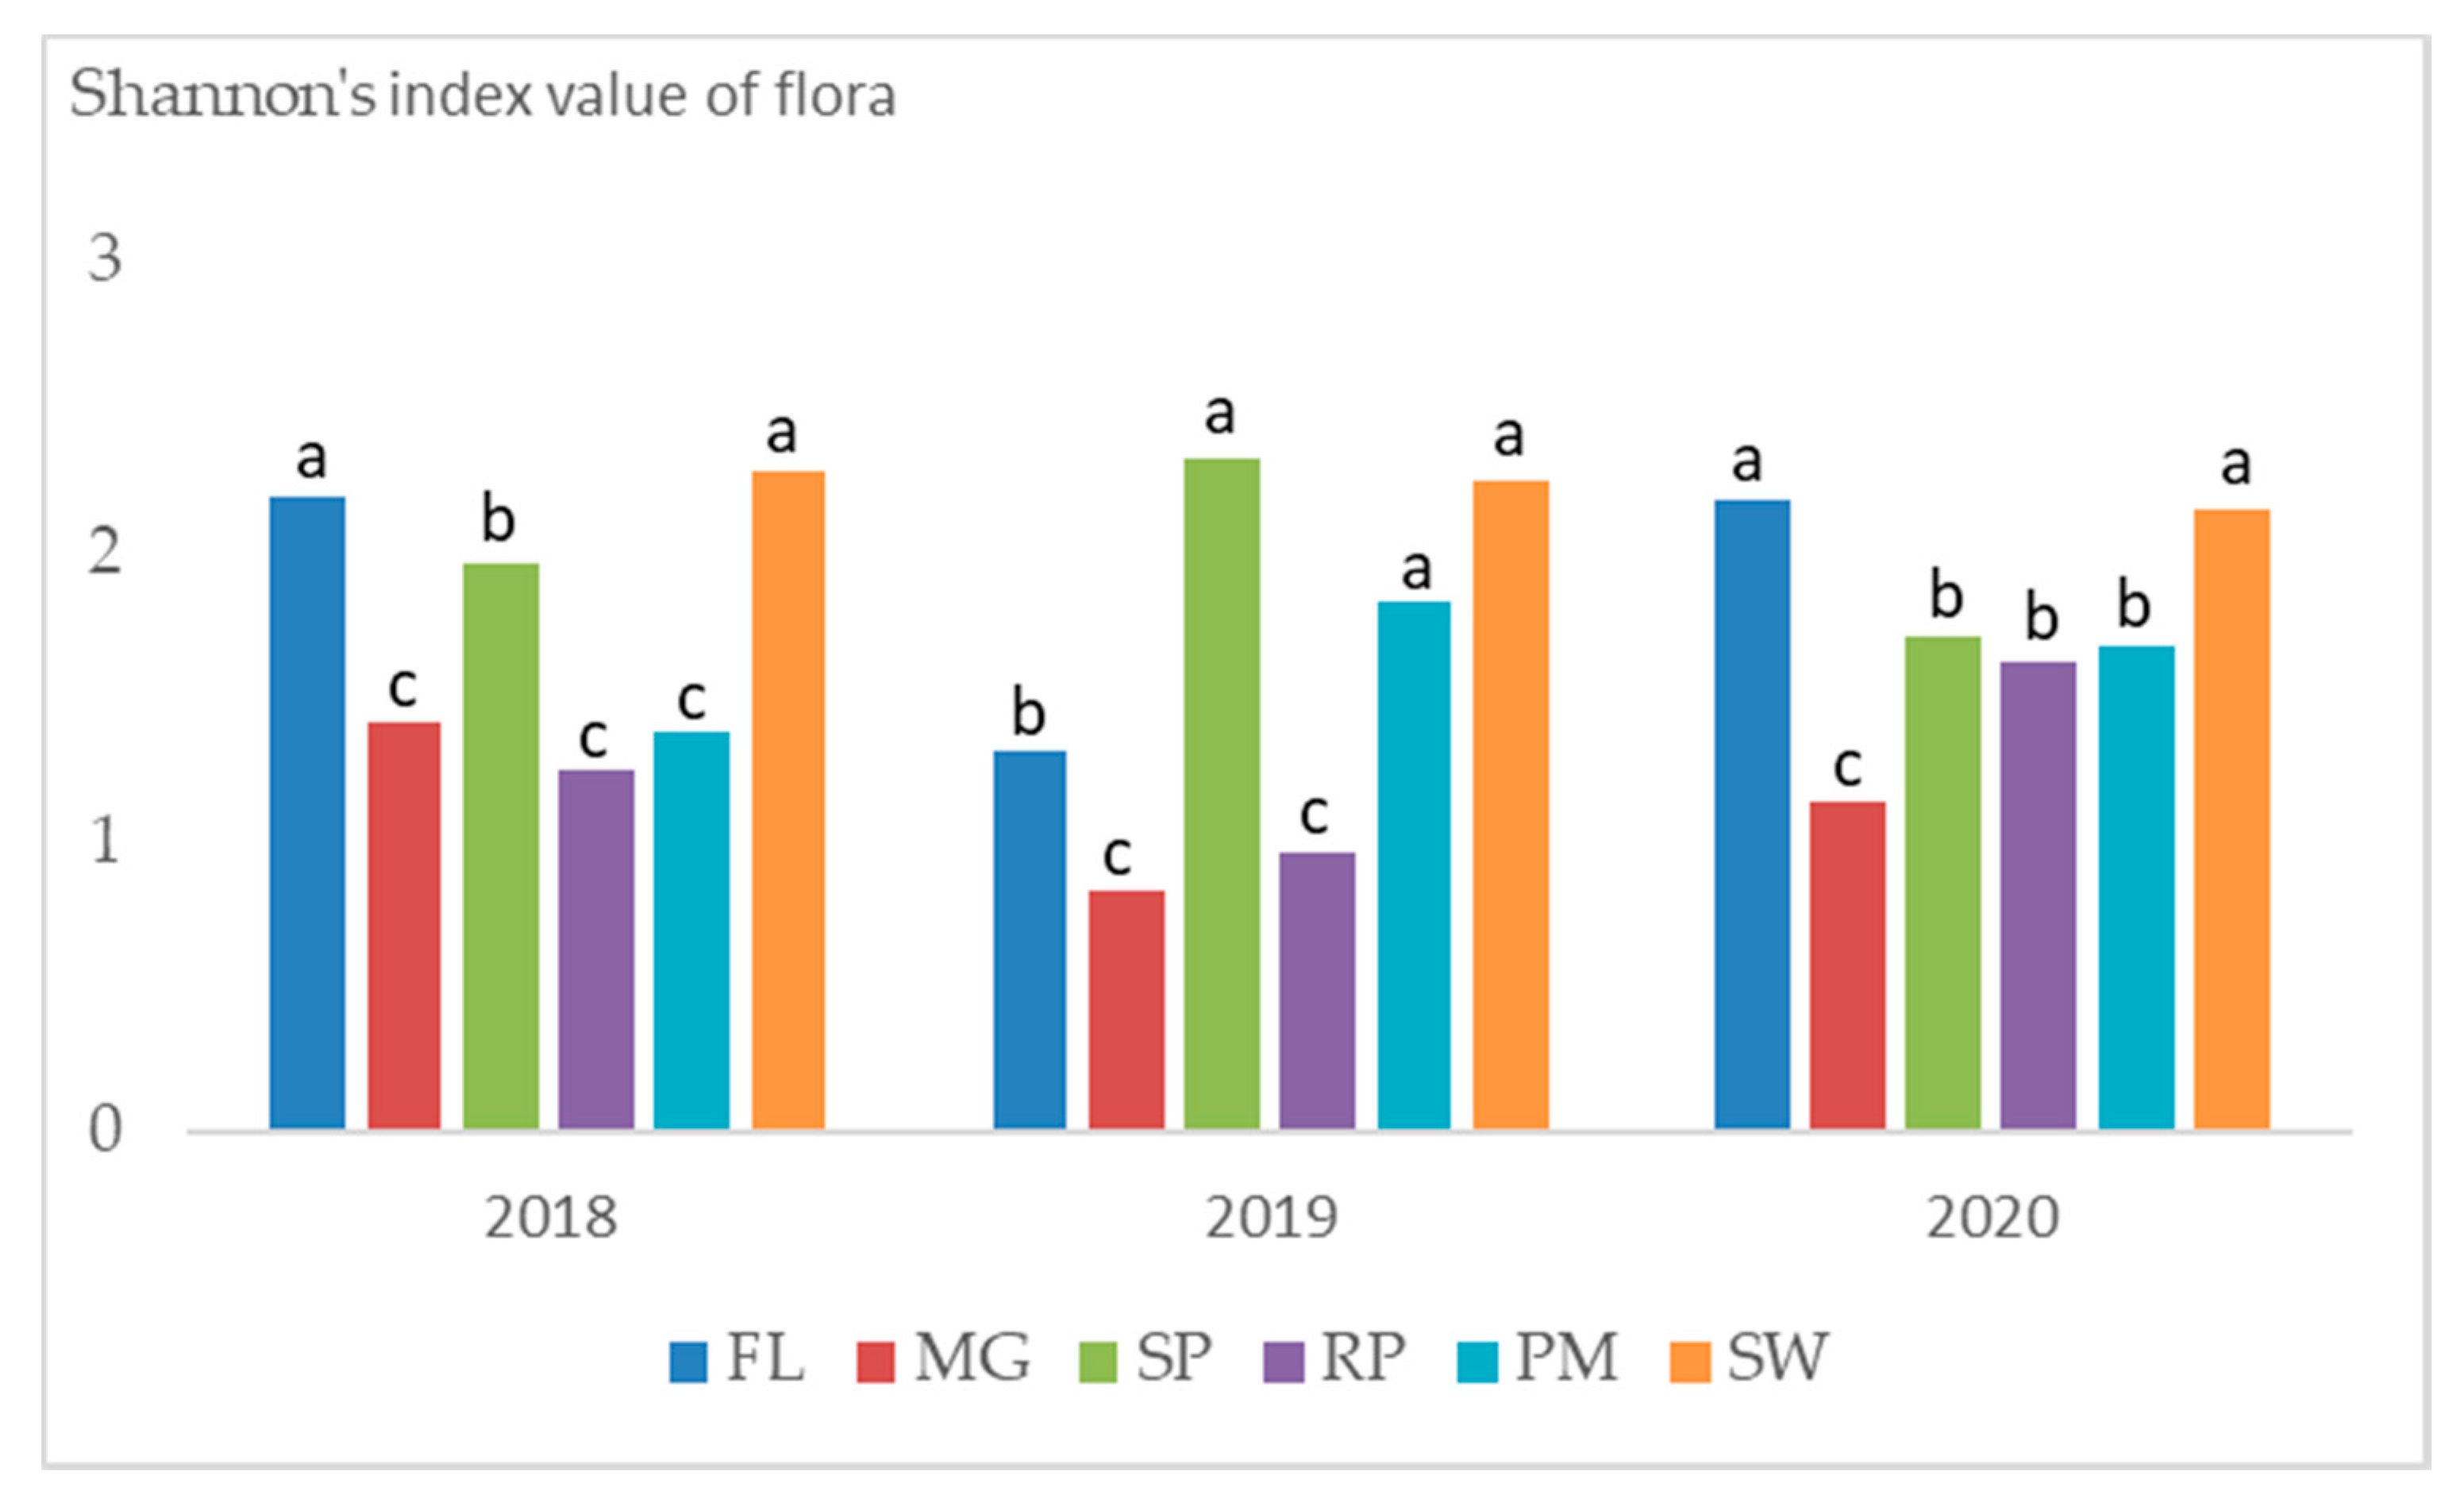
The results from each year were tested with Hutcheson’s t-test for Shannon’s biodiversity index. Significant differences (p < 0.01) were found between tested crops and control in individual years. In the first year of the study, lower plant biodiversity was found in miscanthus, black locust, and poplar than in cup plant, willow, and control plot. The Shannon diversity index in the cup plant was lower than in the control and willow cultivation. In the second year of the study, a decrease in plant diversity on the control plot was observed which resulted in significantly higher results of Shannon index in the cup plant, poplar, and willow (than on fallow land). The Shannon diversity index of weeds of miscanthus and black locust crops was lower than in the control in 2019. Shortly after biodiversity monitoring in 2019, inter-row cultivation was carried out in control and in black locust, which increased the diversity of weeds in the next year. In 2020, fallow land and plantation of willow had the highest level of Shannon index diversity of weeds (Figure 1). The diversity of weeds also increased in black locust, after the application of inter-row cultivation. Miscanthus had the lowest Shannon diversity index each year. The increase in plant diversity in poplar can be explained by the drought observed in 2019, which caused litter damage and exposing the soil, which allowed for weed seeds germination. The decrease in weed diversity in willow cultivation could be explained by the biomass harvest at the beginning of 2020. In spring 2020, it was possible to undertake attempts to mechanically limit weed infestation in the re-growing willow. In 2018 and 2019, in the cup plant field, the inter-row cultivation was applied, which was not carried out in 2020 due to the rapid growth of the plant. Most likely, the observed decrease in diversity was associated with the abandonment of weed management treatments or with the soil shading by the crop (or both). The impacts of agrotechnical factors on the diversity of the weed flora is analyzed in more detail in Figures 3–8 in this study.
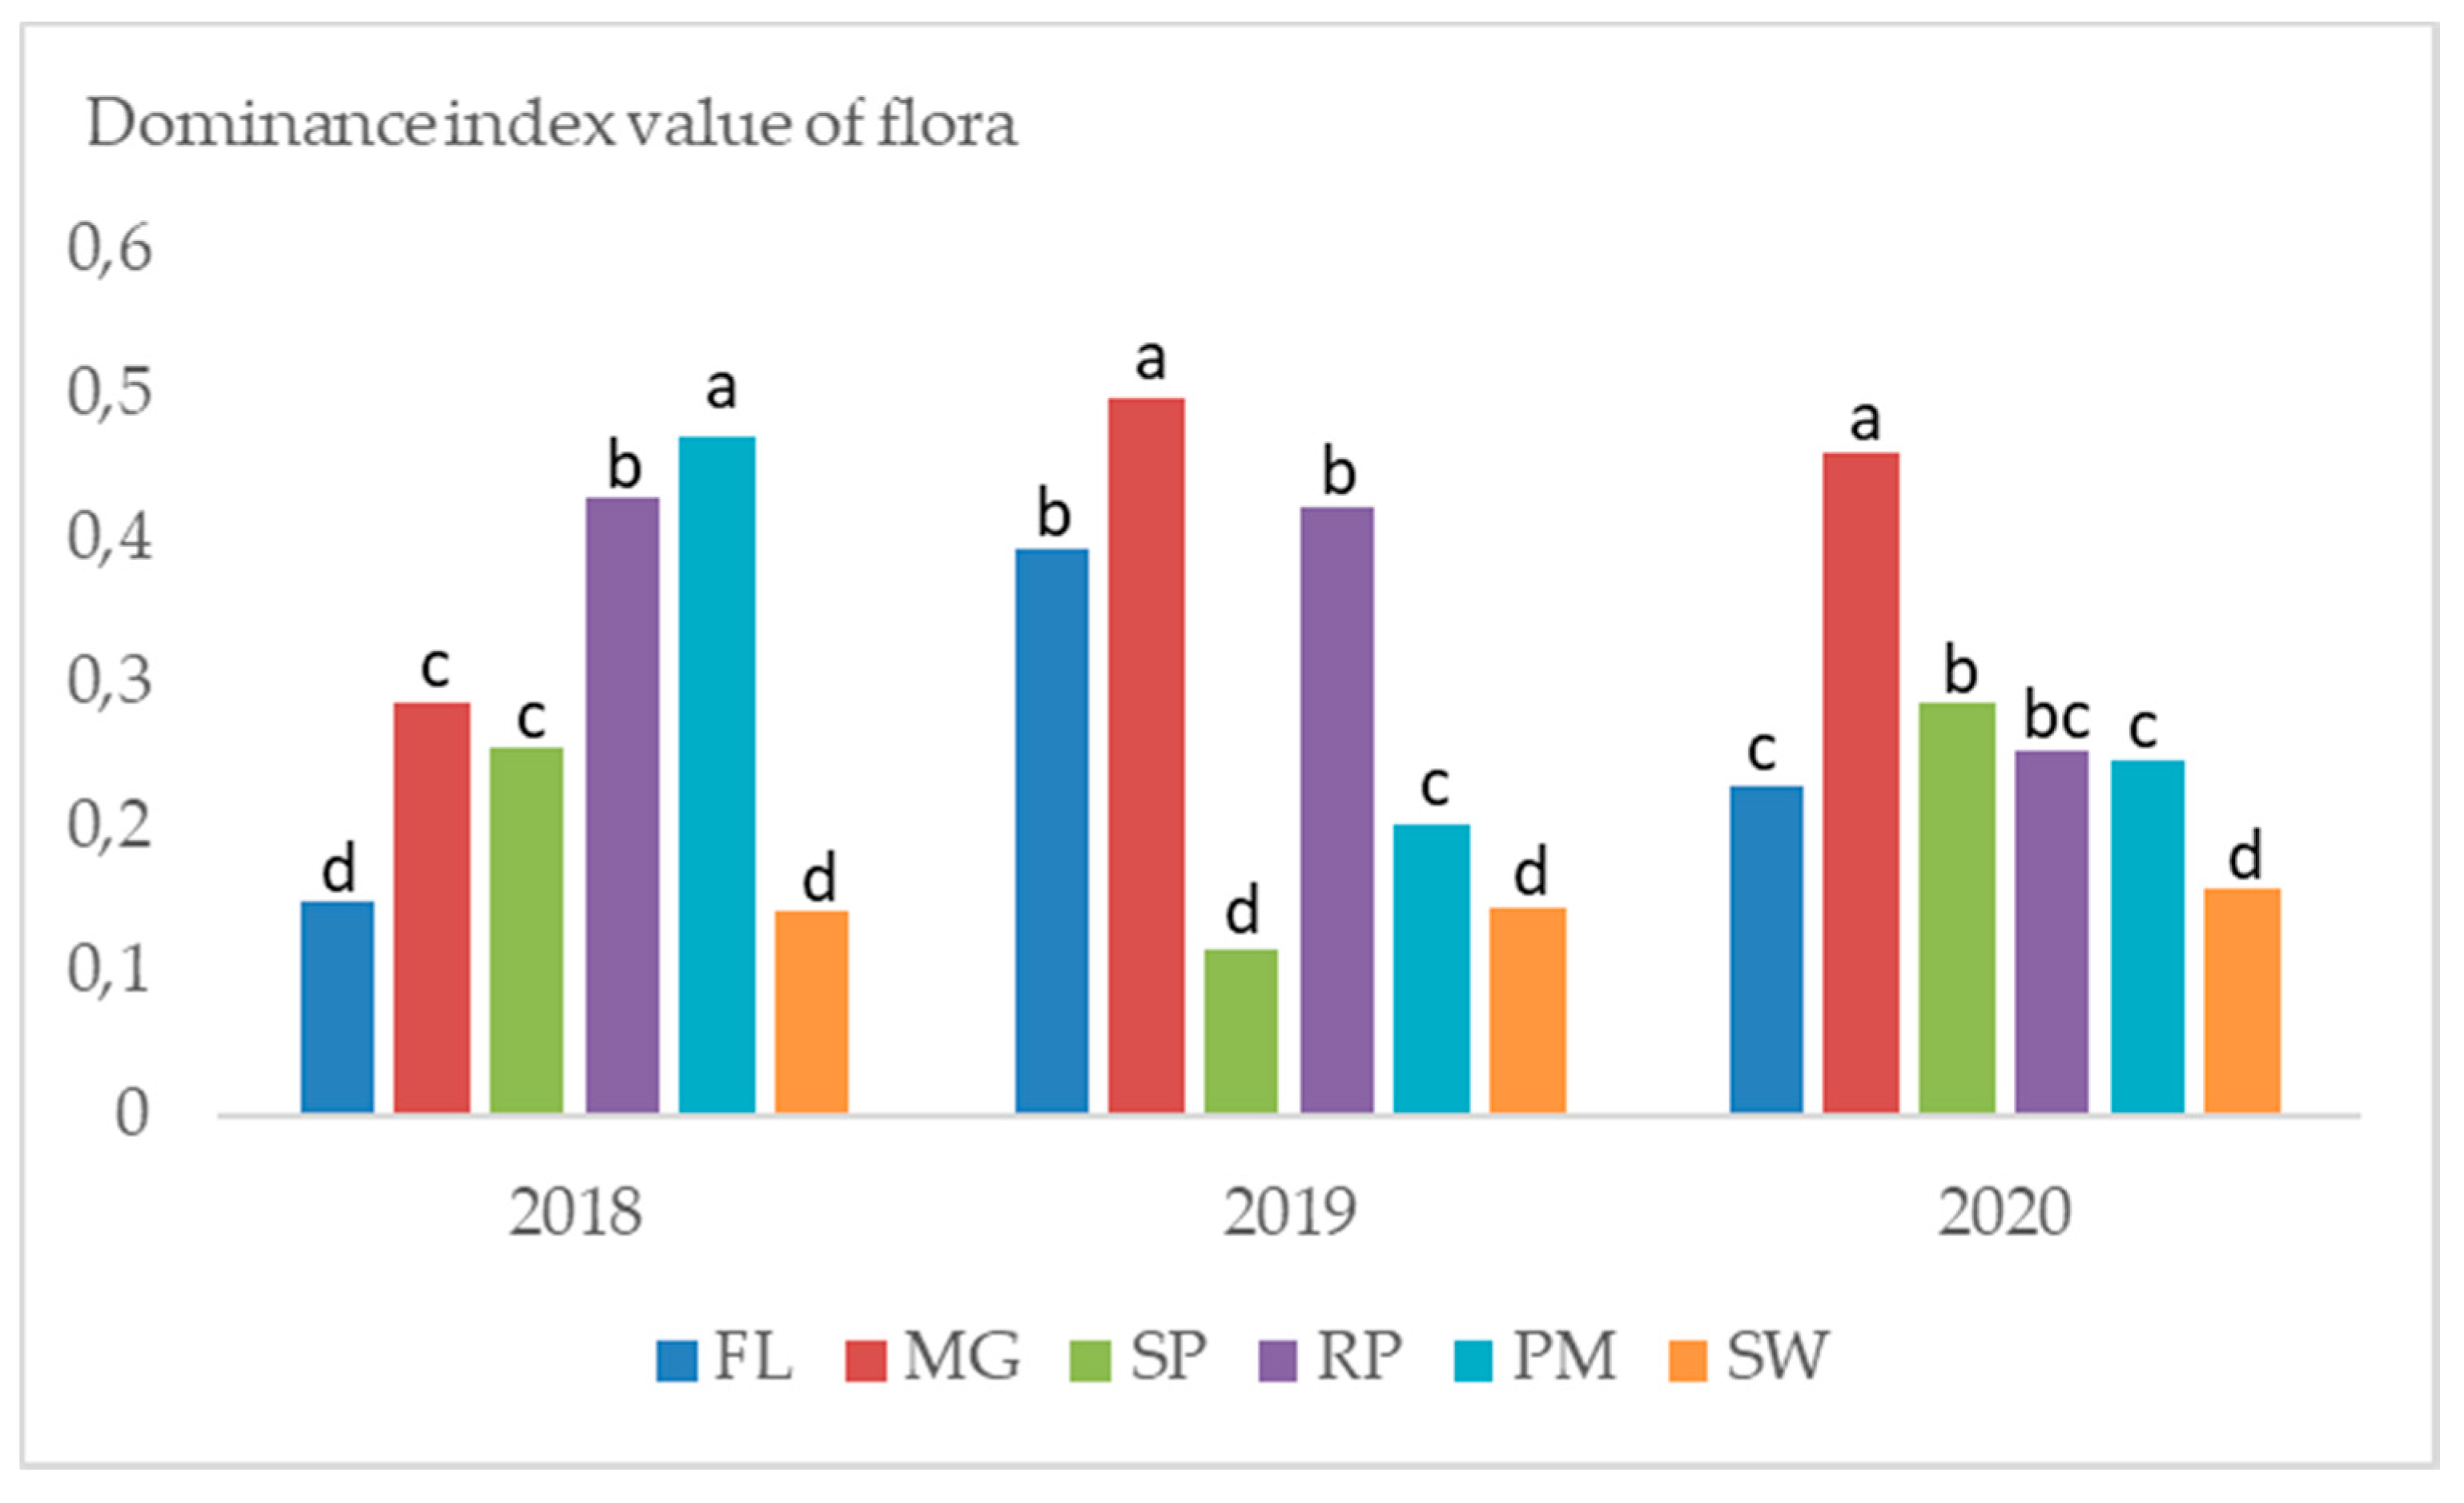
The Simpson’s Dominance Index indicates low plant diversity in the habitat or a strong dominance of one of the species. In 2018 the lowest value (thus the best biodiversity “performance”) of this indicator was observed in the control plot and plantation of willow. The remaining objects had significantly higher domination of single species of weeds. The highest domination index values were found in plantations of poplar and black locust. In 2019 and 2020 the highest values of domination index were found for weeds of miscanthus. The value of this indicator varied strongly over the years (Figure 2).
Different weed species dominated in different plots. In control object, Poa annua L., Elymus repens L., dominated in 2018. In 2019, Amaranthus retroflexus L. and Chenopodium album L. were observed in large numbers. In the third year, grasses such as Bromus inermis Leyss and Elymus repens L were the most dominant species. The same three species of grasses were dominant in miscanthus in all 3 years of the study. Changes in the dominance of species were much more dynamic in cup plant due to intensive cultivation of this plantation. Stellaria media L. and Chenopodium album L. were the most dominant species in 2018. Species distribution of weeds was very even. The most common species were Equisetum arvense L., Taraxacum officinale Wigg., Poa annua L., and Erigeron canadensis L. Galium aparine L., Elymus repens L., Solidago canadensis L., and Calamagrostis epigejos L. were present in high numbers in every year on the plantation of black locust. A similar situation was observed for poplar. Four species were the most dominant in different years: Apera spica-venti, Chenopodium album, Erigeron canadensis and Tripleurospermum maritimum. Soil under poplar and under black locust was mostly covered by litter, leaving little space for weeds. Willow showed no domination of any weed species as the weed community was very diverse. The most common species were: Festuca rubra L., Galium aparine L., Cerastium arvense L., Solidago canadensis L., Elymus repens L., Poa annua L., and Stellaria media L.
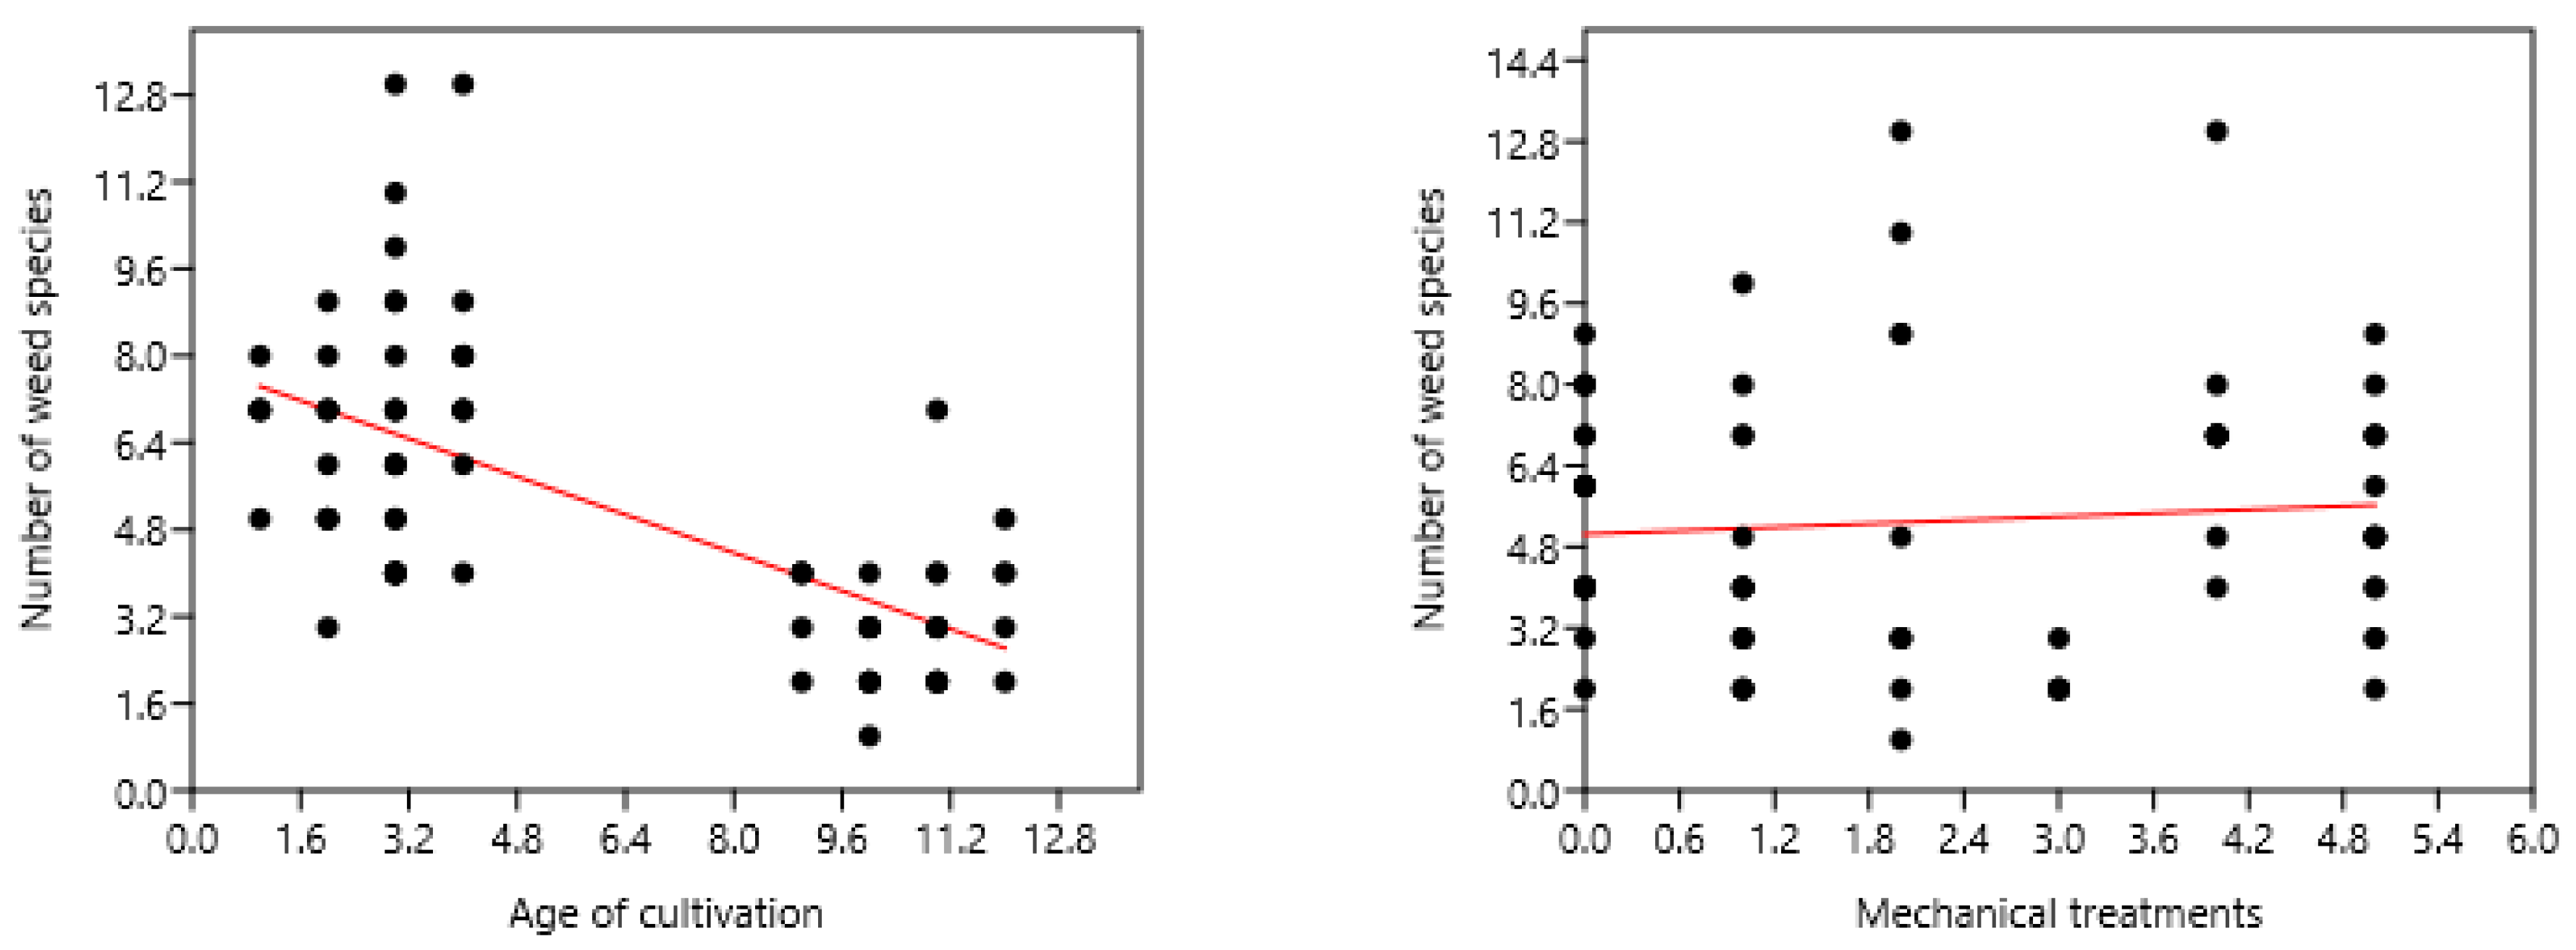
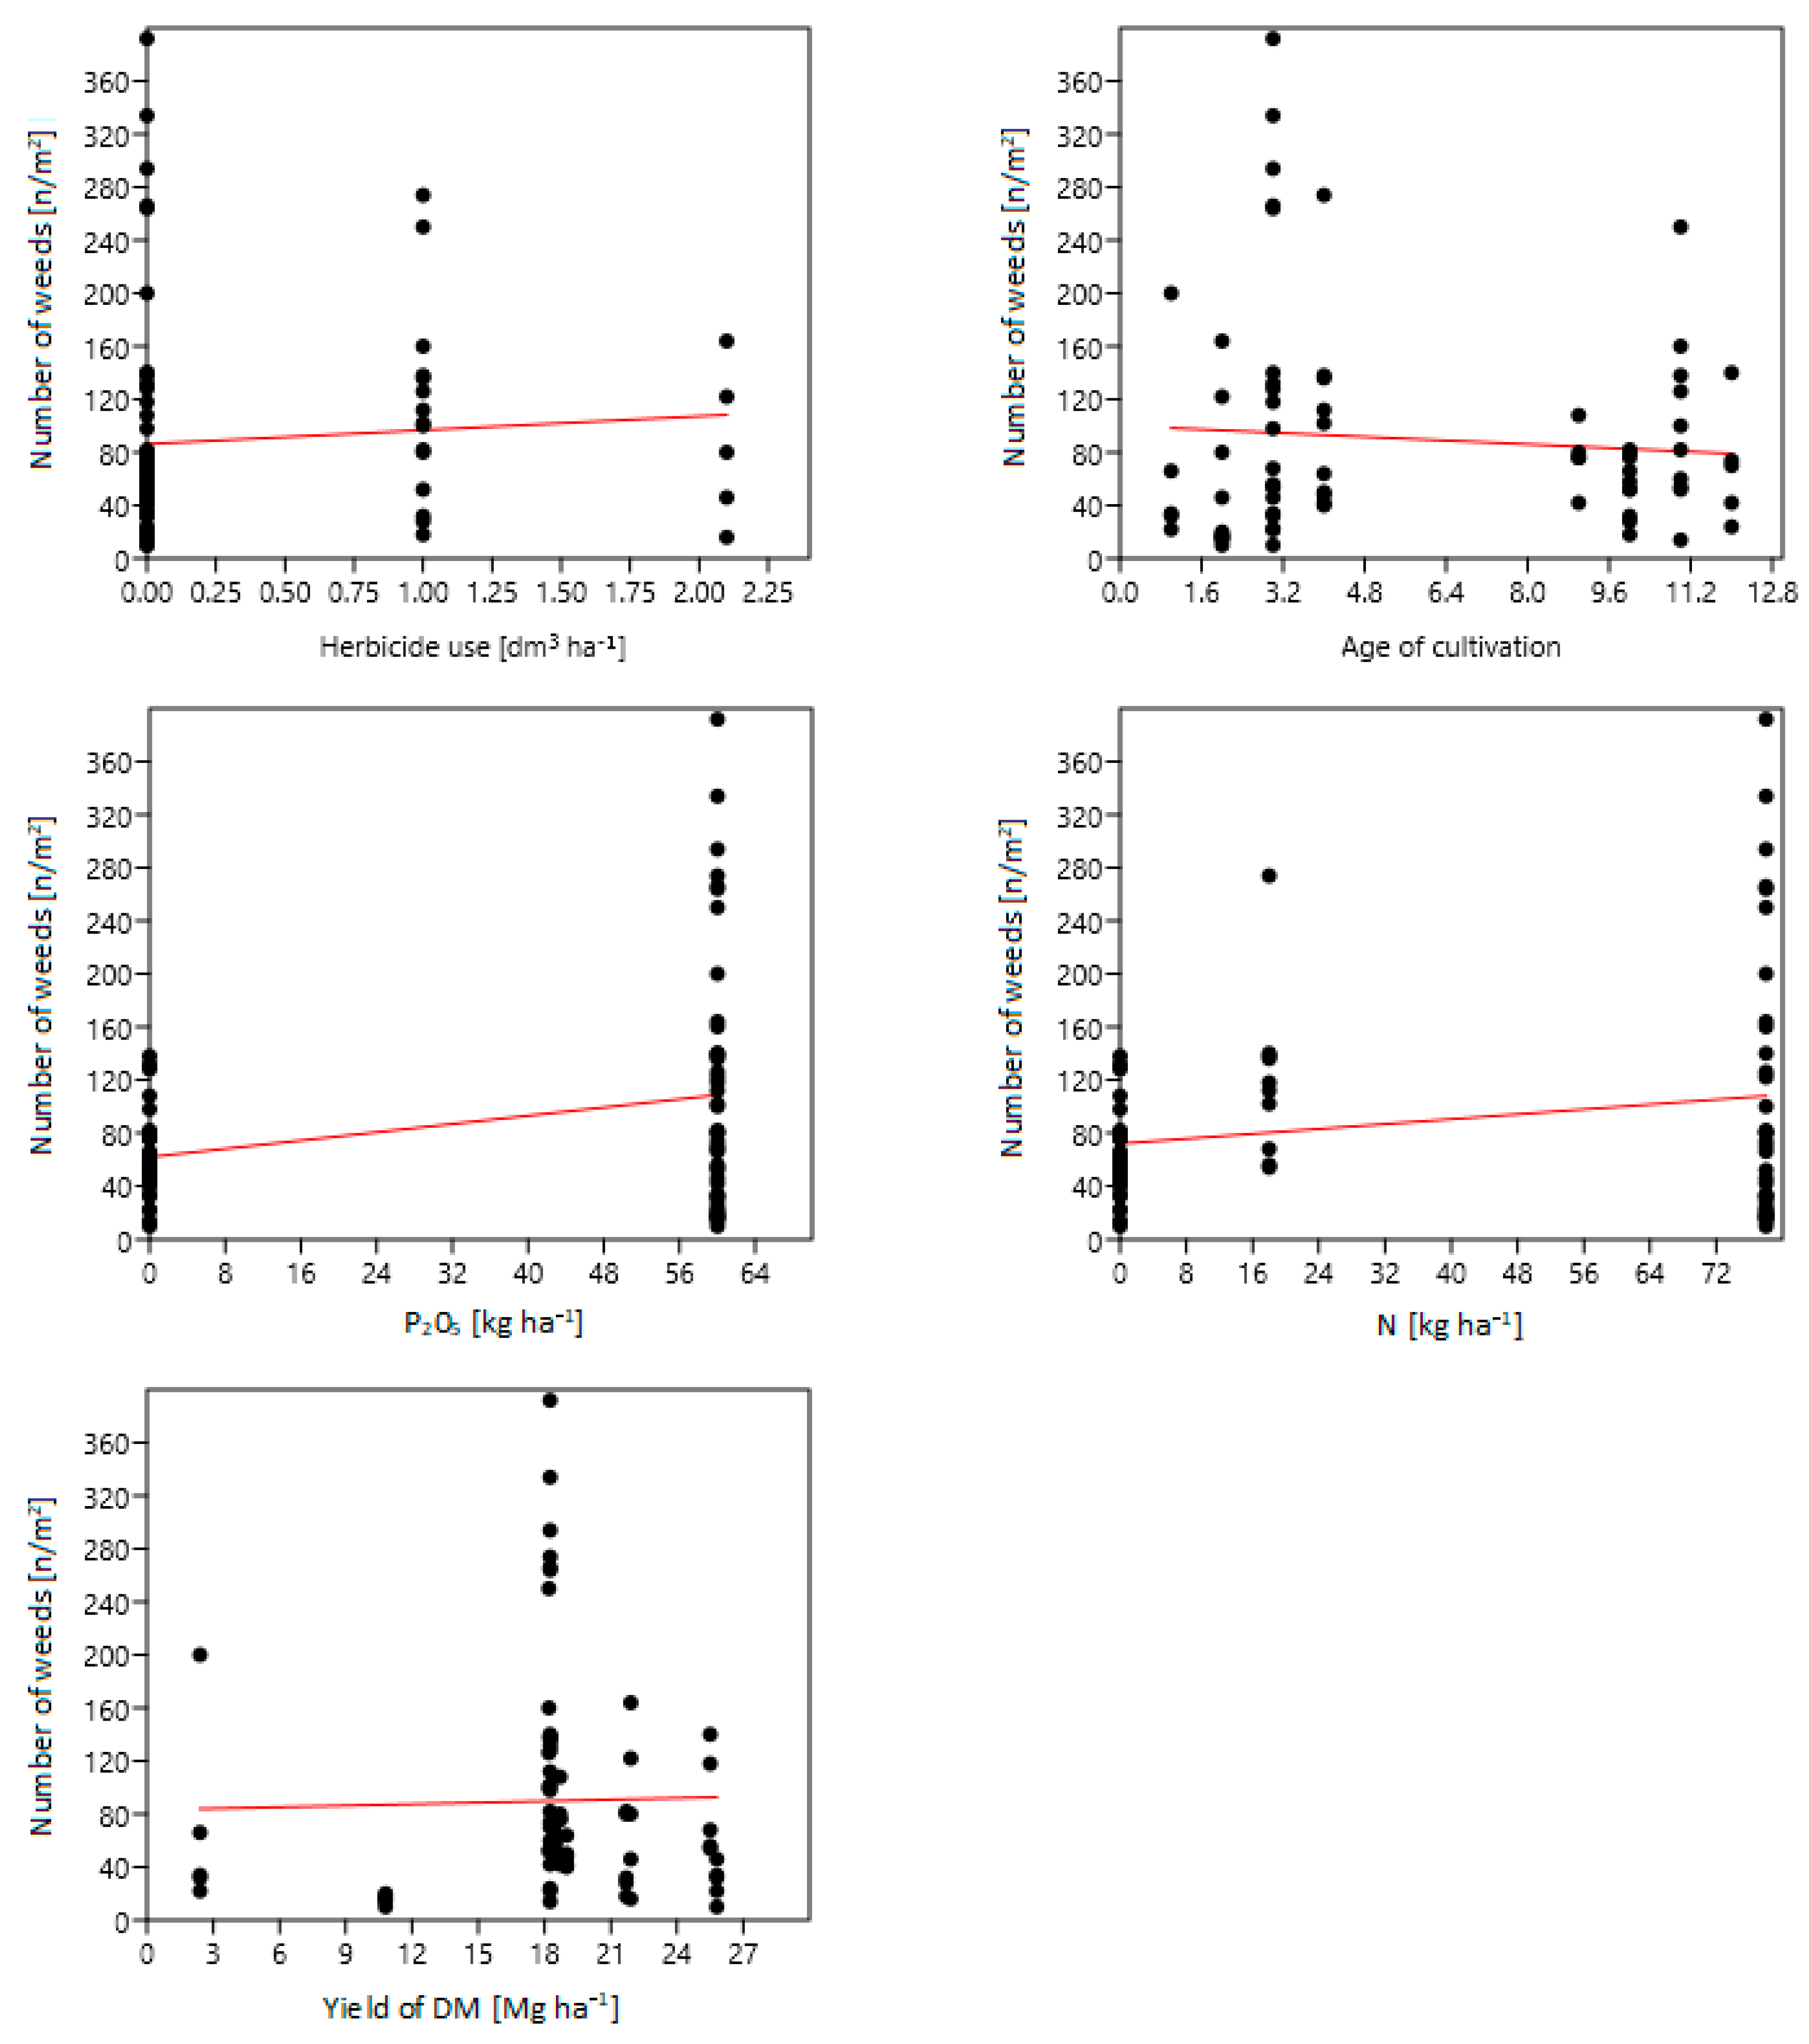
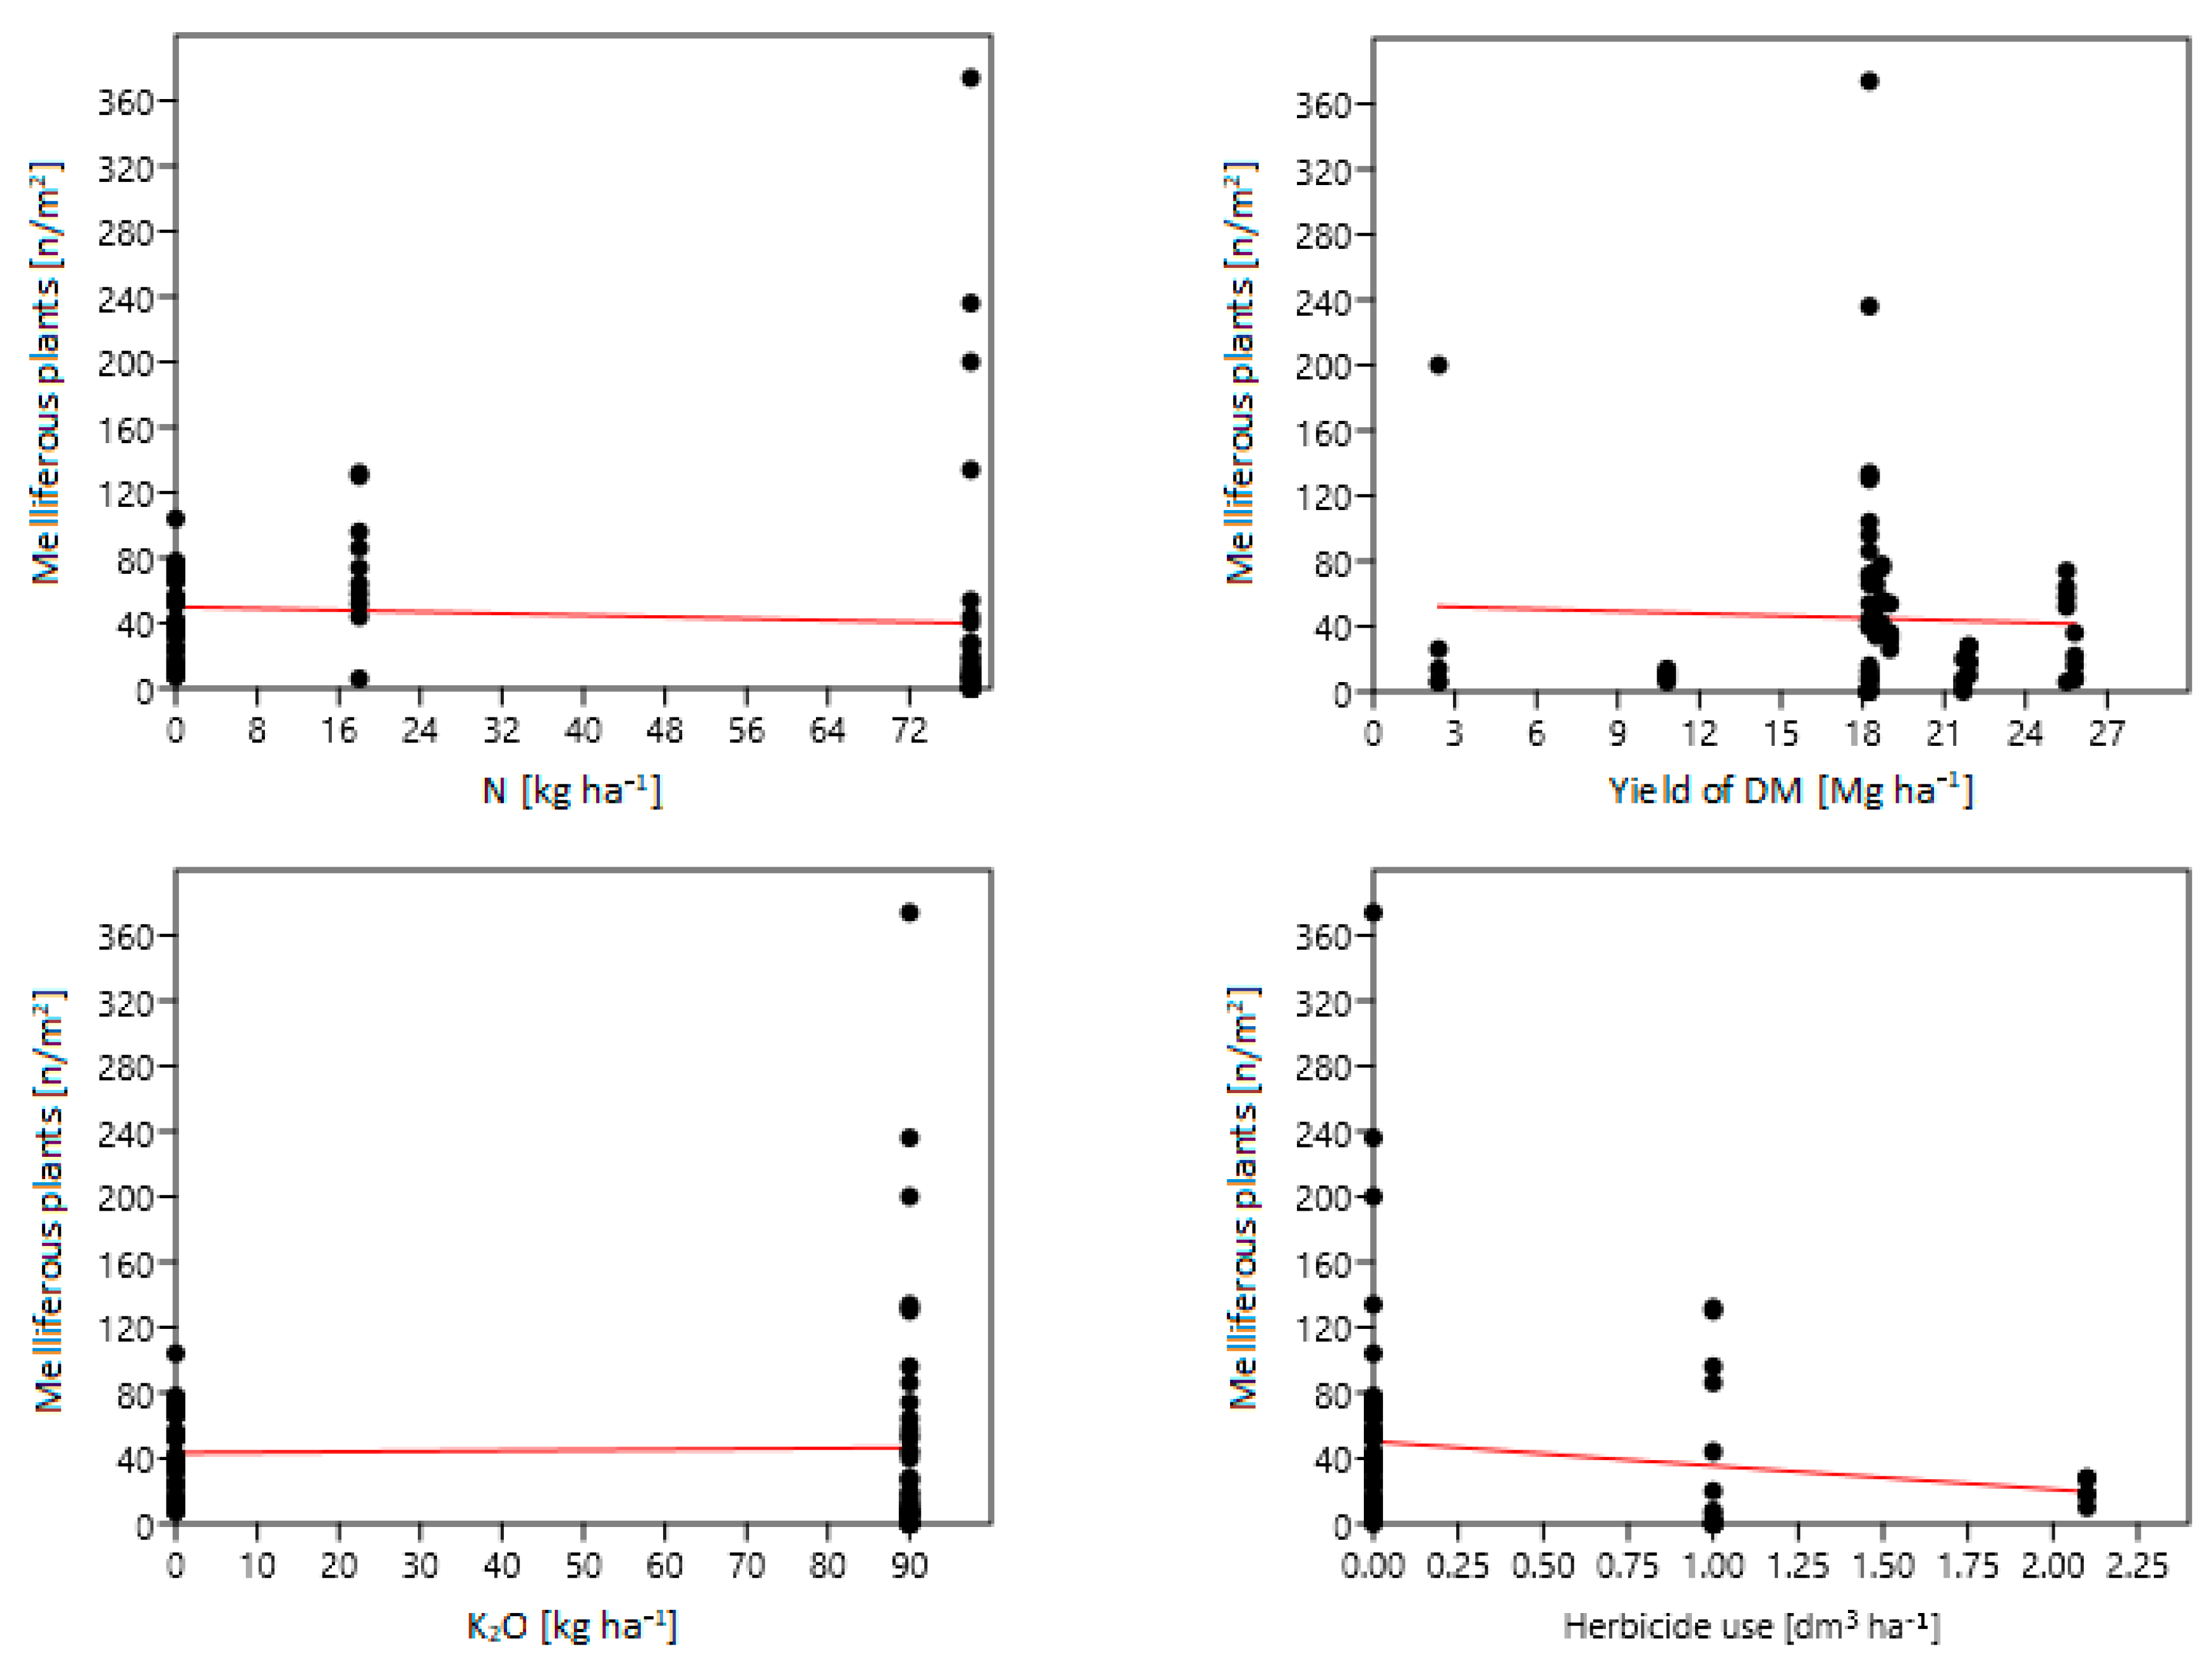
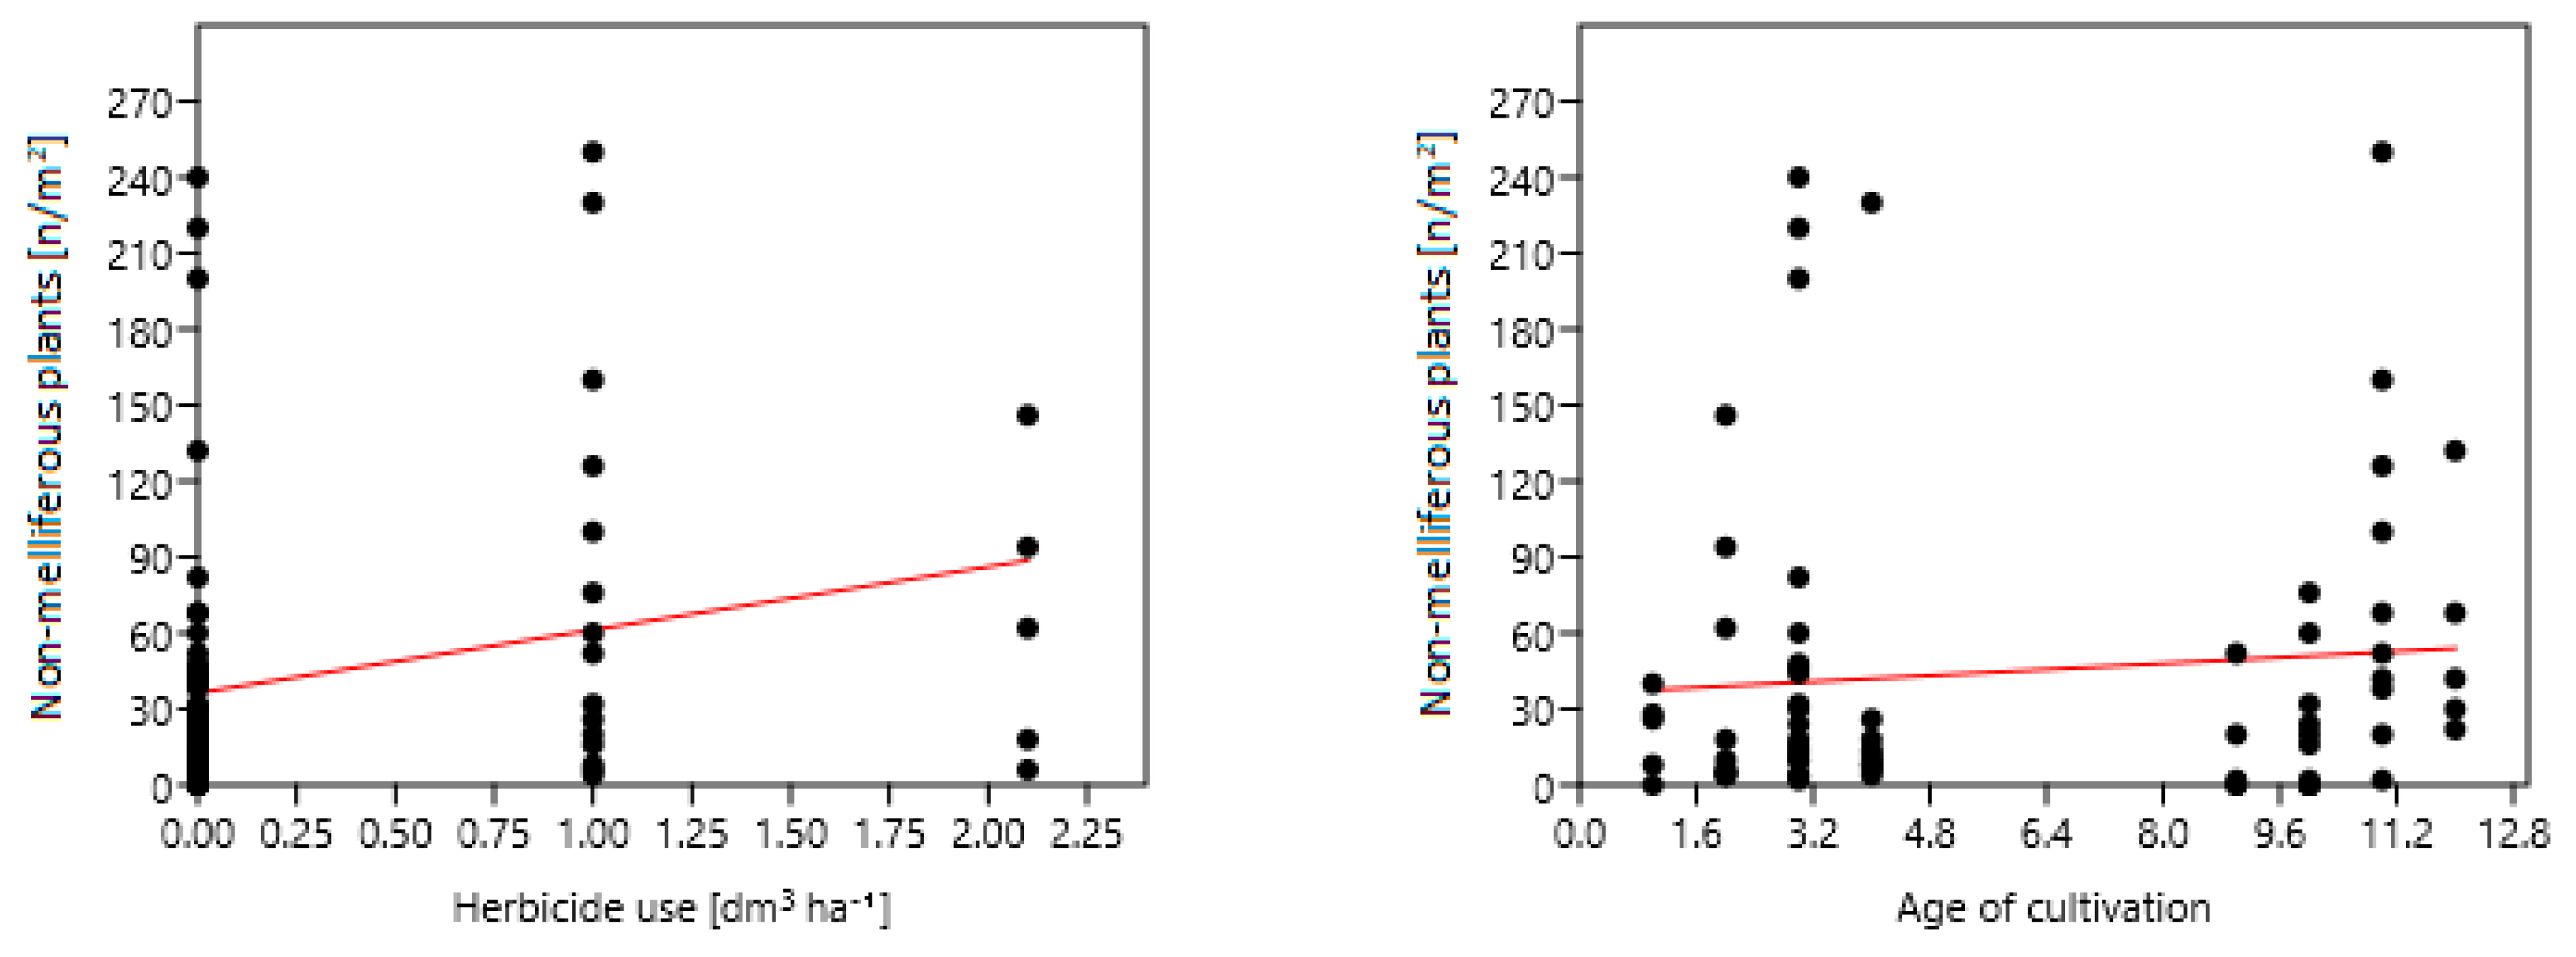
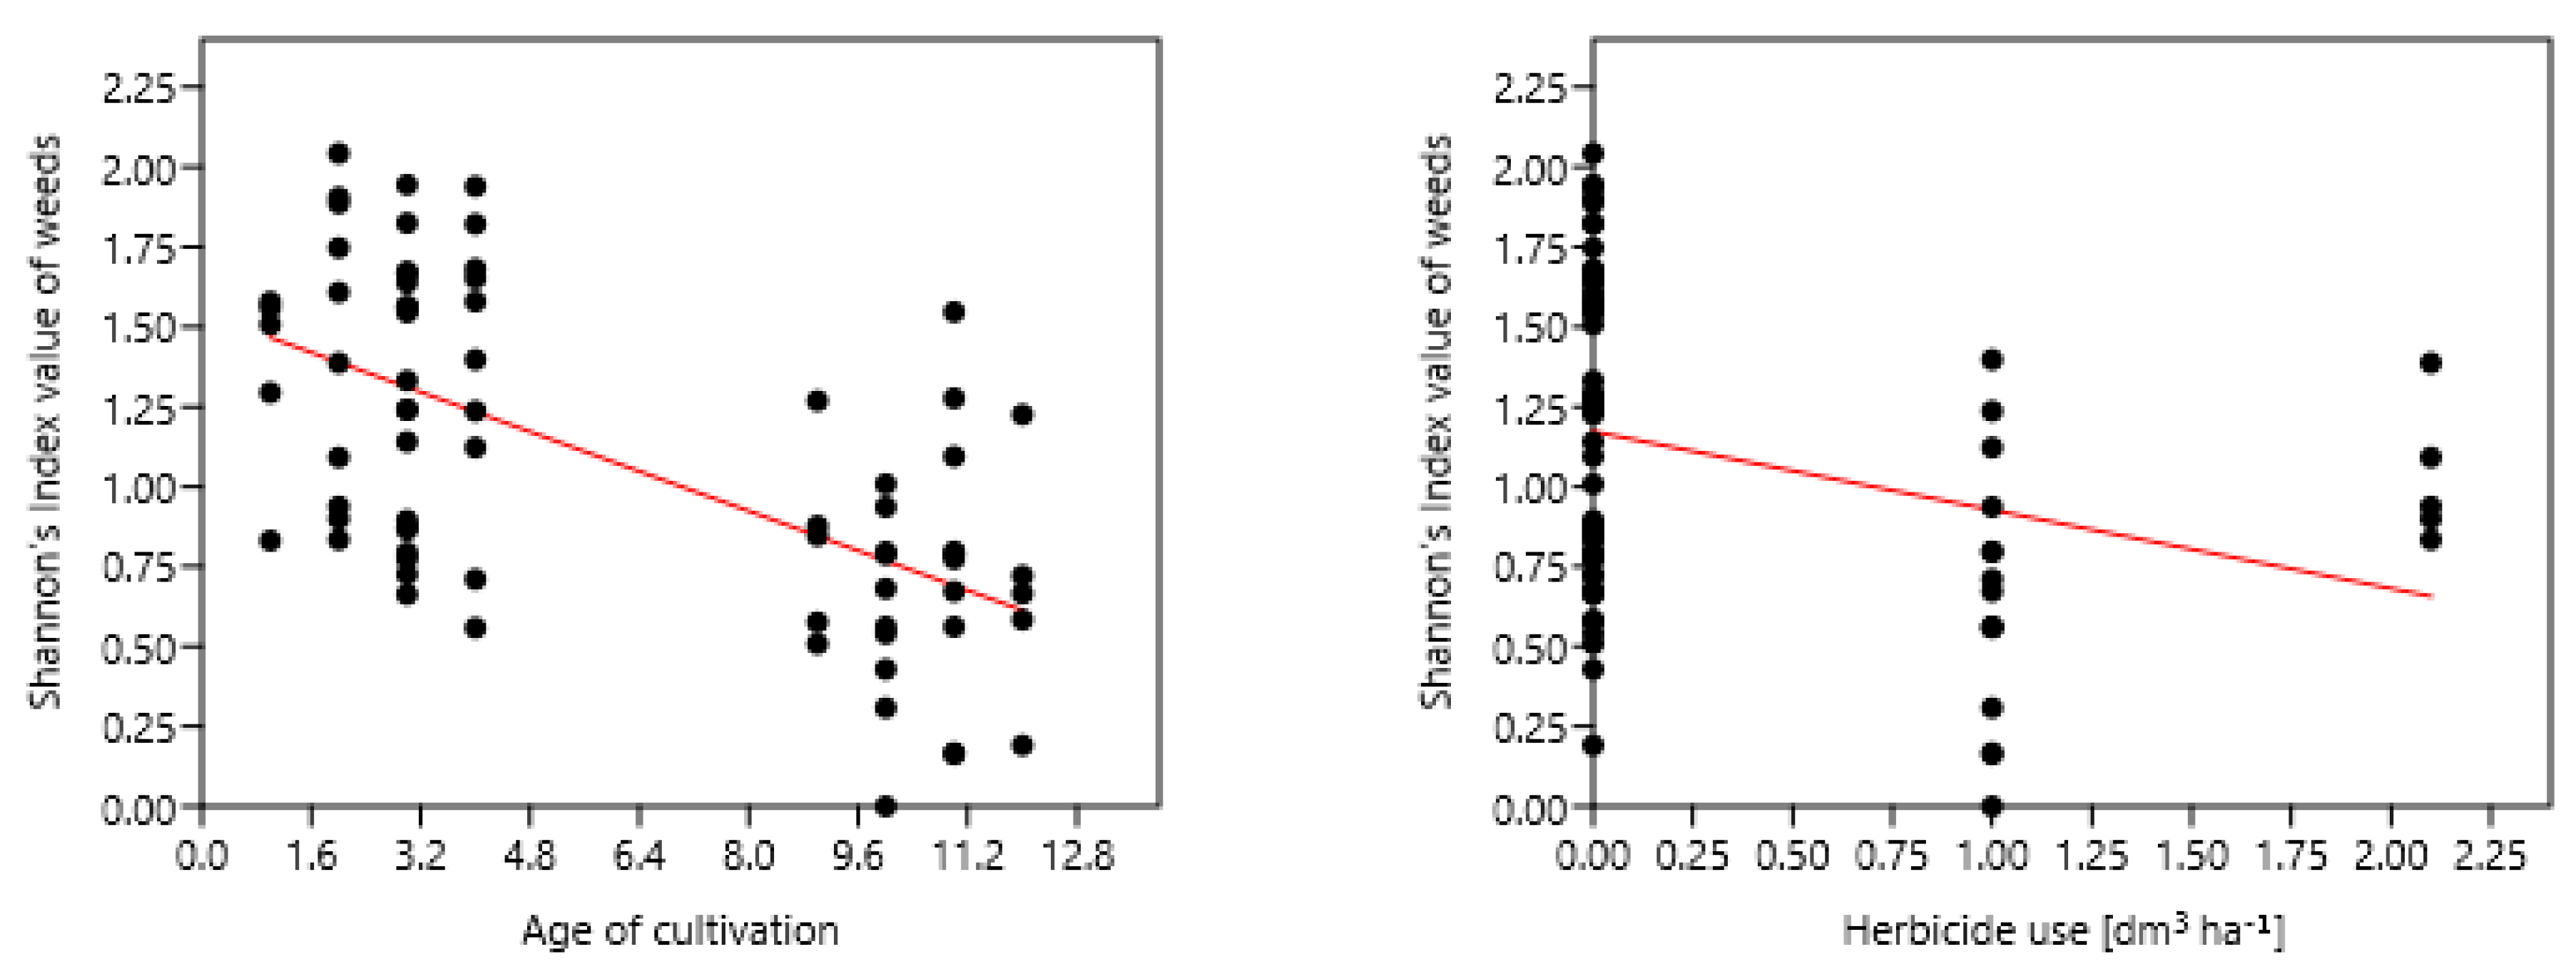
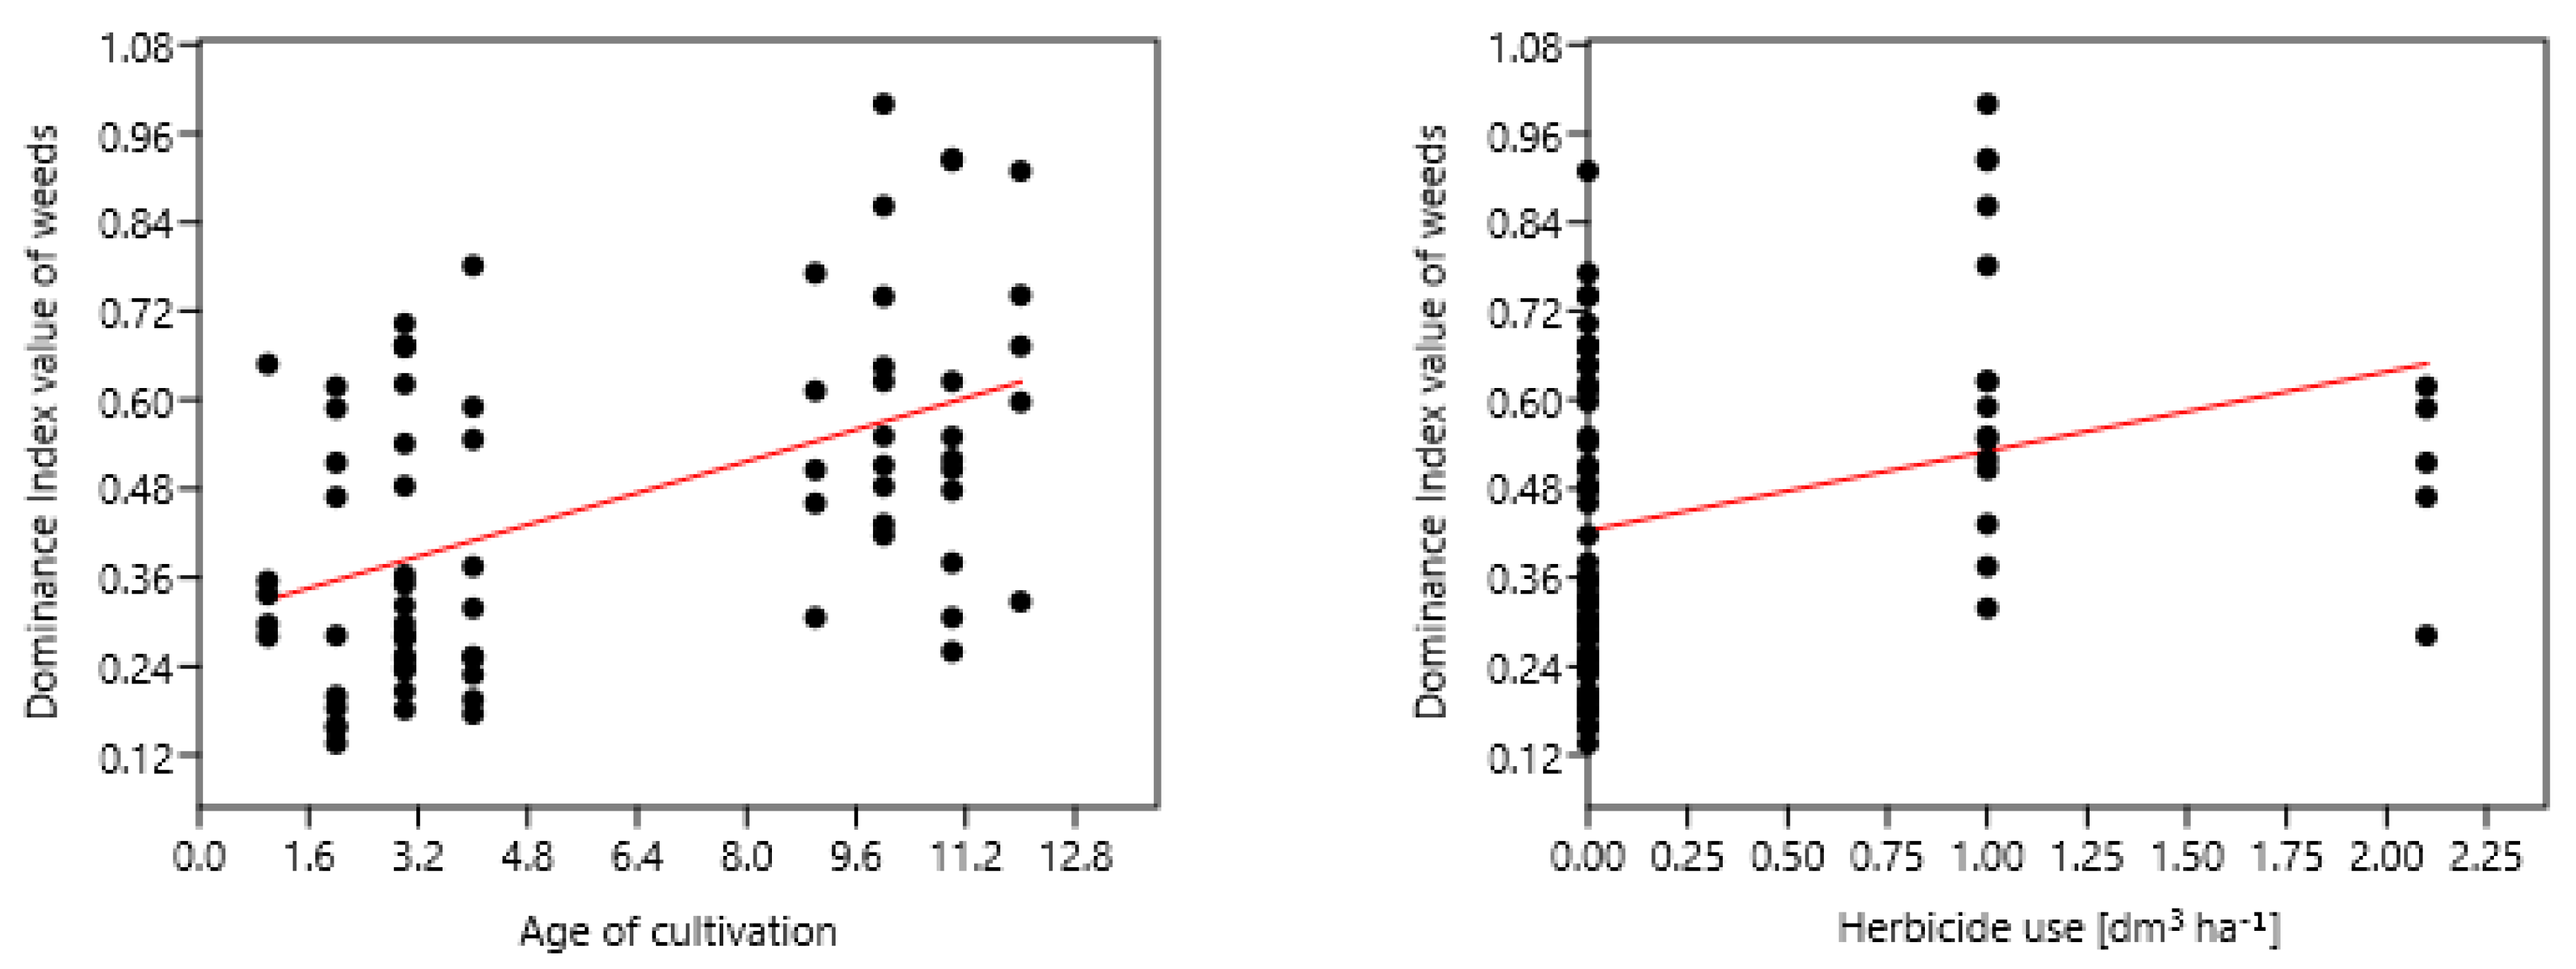
In order to describe the strength of the impact of the agrotechnical factors on plant biodiversity, multiple regression was performed. It was found that the number of species is negatively affected by two factors: the age of plantation and the number of agrotechnical treatments (Figure 3). Despite the lack of correlation between plant density and agrotechnical factors, the analysis of variance revealed five factors, which significantly affected the number of weeds per m2. The use of herbicides, the age of the plantation, and the use of phosphorus fertilizer had a positive effect on weed densities (Figure 4). Nitrogen fertilization and crop yield had a negative effect on weed population density, especially in the case of melliferous plants (Figure 5). Factors such as the level of potassium fertilization and, surprisingly, pesticide use also had a positive effect on the number of melliferous plants. Herbicides in perennial industrial crops probably had a negative impact mainly on grasses, with little or no effect on flowering plants. However, the use of herbicides and the age of plantation had a positive effect on the density of non-melliferous plants (Figure 6). The age of the plantation and herbicide use largely explain the decrease of Shannon’s diversity index (Figure 7). It was also found the value of the Dominance Index increases with the age of plantation and the number of herbicide treatments applied (Figure 8).
3.2. Diversity of Arthropods in Pitfall Traps
During the monitoring, a total of 54 pitfall trap samples were collected, giving 9 repetitions in each crop. Over 13 000 arthropod specimens belonging to 19 orders were identified: Acari, Araneae, Blattodea, Coleoptera, Dermaptera, Diptera, Entomobryomorpha, Hemiptera, Hymenoptera, Isopoda, Julida, Lepidoptera, Lithobiomorpha, Neuroptera, Opiliones, Orthoptera, Siphonaptera, Symphypleona, and Thysanoptera. Sixty-seven arthropod families and 85 taxa have been identified. Few invertebrates were identified to species level (Table 4.)
No significant differences in the number of invertebrates were found between tested plots (Table 5). Statistically significant differences occurred in the number of identified species (chi2 = 12.29, p = 0.03). The highest number of taxa was found in the control plot, where the number of taxa (species) was 50 and the average (median) value was 21. Significantly lower values (than for fallow land) were found in the cultivation of cup plant and poplar. The remaining crops did not differ from each other. There were no differences in the number of natural enemies of pests between the studied objects nor for the detritivores. The number of taxa that were classified as potential crop pests was significantly lower in poplar than in the control plot, miscanthus, and cup plant (chi2 = 30.03, p < 0.01). It should be noted that the same taxonomic groups may be identified as pests or detritivores, depending on the crop they are found in. On average, the highest abundance of pests, natural enemies, and saprophytes were found on the control plot.
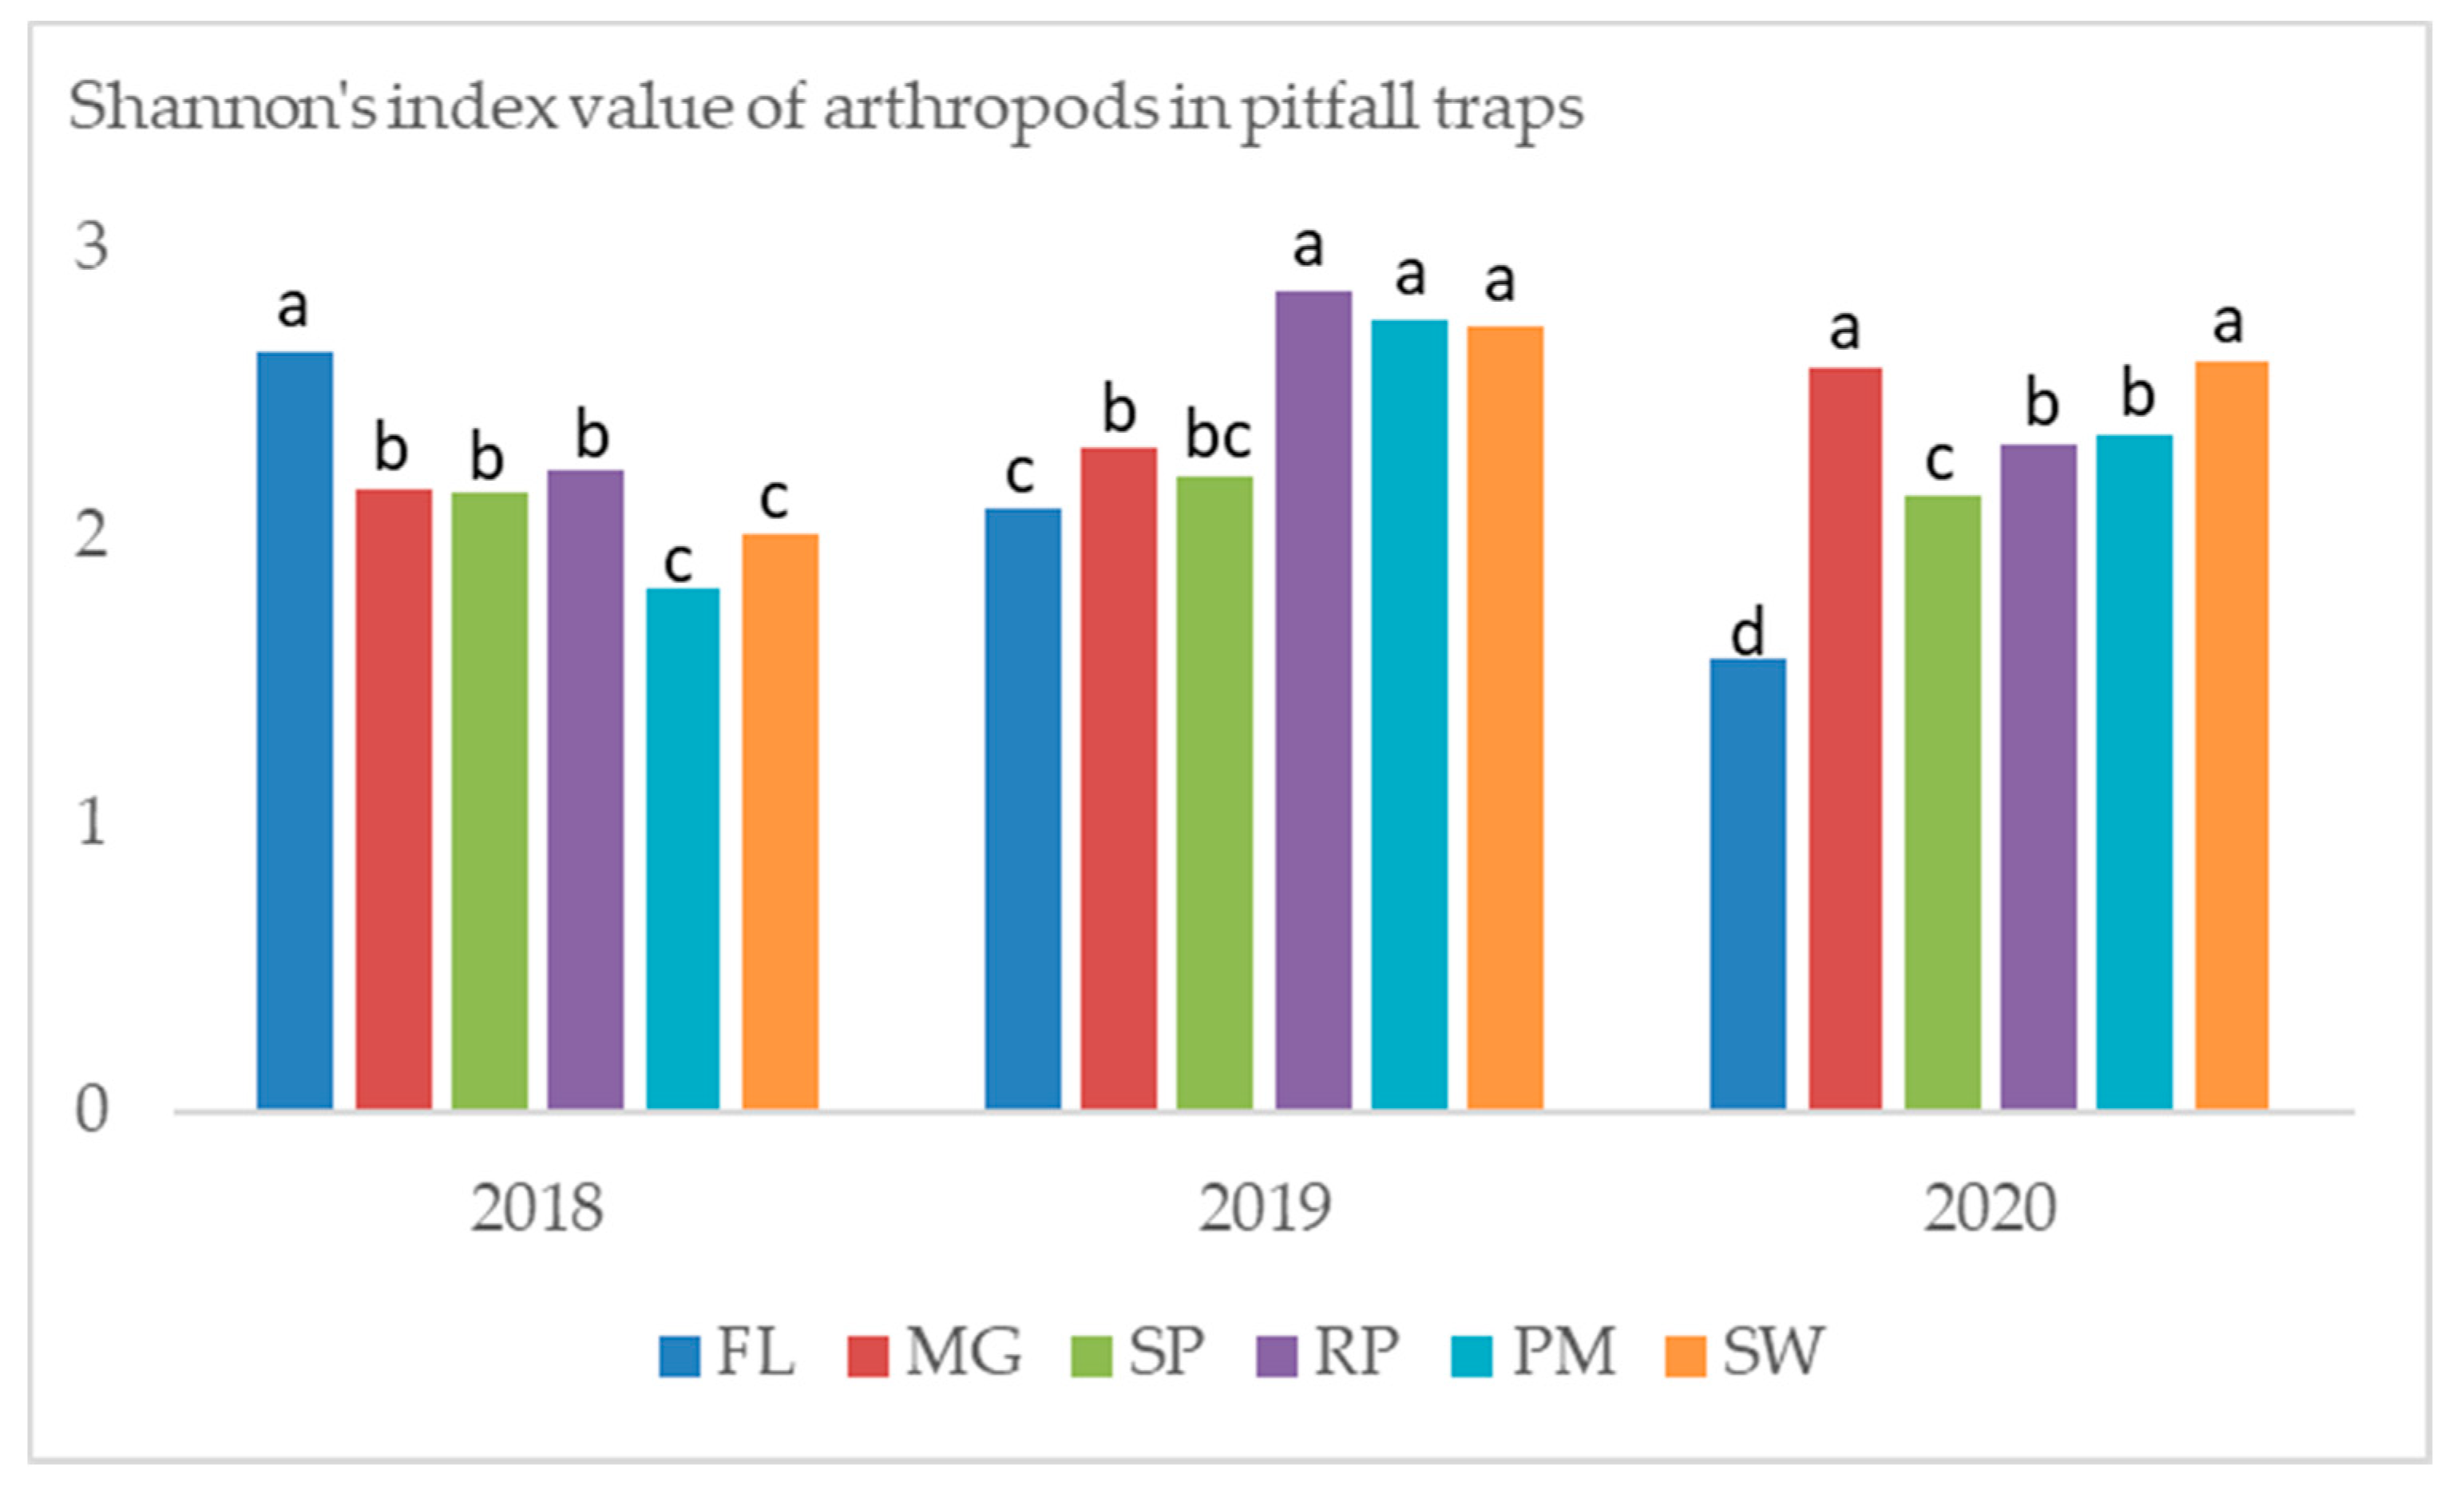
A large variation in the value of Shannon’s diversity index in different years was observed. At the beginning of the experiment, the greatest diversity of terrestrial arthropods was found in the control plot. Some differences were also found between the crops. In poplar and willow in 2018, the diversity of arthropods was found to be lower than in the miscanthus, cup plant, and black locust. The lowest diversity of arthropods was found in the control field in the second year of the study. The greatest diversity was found in the black locust, poplar, and willow. In the third year of the study, the diversity of arthropods decreased in the control plot. Higher values were observed in the cup plant crop, and even greater in black locust and poplar. In 2020, the greatest value of Shannon’s diversity index was found for the willow and miscanthus. Large fluctuations in the diversity of invertebrates were observed over the years. A gradual decrease of the diversity of the control was observed (Figure 9).
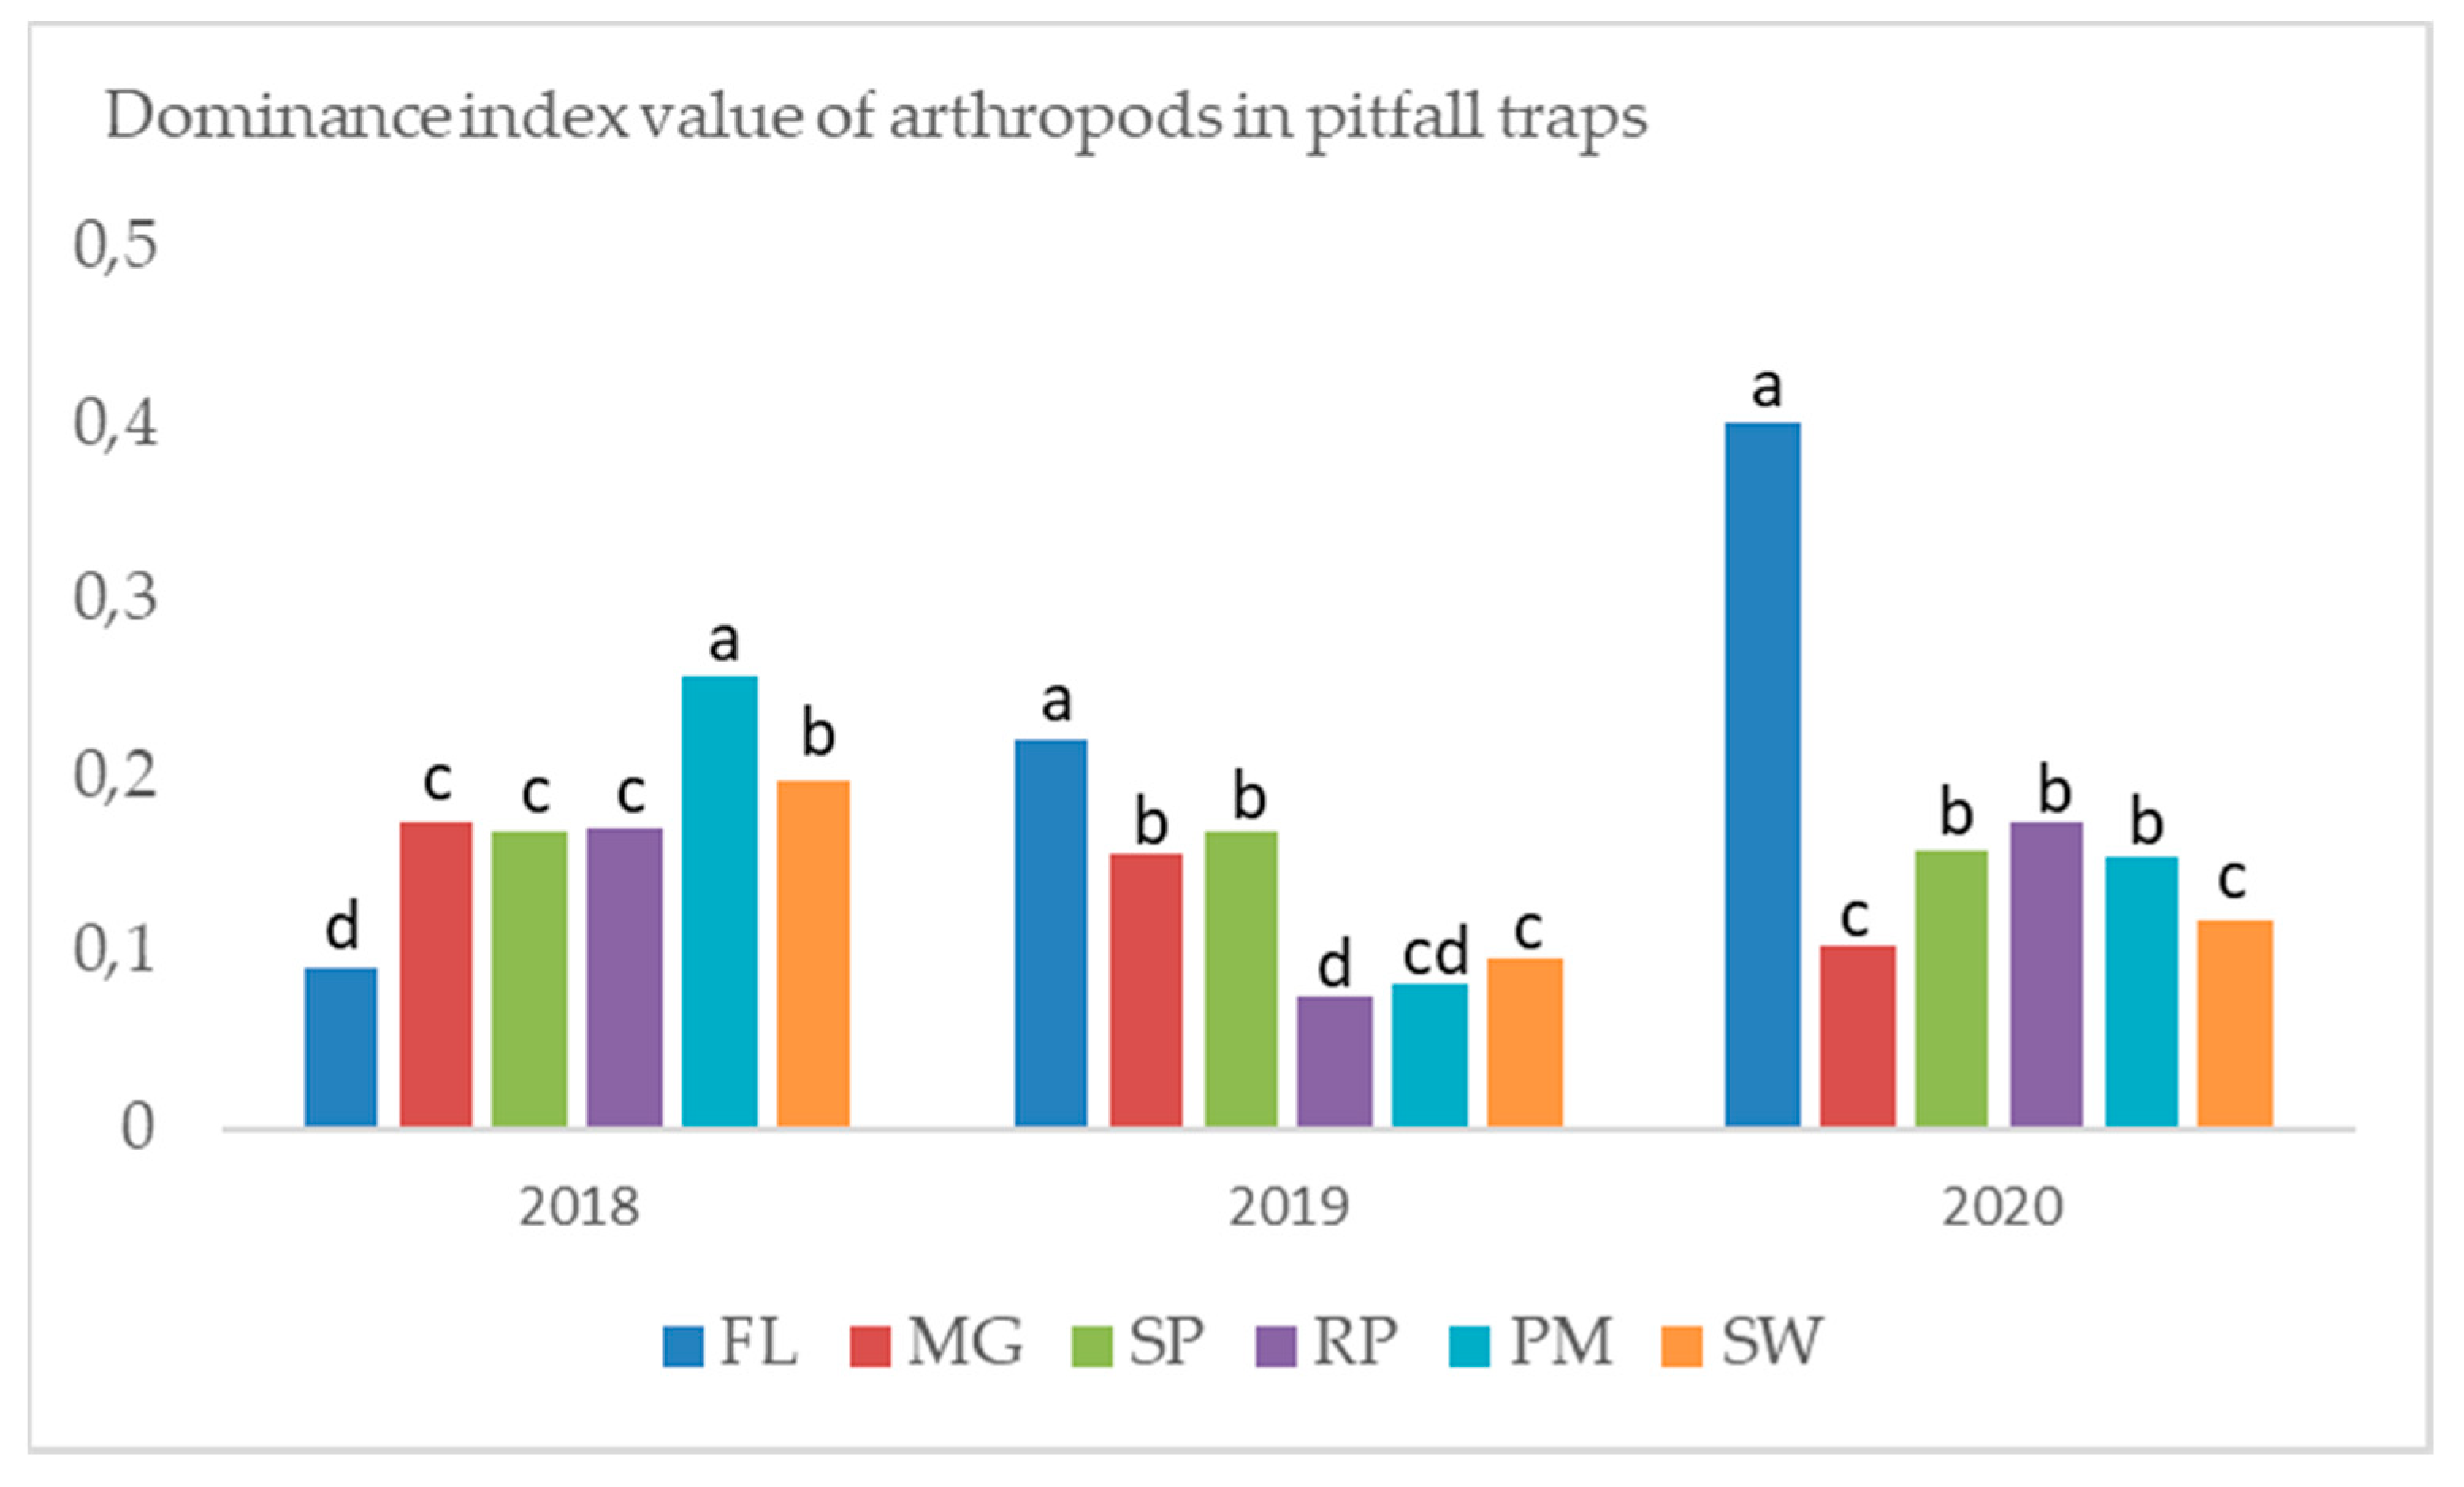
Simpson’s Dominance Index value for ground arthropods was low in most of the samples. Exceptionally high Dominance Index value was found in the control plot in 2020 and it was caused by very high number of Entomobryidae springtails. Gradual growth of Dominance Index value was observed in control, while in perennial industrial crops it varied between years (Figure 10). There were significant differences between values of domination according to Hutcheson’s t-test, but none of the crops had the lowest nor the highest index value across all three years of the experiment. Ground beetles Carabidae and black garden ants Lasius niger L. were also very numerous in control object, as well as in miscanthus and cup plant. The rove beetles Staphylinidae were the most abundant taxa of arthropods in willow, polar and black locust, which could be relevant from the perspective of natural protection of crops. Another taxas which were present in large numbers in every crop and in the control were wolf spiders Lycosidae.
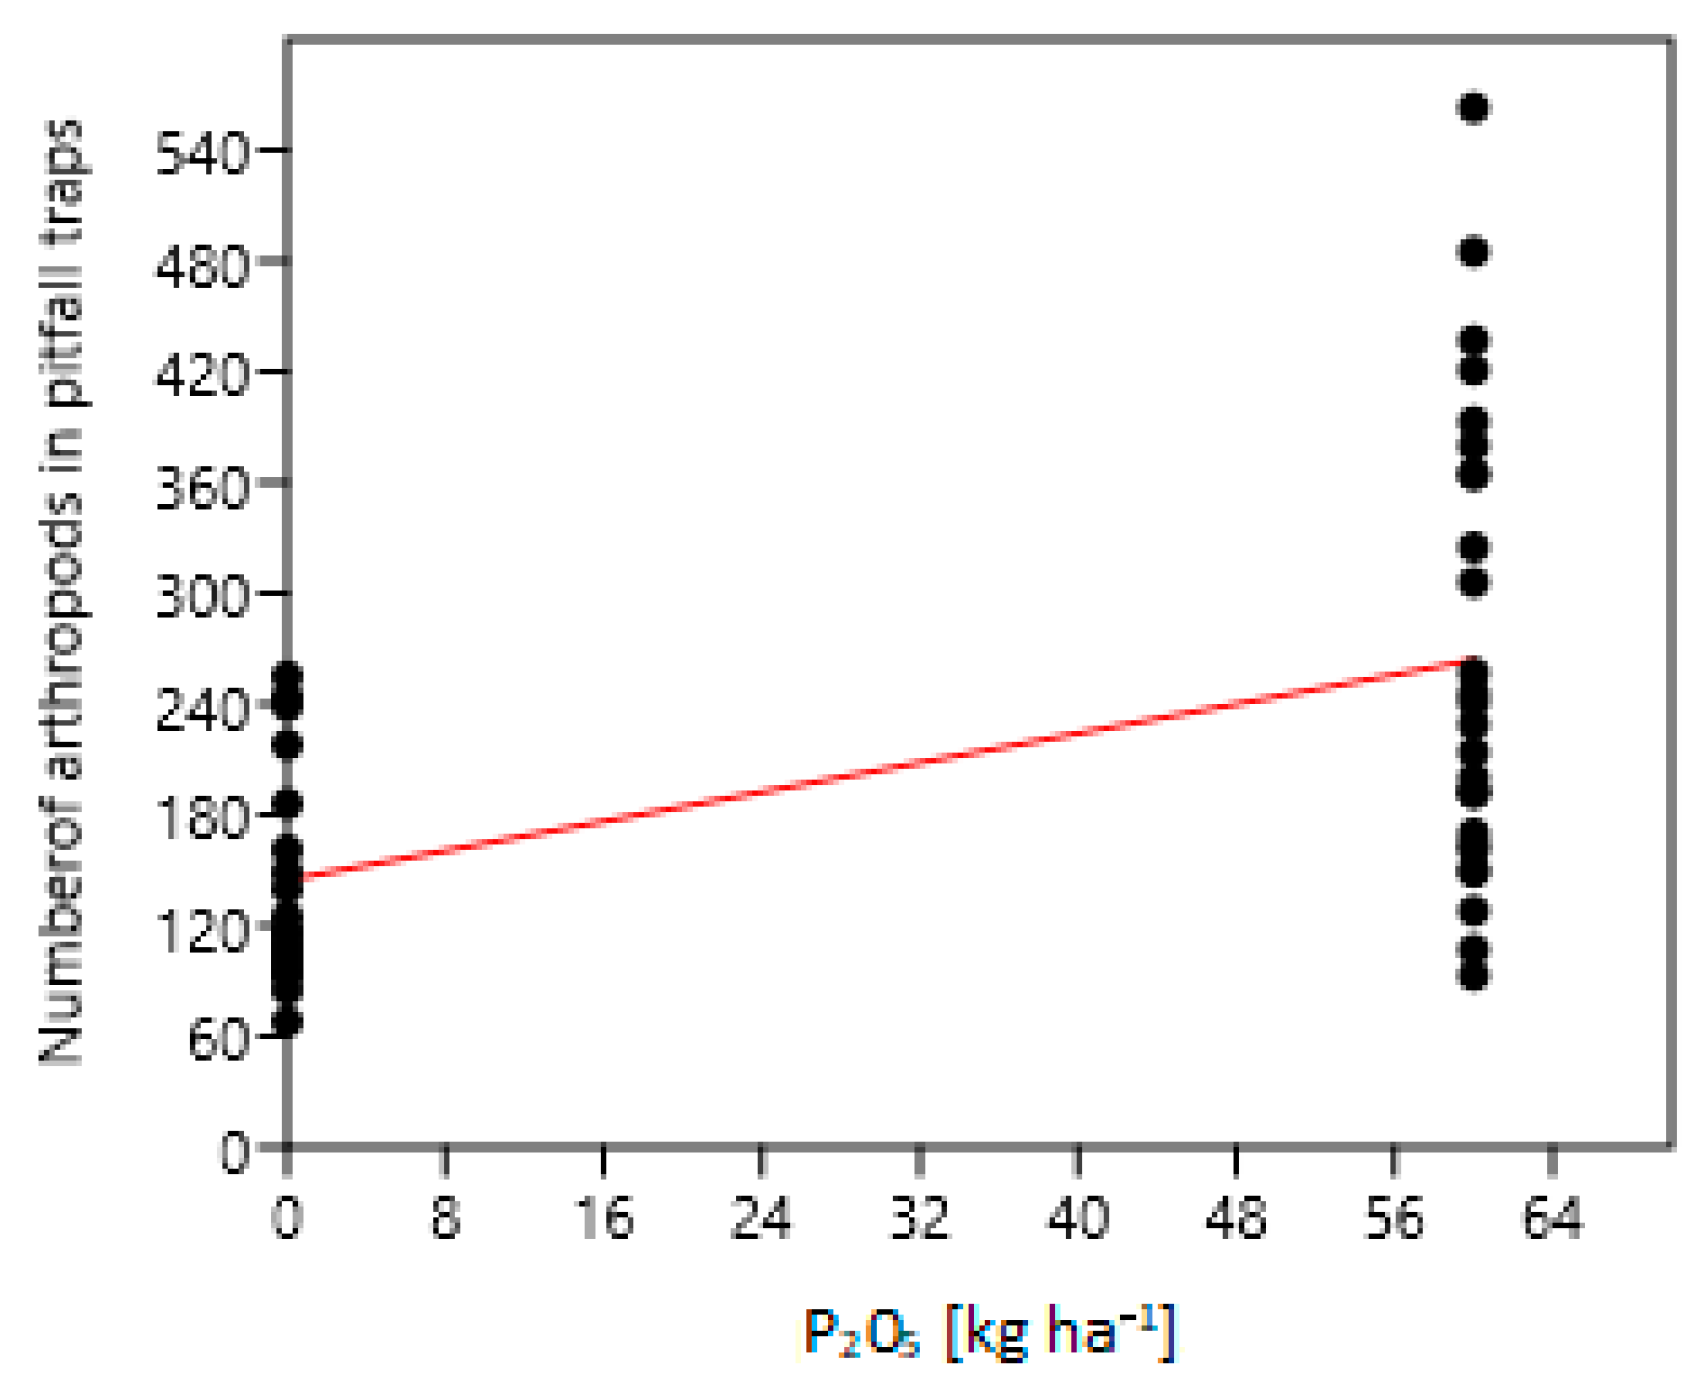
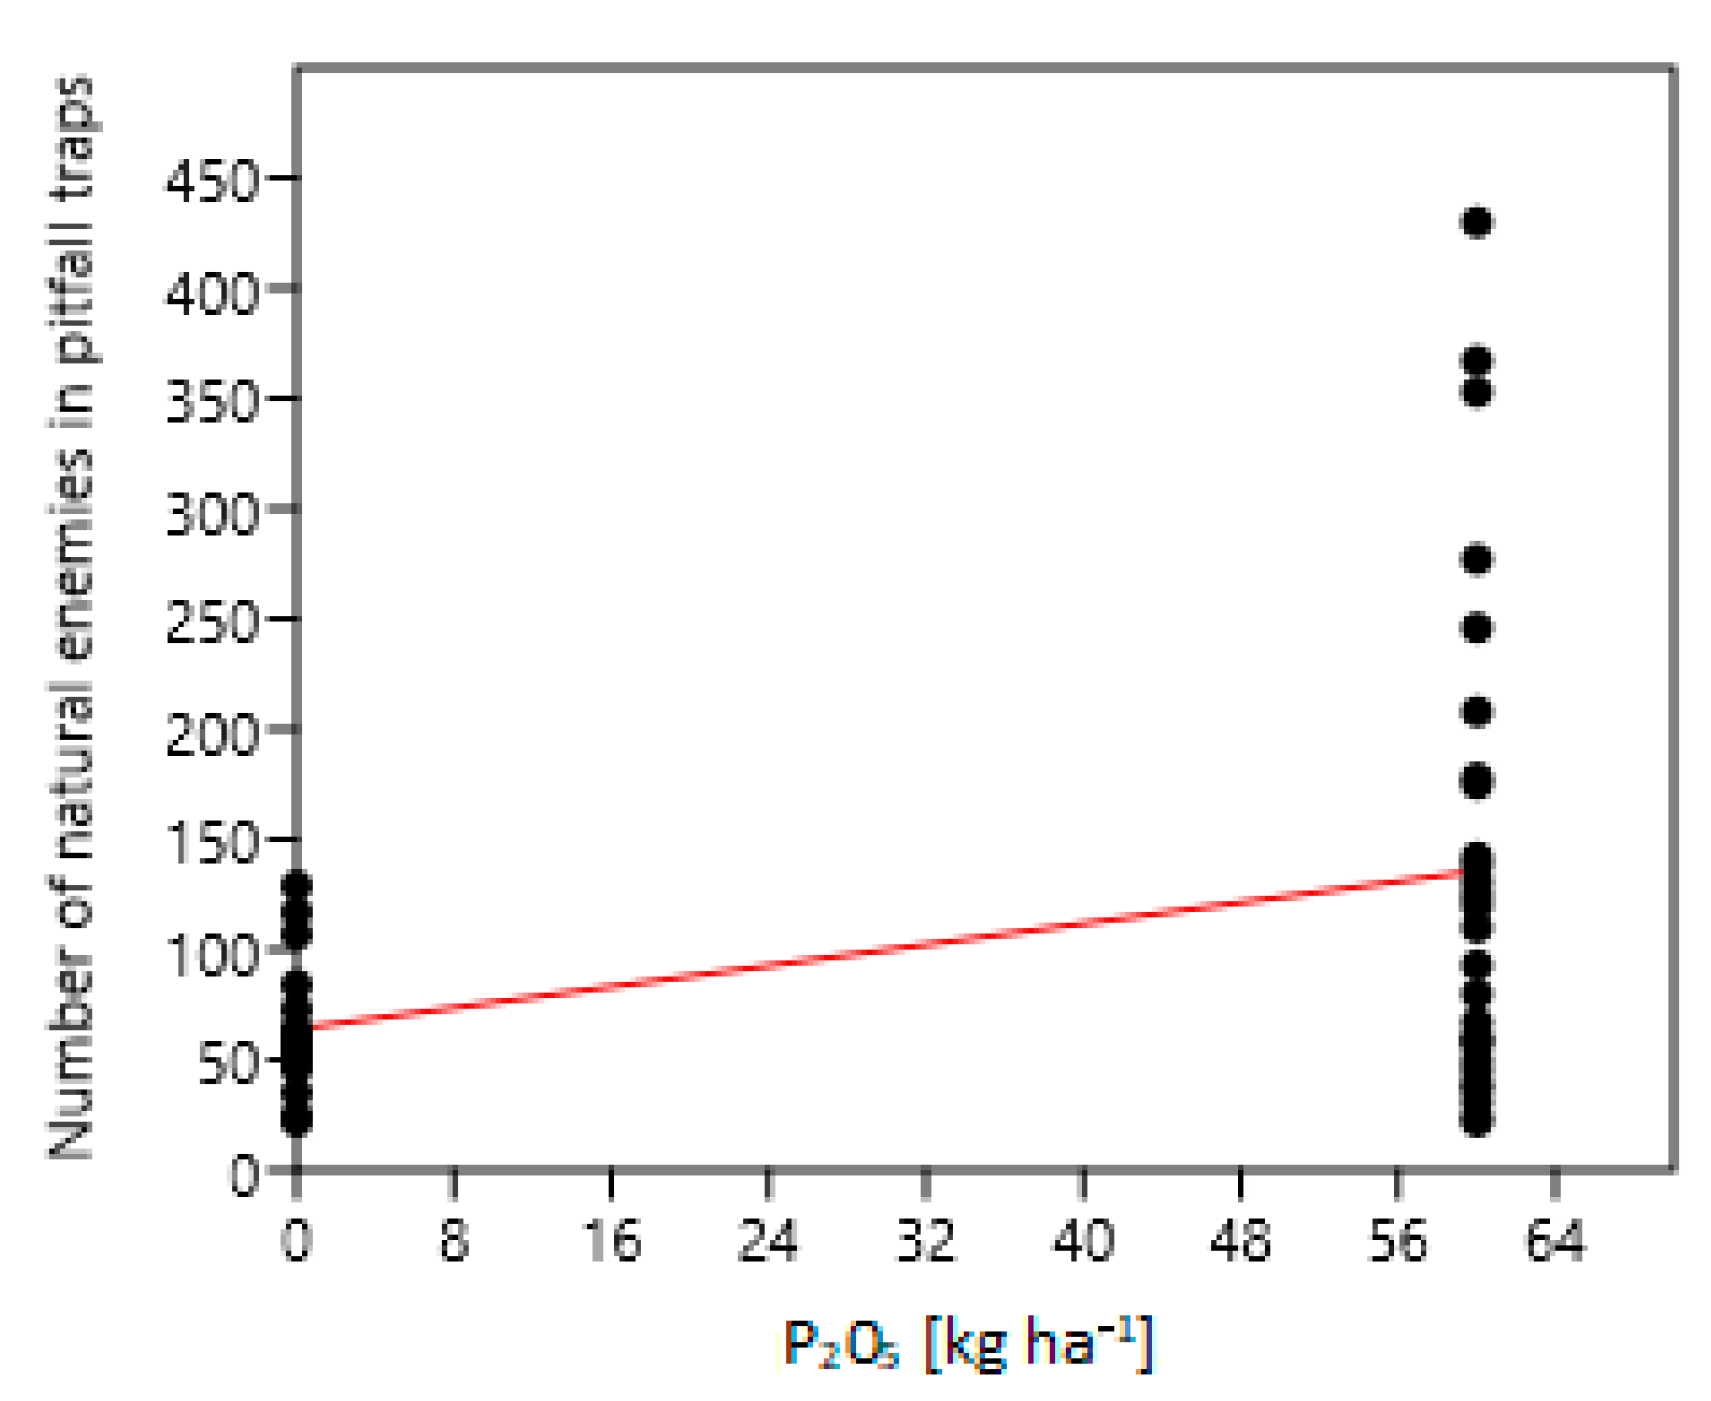
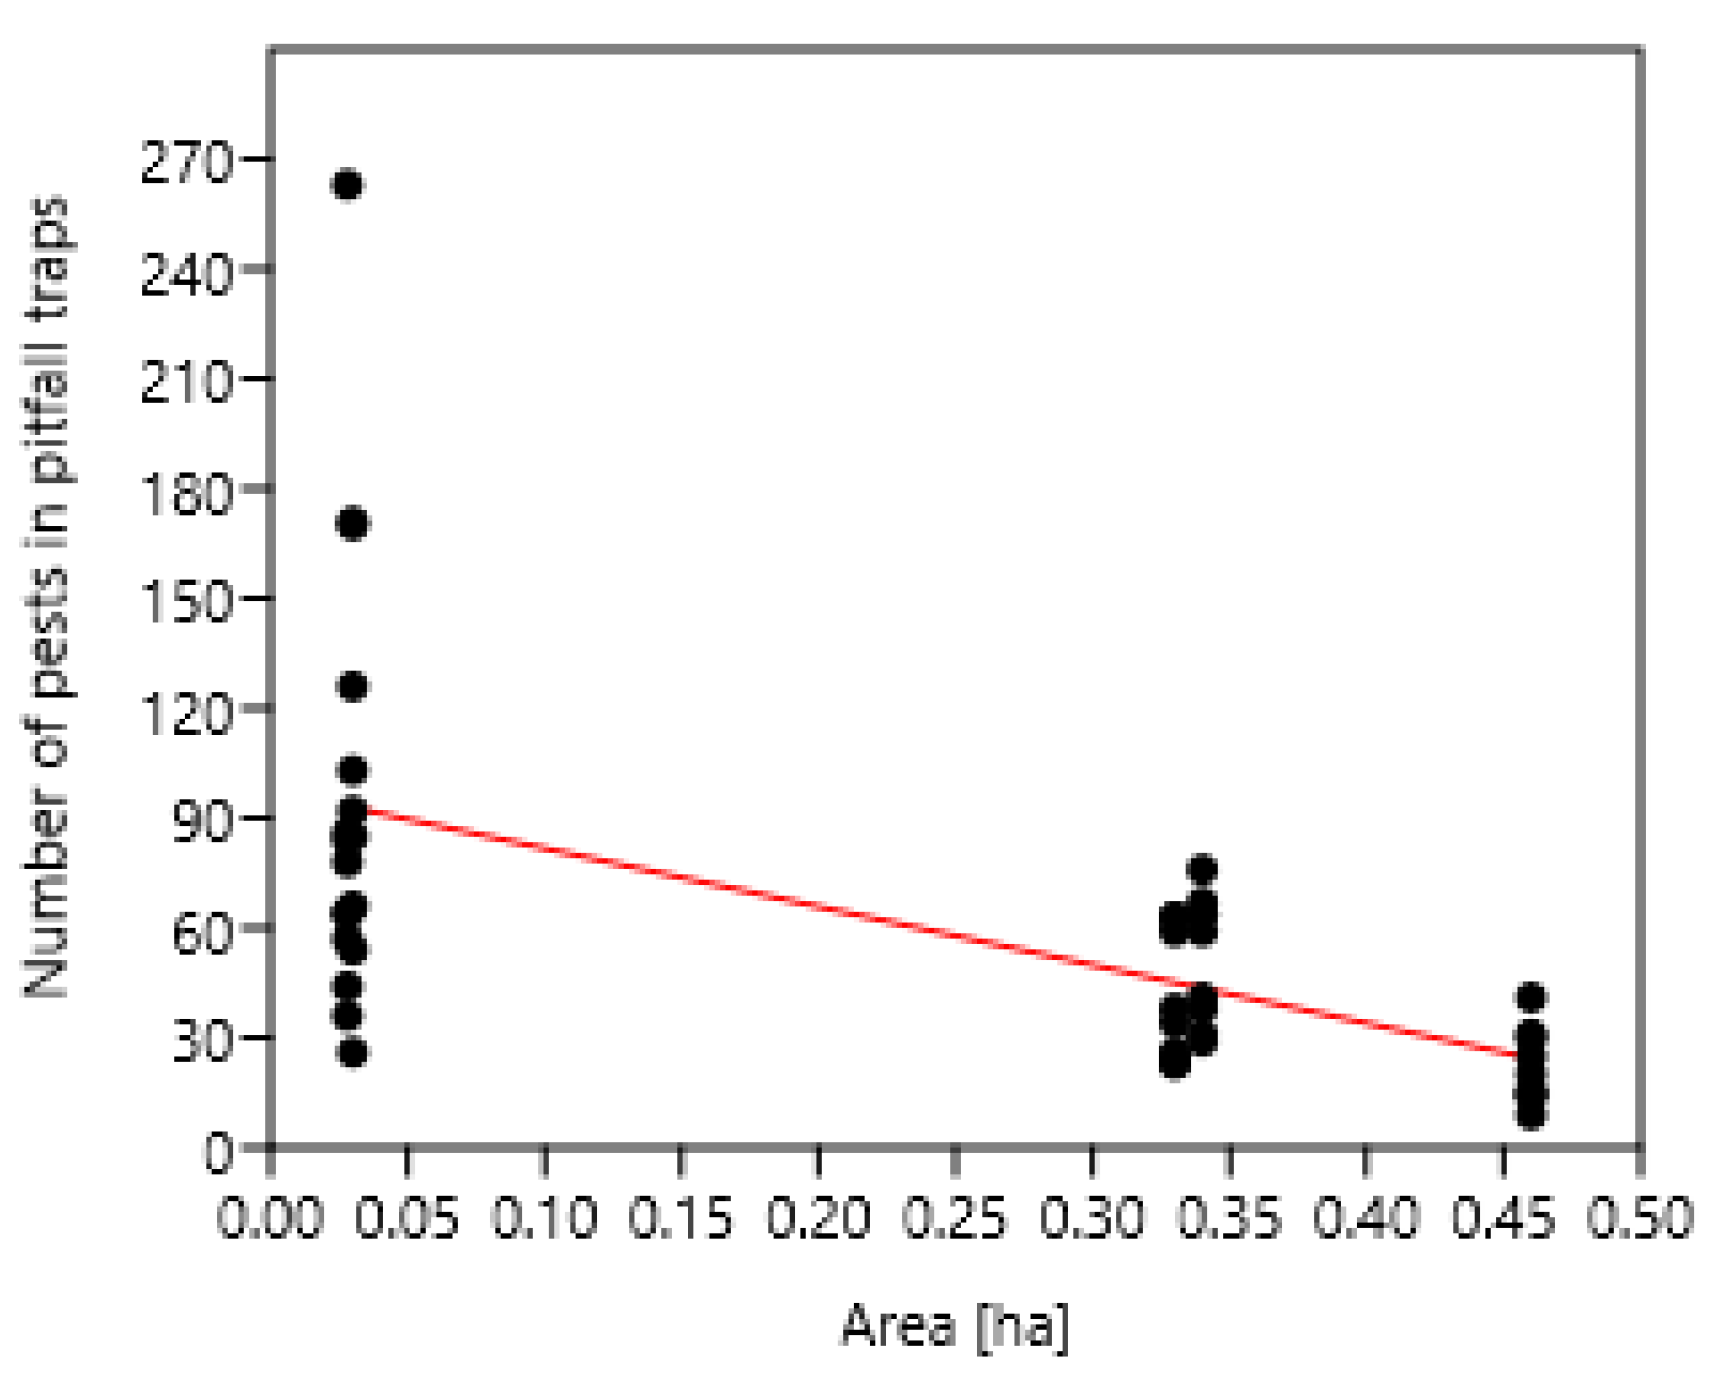
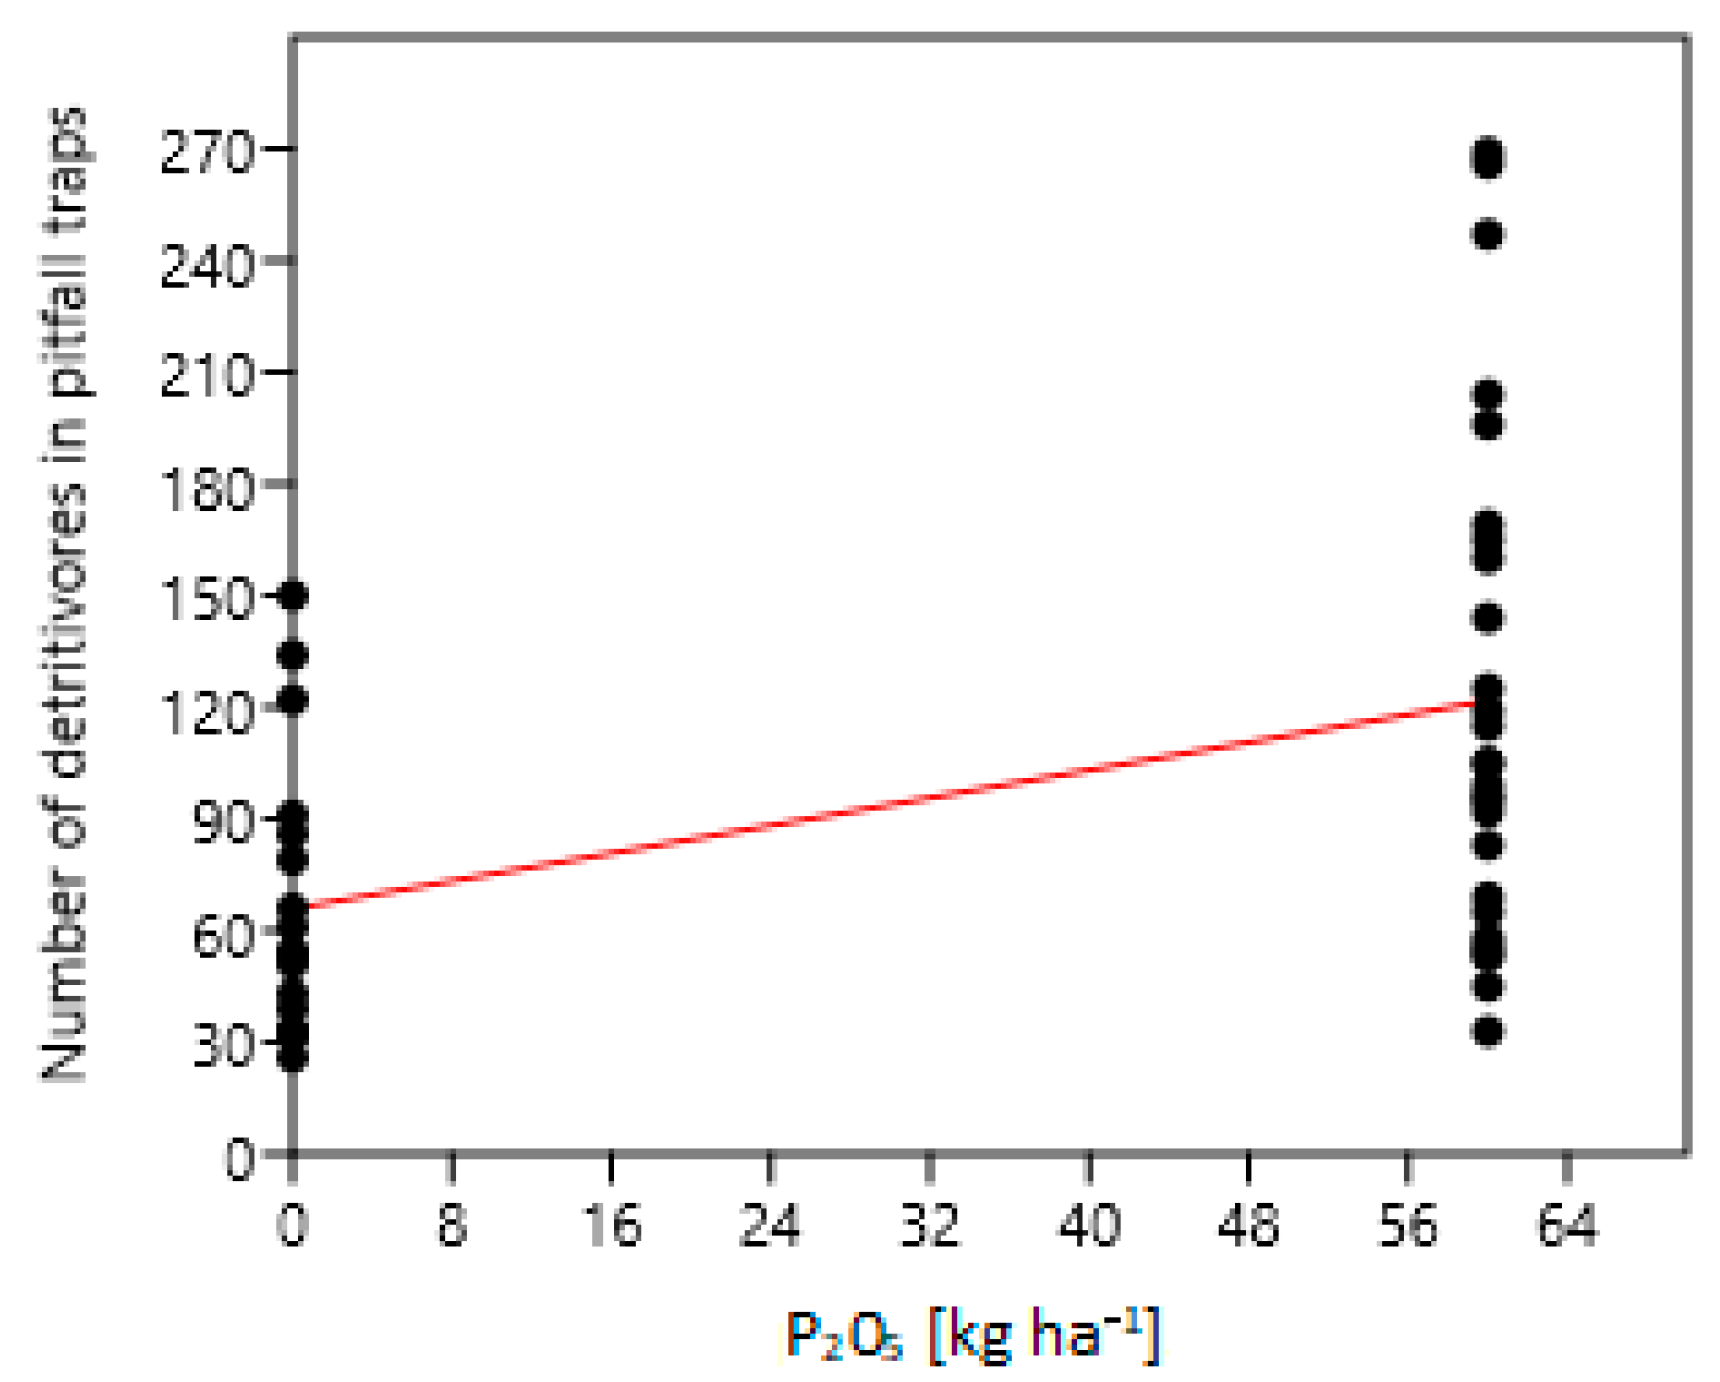
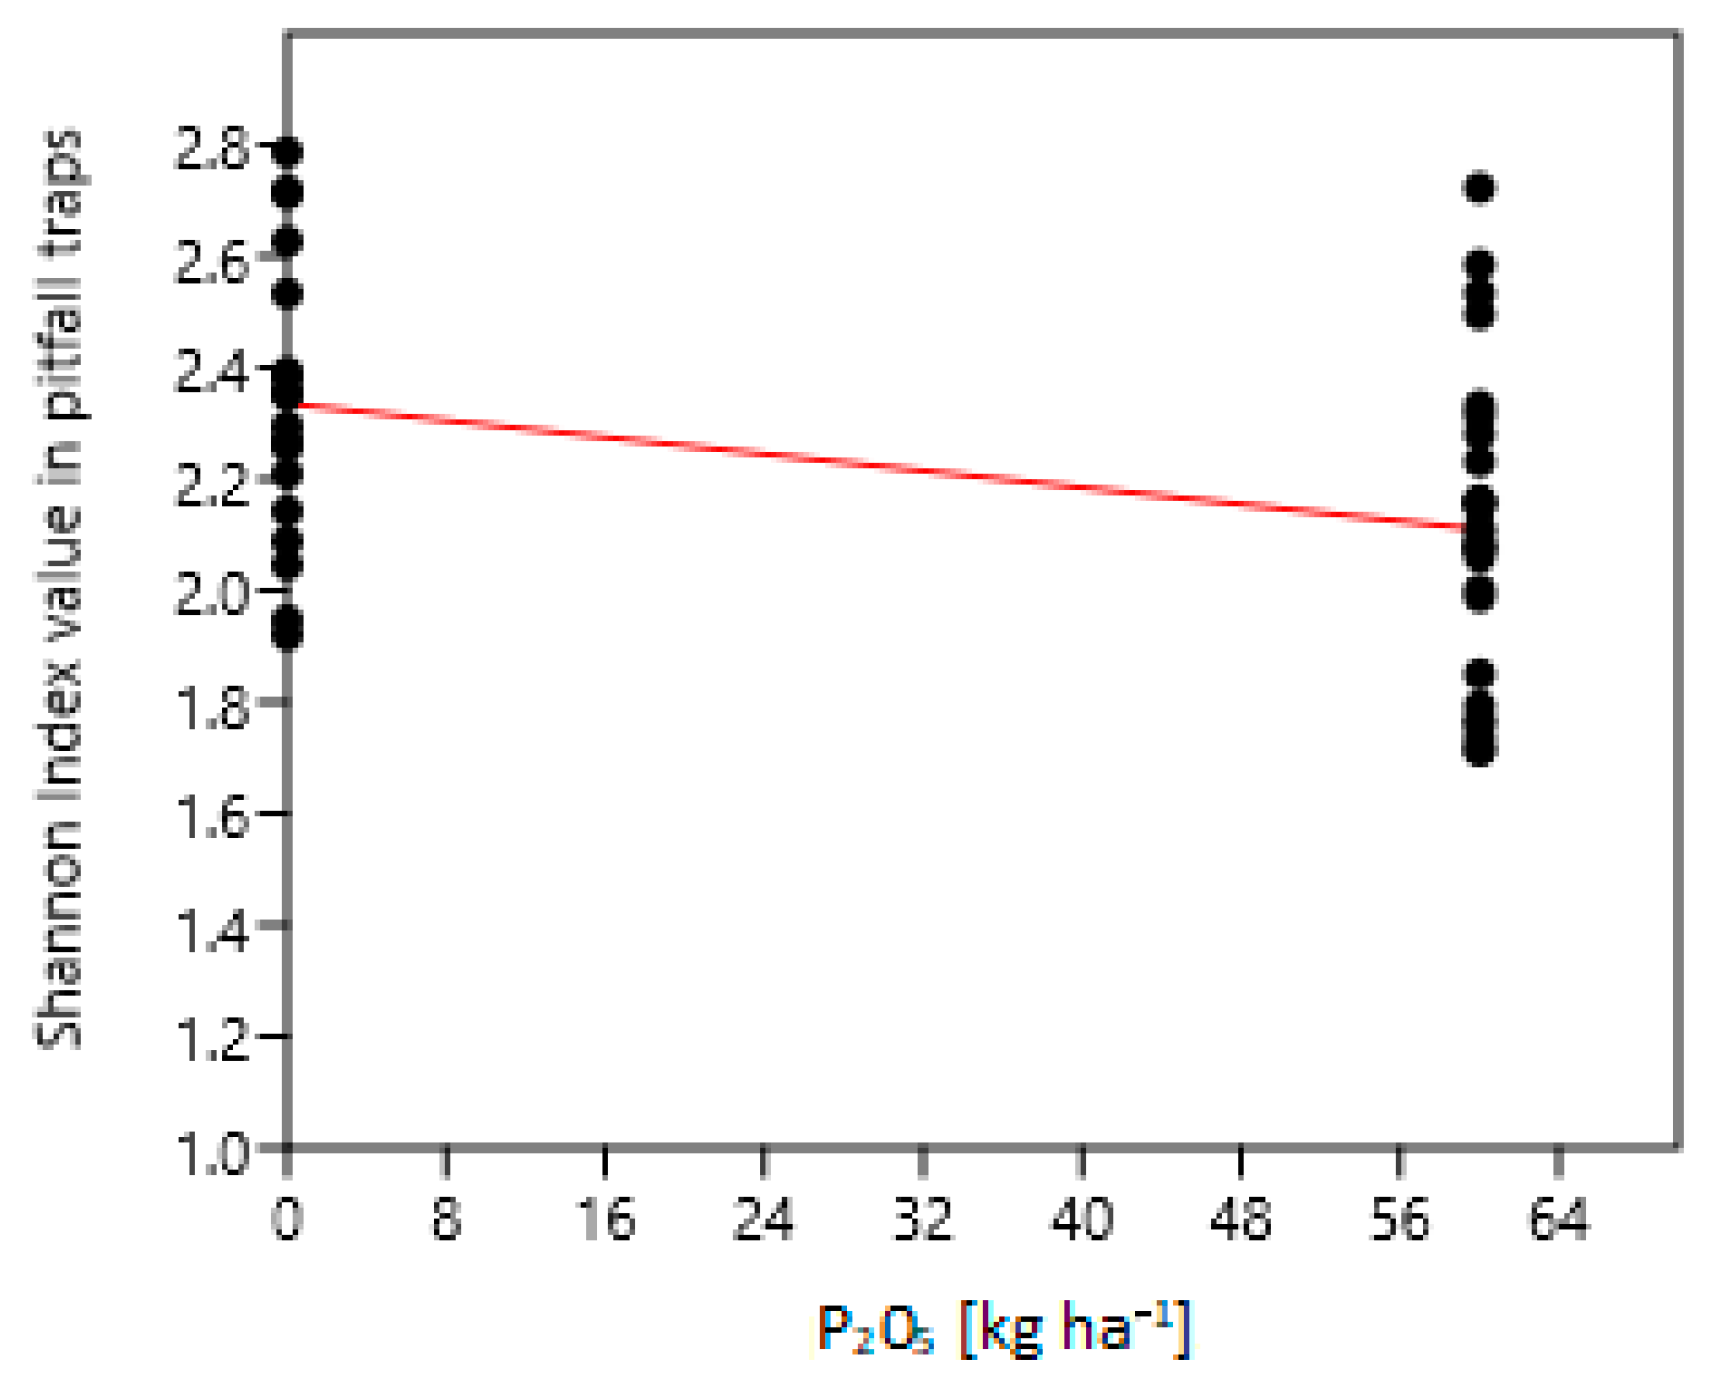
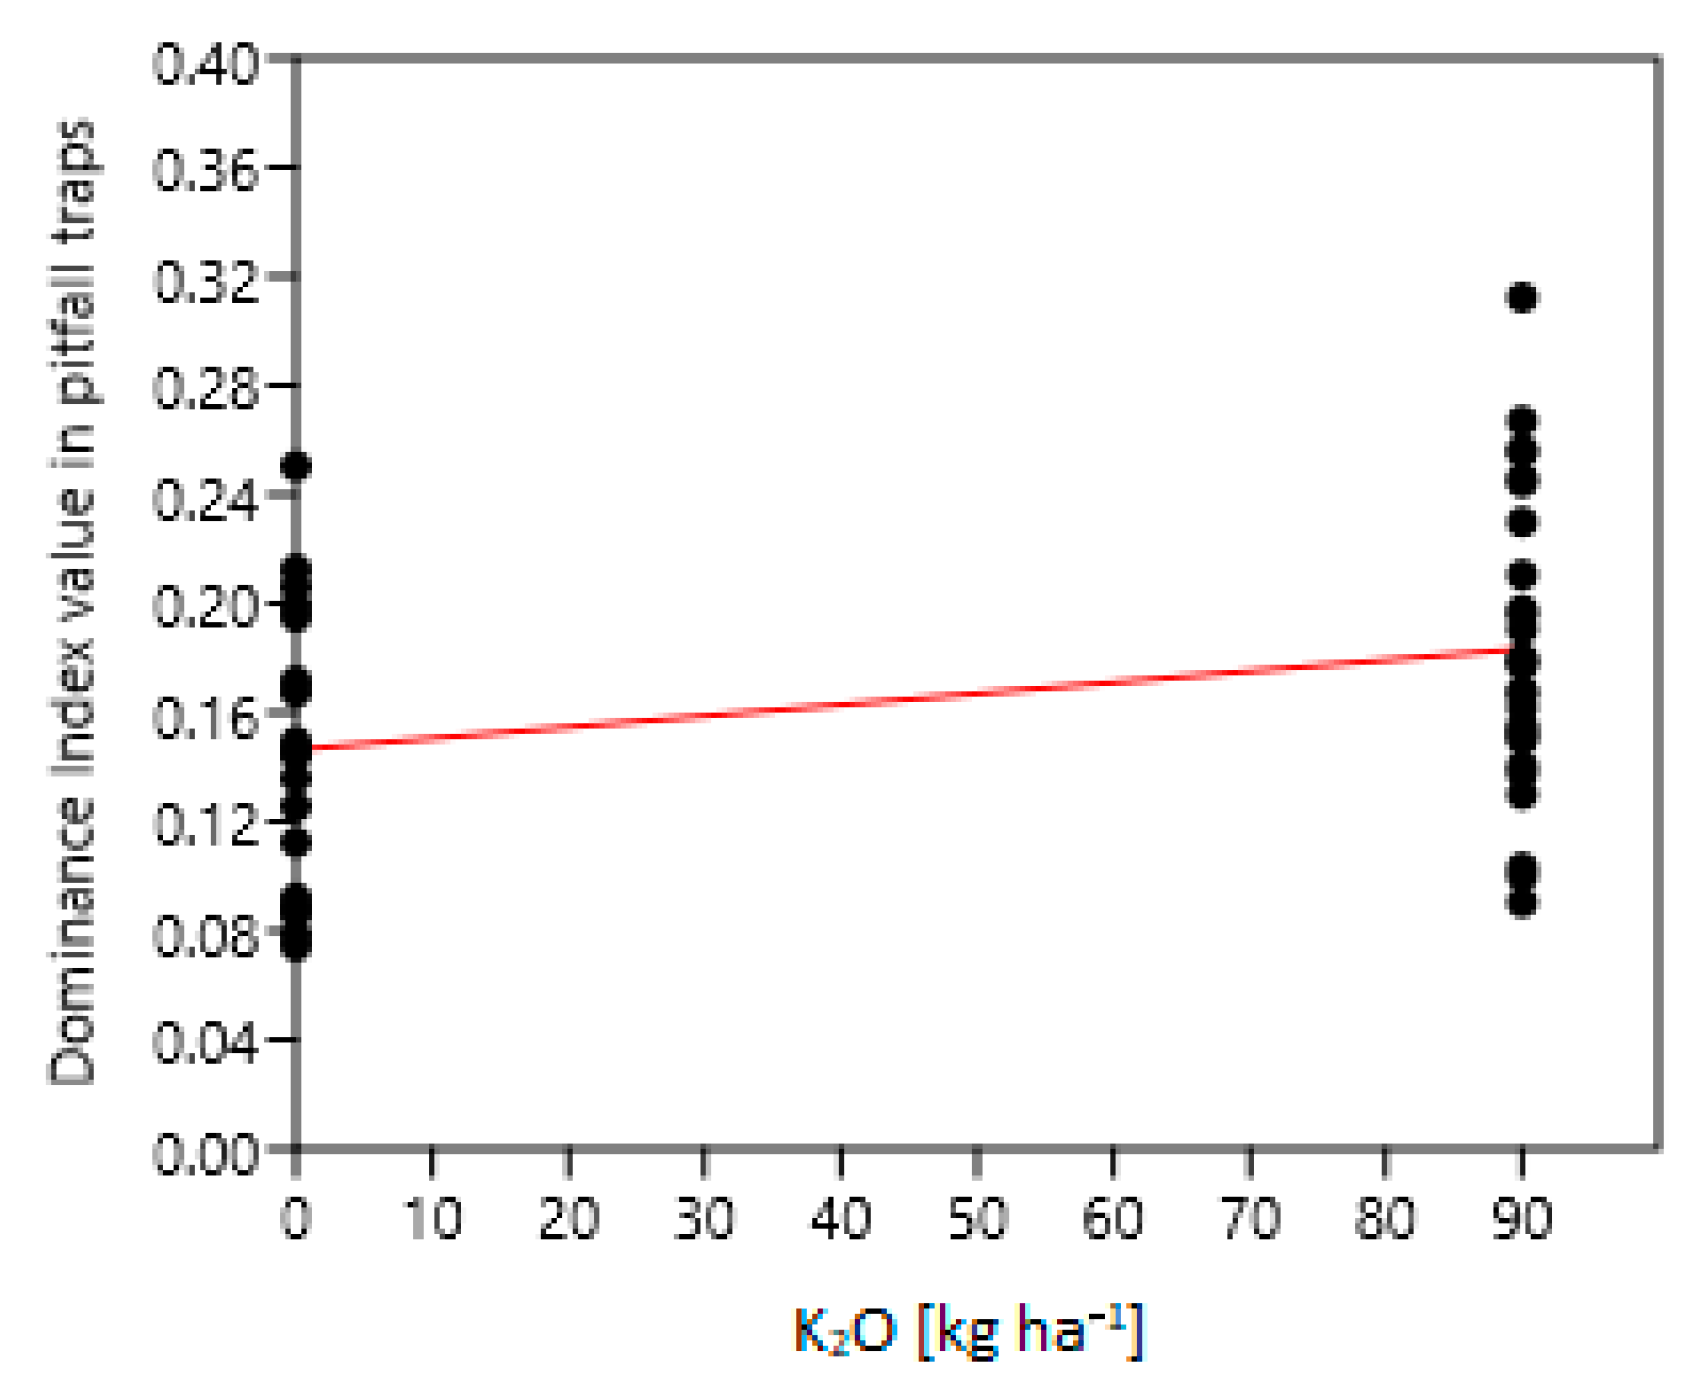
None of the agrotechnical factors explained differences in the number of taxa. A higher level of phosphorus fertilization was a factor increasing the number of arthropod individuals in the samples (Figure 11), including natural enemies of pests (Figure 12). The number of pests decreased with the size of plantations (Figure 13). Phosphorus fertilization had a positive effect on the number of detritivores (Figure 14). A higher level of phosphorus fertilization also influenced lower values of Shannon’s index of arthropod population (Figure 15). The level of potassium fertilization increased the value of the Dominance Index (Figure 16). The obtained results indicate that the diversity of ground insects may decrease with increasing intensity of agrotechnical treatments, however, some beneficial arthropod groups such as predators and detritivores may become more numerous under these conditions.
3.3. Diversity of Arthropods in Yellow Bowl Traps
The total number of specimens collected from yellow bowl traps was similar to the total number of specimens collected from pitfall traps, despite the smaller number of samples of yellow bowl traps. Representatives of 17 orders were identified, including: Acari, Araneae, Coleoptera, Dermaptera, Diptera, Entomobryomorpha, Hemiptera, Hymenoptera, Lepidoptera, Mecoptera, Neuroptera, Opiliones, Orthoptera, Raphidioptera, Symphypleona Thysanoptera, Zygoptera, as well as 63 families and 83 taxa at species level (Table 6).
No significant differences between the crops were found, which was probably related to the low number of repetitions. Most insects were captured in the control plot (Table 7). Pollinators also included taxa, which may be as well crop pests or natural enemies of pests in part of their life cycle.
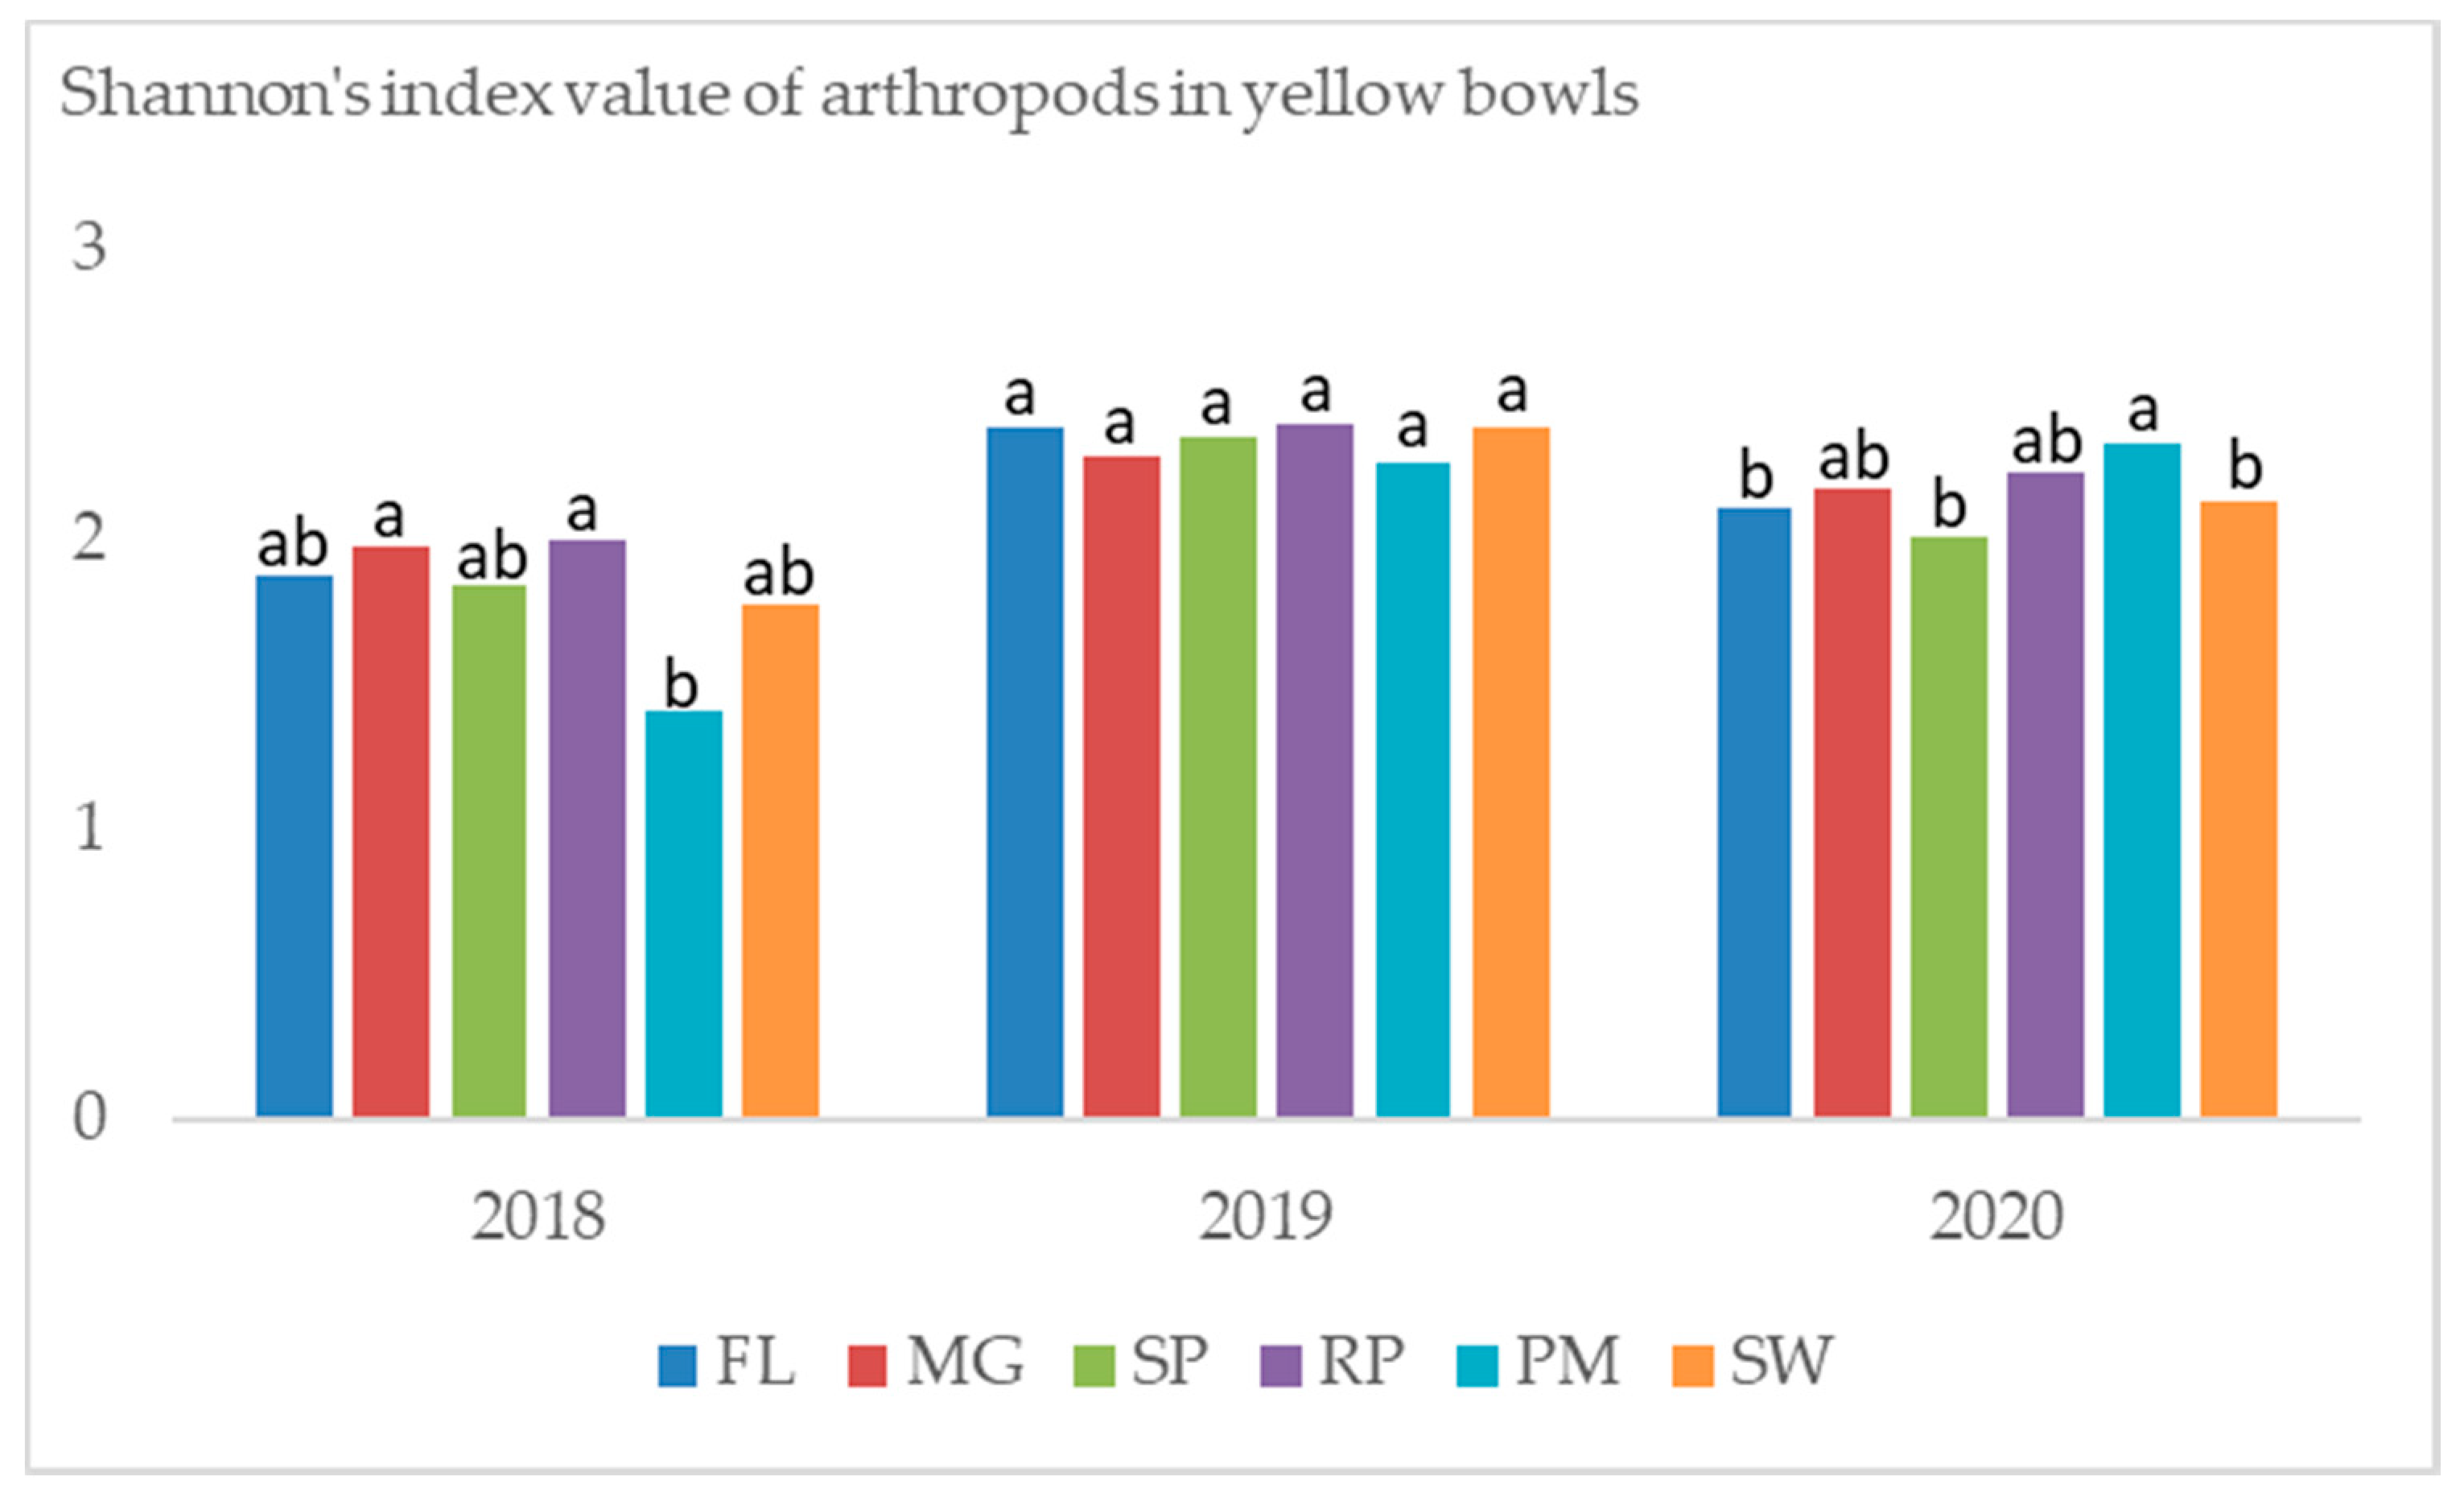
The diversity of arthropods obtained by bowl trap method varied from each year to the next. In 2018, the diversity in poplar cultivation was significantly lower than in the cultivation of black locust (Figure 17). In the following year, all crops did not differ in Shannon’s diversity index, which was high for all crops. In 2020, the greatest diversity of arthropods was observed in poplar than for the control, cup plant, and willow.
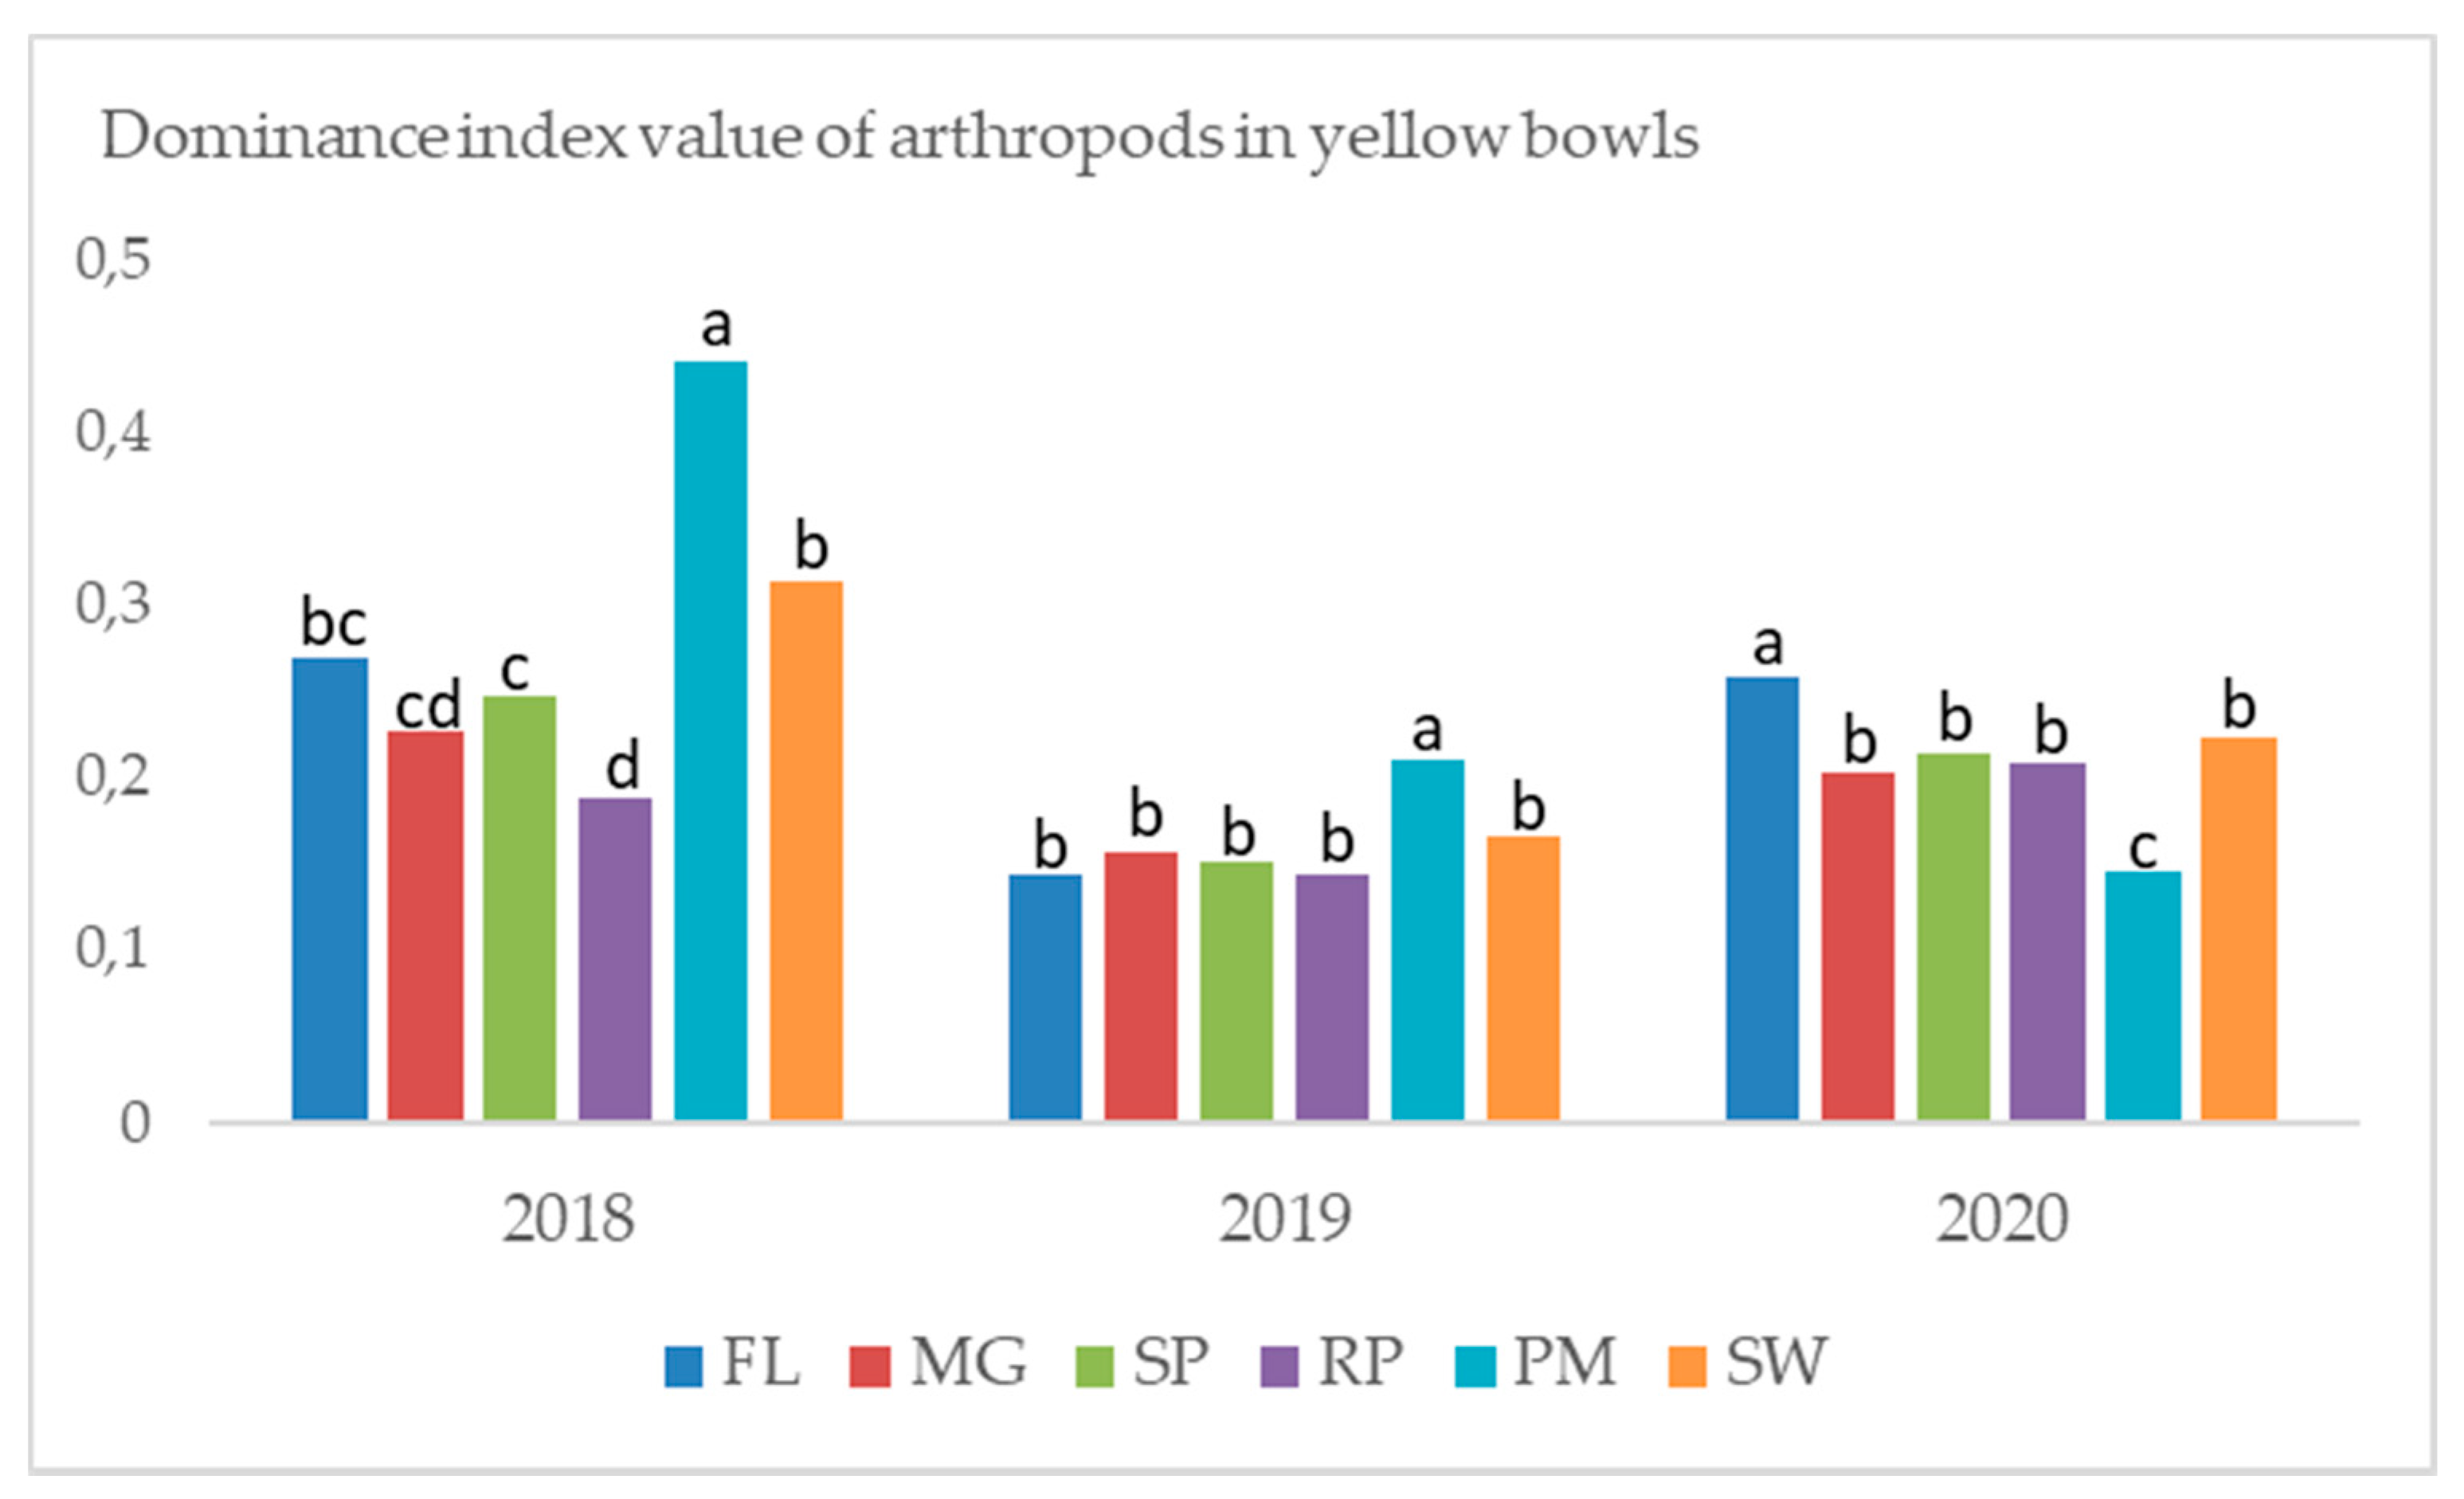
In yellow bowl traps high values of Dominance Index were observed only in the first year of the study. The highest level of domination was found in the samples from poplar and willow in 2018 and 2019 (Figure 18). Diptera insects were the most abundant in all crops. Hover flies Syrphidae were dominant pollinator taxa in control and in black locust. Relatively few pollinators were caught, which could be explained by poorly diversified landscape, dominated mostly by cereal crops. Few representatives of bees Apidae were found, mostly in the control plot. On the other hand, there was good representation of parasitic wasps both Ichneumonidae and Aphidiinae. Aphid parasitoids accounted for 12.5% of the insect population in miscanthus, 9.4% in black locust, and 6.6% in willow. Parasitoids were dominant taxa in all perennial crops, while in control they accounted only for 2.6% of all arthropods from bowl traps. Aphid population was the most numerous in the control plot (10.3%), being second dominant only after taxa after flies Diptera.
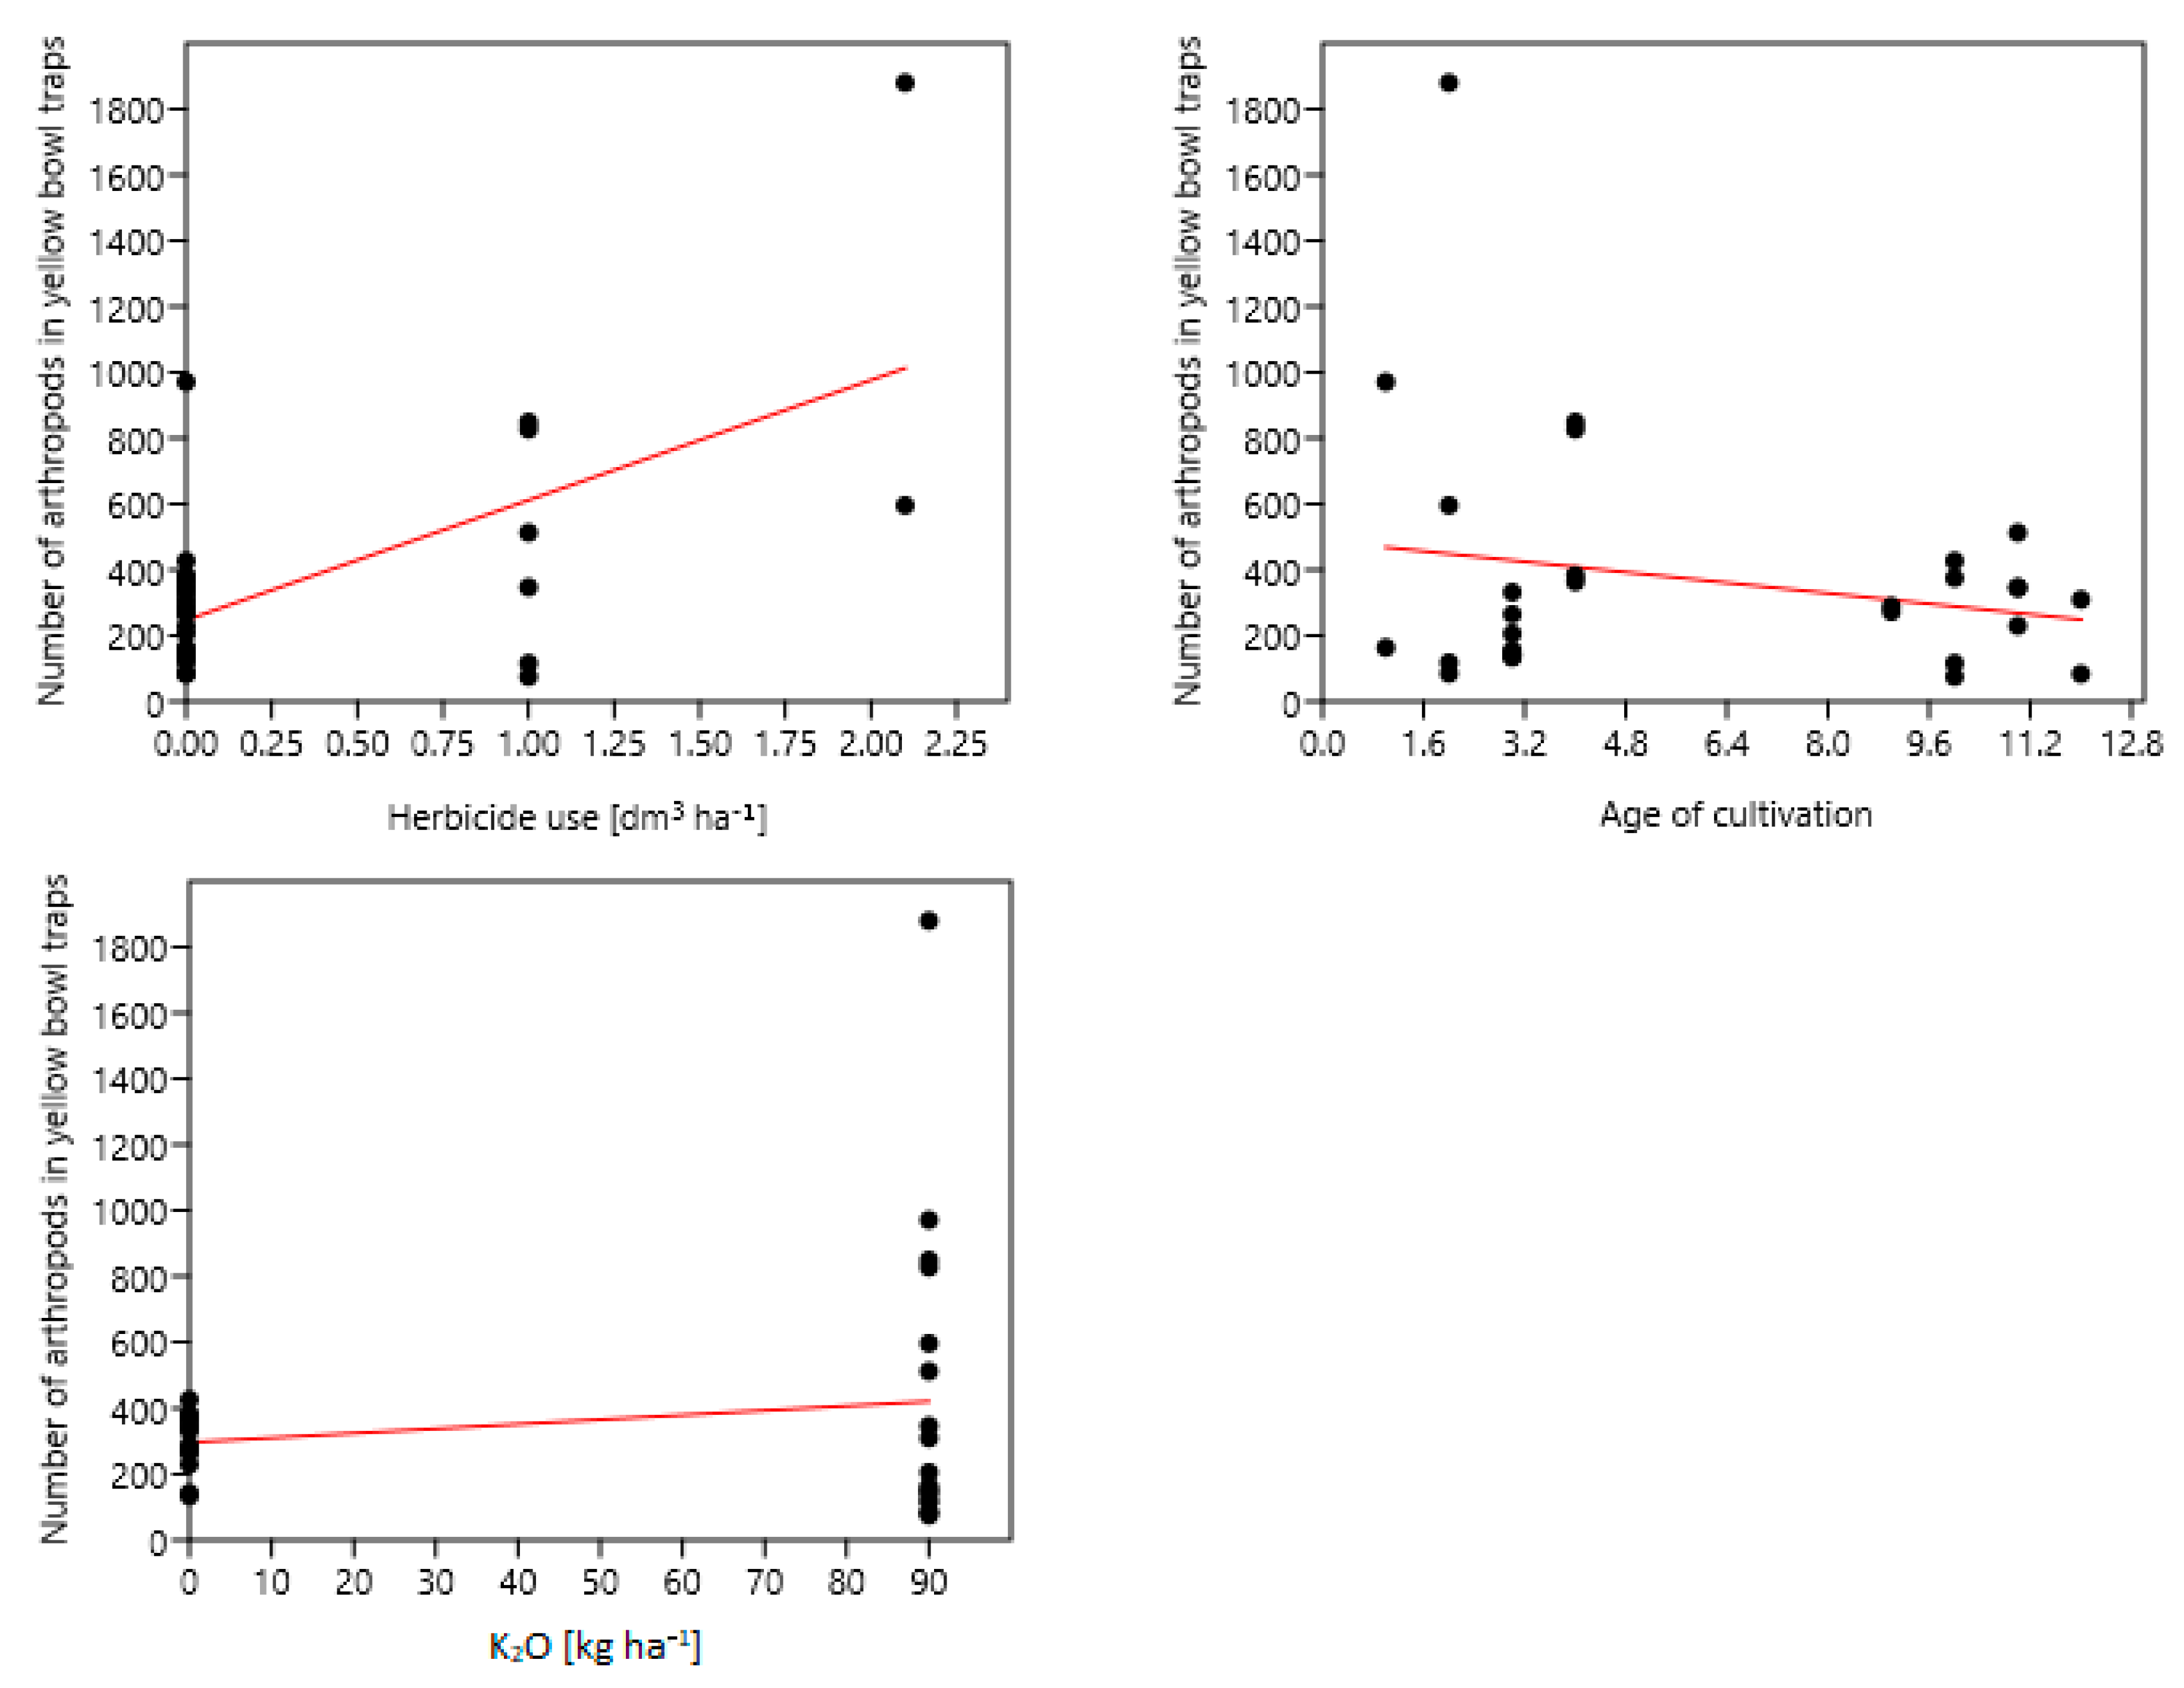
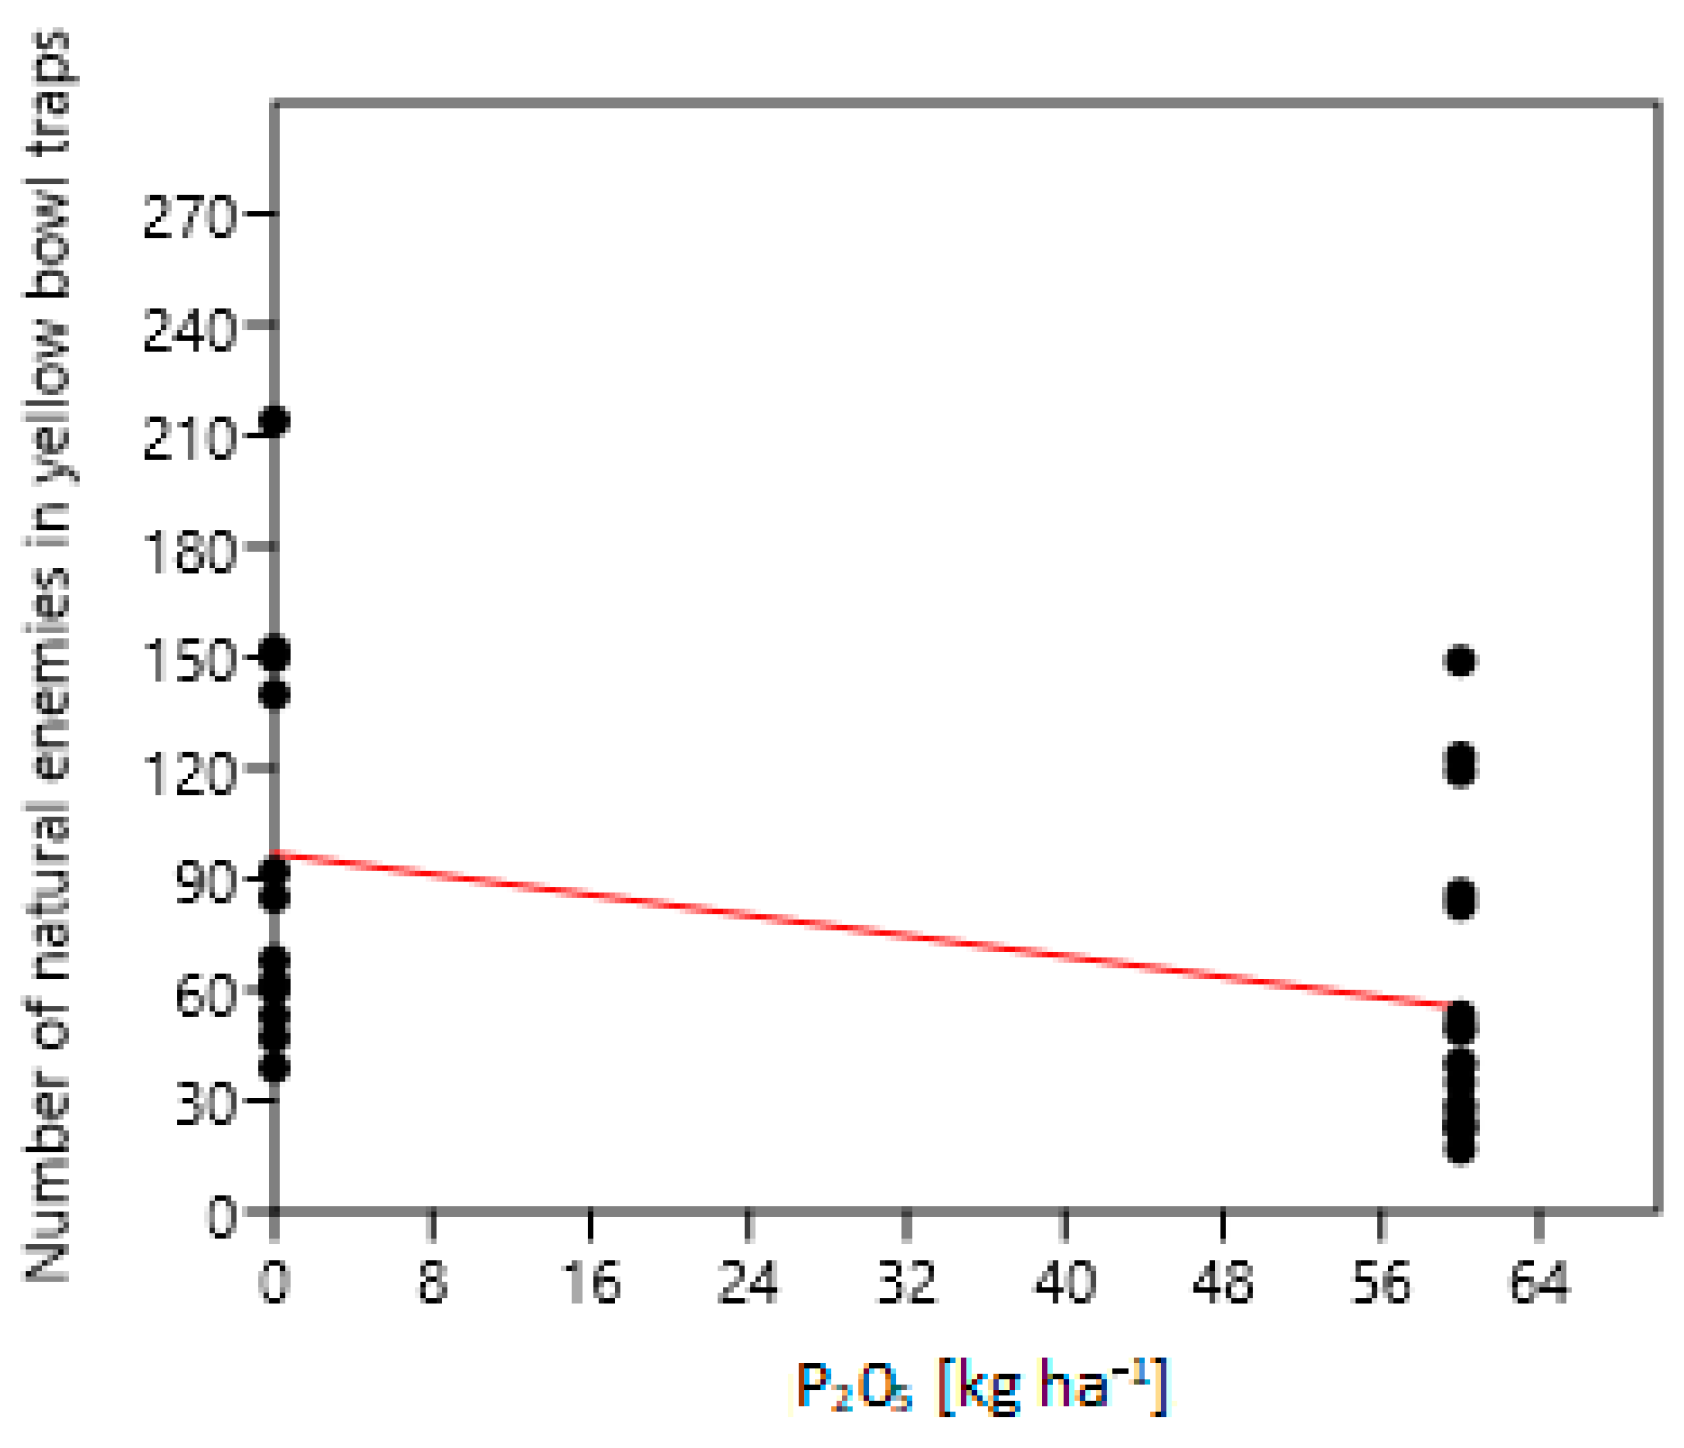
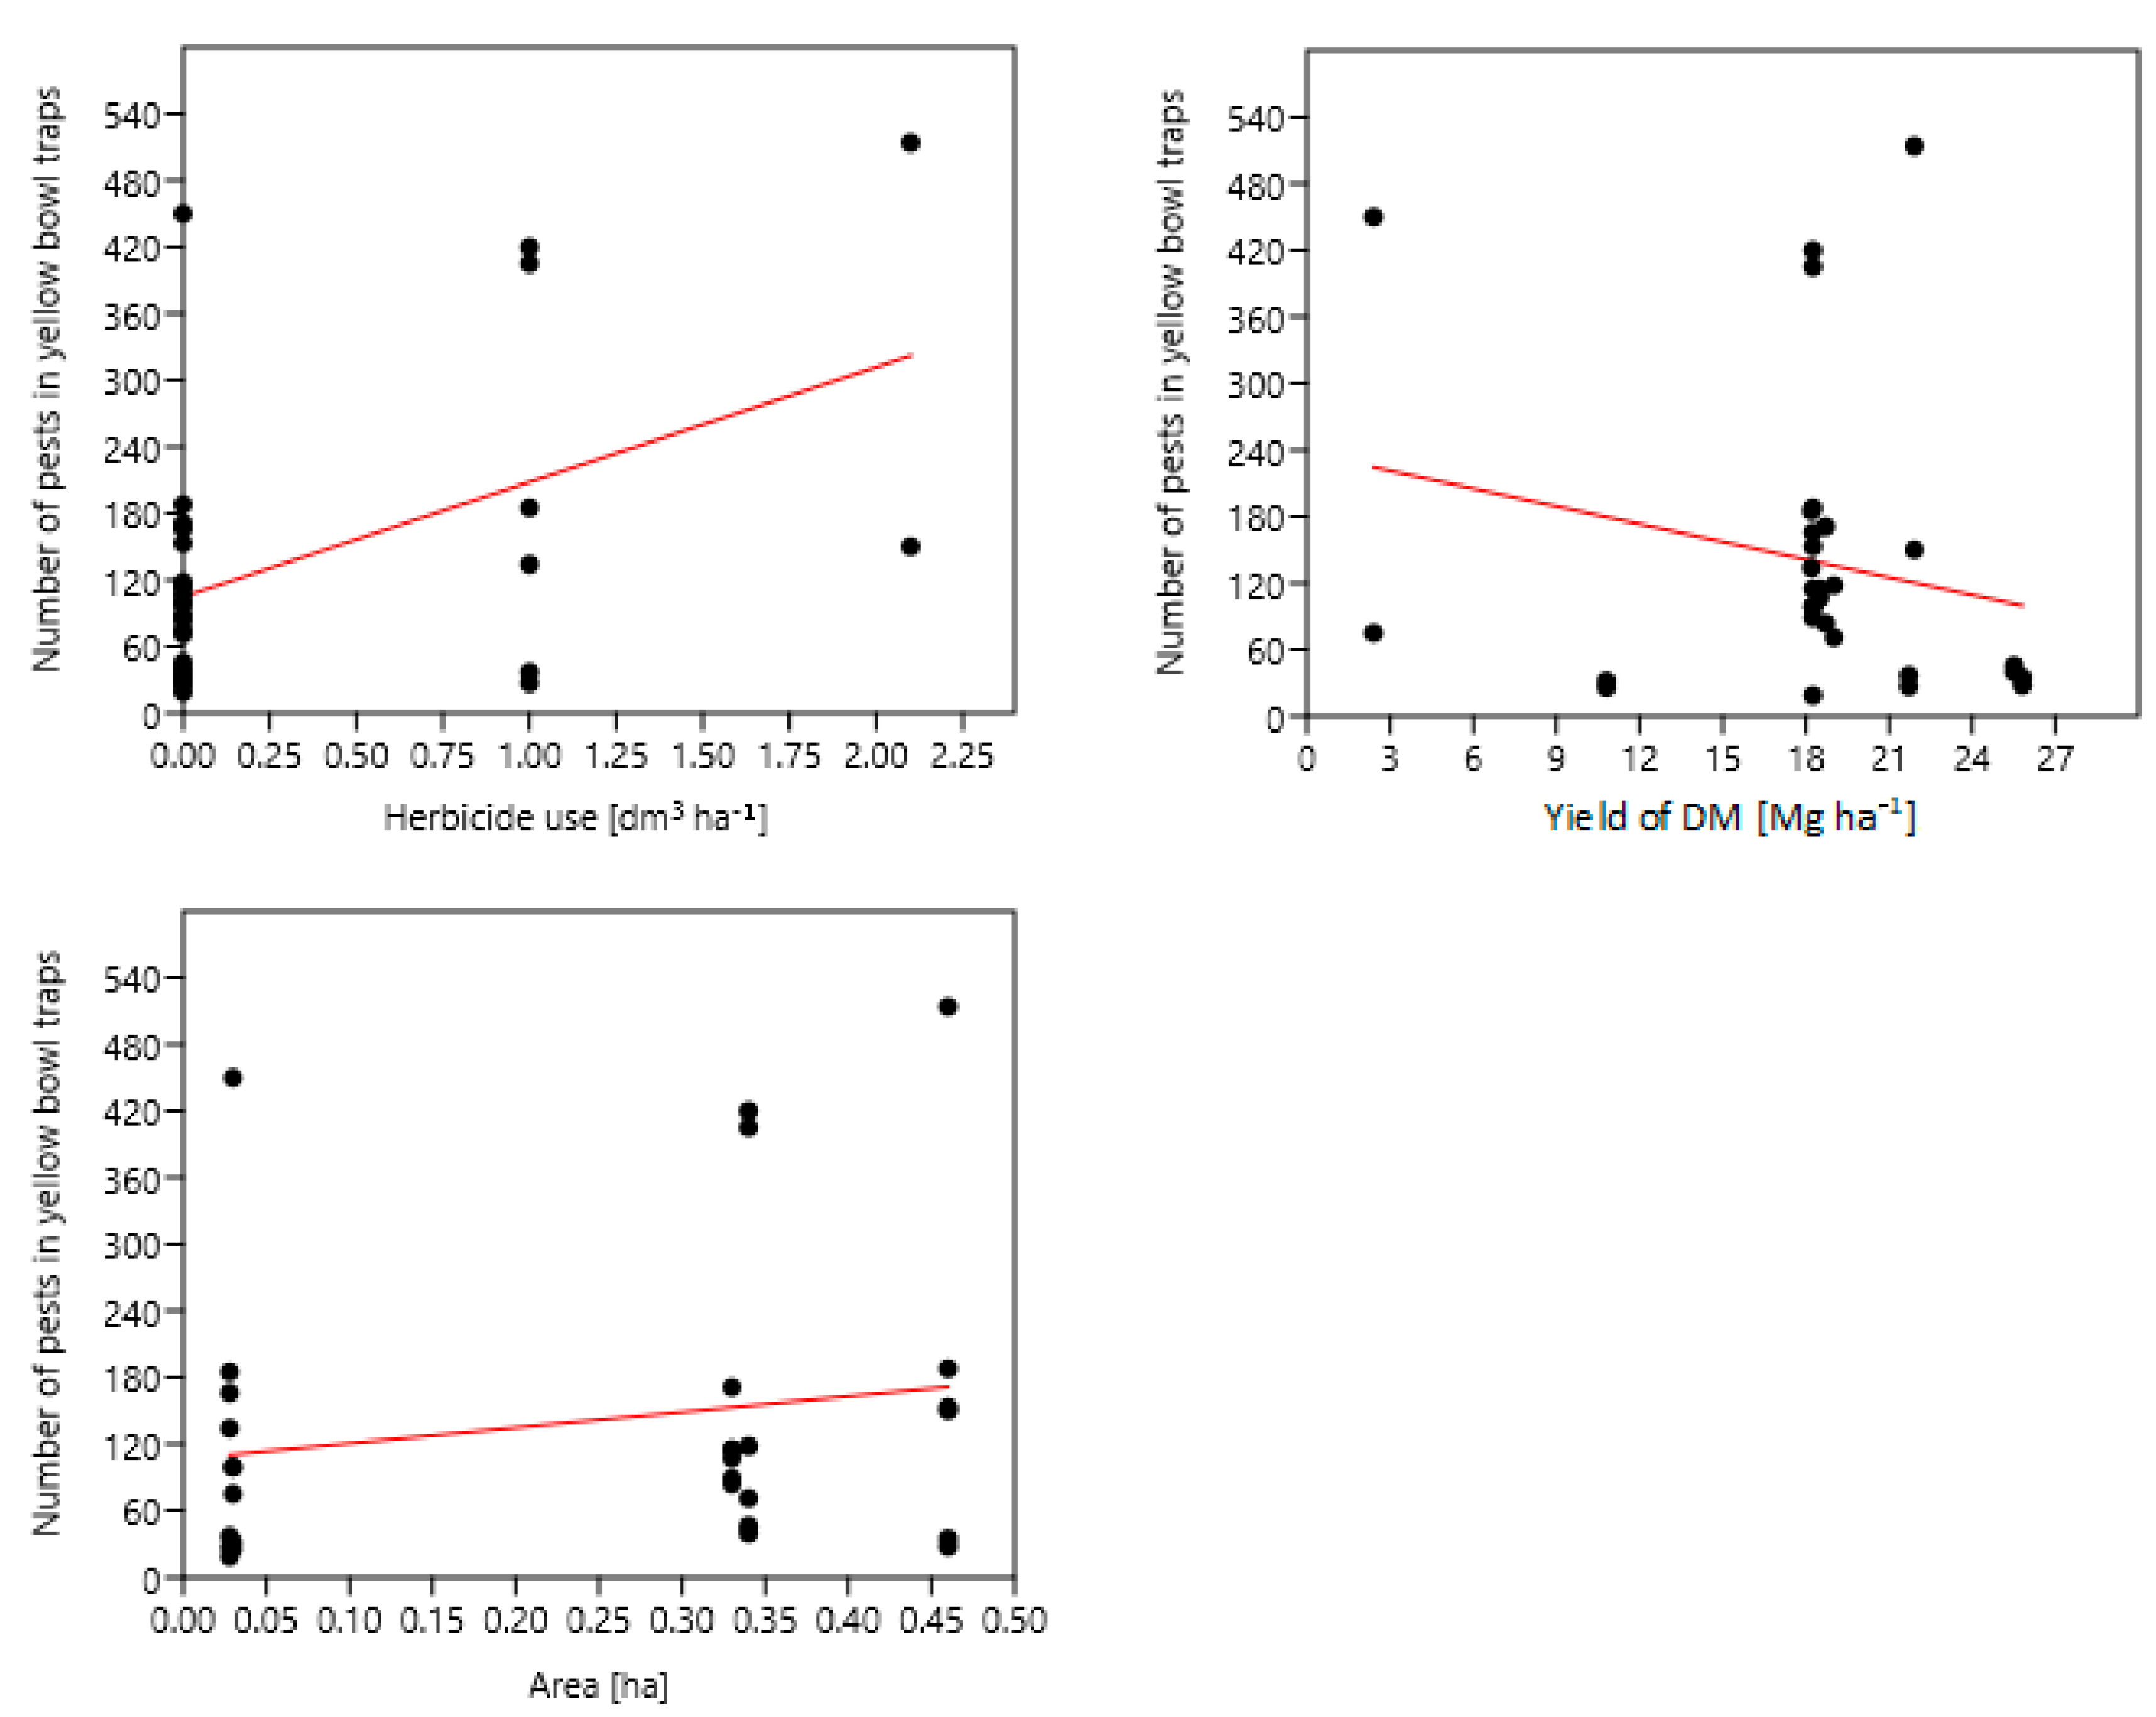
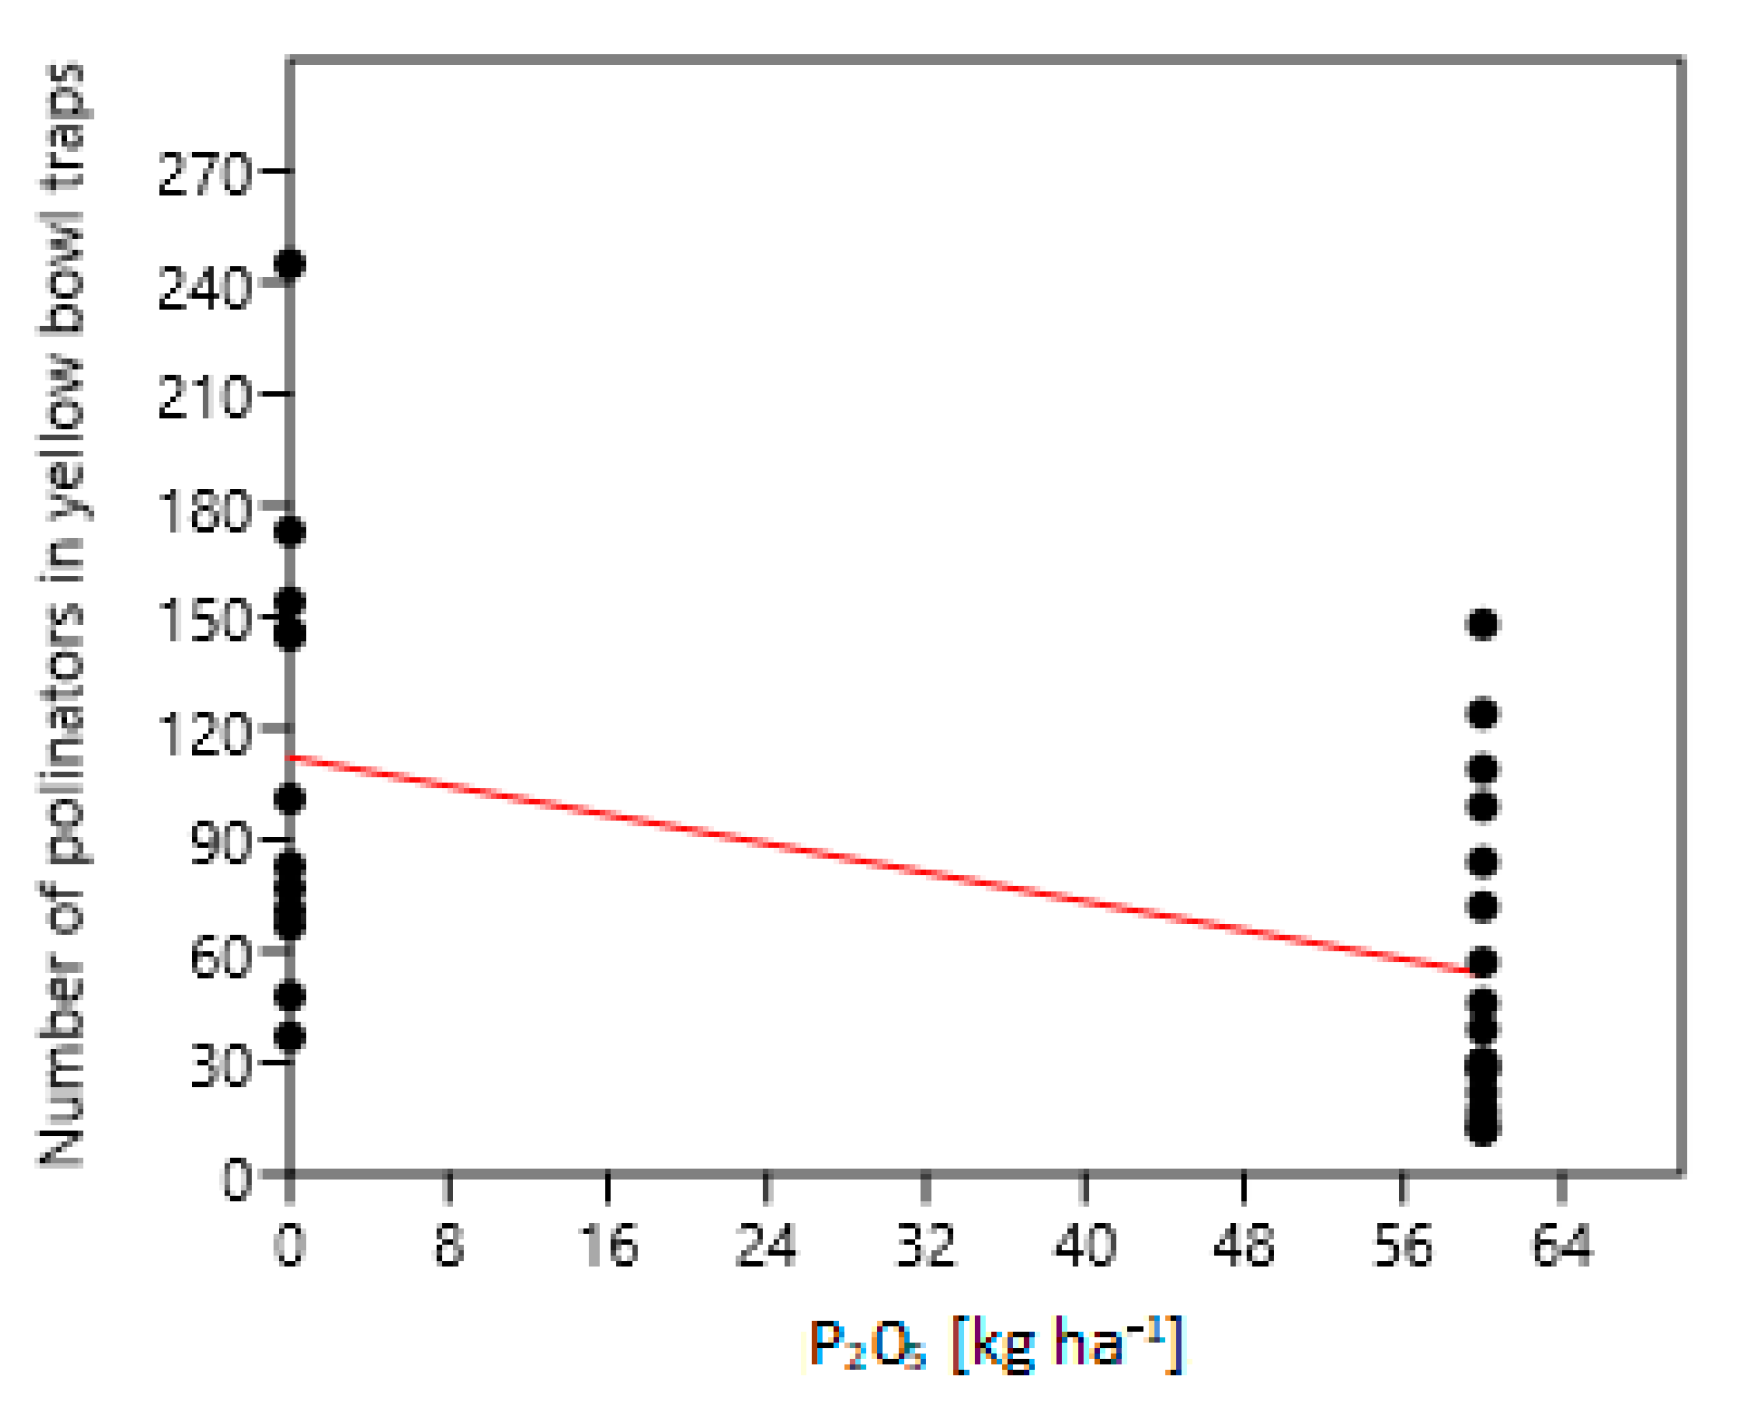
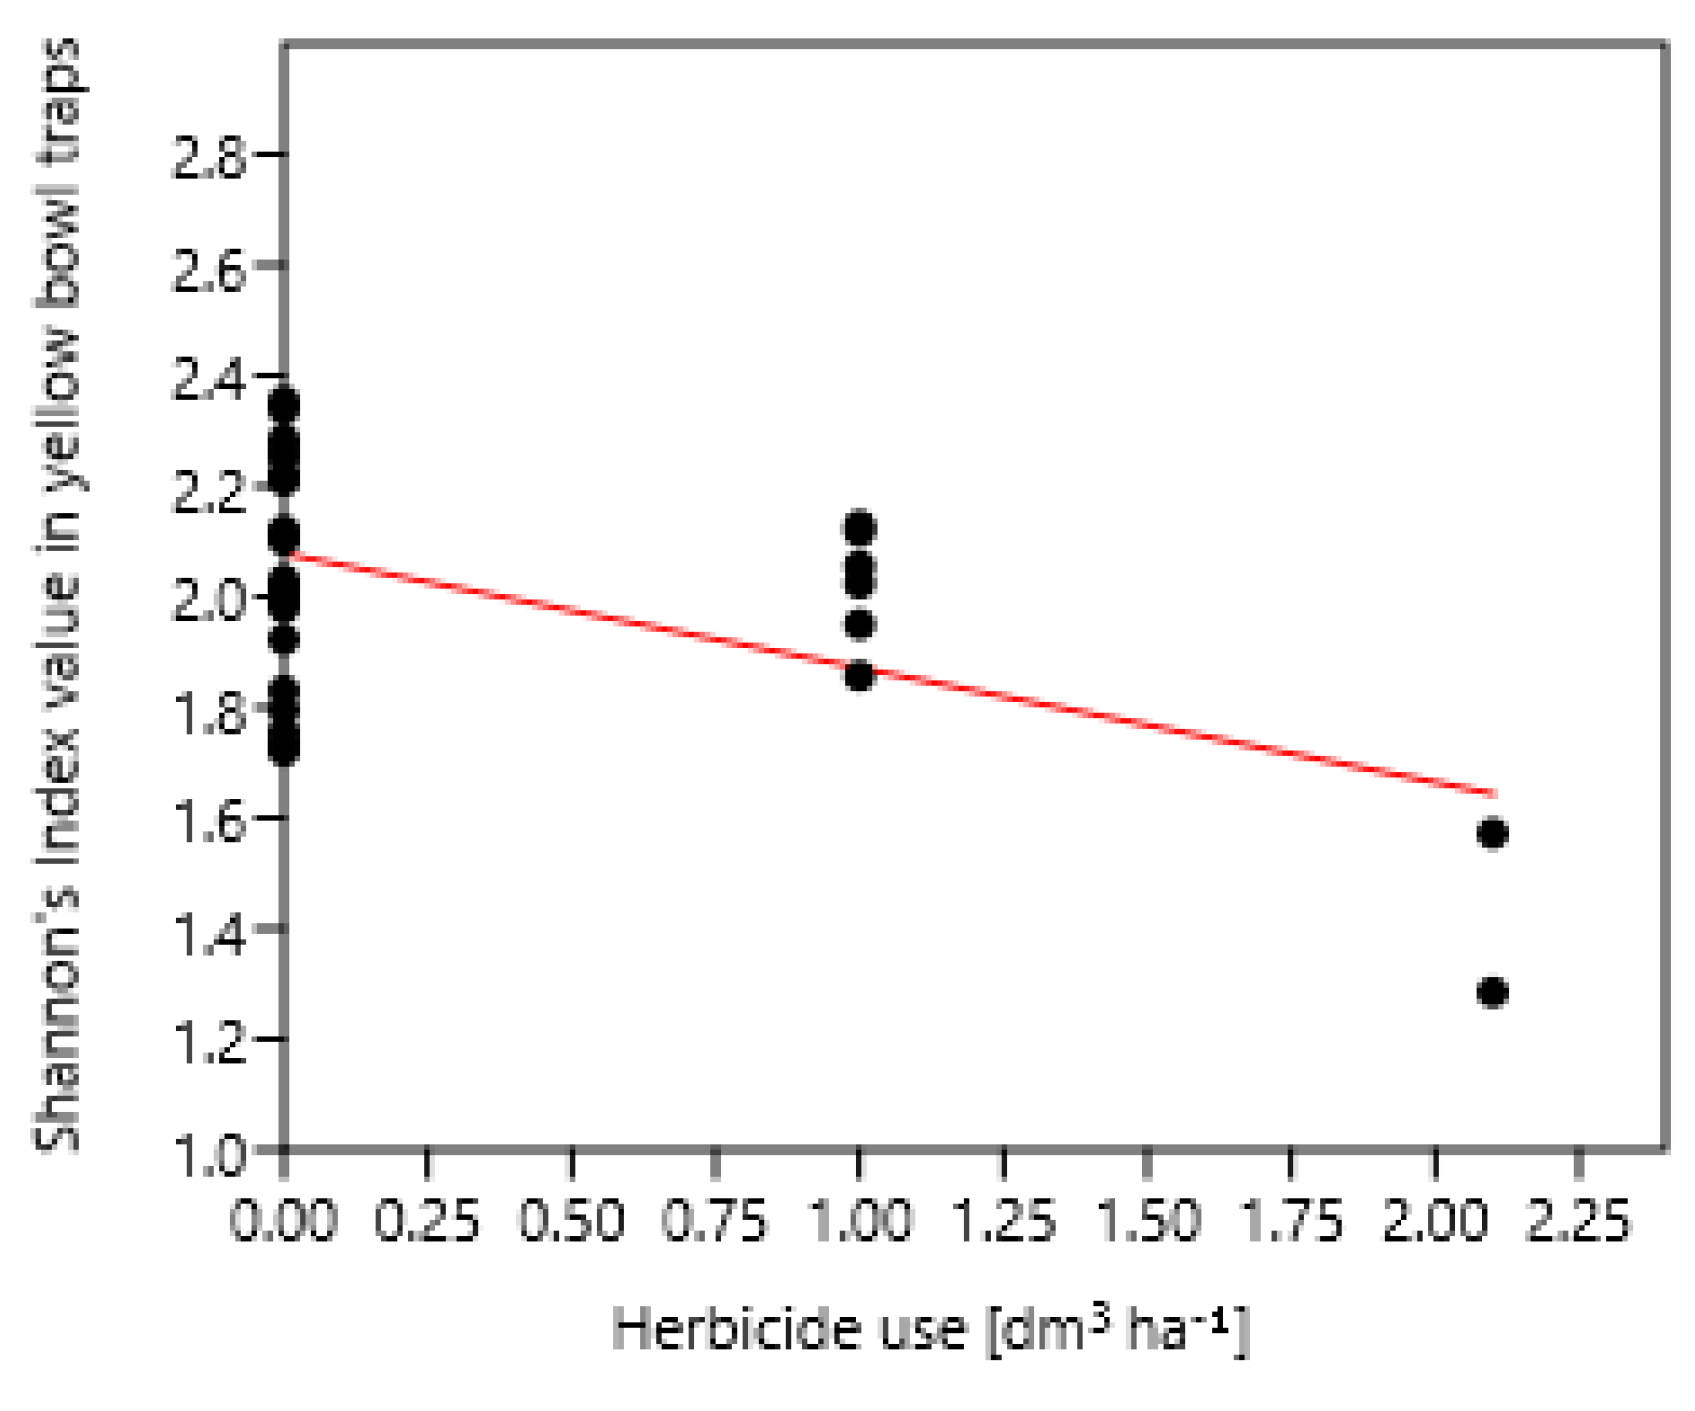
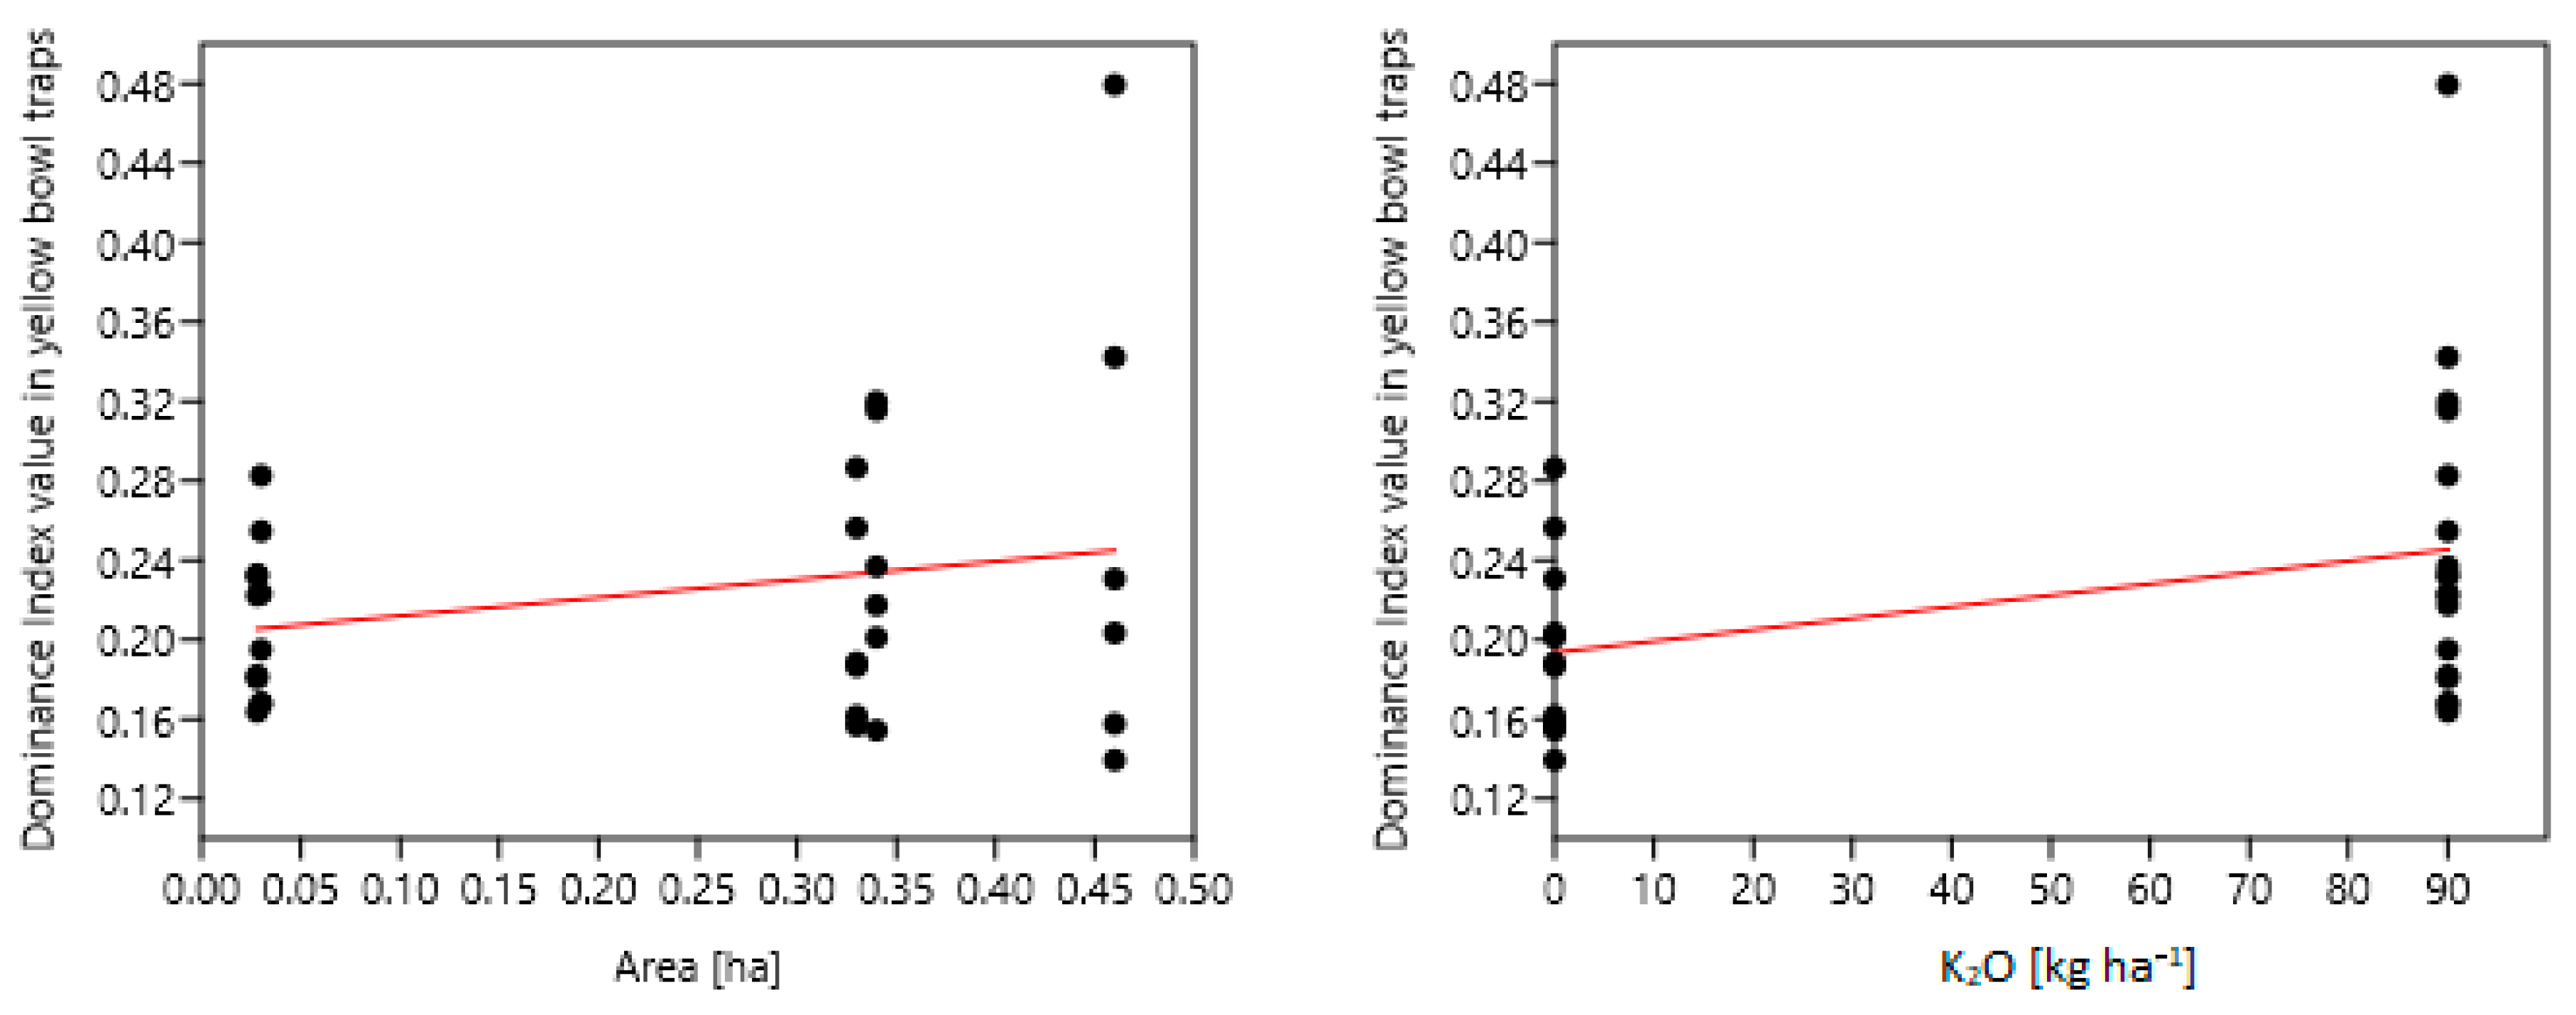
Several significant relationships between results obtained from bowl traps and agricultural practices were found. The number of arthropods in the samples was significantly influenced by the herbicide use, the age of the plantation, and the dose of potassium fertilization (Figure 19). The number of predators decreased with the increasing dose of phosphorus (Figure 20). The number of potential pests was positively influenced by the plantation area, contrary to pest species from pitfall traps. The use of herbicides was also a positive factor for the abundance of pest species. The occurrence of pests was negatively related to the yields (Figure 21). A high level of phosphorus fertilization negatively affected the number of pollinators possibly by favoring plants that do not benefit them. (Figure 22). The value of Shannon’s diversity index was negatively affected by the use of herbicides in crops (Figure 23). The domination of species in the samples increased on larger plantations and with higher dose of potassium fertilization (Figure 24).
4. Discussion
Three research hypotheses have been tested in this work, all of which have been partly confirmed. The first hypothesis (H1: perennial industrial crops can significantly affect the diversity of flora and fauna of marginal lands) was confirmed only in the case of floral diversity. The biodiversity of weeds in miscanthus and black locust was significantly lower than on marginal land. For the arthropod diversity, results differ across the years of the study, so there was no clear evidence that the cultivation of perennial industrial crops affects this kind of fauna. In other studies, information about a change in the structure of the flora population under miscanthus crops and black locust stands can be found, however, a decrease in the population of arthropods is rarely reported [6,17,21]. Willow, poplar, and cup plant had similar results of floral species richness as the control site.
The key aspect of the present research was the selection of the proper control object. The tested perennial industrial crops were cultivated on a soil of poor agricultural quality, which could be qualified as marginal land [23]. The best control object would be a fallow land in the same, or near the same location as tested industrial crops. Such land was not located anywhere in the vicinity of the experiment, and thus a piece of field of 450 m2 was excluded from agricultural cultivation in order to simulate the conditions of fallow land. As a consequence, a very species-rich flora habitat was created, which was maintained for 3 consecutive years. In the first year of the study, results were misleading, as one-year fallow was the most attractive object for weeds and arthropods, presenting a new space to colonize. In the second year of the study, the diversity of plants and arthropods started to decrease there, so the results of biodiversity monitoring were higher in the crops of willow, poplar, and cup plant. That also proves the assumptions of the second hypothesis (H2), that results of different crops will differ significantly and the right choice of the species of the perennial industrial crop can mitigate the loss of flora and fauna diversity on marginal lands. In this case, willow provided the most suitable habitat both for flora and arthropods.
A persistence of high density of flowering, melliferous plants was a positive phenomenon observed in the study. The abundance of melliferous plants was low only in miscanthus cultivation, which was most likely due to the use of selective herbicides, directed against dioecious plants. In all other tested crops, mainly herbicides against grasses were used (once every few years—at the time of planting or after harvesting). Limited herbicide treatments make industrial plants an excellent source of feed for bees and wild pollinators. It should be noted that industrial plants chosen for the present experiment are beneficial for honeybees. Although miscanthus does not produce nectar, bees can collect pollen from its blossoms. Plantations of miscanthus were linked with flowering weeds: Viola arvensis Murray, Capsella bursa-pastoris (L.) Medik, Lapsana communis L. However, those species were found at very low densities of about 2 plants per m2 on average. In the case of miscanthus cultivation, unfavorable changes in the diversity of flora and its usefulness for pollinators were observed. It cannot be excluded that extensive or organic cultivation of miscanthus could provide a greater diversity of melliferous plants. The cultivation carried out on marginal lands usually requires greater inputs than cultivation on soils of better quality [17].
The biodiversity of arthropods was at a similar level in all tested crops. Fewer taxa were found only in cup plant. The cup plant is the most productive melliferous plant among tested, producing up to 550 kg of nectar per ha. It blooms relatively late, from July to October. A numerous melliferous weeds were found in cup plant crop: Cerastium arvense L., Stellaria media (L.) Vill., Taraxacum officinale Kirschner, H.Øllg. and Štěpánek and Erigeron annuus (L.) Desf. A surprise was the low abundance of arthropod species found in this crop. The low abundance of arthropods found in cup plant might have been due to the monitoring date, which was always in June. The cup plant blooms relatively late, so at the time of insect collection, it didn’t attract many pollinators. Cultivation of cup plant was related to a large diversity of wild plants, also including melliferous plants. The low number of taxa and the generally low abundance of arthropods in the cup plant is difficult to explain because it contradicts the results of other authors [7]. It may be due to the fact that the cup tree in present study was the youngest of the tested crops. As a result, the number and intensification of agrotechnical treatments in this plant were relatively larger than in other tested plants.
An important physical feature of the crop that affects arthropod diversity is the plant conformation, its density, and height [24]. It is possible that a dense vegetation structure of the cup plant blocked the access of light to the surface of the soil, thus reducing the occurrence of some heliophile weed species. The decrease in the diversity of arthropods was not recorded in the black locust. This tree also provides an efficient bee feed (up to 65 kg of nectar per hectare). In Poland, it blooms in late May and early June, which was partly the time of biodiversity monitoring. Numerous melliferous plants, of which the most common were Galium aparine L. and Solidago canadensis L., were found on black locust plantation. Weeds that occurred in black locust were of low diversity but were able to provide feed for bees from June to October, long after black locust blooming has ended. Poplar does not provide nectar benefits to bees, but it is an important source of plant exudates, used by bees to produce propolis. The bees can also collect poplar’s pollen. Numerous mellifluous weeds species were found in poplar cultivation: Tripleurospermum maritimum (L.) W.D.J.Koch, Erigeron canadensis (L.) Cronquist and Erodium cicutarium (L.) L’Hér. ex Aiton. The diversity of arthropods in poplar cultivation varied over the years and depended on the collection method, representing both the highest and the lowest results. This only confirms the conclusions of other authors that different assessment methods should be used, at different times and with as many repetitions as possible [22,25,26]. The willow provides early pollen and nectar (from March to May) which can be used by bees. Willow plantations are also a great source of honeydew of aphids Aphididae which is collected by honey bees. In addition, the weeds found in the willow plantation bloomed at different times. The most numerous weed species which can be beneficial for bees were: Galium aparine L., Stellaria media (L.) Vill., Cerastium arvense L., Solidago canadensis L., and Taraxacum officinale Kirschner, H.Øllg. and Štěpánek. Willow can also be cultivated in more extensive production systems than other crops, which increases its environmental value for pollinators and other beneficial arthropods [27].
Despite the low biodiversity of the plants, the cultivation of perennial industrial crops can bring significant benefits to the diversity of pollinators and honey production. The third hypothesis (H3), which assumed the agrotechnical treatments have a key impact on biodiversity, also has been proved. The assumption was confirmed for both weeds and arthropods. Factors such as fertilization and herbicide use negatively affected the biodiversity of flora and fauna, while increasing the number of some pest species. The impact of intensive farming on arthropod biodiversity is a well-explored phenomenon [28,29,30]. This was confirmed by the increased diversity of flora in control plot compared to miscanthus and poplar cultivations. The lowest number of pollinators was observed in the miscanthus and in the cup plant. In the case of miscanthus, it could result from the low diversity of flora and low number of mellifluous plants. In the case of the cup plant, it is more difficult to explain the small number of pollinators. Although the monitoring of arthropods wasn’t done at the time of its flowering, there were a lot of melliferous weeds there. The cultivation of the cup plant was directly adjacent to the control object. In 2019 a large field of oil rapeseed was located in the direct vicinity of the plantation. Plants of oil rapeseed could attract pollinators more than cup plant in June.
The results could also be influenced by the choice of monitoring methods for arthropods. The number of detected species increases with the number of traps used. Studies by other authors indicate that the number of samples from yellow bowls used in their experiment may have also been too low [22,25,31]. In the present study, the size of some fields did not allow us to use a larger number of traps without avoiding the side effect, when the neighboring habitat affects the results. In the case of pollinators, which can see the traps from the above, it would require to have a field area of at least one hectare. The traps and yellow bowls were set for a period of 2 weeks, which resulted in a very large amount of material to be collected. Handling more yellow bowls traps could also prove to be too much of a challenge, as the identification of taxa from yellow bowls takes more man-hours than from pitfall traps. The risk of depleting local pollinator populations, especially wild bees, was also considered. The use of more traps is not justified if subsequent handling of the collected material cannot be ensured. Each collection method is to some extent imperfect and selective, so it is worthwhile to use a combination of several methods instead of a large number of repetitions of the same method [22,25].
5. Conclusions
Perennial industrial crops did not cause a decline in wild biodiversity in comparison with unmanaged marginal land. Nevertheless, the cultivation of some crop species can cause a decrease in diversity of flora and fauna in long term. Miscanthus and black locust cultivation were linked with a decrease in the number of plant species.
The greatest biodiversity of plants and animals among crops was linked with the cultivation of willow, however, other crops also provided a good habitat for arthropods. No significant decrease of abundance of pollinators or natural enemies of pests were found in any perennial industrial crop.
The intensity of cultivation negatively affected the diversity of weeds and arthropods. The factors negatively affecting the biodiversity were: mechanical treatments, the level of nitrogen, phosphorus and potassium fertilization, and the use of herbicides. There is a possibility that other, more extensive management strategies or the choice of species requiring low inputs will allow for the maintenance of a high biodiversity of perennial industrial crops.
Author Contributions
Conceptualization, P.R.; methodology, P.R.; validation, M.M. and P.R.; investigation, P.R. and M.M.; resources, M.M.; data curation, P.R.; writing—original draft preparation, P.R.; writing—review and editing, P.R. and A.K.B.; visualization, P.R.; supervision, M.M.; project administration, M.M.; funding acquisition, M.M. All authors have read and agreed to the published version of the manuscript.
Funding
This paper is the result of a long–term study carried out at the Institute of Soil Science and Plant Cultivation—State Research Institute, Department of Systems and Economics of Crop Production, and it was co-financed by the National (Polish) Centre for Research and Development (NCBiR), entitled “Environment, agriculture and forestry”, project: BIOproducts from lignocellulosic biomass derived from MArginal land to fill the Gap In Current national bioeconomy, No. BIOSTRATEG3/344253/2/NCBR/2017.
Acknowledgments
We would also like to thank the staff of the Department of Systems and Economics of Crop Production and Experimental Farm “Kępa” for their technical support during the experiments.
Conflicts of Interest
The authors declare no conflict of interest. The funders had no role in the design of the study; in the collection, analyses, or interpretation of data; in the writing of the manuscript, or in the decision to publish the results.
References
- Pudełko, R.; Kozak, M.; Jędrejek, A.; Gałczyńska, M.; Pomianek, B. Regionalisation of unutilised agricultural area in Poland. Pol. J. Soil Sci. 2018, 51, 119. [Google Scholar] [CrossRef] [Green Version]
- Stolarski, M.J.; Krzyianiak, M.; Szczukowski, S.; Tworkowski, J.; Bieniek, A. Short rotation woody crops grown on marginal soil for biomass energy. Pol. J. Environ. Stud. 2014, 23, 1727–1739. [Google Scholar]
- Stolarski, M.J.; Krzyżaniak, M.; Załuski, D.; Tworkowski, J.; Szczukowski, S. Effects of Site, Genotype and Subsequent Harvest Rotation on Willow Productivity. Agriculture 2020, 10, 412. [Google Scholar] [CrossRef]
- Dauber, J.; Miyake, S. To integrate or to segregate food crop and energy crop cultivation at the landscape scale? Perspectives on biodiversity conservation in agriculture in Europe. Energy Sustain. Soc. 2016, 6, 25. [Google Scholar] [CrossRef] [Green Version]
- Fletcher, R.J., Jr.; Robertson, B.A.; Evans, J.; Doran, P.J.; Alavalapati, J.R.; Schemske, D.W. Biodiversity conservation in the era of biofuels: Risks and opportunities. Front. Ecol. Environ. 2011, 9, 161–168. [Google Scholar] [CrossRef] [Green Version]
- Feledyn-Szewczyk, B.; Matyka, M.; Staniak, M. Comparison of the Effect of Perennial Energy Crops and Agricultural Crops on Weed Flora Diversity. Agronomy 2019, 9, 695. [Google Scholar] [CrossRef] [Green Version]
- Chmelíková, L.; Wolfrum, S. Mitigating the biodiversity footprint of energy crops—A case study on arthropod diversity. Biomass Bioenergy 2019, 125, 180–187. [Google Scholar]
- Gansberger, M.; Montgomery, L.F.; Liebhard, P. Botanical characteristics, crop management and potential of Silphium perfoliatum L. as a renewable resource for biogas production: A review. Ind. Crop. Prod. 2015, 63, 362–372. [Google Scholar] [CrossRef]
- Purtauf, T.; Roschewitz, I.; Dauber, J.; Thies, C.; Tscharntke, T.; Wolters, V. Landscape context of organic and conventional farms: Influences on carabid beetle diversity. Agr. Ecosyst. Environ. 2005, 108, 165–174. [Google Scholar] [CrossRef]
- Dauber, J.; Purtauf, T.; Allspach, A.; Frisch, J.; Voigtländer, K.; Wolters, V. Local vs. landscape controls on diversity: A test using surface-dwelling soil macroinvertebrates of differing mobility. Global Ecol. Biogeogr. 2005, 14, 213–221. [Google Scholar] [CrossRef]
- Pokluda, P.; Hauck, D.; Cizek, L. Importance of marginal habitats for grassland diversity: Fallows and overgrown tall-grass steppe as key habitats of endangered ground-beetle Carabus hungaricus. Insect Conserv. Diver. 2012, 5, 27–36. [Google Scholar] [CrossRef]
- Poschlod, P.; Bakker, J.P.; Kahmen, S. Changing land use and its impact on biodiversity. Basic Appl. Ecol. 2005, 6, 93–98. [Google Scholar] [CrossRef]
- Werling, B.P.; Dickson, T.L.; Isaacs, R.; Gaines, H.; Gratton, C.; Gross, K.L.; Robertson, B.A. Perennial grasslands enhance biodiversity and multiple ecosystem services in bioenergy landscapes. Proc. Natl. Acad. Sci. USA 2014, 111, 1652–1657. [Google Scholar] [CrossRef] [PubMed] [Green Version]
- Decourtye, A.; Mader, E.; Desneux, N. Landscape enhancement of floral resources for honey bees in agro-ecosystems. Apidologie 2010, 41, 264–277. [Google Scholar] [CrossRef] [Green Version]
- Holzschuh, A.; Steffan-Dewenter, I.; Tscharntke, T. How do landscape composition and configuration, organic farming and fallow strips affect the diversity of bees, wasps and their parasitoids? J. Anim. Ecol. 2010, 79, 491–500. [Google Scholar] [CrossRef]
- Blanco-Canqui, H. Growing dedicated energy crops on marginal lands and ecosystem services. Soil Sci. Soc. Am. J. 2016, 80, 845–858. [Google Scholar] [CrossRef]
- Scholz, V.; Ellerbrock, R. The growth productivity, and environmental impact of the cultivation of energy crops on sandy soil in Germany. Biomass Bioenergy 2002, 23, 81–92. [Google Scholar] [CrossRef]
- Soldatos, P. Economic aspects of bioenergy production from perennial grasses in marginal lands of South Europe. Bioenergy Res. 2015, 8, 1562–1573. [Google Scholar] [CrossRef]
- Paoletti, M.G.; Hassall, M. Woodlice (Isopoda: Onisci-dae): Their potential for assessing sustainability and use asbioindicators. Agric. Ecosyst. Environ. 1999, 74, 157–165. [Google Scholar] [CrossRef]
- Semere, T.; Slater, F.M. Invertebrate populations in miscanthus (Miscanthus × giganteus) and reed canary-grass (Phalaris arundinacea) fields. Biomass Bioenergy 2007, 31, 30–39. [Google Scholar] [CrossRef]
- Vítková, M.; Müllerová, J.; Sádlo, J.; Pergl, J.; Pyšek, P. Black locust (Robinia pseudoacacia) beloved and despised: A story of an invasive tree in Central Europe. Forest. Ecol. Manag. 2017, 384, 287–302. [Google Scholar] [CrossRef] [PubMed]
- McCravy, K.W. A review of sampling and monitoring methods for beneficial arthropods in agroecosystems. Insects 2018, 9, 170. [Google Scholar] [CrossRef] [Green Version]
- Shortall, O.K. “Marginal land” for energy crops: Exploring definitions and embedded assumptions. Energy Policy 2013, 62, 19–27. [Google Scholar] [CrossRef]
- Li, X.; Liu, Y.; Duan, M.; Yu, Z.; Axmacher, J.C. Different response patterns of epigaeic spiders and carabid beetles to varying environmental conditions in fields and semi-natural habitats of an intensively cultivated agricultural landscape. Agric. Ecosyst. Environ. 2018, 264, 54–62. [Google Scholar] [CrossRef]
- Shapiro, L.H.; Tepedino, V.J.; Minckley, R.L. Bowling for bees: Optimal sample number for “bee bowl”sampling transects. J. Insect Conserv. 2014, 18, 1105–1113. [Google Scholar] [CrossRef]
- Spence, J.R.; Niemelä, J.K. Sampling carabid assemblages with pitfall traps: The madness and the method. Can. Entomol. 1994, 126, 881–894. [Google Scholar] [CrossRef]
- Stolarski, J.M.; Szczukowski, S.; Tworkowski, J.; Krzyżaniak, M. Extensive Willow Biomass Production Marginal Land. Pol. J. Environ. Stud. 2019, 6, 4359–4367. [Google Scholar] [CrossRef]
- Biesmeijer, J.C.; Roberts, S.P.M.; Reemer, M.; Ohlemüller, R.; Edwards, M.; Peeters, T.; Schaffers, A.P.; Potts, S.G.; Kleukers, R.; Thomas, C.D.; et al. Parallel declines in pollinators and insect-pollinated plants in Britain and the Netherlands. Science 2006, 313, 351–354. [Google Scholar] [CrossRef]
- Landis, D.A.; Wratten, S.D.; Gurr, G.M. Habitat management to conserve natural enemies of arthropod pests in agriculture. Annu. Rev. Entomol. 2000, 45, 175–201. [Google Scholar] [CrossRef]
- Losey, J.E.; Vaughan, M. The economic value of ecological services provided by insects. BioScience 2006, 56, 311–323. [Google Scholar] [CrossRef] [Green Version]
- Bąkowski, M.; Piekarska-Boniecka, H.; Dolańska-Niedbała, E.; Michaud, J.P. Monitoring of the red-belted clearwing moth, Synanthedon myopaeformis, and its parasitoid Liotryphon crassiseta in apple orchards in yellow Moericke traps. J. Insect Sci. 2013, 13, 1–11. [Google Scholar] [CrossRef] [PubMed] [Green Version]
Figure 1.
Shannon’s Index values of plant diversity compered using Hutcheson’s t-test in three consecutive years. Statistically significant differences (p < 0.01) were marked with different letters. FL—Fallow land (control), MG—Miscanthus × giganteus Greef and Deuter, SP—Silphium perfoliatum L., RP—Robinia pseudoacacia L., PM—Populus × maximowiczii Henry, SW—Salix viminalis L.

Figure 2.
Simpson’s Dominance Index values of plants compared using Hutcheson’s t-test in three consecutive years. Statistically significant differences (p < 0.01) were marked with different letters. FL—Fallow land (control), MG—Miscanthus × giganteus Greef and Deuter, SP—Silphium perfoliatum L., RP—Robinia pseudoacacia L., PM—Populus × maximowiczii Henry, SW—Salix viminalis L.

Figure 3.
Two independent variables affecting number of weed species in perennial industrial crops: x1—Year of cultivation, x2—Mechanical treatments. Y = 9.073 − 0.557x1 − 0.303x2. R² = 0.630, p < 0.001.
Figure 3.
Two independent variables affecting number of weed species in perennial industrial crops: x1—Year of cultivation, x2—Mechanical treatments. Y = 9.073 − 0.557x1 − 0.303x2. R² = 0.630, p < 0.001.

Figure 4.
Five independent variables affecting number of weeds in perennial industrial crops: x1—Herbicide use [dm3 ha−1], x2—Age of cultivation, x3—P205 [kg ha−1], x4—N [kg ha−1], x5—Yield of DM [Mg ha−1]. Y = 113.94 + 53.86x1 + 5.28x2 + 1.85x3 − 2.00x4 − 4.61x5. R²= 0.289, p = 0.08.
Figure 4.
Five independent variables affecting number of weeds in perennial industrial crops: x1—Herbicide use [dm3 ha−1], x2—Age of cultivation, x3—P205 [kg ha−1], x4—N [kg ha−1], x5—Yield of DM [Mg ha−1]. Y = 113.94 + 53.86x1 + 5.28x2 + 1.85x3 − 2.00x4 − 4.61x5. R²= 0.289, p = 0.08.

Figure 5.
Four independent variables affecting melliferous plants in perennial industrial crops: x1—N [kg ha−1], x2—Yield of DM [Mg ha−1], x3—K2O [kg ha−1], x4—Herbicide use [dm3 ha−1]. Y = 125.93 − 1.61x1 − 4.05x2 + 0.63x3 + 25.15x4. R² = 0.350, p = 0.001.
Figure 5.
Four independent variables affecting melliferous plants in perennial industrial crops: x1—N [kg ha−1], x2—Yield of DM [Mg ha−1], x3—K2O [kg ha−1], x4—Herbicide use [dm3 ha−1]. Y = 125.93 − 1.61x1 − 4.05x2 + 0.63x3 + 25.15x4. R² = 0.350, p = 0.001.

Figure 6.
Two independent variables affecting non-melliferous plants in perennial industrial crops: x1—Herbicide use [dm3 ha−1], x2—Age of cultivation, x3—P205 [kg ha−1]. Y = −16.75 + 23.11x1 + 4.24x2 + 0.52x3. R²= 0.386, p < 0.001.
Figure 6.
Two independent variables affecting non-melliferous plants in perennial industrial crops: x1—Herbicide use [dm3 ha−1], x2—Age of cultivation, x3—P205 [kg ha−1]. Y = −16.75 + 23.11x1 + 4.24x2 + 0.52x3. R²= 0.386, p < 0.001.

Figure 7.
Two independent variables affecting Shannon’s Index value of weeds in perennial industrial crops: x1—Age of cultivation, x2—Herbicide use [dm3 ha−1]. Y = 1.763 − 0.098x1 − 0.248x2. R² = 0.634, p < 0.001.
Figure 7.
Two independent variables affecting Shannon’s Index value of weeds in perennial industrial crops: x1—Age of cultivation, x2—Herbicide use [dm3 ha−1]. Y = 1.763 − 0.098x1 − 0.248x2. R² = 0.634, p < 0.001.

Figure 8.
Two independent variables affecting Dominance Index value of weeds in perennial industrial crops: x1—Age of cultivation, x2—Herbicide use [dm3 ha−1]. Y = 0.157 + 0.038x1 + 0.084x2. R² = 0.529, p < 0.00.
Figure 8.
Two independent variables affecting Dominance Index value of weeds in perennial industrial crops: x1—Age of cultivation, x2—Herbicide use [dm3 ha−1]. Y = 0.157 + 0.038x1 + 0.084x2. R² = 0.529, p < 0.00.

Figure 9.
Shannon’s Index values of arthropod diversity in pitfall traps compered using Hutcheson’s t-test in three following years. Statistically significant differences (p < 0.01) were marked with different letters. FL—Fallow land (control), MG—Miscanthus × giganteus Greef and Deuter, SP—Silphium perfoliatum L., RP—Robinia pseudoacacia L., PM—Populus × maximowiczii Henry, SW—Salix viminalis L.

Figure 10.
Simpson’s Dominance Index values of arthropods in pitfall traps compared using Hutcheson’s t-test in three following years. Statistically significant differences (p < 0.01) were marked with different letters. FL—Fallow land (control), MG—Miscanthus × giganteus Greef and Deuter, SP—Silphium perfoliatum L., RP—Robinia pseudoacacia L., PM—Populus × maximowiczii Henry, SW—Salix viminalis L.

Figure 11.
Independent variable x1—P205 [kg ha−1] affecting number of arthropods in pitfall traps in perennial industrial crops. Y = 132.50 + 2.97x1. R² = 0.430, p < 0.001.
Figure 11.
Independent variable x1—P205 [kg ha−1] affecting number of arthropods in pitfall traps in perennial industrial crops. Y = 132.50 + 2.97x1. R² = 0.430, p < 0.001.

Figure 12.
Independent variable x1—P205 [kg ha−1] affecting number of natural enemies of pests in pitfall traps in perennial industrial crops. Y = 64.250 + 1.985x1, R² = 0.320, p = 0.001.
Figure 12.
Independent variable x1—P205 [kg ha−1] affecting number of natural enemies of pests in pitfall traps in perennial industrial crops. Y = 64.250 + 1.985x1, R² = 0.320, p = 0.001.

Figure 13.
Independent variable x1—Area [ha] affecting number of pests in pitfall traps in perennial industrial crops. Y = 112.10 − 195.14x1. R² = 0.408, p < 0.001.
Figure 13.
Independent variable x1—Area [ha] affecting number of pests in pitfall traps in perennial industrial crops. Y = 112.10 − 195.14x1. R² = 0.408, p < 0.001.

Figure 14.
Independent variable x1—P205 [kg ha−1] affecting number of detritivores in pitfall traps in perennial industrial crops. Y = 49.583 + 1.434x1. R² = 0.341, p < 0.001.
Figure 14.
Independent variable x1—P205 [kg ha−1] affecting number of detritivores in pitfall traps in perennial industrial crops. Y = 49.583 + 1.434x1. R² = 0.341, p < 0.001.

Figure 15.
Independent variable x1—P205 [kg ha−1] affecting Shannon’s Index value of arthropods in pitfall traps in perennial industrial crops. Y = 2.385 − 0.007x1. R² = 0.397, p < 0.001.
Figure 15.
Independent variable x1—P205 [kg ha−1] affecting Shannon’s Index value of arthropods in pitfall traps in perennial industrial crops. Y = 2.385 − 0.007x1. R² = 0.397, p < 0.001.

Figure 16.
Independent variable x1—K2O [kg ha−1] affecting Dominance Index value in pitfall traps in perennial industrial crops. Y = 0.133 + 0.001x1. R² = 0.315, p < 0.001.
Figure 16.
Independent variable x1—K2O [kg ha−1] affecting Dominance Index value in pitfall traps in perennial industrial crops. Y = 0.133 + 0.001x1. R² = 0.315, p < 0.001.

Figure 17.
Shannon’s Index values of arthropod diversity in yellow bowl traps compared using Hutcheson’s t-test in three following years. Statistically significant differences (p < 0.01) were marked with different letters. FL—Fallow land (control), MG—Miscanthus × giganteus Greef and Deuter, SP—Silphium perfoliatum L., RP—Robinia pseudoacacia L., PM—Populus × maximowiczii Henry, SW—Salix viminalis L.

Figure 18.
Simpson’s Dominance Index values for arthropods in yellow bowl traps compared using Hutcheson’s t-test in three following years. Statistically significant differences (p < 0.01) were marked with different letters. FL—Fallow land (control), MG—Miscanthus × giganteus Greef and Deuter, SP—Silphium perfoliatum L., RP—Robinia pseudoacacia L., PM—Populus × maximowiczii Henry, SW—Salix viminalis L.

Figure 19.
Three independent variables affecting number of arthropods in yellow bowl traps in perennial industrial crops: x1—Herbicide use [dm3 ha−1], x2—Age of cultivation, x3—K2O [kg ha−1]. Y= 525.7 + 424.8x1 − 34.9x2 − 2.4x3. R² = 0.431, p = 0.025.
Figure 19.
Three independent variables affecting number of arthropods in yellow bowl traps in perennial industrial crops: x1—Herbicide use [dm3 ha−1], x2—Age of cultivation, x3—K2O [kg ha−1]. Y= 525.7 + 424.8x1 − 34.9x2 − 2.4x3. R² = 0.431, p = 0.025.

Figure 20.
Independent variable x1—P205 [kg ha−1] affecting number of natural enemies of pests in yellow bowl traps in yellow bowl traps in perennial industrial crops. Y = 115.5 − 0.832x1. R² = 0.209, p = 0.042.
Figure 20.
Independent variable x1—P205 [kg ha−1] affecting number of natural enemies of pests in yellow bowl traps in yellow bowl traps in perennial industrial crops. Y = 115.5 − 0.832x1. R² = 0.209, p = 0.042.

Figure 21.
Three independent variables: x1—Herbicide use [dm3 ha−1], x2—Yield of DM [Mg ha−1], x3—Area [ha] affecting number of pests in yellow bowl traps in perennial industrial crops. Y = 252.8 + 112.6x1 − 14.8x2 + 391.5x3. R² = 0.503, p = 0.009.
Figure 21.
Three independent variables: x1—Herbicide use [dm3 ha−1], x2—Yield of DM [Mg ha−1], x3—Area [ha] affecting number of pests in yellow bowl traps in perennial industrial crops. Y = 252.8 + 112.6x1 − 14.8x2 + 391.5x3. R² = 0.503, p = 0.009.

Figure 22.
Independent variable x1—P205 [kg ha−1] affecting number of pollinators in yellow bowl traps in perennial industrial crops. Y = 136.25 − 0.81x1. R² = 0.355, p = 0.006.
Figure 22.
Independent variable x1—P205 [kg ha−1] affecting number of pollinators in yellow bowl traps in perennial industrial crops. Y = 136.25 − 0.81x1. R² = 0.355, p = 0.006.

Figure 23.
Independent variable x1—Herbicide use [dm3 ha−1] affecting Shannon’s index value of arthropods in yellow bowl traps in perennial industrial crops. Y = 1.932 − 0.229x1. R² = 0.462, p = 0.005.
Figure 23.
Independent variable x1—Herbicide use [dm3 ha−1] affecting Shannon’s index value of arthropods in yellow bowl traps in perennial industrial crops. Y = 1.932 − 0.229x1. R² = 0.462, p = 0.005.

Figure 24.
Two independent variables affecting Dominance Index value of arthropods in yellow bowl traps in perennial industrial crops: x1—Area [ha], x2—K2O [kg ha−1]. Y = 0.121 + 0.57x1 + 0.002x2, R² = 0.807, p < 0.001.
Figure 24.
Two independent variables affecting Dominance Index value of arthropods in yellow bowl traps in perennial industrial crops: x1—Area [ha], x2—K2O [kg ha−1]. Y = 0.121 + 0.57x1 + 0.002x2, R² = 0.807, p < 0.001.


Table 1.
Structure of monitoring of flora and fauna in the plot.
| Distance | Weeds Frame [0.5 × 1 m] | Arthropods Pitfall Traps | Arthropods Yellow Bowls |
|---|---|---|---|
| 5 m | Edge of field | − | − |
| 5 m | Frame 1 | Trap 1 | − |
| 5 m | Frame 2 | − | Trap 1 |
| 5 m | Frame 3 | Trap 2 | − |
| 5 m | Frame 4 | − | Trap 2 |
| 5 m | Frame 5 | Trap 3 | − |
| 5 m | Edge of field | − | − |
Table 2.
Frequency of the weed species in five different perennial industrial crops: FL—Fallow land (control), MG—Miscanthus × giganteus Greef and Deuter, SP—Silphium perfoliatum L., RP—Robinia pseudoacacia L., PM—Populus × maximowiczii Henry, SW—Salix viminalis L.
Table 2.
Frequency of the weed species in five different perennial industrial crops: FL—Fallow land (control), MG—Miscanthus × giganteus Greef and Deuter, SP—Silphium perfoliatum L., RP—Robinia pseudoacacia L., PM—Populus × maximowiczii Henry, SW—Salix viminalis L.
| Taxa | Average Number in the Sample | |||||||
|---|---|---|---|---|---|---|---|---|
| Order | Family | Species | FL | MG | SP | RP | PM | SW |
| Asterales | Asteraceae | Achillea millefolium | − | − | − | − | − | 0.2 |
| Anthemis arvensis | 14 | − | − | − | − | − | ||
| Artemisia vulgaris | − | − | − | − | − | 10.4 | ||
| Centaurea cyanus | 0.6 | − | − | − | − | − | ||
| Erigeron annuus | 1.2 | − | 8.2 | − | − | 3.4 | ||
| Erigeron canadensis | 12.6 | − | 5 | − | 7.8 | 2.6 | ||
| Galinsoga parviflora | − | − | 0.6 | − | 0.4 | − | ||
| Galinsoga quadriradiata | − | − | 0.8 | − | − | − | ||
| Gnaphalium sylvaticum | − | − | − | 0.4 | − | − | ||
| Lapsana communis | − | 2.4 | − | − | − | − | ||
| Senecio vulgaris | − | − | 4.2 | − | − | − | ||
| Solidago canadensis | 8 | − | − | 26 | − | 9.4 | ||
| Sonchus arvensis | 4.2 | − | 4.6 | − | 0.2 | 0.8 | ||
| Taraxacum officinale | 2 | − | 8.2 | − | 0.2 | 6.4 | ||
| Tragopogon pratensis | 1.4 | − | − | − | − | − | ||
| Tripleurospermum maritimum | 20 | − | 1.8 | − | 20.6 | − | ||
| Boraginales | Boraginaceae | Anchusa arvensis | 1.4 | − | − | − | − | − |
| Anchusa officinalis | − | − | 0.2 | − | − | − | ||
| Brassicales | Brassicaceae | Camelina sativa | − | − | 0.2 | − | − | − |
| Capsella bursa-pastoris | 12.2 | 2.4 | 2.6 | − | 1.8 | 0.6 | ||
| Caryophyllales | Amaranthaceae | Amaranthus retroflexus | 18.2 | − | − | − | 0.2 | 0.6 |
| Chenopodium album | 90.8 | 0.2 | 7.2 | 0.8 | 43.2 | 0.4 | ||
| Caryophyllaceae | Cerastium arvense | − | − | 50.2 | − | − | 12 | |
| Silene latifolia | 0.8 | − | − | − | − | 0.4 | ||
| Stellaria media | 6.6 | − | 16.2 | 0.4 | − | 14.4 | ||
| Polygonaceae | Fallopia convolvulus | − | − | 0.4 | − | − | 0.4 | |
| Polygonum aviculare | − | − | 2.4 | − | 0.4 | 0.2 | ||
| Polygonum lapathifolium | − | − | − | − | 1.2 | − | ||
| Polygonum persicaria | 2.6 | − | − | − | − | − | ||
| Fabales | Fabaceae | Trifolium repens | − | − | 0.6 | − | − | 0.8 |
| Vicia cracca | − | − | 0.6 | − | 0.2 | − | ||
| Vicia villosa | 0.2 | − | − | − | − | − | ||
| Gentianales | Rubiaceae | Galium aparine | − | − | − | 45.2 | − | 29.8 |
| Geraniales | Geraniaceae | Erodium cicutarium | 7.2 | − | 1.4 | − | 6.8 | 2.4 |
| Geranium pratense | 0.2 | − | 3.8 | − | − | − | ||
| Geranium pusillum | − | − | 0.6 | − | − | − | ||
| Geranium robertianum | − | − | − | 3.2 | − | − | ||
| Lamiales | Lamiaceae | Galeopsis tetrahit | − | − | 1 | − | 0.6 | − |
| Plantaginaceae | Plantago major | − | − | − | − | 0.2 | − | |
| Veronica arvensis | − | 0.4 | − | − | − | 0.2 | ||
| Veronica chamaedrys | − | 1.4 | 0.6 | − | 0.4 | 0.2 | ||
| Veronica persica | 1.4 | − | − | − | − | − | ||
| Malpighiales | Violaceae | Viola arvensis | 3 | 2.6 | 1.8 | 1.4 | 5 | 7 |
| Malvales | Malvaceae | Malva sylvestris | 0.2 | − | 0.2 | − | − | − |
| Sida hermaphrodita | − | − | − | − | − | 1.4 | ||
| Oxalidales | Oxalidaceae | Oxalis acetosella | − | − | − | − | 0.2 | − |
| Ranunculales | Papaveraceae | Papaver rhoeas | 2.6 | − | − | − | − | − |
| Rosales | Rosaceae | Geum rivale | − | − | − | − | − | 0.4 |
| Urticaceae | Urtica dioica | − | − | − | 2.6 | − | − | |
| Solanales | Convolvulaceae | Convolvulus arvensis | 3.2 | − | 1 | 0.2 | − | − |
| Poales | Cyperaceae | Carex sp. | − | − | − | 2 | − | − |
| Juncaceae | Luzula campestris | − | − | − | − | 0.2 | − | |
| Poaceae | Agrostis capillaris | 2 | − | − | − | 0.8 | − | |
| Apera spica-venti | 2.6 | 23.2 | − | − | 2.8 | − | ||
| Bromus inermis | 89.2 | 22.8 | − | − | − | − | ||
| Calamagrostis epigejos | − | − | − | 4.8 | − | − | ||
| Echinochloa crus-galli | 19.8 | − | 0.4 | − | − | − | ||
| Elymus repens | 69.2 | 58.8 | 1 | 16 | 2 | 4 | ||
| Elymus elongatus | − | − | 4 | − | − | − | ||
| Festuca rubra | − | − | − | − | − | 24 | ||
| Holcus mollis | − | − | − | − | − | 0.2 | ||
| Lolium perenne | − | − | 0.2 | − | − | − | ||
| Poa annua | 29.6 | 13.6 | 66.6 | − | 2.4 | 11.2 | ||
| Secale cereale | − | − | − | 0.2 | − | − | ||
| xTriticosecale | 12 | − | − | − | 1.6 | − | ||
| Equisetales | Equisetaceae | Equisetum arvense | 1.2 | − | 1.6 | 0.2 | 1.4 | 0.4 |
Table 3.
Median and median error values of selected weed diversity indicators in perennial industrial crops in three-year monitoring. Significantly different results (p < 0.05) were marked with different letters.
Table 3.
Median and median error values of selected weed diversity indicators in perennial industrial crops in three-year monitoring. Significantly different results (p < 0.05) were marked with different letters.
| Flora by the Frame Method | Crop | |||||
|---|---|---|---|---|---|---|
| FL | MG | SP | RP | PM | SW | |
| Number of weed species | 9 ± 1 a | 3 ± 0.3 d | 7± 0.7 a | 3 ± 0.4 cd | 5 ± 0.5 bc | 7 ± 0.7 ab |
| Number of weeds [m2] | 288 ± 67 a | 74 ± 20 b | 34 ± 45 b | 66 ± 9 b | 46 ± 16 b | 68 ± 19 b |
| Number of melliferous [m2] | 62 ± 21 a | 2 ± 3 b | 14 ± 35 a | 52 ± 6 ab | 18 ± 9 ab | 54 ± 11 ab |
| Number of non-melliferous [m2] | 190 ± 63 a | 60 ± 20 b | 18 ± 27 b | 2 ± 7 b | 18 ± 13 b | 12 ± 18 b |
FL—Fallow land (control), MG—Miscanthus × giganteus. Greef and Deuter, SP—Silphium perfoliatum L., RP—Robinia pseudoacacia L., PM—Populus × maximowiczii Henry, SW—Salix viminalis L.
Table 4.
Frequency of the arthropod taxa in pitfall traps in five different perennial industrial crops: FL—Fallow land (control), MG—Miscanthus × giganteus Greef and Deuter, SP—Silphium perfoliatum L., RP—Robinia pseudoacacia L., PM—Populus × maximowiczii Henry, SW—Salix viminalis L.
Table 4.
Frequency of the arthropod taxa in pitfall traps in five different perennial industrial crops: FL—Fallow land (control), MG—Miscanthus × giganteus Greef and Deuter, SP—Silphium perfoliatum L., RP—Robinia pseudoacacia L., PM—Populus × maximowiczii Henry, SW—Salix viminalis L.
| Taxa | Average Number in the Sample | |||||||
|---|---|---|---|---|---|---|---|---|
| Order | Family | Species | FL | MG | SP | RP | PM | SW |
| Acari | − | − | 2.9 | 0.2 | 0.7 | 3.1 | 1.4 | 1.8 |
| Trombidiidae | Trombidium holosericeum | − | − | − | − | 0.1 | − | |
| Araneae | Agelenidae | − | 0.8 | 0.1 | 0.1 | 0.1 | 0.2 | 0.2 |
| Araneidae | − | 0.1 | 0.1 | 0.1 | 0.3 | 0.2 | 1.2 | |
| Clubionidae | − | 0.6 | 0.1 | 0.4 | 1.3 | 0.9 | 0.2 | |
| Eutichuridae | Cheiracanthium punctorium | − | − | − | − | − | 0.1 | |
| Linyphiidae | − | 2.6 | 2.4 | 4.4 | 3.2 | 47.0 | 38.4 | |
| Lycosidae | − | 25.2 | 18.2 | 1.9 | 19.4 | 5.4 | 5.7 | |
| Salticidae | − | − | 0.1 | 0.1 | − | − | − | |
| Tetragnathidae | − | − | 0.1 | − | − | − | − | |
| Thomisidae | − | 0.4 | 1.2 | − | 2.3 | 0.4 | 1.3 | |
| Blattodea | Ectobiidae | Ectobius lapponicus | − | − | − | 0.2 | − | − |
| Coleoptera | Cantharidae | - | 0.1 | 0.2 | − | − | − | − |
| Carabidae | - | 52.0 | 38.7 | 32.6 | 30.9 | 66.8 | 52.2 | |
| Cicindela hybrida | 0.3 | − | − | − | − | − | ||
| Chrysomelidae | Chrysomela populi | − | − | − | − | 0.1 | − | |
| − | 6.4 | 0.2 | 1.6 | 2.2 | 1.3 | 1.3 | ||
| Coccinellidae | − | 4.6 | 1.7 | 6.1 | 2.2 | 1.4 | 1.2 | |
| − | − | 1.8 | 4.4 | 3.9 | 5.0 | 2.0 | 0.4 | |
| Curculionidae | − | 0.3 | 0.1 | 2.2 | − | − | 0.8 | |
| Otiorhynchus sp. | 0.2 | 5.8 | − | 0.1 | 0.1 | 1.3 | ||
| Dytiscidae | − | − | − | − | − | 0.1 | − | |
| Elateridae | − | − | 1.0 | 0.2 | 0.1 | 1.4 | 0.6 | |
| Geotrupidae | Geotrupes stercorarius | − | − | − | 0.3 | − | − | |
| Histeridae | − | 0.7 | − | − | 0.1 | − | − | |
| Scarabaeidae | Amphimallon solstitiale | 0.1 | − | − | 0.1 | − | 2.2 | |
| Anomala dubia | 1.4 | − | 0.1 | − | 0.1 | − | ||
| Cetoniinae sp. | − | − | − | 0.1 | − | − | ||
| Melolonthinae sp. | − | 0.2 | − | − | 0.1 | − | ||
| Phyllopertha horticola | 0.1 | − | − | − | − | − | ||
| Silphidae | − | − | − | − | − | 0.6 | − | |
| Sphecidae sp. | 0.3 | − | − | − | − | − | ||
| Staphylinidae | Staphylinidae sp. | 7.6 | 6.6 | 36.6 | 10.9 | 7.6 | 15.3 | |
| Tenebrionidae | − | 0.2 | 6.1 | 1.1 | − | 0.7 | − | |
| Dermaptera | Forficulidae | Forficula auricularia | − | 3.6 | 0.7 | 0.1 | 1.3 | 2.7 |
| Diptera | Asilidae | − | 0.2 | − | − | − | 0.1 | − |
| Bibionidae | − | 0.3 | 2.2 | 6.8 | 3.6 | 0.6 | 5.9 | |
| Culicidae | − | − | − | − | − | 0.1 | − | |
| Muscidae | − | 34.1 | 23.4 | 30.4 | 26.3 | 25.4 | 41.9 | |
| Empididae | − | − | 0.1 | − | 0.1 | − | − | |
| Syrphidae | − | 15.0 | 0.6 | 0.9 | 2.3 | 0.4 | 0.4 | |
| Tipulidae | − | − | − | − | 0.3 | 1.4 | 0.4 | |
| Entomobryomorpha | Entomobryidae | − | 120.1 | 5.4 | 14.2 | 31.8 | 15.0 | 10.2 |
| Hemiptera | Aphididae | − | 6.6 | 3.3 | 20.3 | 1.9 | 1.1 | 5.9 |
| Cicadellidae | − | 2.8 | 2.9 | 2.8 | 7.7 | 1.3 | 7.6 | |
| − | − | − | − | 2.9 | 0.8 | 0.9 | 1.1 | |
| Miridae | − | 27.3 | 0.6 | 3.0 | 1.8 | 1.2 | 0.6 | |
| Nabidae | − | 0.2 | − | − | − | − | − | |
| Pentatomidae | − | 0.4 | − | − | − | − | − | |
| Scutelleridae | − | 0.2 | − | − | − | − | − | |
| Hymenoptera | Apidae | − | 0.6 | 0.1 | 0.1 | − | − | 0.1 |
| Apis mellifera | 0.1 | − | − | − | − | − | ||
| Cephidae | − | − | − | − | − | − | 0.1 | |
| Formicidae | Formica fusca | − | 0.2 | − | 0.1 | − | 0.1 | |
| Formica rufa | 0.1 | − | − | − | − | − | ||
| − | 0.4 | − | − | 0.2 | − | − | ||
| Lasius niger | 44.8 | 55.6 | 50.8 | 8.8 | 4.8 | 16.0 | ||
| Myrmica rubra | 0.3 | 11.1 | 0.4 | 0.6 | − | 2.7 | ||
| Sphecidae | − | 0.1 | − | − | − | − | − | |
| Tenthredinidae | − | − | 0.9 | 1.8 | 1.0 | 3.1 | 3.4 | |
| Vespidae | Aphidiinae sp. | 2.2 | 1.0 | 3.0 | 4.1 | 2.8 | 3.9 | |
| Ichneumonidae sp. | 0.7 | 0.1 | − | 0.6 | 0.3 | 0.6 | ||
| − | 3.2 | 0.1 | - | − | − | − | ||
| Vespinae sp. | 5.4 | 0.1 | 0.2 | − | 0.1 | − | ||
| Isopoda | Porcellionidae | Porcellio scaber | − | − | 0.1 | − | − | − |
| Julida | Blaniulidae | − | − | − | − | 0.1 | 0.2 | − |
| Julidae | − | − | − | − | 0.1 | − | − | |
| Lepidoptera | − | − | 2.6 | 0.9 | 0.8 | 3.7 | 1.7 | 0.6 |
| Nymphalidae | − | − | − | 0.3 | 0.2 | − | − | |
| Pieridae | − | − | − | 0.1 | − | − | − | |
| Silphidae | − | − | − | − | − | − | 0.1 | |
| Tineidae | − | − | - | 0.1 | 1.0 | − | − | |
| Lithobiomorpha | Lithobiidae | Lithobius forficatus | − | 1.7 | 0.7 | 0.3 | 3.3 | 3.7 |
| Neuroptera | Chrysopidae | Chrysopa sp. | − | − | − | − | 0.2 | 0.1 |
| Hemerobiidae | 2212 | − | − | − | − | 0.1 | 0.1 | |
| Opiliones | 2212 | 2212 | 0.7 | 3.0 | 3.8 | 0.2 | 9.9 | 2.9 |
| Orthoptera | Acrididae | Acridinae sp. | − | 0.1 | − | − | − | − |
| Chorthippus albomarginatus | − | − | 0.1 | − | − | − | ||
| Chrysochraon dispar | − | 0.1 | − | − | − | − | ||
| Gryllidae | Gryllus campestris | 0.4 | − | − | − | − | − | |
| Tetrigidae | Tetrix sp. | − | − | − | − | − | 0.2 | |
| Tetrix subulata | 0.2 | − | − | − | − | − | ||
| Tettigoniidae | Pholidoptera griseoaptera | − | 0.1 | − | − | − | − | |
| − | − | 0.1 | − | 0.2 | − | − | ||
| Siphonaptera | Pulicidae | − | 0.2 | − | − | 0.1 | − | − |
| Symphypleona | Sminthuridae | − | 0.8 | 1.4 | 0.1 | 0.8 | − | 1.9 |
| Thysanoptera | − | − | 1.4 | 0.3 | 0.2 | − | 0.1 | 1.4 |
Table 5.
Median and median error values of selected indexes of ground arthropod diversity in perennial industrial crops in three-year monitoring. Significantly different results (p < 0.05) were marked with different letters.
Table 5.
Median and median error values of selected indexes of ground arthropod diversity in perennial industrial crops in three-year monitoring. Significantly different results (p < 0.05) were marked with different letters.
| Arthropods in Pitfall Traps | Crop | |||||
|---|---|---|---|---|---|---|
| FL | MG | SP | RP | PM | SW | |
| Number of arthropods | 357 ± 98 a | 214 ± 41 a | 192 ± 43 a | 186 ± 24 a | 125 ± 75 a | 193 ± 57 a |
| Number of species | 21 ± 1.5 a | 19 ± 1.3 ab | 18 ± 0.6 b | 19 ± 1.1 ab | 19 ± 0.6 b | 22 ± 1.5 ab |
| Number of natural enemies of pests | 109 ± 27 a | 93 ± 18 a | 67 ± 25 a | 73 ± 13 a | 61 ± 65 a | 59 ± 51 a |
| Number of potential pests | 86 ± 25 a | 64 ± 29 a | 92 ± 21 a | 34 ± 7 ab | 20 ± 4 b | 59 ± 7 ab |
| Number of detritivores | 161 ± 94 a | 65 ± 29 a | 105 ± 21 a | 79 ± 19 a | 61 ± 32 a | 99 ± 32 a |
FL—Fallow land (control), MG—Miscanthus × giganteus. Greef & Deuter, SP—Silphium perfoliatum L., RP—Robinia pseudoacacia L., PM—Populus × maximowiczii Henry, SW—Salix viminalis L.
Table 6.
Frequency of the arthropod taxa in Yellow bowl traps in five different perennial industrial crops: FL—Fallow land (control), MG—Miscanthus × giganteus Greef and Deuter, SP—Silphium perfoliatum L., RP—Robinia pseudoacacia L., PM—Populus × maximowiczii Henry, SW—Salix viminalis L.
Table 6.
Frequency of the arthropod taxa in Yellow bowl traps in five different perennial industrial crops: FL—Fallow land (control), MG—Miscanthus × giganteus Greef and Deuter, SP—Silphium perfoliatum L., RP—Robinia pseudoacacia L., PM—Populus × maximowiczii Henry, SW—Salix viminalis L.
| Taxa | Average Number in the Sample | |||||||
|---|---|---|---|---|---|---|---|---|
| Order | Family | Species | FL | MG | SP | RP | PM | SW |
| Acari | − | − | − | 1.0 | − | 6.8 | 0.5 | 0.2 |
| Trombidiidae | Trombidium holosericeum | − | 0.2 | − | − | − | − | |
| Araneae | Araneidae | − | 1.3 | 2.2 | 0.8 | 0.5 | 0.7 | 0.5 |
| Clubionidae | − | 0.2 | 0.2 | − | 0.3 | 0.3 | 0.2 | |
| Linyphiidae | − | 1.0 | 0.2 | 0.3 | − | 1.0 | 1.5 | |
| Lycosidae | − | 0.3 | − | 0.2 | − | − | − | |
| Pisauridae | Pisaura mirabilis | − | 0,2 | 0.2 | − | − | − | |
| Salticidae | − | − | − | − | − | − | 0.2 | |
| Tetragnathidae | − | 0.7 | 1.3 | 0.2 | 0.2 | 0.2 | − | |
| Thomisidae | − | 0.2 | 0.3 | 0.2 | − | 0.2 | − | |
| Coleoptera | Anthicidae | Notoxus monoceros | 0.2 | − | 0.2 | − | − | 0.3 |
| Cantharidae | − | 1.0 | − | − | 0.3 | 1.2 | 1.2 | |
| Carabidae | − | 2.0 | 1.5 | 0.2 | 2.0 | 1.2 | 0.8 | |
| Cicindela hybrida | 0.2 | − | − | − | − | − | ||
| Cerambycidae | − | − | − | 0.2 | 0.2 | − | − | |
| Chrysomelidae | Alticinae sp. | − | − | − | − | − | 0.7 | |
| Chrysomela populi | − | − | − | − | 0.5 | − | ||
| − | 26.8 | 16.3 | 3.2 | 5.5 | 4.0 | 16.5 | ||
| Oulema sp. | − | − | − | − | 0.7 | 0.8 | ||
| Coccinellidae | − | 1.2 | 1.2 | 2.7 | 1.7 | 2.7 | 0.3 | |
| − | − | 24.5 | 5.2 | 52.5 | 18.5 | 24.5 | 7.2 | |
| Curculionidae | − | 1.7 | 0.3 | − | 0.7 | 0.7 | 12.3 | |
| Otiorhynchus sp. | − | 0.3 | − | − | 0.2 | 0.8 | ||
| Elateridae | − | 0.7 | − | − | 0.3 | − | 0.3 | |
| Histeridae | − | 0.3 | − | − | − | − | − | |
| Scarabaeidae | Amphimallon solstitiale | 0.5 | 0.7 | − | − | − | 16.2 | |
| Anomala dubia | 0.8 | 0.2 | 0.2 | − | − | 0.2 | ||
| Cetoniinae sp. | 0.5 | 0.8 | − | 0.2 | - | 0.2 | ||
| Melolonthinae sp. | − | − | 0.2 | 0.2 | 0.8 | − | ||
| Oxythyrea funesta | 3.2 | 7.0 | 0.2 | − | − | 1.0 | ||
| Phyllopertha horticola | 0.2 | − | − | 0.2 | − | 0.7 | ||
| Rutelinae sp. | − | − | − | 0.2 | − | − | ||
| Silphidae | Nicrophorus vespillo | − | − | 0.5 | − | − | − | |
| Staphylinidae | − | 4.5 | 3.0 | 6.0 | 2.8 | 3.5 | 2.0 | |
| Dermaptera | Forficulidae | Forficula auricularia | − | 0.5 | 0.7 | − | − | 0.7 |
| Diptera | Asilidae | − | 1.8 | 0.7 | 0.2 | − | 0.3 | 0.7 |
| Bibionidae | − | 5.8 | 6.2 | 10.8 | 4.5 | 17.2 | 33.8 | |
| Bombyliidae | Bombylius major | − | − | − | 0.2 | − | − | |
| Cecidomyiidae | − | 0.3 | 1.2 | 0.7 | 3.5 | 0.8 | 2.5 | |
| Culicidae | − | 0.5 | − | − | 0.3 | 0.2 | 1.0 | |
| Muscidiale | − | 116.2 | 77.2 | 91.0 | 105.0 | 290.0 | 191.0 | |
| Empididae | − | 0.2 | 0.8 | − | 0.7 | − | 0.8 | |
| Syrphidae | Eristalis tenax | − | − | − | − | − | 0.3 | |
| 70.2 | 11.3 | 7.5 | 41.2 | 10.0 | 20.5 | |||
| Tabanidae | − | 0.3 | 0.2 | − | − | − | 0.2 | |
| Tipulidae | − | 1.3 | 0.2 | − | − | 5.7 | 1.3 | |
| Entomobryomorpha | Entomobryidae | − | 5.7 | 0.5 | 2.3 | 1.0 | 1.8 | 0.5 |
| Hemiptera | Aphididae | − | 42.0 | 30.0 | 44.3 | 27.2 | 31.8 | 38.3 |
| Cicadellidae | − | 5.3 | 2.0 | 2.0 | 5.7 | 63.3 | 15.8 | |
| − | − | 0.2 | 0.5 | 1.5 | − | 1.5 | 0.8 | |
| Miridae | − | 12.5 | 0.7 | 0.8 | 0.8 | 0.5 | 7.3 | |
| Nabidae | − | 0.5 | 0.2 | − | 0.2 | 0.2 | 0.3 | |
| Hymenoptera | Apidae | − | 11.8 | 2.7 | 6.5 | 3.0 | 1.7 | 3.5 |
| Apis mellifera | 1.0 | - | 1.2 | 0.8 | 0.5 | 2.7 | ||
| Bombus sp. | 0.7 | 0.2 | 2.2 | 0.2 | 0.7 | 0.5 | ||
| Cephidae | − | 1.0 | 1.3 | 1.3 | 1.3 | 3.5 | 6.3 | |
| Formicidae | − | 3.5 | − | − | − | 2.2 | − | |
| Lasius niger | 2.8 | 4.8 | 1.0 | 2.0 | 3.7 | 0.8 | ||
| Myrmica rubra | 0.2 | 0.2 | − | 0.2 | 0.5 | − | ||
| Pamphiliidae | − | 0.2 | − | − | 1.3 | 0.2 | 0.2 | |
| Tenthredinidae | − | 14.8 | 6.5 | 4.5 | 16.3 | 13.7 | 7.2 | |
| Vespidae | Aphidiinae sp. | 10.7 | 30.0 | 11.7 | 30.3 | 30.2 | 30.5 | |
| Ichneumonidae sp. | 5.7 | 3.2 | 1.0 | 3.8 | 9.0 | 10.7 | ||
| − | 1.2 | 0.3 | − | − | 0.3 | 0.7 | ||
| Vespinae sp. | 4.5 | 2.2 | 5.0 | 5.0 | 15.5 | 5.3 | ||
| Lepidoptera | Lycaenidae | − | − | − | - | 1.5 | − | − |
| − | − | 0.7 | 0.7 | 0.7 | 9.0 | 2.5 | 2.8 | |
| Noctuidae | − | - | − | 0.7 | − | − | − | |
| Nymphalidae | − | - | 0.2 | − | 6.0 | 0.8 | 0.8 | |
| Tineidae | − | 0.2 | − | − | 5.7 | − | − | |
| Mecoptera | − | − | 0.2 | − | − | − | − | − |
| Neuroptera | Chrysopidae | Chrysopa sp. | 0.2 | − | 0.3 | 1.3 | 1.8 | 0.7 |
| Hemerobiidae | − | − | 0.2 | 0.3 | − | 0.5 | − | |
| Opiliones | − | − | − | − | 0.8 | − | − | − |
| Orthoptera | Acridinae | − | 0.2 | − | − | − | − | − |
| Tettigoniidae | Tettigonia viridissima | − | − | 0.2 | − | − | − | |
| − | − | 0.2 | − | − | − | − | ||
| Raphidioptera | − | − | − | − | − | − | − | 0.2 |
| Symphypleona | Sminthuridae | − | − | 0.2 | − | 0.7 | 0.2 | − |
| Thysanoptera | − | − | 14.3 | 14.2 | 6.5 | 3.8 | 4.5 | 8.8 |
| Zygoptera | Calopterygidae | − | − | − | − | − | 0.2 | − |
Table 7.
Median and median error values of selected indicators of the diversity of arthropods collected in yellow bowl traps in perennial industrial crops in three-year monitoring.
Table 7.
Median and median error values of selected indicators of the diversity of arthropods collected in yellow bowl traps in perennial industrial crops in three-year monitoring.
| Arthropods in Yellow Bowls | Crop | |||||
|---|---|---|---|---|---|---|
| FL | MG | SP | RP | PM | SW | |
| Number of arthropods | 404 ± 101 a | 213 ± 91 a | 151 ± 175 a | 318 ± 37 a | 299±342 a | 374 ± 156 a |
| Number of species | 27 ± 3.4 a | 19 ± 3.6 a | 16 ± 1 a | 21 ± 4.2 a | 24 ± 1.9 a | 26 ± 3.7 a |
| Number of natural enemies | 121 ± 64 a | 35 ± 29 a | 29 ± 12 a | 58 ± 36 a | 86 ± 11 a | 51 ± 29 a |
| Number of potential pests | 118 ± 59 a | 85 ± 39 a | 87 ± 82 a | 111 ± 16 a | 152 ± 91 a | 95 ± 92 a |
| Number of pollinators | 74 ± 68 a | 26 ± 29 a | 28 ± 17 a | 116 ± 42 a | 77 ± 15 a | 78 ± 24 a |
FL—Fallow land (control), MG—Miscanthus × giganteus Greef & Deuter, SP—Silphium perfoliatum L., RP—Robinia pseudoacacia L., PM—Populus × maximowiczii Henry, SW—Salix viminalis L.
Publisher’s Note: MDPI stays neutral with regard to jurisdictional claims in published maps and institutional affiliations. |
© 2020 by the authors. Licensee MDPI, Basel, Switzerland. This article is an open access article distributed under the terms and conditions of the Creative Commons Attribution (CC BY) license (http://creativecommons.org/licenses/by/4.0/).
Share and Cite
MDPI and ACS Style
Radzikowski, P.; Matyka, M.; Berbeć, A.K. Biodiversity of Weeds and Arthropods in Five Different Perennial Industrial Crops in Eastern Poland. Agriculture 2020, 10, 636. https://0-doi-org.brum.beds.ac.uk/10.3390/agriculture10120636
AMA Style
Radzikowski P, Matyka M, Berbeć AK. Biodiversity of Weeds and Arthropods in Five Different Perennial Industrial Crops in Eastern Poland. Agriculture. 2020; 10(12):636. https://0-doi-org.brum.beds.ac.uk/10.3390/agriculture10120636
Chicago/Turabian StyleRadzikowski, Paweł, Mariusz Matyka, and Adam Kleofas Berbeć. 2020. "Biodiversity of Weeds and Arthropods in Five Different Perennial Industrial Crops in Eastern Poland" Agriculture 10, no. 12: 636. https://0-doi-org.brum.beds.ac.uk/10.3390/agriculture10120636
Note that from the first issue of 2016, this journal uses article numbers instead of page numbers. See further details here.