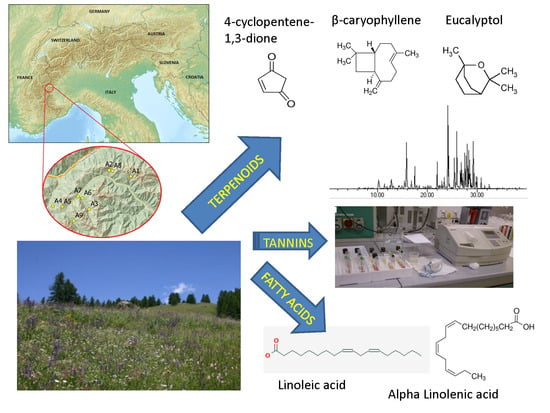
Evaluation of the Nutritive Value and the Fatty Acid, Phenol, Tannin and Terpenoid Contents of Nine Pastures in an Alpine District during the Summer Season

 ,
,  and
and
Abstract
:
1. Introduction
2. Materials and Methods
2.1. Pasture Sites, Sampling, and Phyto-Pastoral Analysis
2.2. Chemical Analysis
2.3. Fatty Acid Analysis
2.4. Phenolic Fraction Determination
2.5. Terpenoid Analysis
2.6. Statistical Analysis
3. Results
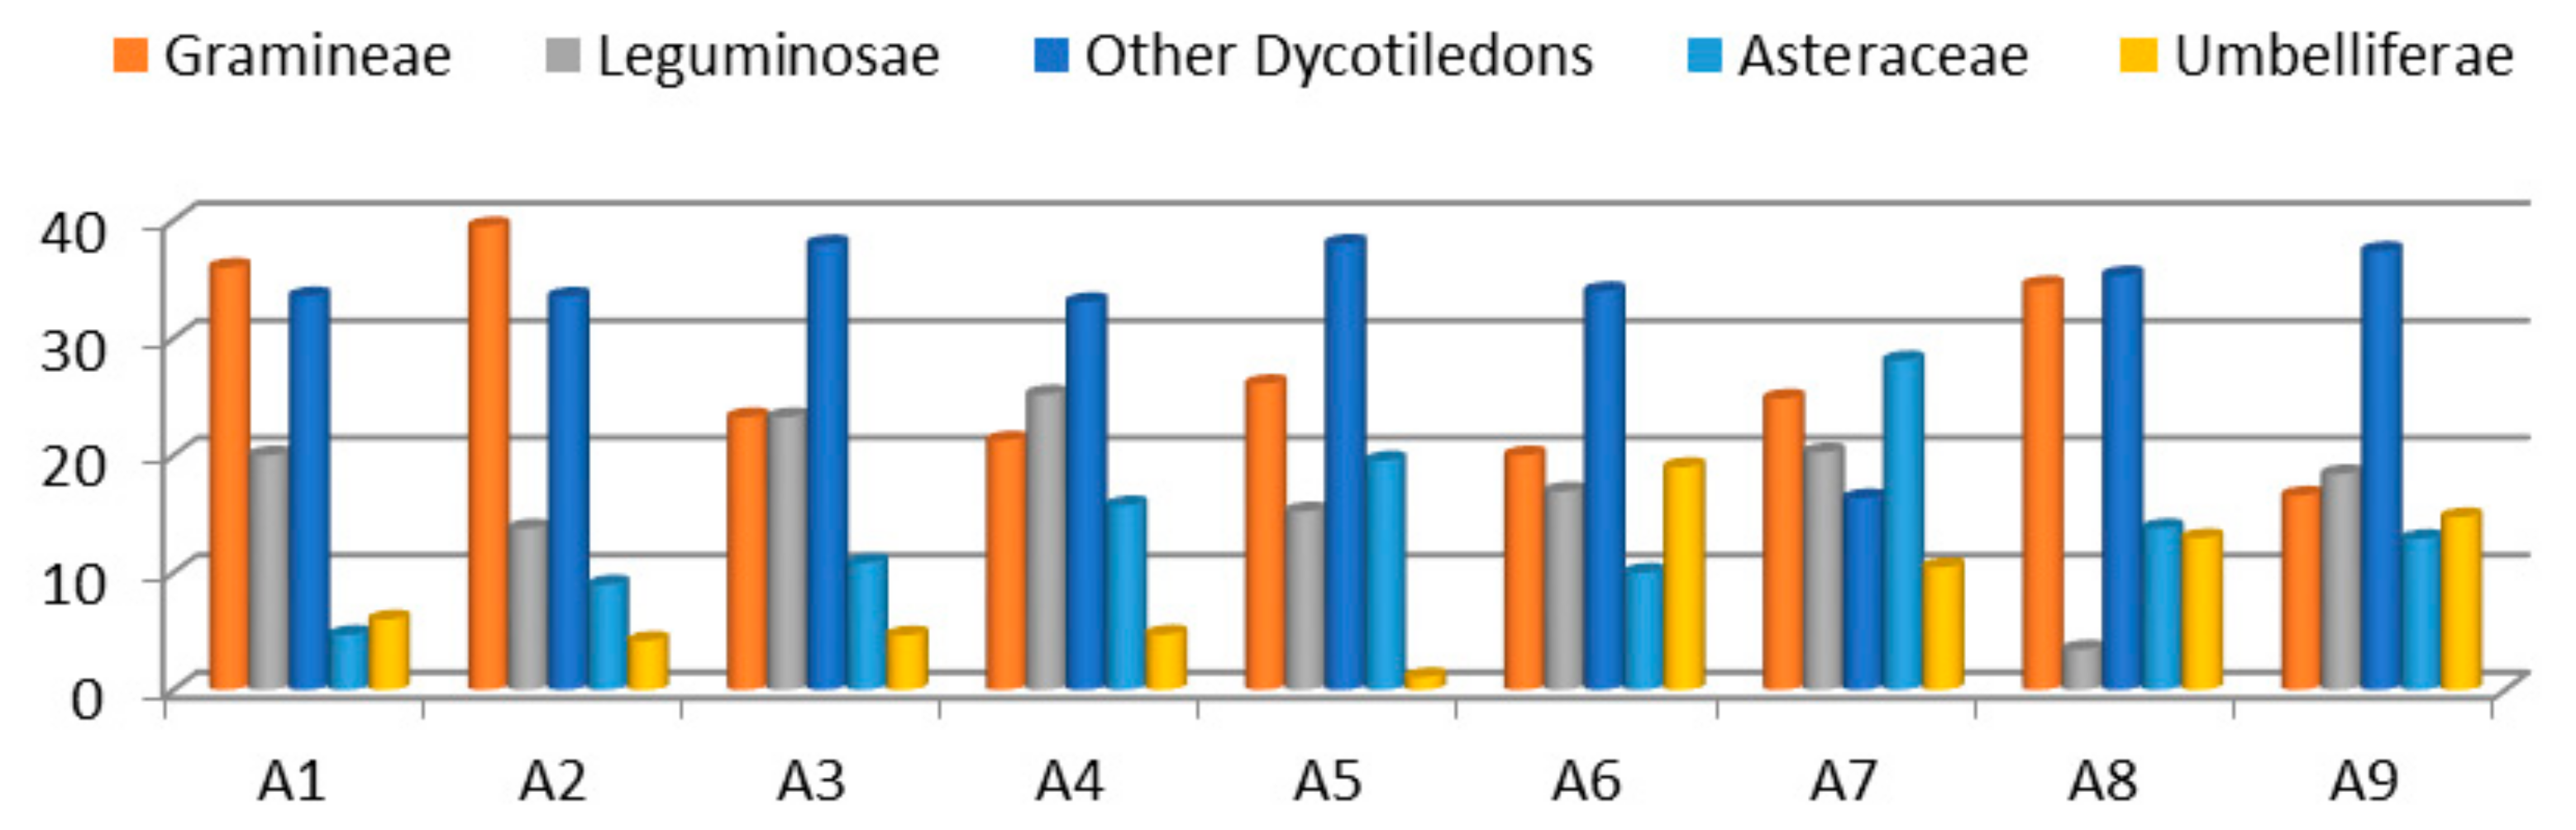
3.1. Botanical Composition of the Pastures
3.2. Chemical Composition and In Vitro Digestibility
3.3. Fatty Acid Profile
3.4. Total Phenols, and Total and Condensed Tannins
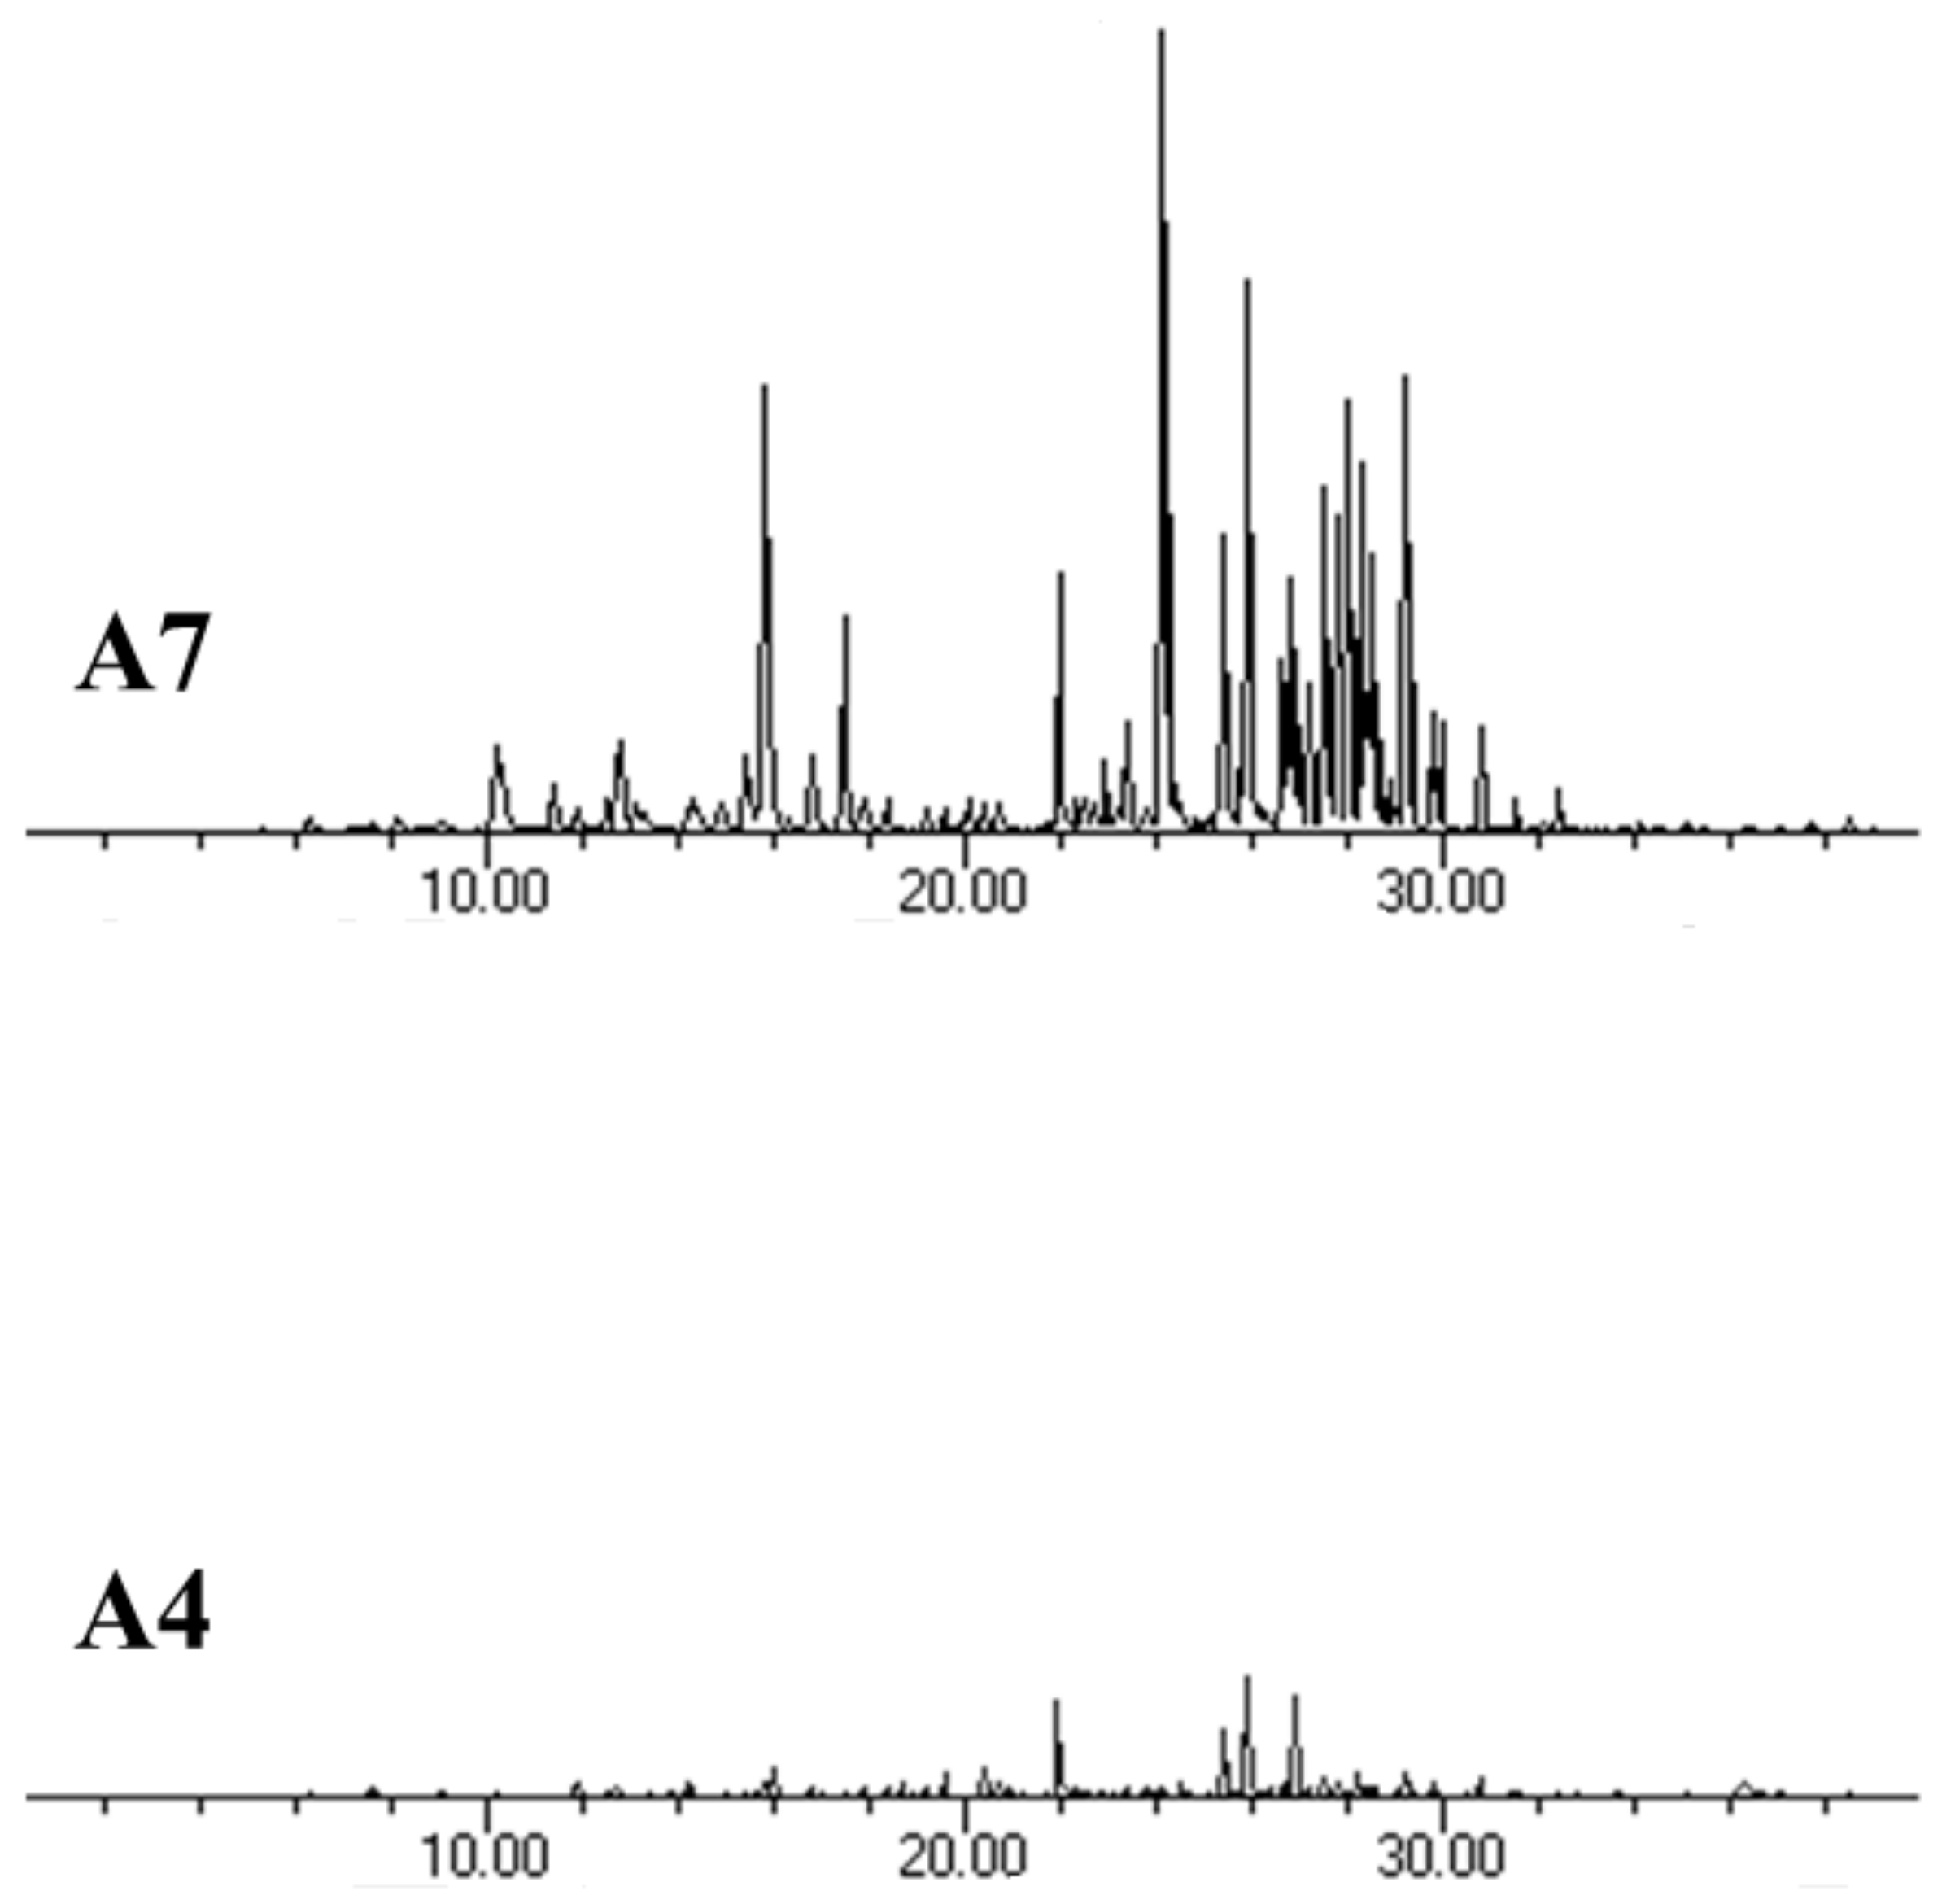
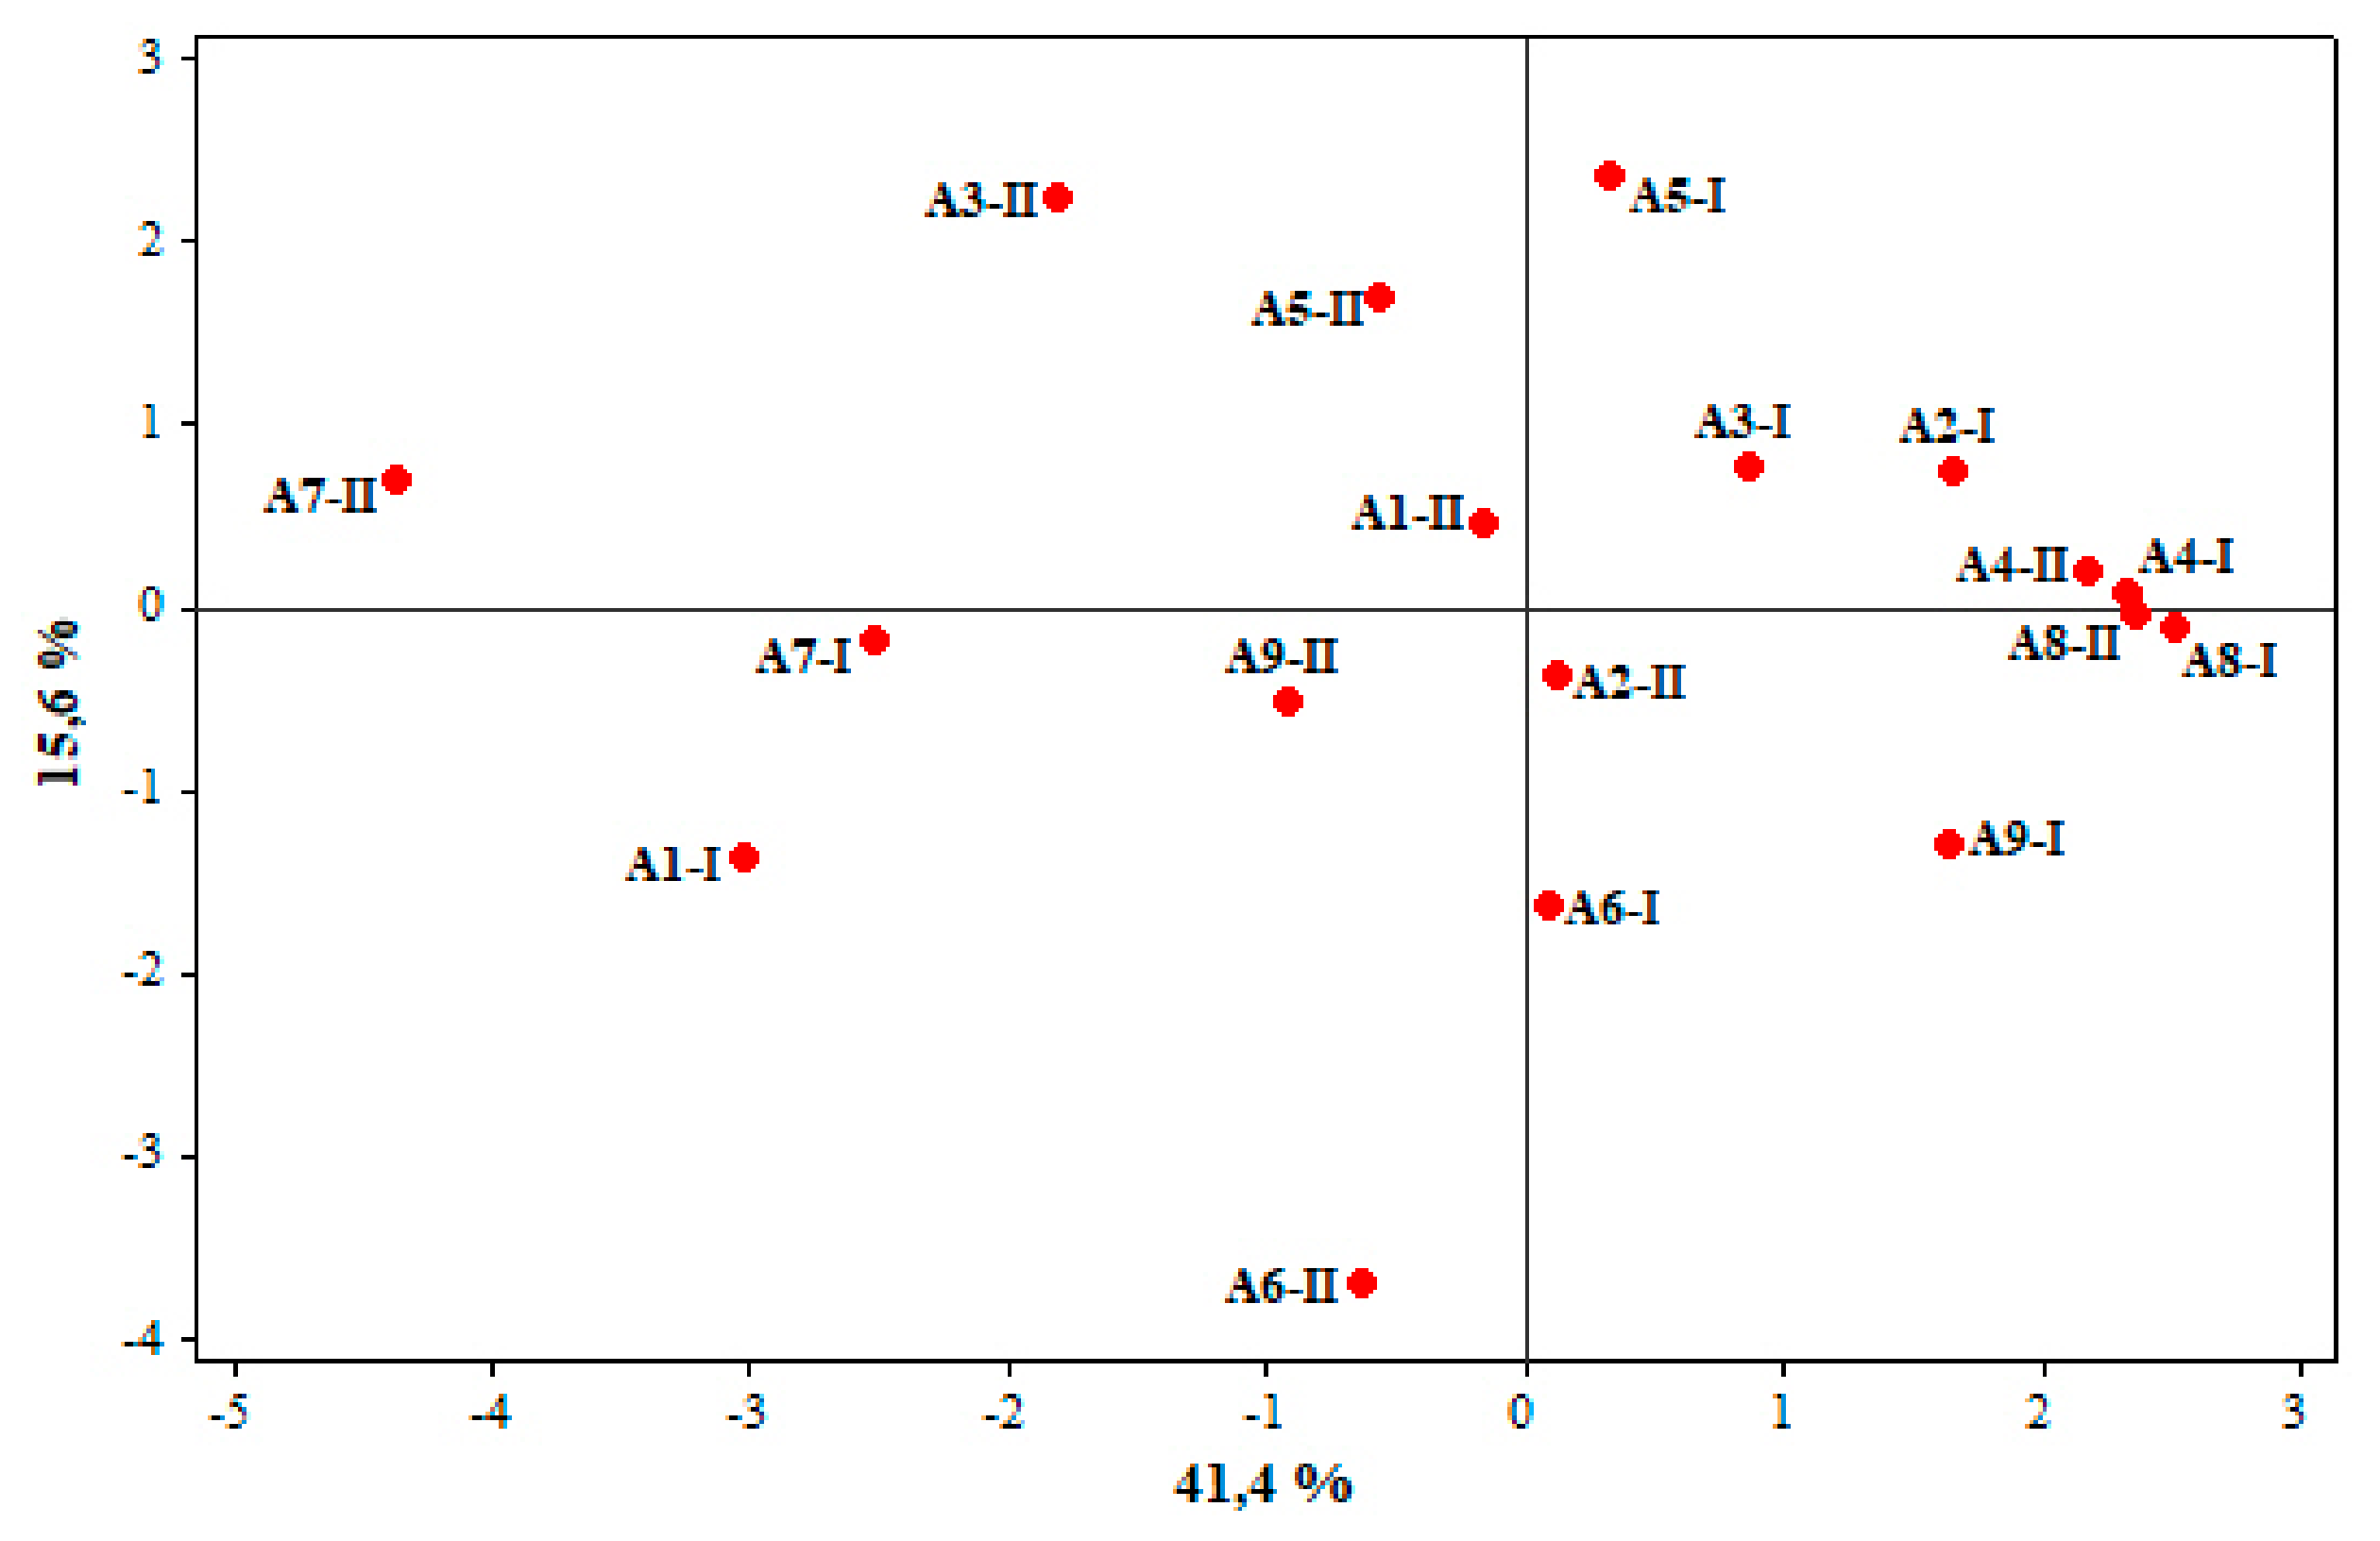
3.5. Terpenoid Profile
4. Discussion
5. Conclusions
Author Contributions
Funding
Acknowledgments
Conflicts of Interest
References
- Peiretti, P.G.; Gai, F.; Alonzi, S.; Battelli, G.; Tassone, S. Characterisation of Alpine highland pastures located at different altitudes: Forage evaluation, chemical composition, in vitro digestibility, fatty acid and terpene contents. Plant Biosyst. 2017, 151, 50–62. [Google Scholar] [CrossRef] [Green Version]
- Leiber, F.; Kreuzer, M.; Nigg, D.; Wettstein, H.R.; Scheder, M.R.L. A study on the cause for the elevated n-3 fatty acids in cow’s milk of alpine origin. Lipids 2005, 40, 191–202. [Google Scholar] [CrossRef] [PubMed]
- Revello Chion, A.; Tabacco, E.; Peiretti, P.G.; Borreani, G. Variation in the fatty acid composition of Alpine grassland during spring and summer. Agron. J. 2011, 103, 1072–1080. [Google Scholar] [CrossRef]
- Dewhurst, R.J.; Scollan, N.D.; Youell, S.J.; Tweed, J.K.S.; Humphreys, M.O. Influence of species, cutting date and cutting interval on the fatty acid composition of grasses. Grass Forage Sci. 2001, 56, 68–74. [Google Scholar] [CrossRef]
- Boufaïed, H.; Chouinard, P.Y.; Tremblay, G.F.; Petit, H.V.; Michaud, R.; Belanger, G. Fatty acids in forages. I. Factors affecting concentrations. Can. J. Anim. Sci. 2003, 83, 501–511. [Google Scholar] [CrossRef]
- Clapham, W.M.; Foster, J.G.; Neel, J.P.; Fedders, J.M. Fatty acid composition of traditional and novel forages. J. Agric. Food Chem. 2005, 53, 10068–10073. [Google Scholar] [CrossRef]
- Jayanegara, A.; Marquardt, S.; Kreuzer, M.; Leiber, F. Nutrient and energy content, in vitro ruminal fermentation characteristics and methanogenic potential of alpine forage plant species during early summer. J. Sci. Food Agric. 2011, 91, 1863–1870. [Google Scholar] [CrossRef]
- Morales, R.; Ungerfeld, E.M. Use of tannins to improve fatty acids profile of meat and milk quality in ruminants: A review. Chil. J. Agric. Res. 2015, 75, 239–248. [Google Scholar] [CrossRef] [Green Version]
- Jayanegara, A.; Kreuzer, M.; Wina, E.; Leiber, F. Significance of phenolic compounds in tropical forages for the rumen bypass of polyunsaturated fatty acids and the appearance of biohydrogenation intermediates as examined in vitro. Anim. Prod. Sci. 2011, 51, 1127–1136. [Google Scholar] [CrossRef]
- Khiaosa-Ard, R.; Bryner, S.F.; Scheeder, M.R.L.; Wettstein, H.R.; Leiber, F.; Kreuzer, M.; Soliva, C.R. Evidence for the inhibition of the terminal step of ruminal α-linolenic biohydrogenation by condensed tannins. J. Dairy Sci. 2009, 92, 177–188. [Google Scholar] [CrossRef] [Green Version]
- Kälber, T.; Meier, J.S.; Kreuzer, M.; Leiber, F. Flowering catch crops used as forage plants for dairy cows: Influence on fatty acids and tocopherols in milk. J. Dairy Sci. 2011, 94, 1477–1489. [Google Scholar] [CrossRef] [PubMed] [Green Version]
- Petinatti Pavarini, D.; Petinatti Pavarini, S.; Niehues, M.; Peporine Lopes, N. Exogenous influences on plant secondary metabolite levels. Anim. Feed Sci. Technol. 2012, 176, 5–16. [Google Scholar] [CrossRef]
- Schnee, C.; Köllner, T.G.; Gershenzon, J.; Degenhardt, G. The maize gene terpene synthase 1 encodes a sesquiterpene synthase catalyzing the formation of (E)-β-Farnesene, (E)-Nerolidol, and (E,E)-Farnesol after herbivore damage. Plant Physiol. 2001, 130, 2049–2069. [Google Scholar] [CrossRef] [Green Version]
- Verma, N.; Shukla, S. Impact of various factors responsible for fluctuation in plant secondary metabolites. J. Appl. Res. Med. Aromat. Plants 2015, 2, 105–113. [Google Scholar] [CrossRef]
- Kilcawley, K.; Faulkner, H.; Clarke, H.; O’Sullivan, M.; Kerry, J. Factors influencing the flavour of bovine milk and cheese from grass based versus non-grass based milk production systems. Foods 2018, 7, 37. [Google Scholar] [CrossRef] [PubMed] [Green Version]
- Renna, M.; Cornale, P.; Lussiana, C.; Giordano, M.; Belviso, S.; Zeppa, G.; Battaglini, L.M. Efficacy of fatty acids and terpenoids and weakness of electronic nose response as tracers of Asiago d’Allevo PDO cheese produced in different seasons. Dairy Sci. Technol. 2012, 92, 203–218. [Google Scholar] [CrossRef] [Green Version]
- Rainis, S.; Sulli, F.; Rossano, S.; Cividino, S.; Cossio, E. The impact on the landscape, environment and society of new productive chains in a mountain area: Strategies, analysis and future perspectives. J. Agr. Eng. 2012, 43, 3–8. [Google Scholar] [CrossRef]
- Peiretti, P.G.; Gai, F.; Alonzi, S.; Tassone, S. Nutritive value and fatty acid profile of birdsfoot trefoil (Lotus corniculatus) and white clover (Trifolium repens) in Alpine pastures. Livest. Res. Rural Develop. 2016, 28, 218. [Google Scholar]
- Daget, P.; Poissonet, J. Analyse phytologique des Prairies. In Applications Agronomiques; CNRS-CEPE: Montpellier, France, 1969. [Google Scholar]
- Langlands, J.P. Studies on the nutritive value of the diet selected by grazing sheep. VII. A note on hand plucking as a technique for estimating dietary composition. Anim. Prod. 1974, 19, 249–252. [Google Scholar] [CrossRef]
- Pignatti, S. Flora d’Italia; Edagricole: Bologna, Italy, 1982. [Google Scholar]
- AOAC. Official Methods of Analysis, 15th ed.; Association of Official Analytical Chemists: Arlington, VA, USA, 1990. [Google Scholar]
- Van Soest, P.J.; Robertson, J.B.; Lewis, B.A. Methods for dietary fiber, neutral detergent fiber, and nonstarch polysaccharides in relation to animal nutrition. J. Dairy Sci. 1991, 74, 3583–3591. [Google Scholar] [CrossRef]
- Robertson, J.B.; Van Soest, P.J. The detergent system of analysis. In The Analysis of Dietary Fibre in Food; James, W.P.T., Theander, O., Eds.; Marcel Dekker: New York, NY, USA, 1981; pp. 123–158. [Google Scholar]
- Hara, A.; Radin, N.S. Lipid extraction of tissues with a low-toxicity solvent. Anal. Biochem. 1978, 90, 420–426. [Google Scholar] [CrossRef] [Green Version]
- Revello Chion, A.; Tabacco, E.; Giaccone, D.; Peiretti, P.G.; Battelli, G.; Borreani, G. Variation of fatty acid and terpene profiles in mountain milk and “Toma piemontese” cheese as affected by diet composition in different seasons. Food Chem. 2010, 121, 393–399. [Google Scholar] [CrossRef]
- Makkar, H.P.S.; Bluemmel, M.; Borowy, N.K.; Becker, K. Gravimetric determination of tannins and their correlations with chemical and protein precipitation methods. J. Sci. Food Agric. 1993, 61, 161–165. [Google Scholar] [CrossRef]
- Porter, L.J.; Hrstich, L.N.; Chan, B.G. The conversion of procyanidins and prodelphinidins to cyanidin and delphinidin. Phytochemistry 1986, 25, 223–230. [Google Scholar] [CrossRef] [Green Version]
- De Noni, I.; Battelli, G. Terpenes and fatty acid profiles of milk fat and “Bitto” cheese as affected by transhumance of cows on different mountain pastures. Food Chem. 2008, 109, 299–309. [Google Scholar] [CrossRef] [PubMed]
- SPSS. Statistical Package for Social Science; Version 11.5.1 for Windows; SPSS Inc.: Chicago, IL, USA, 2002. [Google Scholar]
- Hochberg, Y.; Tamhane, A.C. Multiple Comparison Procedures; Wiley: New York, NY, USA, 1987. [Google Scholar]
- Piernik, A. Numerical Methods in Ecology, 1st ed.; Scientific Publishers of Nicolaus Copernicus University: Toruń, Poland, 2008; p. 92. [Google Scholar]
- Bovolenta, S.; Spanghero, M.; Dovier, S.; Orlandi, D.; Clementel, F. Chemical composition and net energy content of alpine pasture species during the grazing season. Anim. Feed Sci. Technol. 2008, 146, 178–191. [Google Scholar] [CrossRef]
- Roukos, C.; Papanikolaou, K.; Karalazos, A.; Chatzipanagiotou, A.; Mountousis, I.; Mygdalia, A. Changes in nutritional quality of herbage botanical components on a mountain side grassland in North-West Greece. Anim. Feed Sci. Technol. 2011, 169, 24–34. [Google Scholar] [CrossRef]
- Mayer, A.C.; Stöckli, V.; Huovinen, C.; Konold, W.; Estermann, B.L.; Kreuzer, M. Herbage selection by cattle on sub-alpine wood pastures. Forest. Ecol. Manag. 2003, 181, 39–50. [Google Scholar] [CrossRef]
- Mountousis, I.; Papanikolaou, K.; Stanogias, G.; Chatzitheodoridis, F.; Roukos, C. Seasonal variation of chemical composition and dry matter digestibility of rangelands in NW Greece. J. Cent. Eur. Agr. 2008, 9, 547–556. [Google Scholar]
- Willems, H.; Kreuze, M.; Leiber, F. Alpha-linolenic and linoleic acid in meat and adipose tissue of grazing lambs differ among alpine pasture types with contrasting plant species and phenolic compound composition. Small Rumin. Res. 2014, 116, 153–164. [Google Scholar] [CrossRef]
- Khiaosa-Ard, R.; Soliva, C.R.; Kreuzer, M.; Leiber, F. Effects of species-diverse high-alpine forage on in vitro ruminal fermentation when used as donor cow’s feed or directly incubated. Animal 2012, 6, 1764–1773. [Google Scholar] [CrossRef] [PubMed] [Green Version]
- Waghorn, G. Beneficial and detrimental effects of dietary condensed tannins for sustainable sheep and goat production—Progress and challenges. Anim. Feed Sci. Technol. 2008, 147, 116–139. [Google Scholar] [CrossRef]
- Valdivielso, I.; Bustamante, M.A.; Aldezabal, A.; Amores, G.; Virto, M.; de Gordoa, J.R.; de Renobales, M.; Barron, L.J.R. Case study of a commercial sheep flock under extensive mountain grazing: Pasture derived lipid compounds in milk and cheese. Food Chem. 2016, 197, 622–633. [Google Scholar] [CrossRef] [PubMed]
- Engel, E.; Ferlay, A.; Cornu, A.; Chilliard, Y.; Agabriel, C.; Bielicki, G.; Martin, B. Relevance of isotopic and molecular biomarkers for the authentication of milk according to production zone and type of feeding of the cow. J. Agric. Food Chem. 2007, 55, 9099–9108. [Google Scholar] [CrossRef] [PubMed]
- Tornambé, G.; Cornu, A.; Pradel, P.; Kondjoyan, N.; Carnat, A.; Petit, M.; Martin, B. Changes in terpene content in milk from pasture-fed cows. J. Dairy Sci. 2006, 89, 2309–2319. [Google Scholar] [CrossRef] [Green Version]
- Agabriel, C.; Cornu, A.; Journal, C.; Sibra, C.; Grolier, P.; Martin, B. Tanker milk variability according to farm feeding practices: Vitamins A and E, carotenoids, color, and terpenoids. J. Dairy Sci. 2007, 90, 4884–4896. [Google Scholar] [CrossRef]
- Fernandez, C.; Astier, C.; Rock, E.; Coulon, J.B.; Berdagué, J.L. Characterization of milk by analysis of its terpene fractions. Int. J. Food Sci. Technol. 2003, 38, 445–451. [Google Scholar] [CrossRef]
- Gai, F.; Battelli, G.; Bottero, M.T.; Civera, T.; Dalmasso, A.; Pattono, D.; Peiretti, P.G. Influence of Alpine highland pasture on the fatty acid and terpene composition of milk and Plaisentif cheese from various Piedmont farms. Options méditerranéennes. Serie A: séminaires méditerranéens 2014, 109, 293–296. [Google Scholar]
- Bozoudi, D.; Claps, S.; Abraham, E.M.; Parissi, Z.M.; Litopoulou-Tzanetaki, E. Volatile organic compounds of mountainous plant species and the produced milk as affected by altitude in Greece: A preliminary study. Int. J. Dairy Technol. 2019, 72, 159–164. [Google Scholar] [CrossRef] [Green Version]


| A1 | A2 | A3 | A4 | A5 | A6 | A7 | A8 | A9 | |
|---|---|---|---|---|---|---|---|---|---|
| Sampling date | 03/07/2014 | 30/06/2014 | 25/06/2014 | 03/07/2014 | 25/06/2014 | 25/06/2014 | 30/06/2014 | 30/06/2014 | 03/07/2014 |
| Latitude | 45°2’51” | 45°3’50” | 44°57’5” | 44°57’24” | 44°57’21” | 44°58’55” | 44°59’12” | 45°3’43” | 44°54’59” |
| Longitude | 7°7’21” | 7°2’2” | 6°57’20” | 6°48’33” | 6°50’50” | 6°55’43” | 6°54’36” | 7°2’52” | 6°53’42” |
| Altitude | 2040 | 1870 | 1807 | 1620 | 2070 | 1785 | 1867 | 1900 | 1870 |
| A1 | A2 | A3 | A4 | A5 | A6 | A7 | A8 | A9 | S.E.M. | |
|---|---|---|---|---|---|---|---|---|---|---|
| DM (g/kg) | 218.8ab | 190.3a | 229.2b | 276.8c | 207.4ab | 195.3ab | 225.8ab | 231.8b | 273.7c | 7.2 |
| Ash | 77.8abc | 75.0abc | 64.7ab | 63.4a | 82.1abc | 106.6d | 94.7cd | 88.0bcd | 74.9abc | 3.3 |
| Crude protein | 158.0d | 150.2bcd | 157.7d | 116.1a | 153.0cd | 130.4abc | 127.4ab | 126.4ab | 122.0ab | 3.5 |
| Lipid | 23.7 | 19.1 | 15.5 | 17.8 | 18.0 | 14.0 | 15.2 | 14.8 | 17.5 | 1.1 |
| NDFom | 562.6 | 587.6 | 534.6 | 575.1 | 509.2 | 515.8 | 522.9 | 551.0 | 523.7 | 8.8 |
| ADFom | 333.5a | 333.4a | 329.7a | 403.2b | 325.4a | 349.0a | 338.1a | 337.5a | 339.5a | 6.0 |
| Lignin | 89.7ab | 109.3ab | 117.3b | 98.7ab | 108.4ab | 98.9ab | 79.2a | 103.4ab | 110.4b | 3.0 |
| GE (MJ/kg DM) | 17.5a | 17.8a | 18.5b | 17.6a | 17.6a | 17.6a | 17.5a | 17.6a | 17.8a | 0.1 |
| IVTD (g/kg DM) | 829.3 | 790.3 | 811.8 | 705.7 | 829.1 | 819.8 | 803.4 | 816.5 | 759.9 | 11.1 |
| NDFD (g/kg NDF) | 694.4 | 643.5 | 648.7 | 487.0 | 664.0 | 650.1 | 621.3 | 669.0 | 540.5 | 19.3 |
| A1 | A2 | A3 | A4 | A5 | A6 | A7 | A8 | A9 | S.E.M. | |
|---|---|---|---|---|---|---|---|---|---|---|
| Palmitic acid | 63.9a | 65.9ab | 88.8b | 88.9b | 85.3ab | 86.2ab | 81.9ab | 87.6b | 79.8ab | 2.5 |
| Stearic acid | 16.4 | 16.3 | 26.4 | 23.3 | 21.2 | 24.6 | 23.3 | 26.3 | 33.0 | 1.5 |
| Oleic acid | 11.2 | 14.6 | 18.4 | 17.6 | 13.4 | 10.7 | 11.9 | 16.1 | 19.5 | 1.0 |
| Linoleic acid | 104.0bcd | 104.1cd | 88.5ab | 88.9abc | 104.4cd | 124.7e | 105.0cd | 74.9a | 110.2de | 8.4 |
| γ-Linolenic acid | 23.8 | 21.5 | 11.5 | 11.8 | 22.3 | 9.8 | 12.7 | 10.7 | 20.9 | 1.6 |
| α-Linolenic acid | 354.3a | 395.7ab | 519.1c | 503.2bc | 470.5abc | 438.3abc | 453.2abc | 518.7bc | 420.2abc | 14.3 |
| Total phenols | 36.3 | 44.3 | 61.2 | 49.2 | 53.5 | 52.7 | 37.0 | 42.5 | 52.0 | 2.6 |
| Total tannins | 29.4 | 34.8 | 49.9 | 39.2 | 43.5 | 43.4 | 24.6 | 34.4 | 41.4 | 2.6 |
| Condensed tannins | 82.6 | 243.1 | 224.3 | 179.7 | 71.6 | 157.1 | 23.9 | 71.6 | 114.6 | 22.7 |
| Compound | Chemical Abstract Service Number | Retention Index | Pasture | ||||||||||||||||||
|---|---|---|---|---|---|---|---|---|---|---|---|---|---|---|---|---|---|---|---|---|---|
| A1 | A2 | A3 | A4 | A5 | A6 | A7 | A8 | A9 | |||||||||||||
| min | max | min | max | min | max | min | max | min | max | min | max | min | max | min | max | min | max | ||||
| 1 | α-pinene | 80-56-8 | 1023 | 11.68 | 62.69 | 9.78 | 16.42 | 19.78 | 43.31 | 0.73 | 1.22 | 7.15 | 30.51 | 31.83 | 36.61 | 47.84 | 53.41 | 1.50 | 4.96 | 11.80 | 59.07 |
| 2 | camphene | 79-92-5 | 1065 | 2.11 | 12.20 | 1.40 | 4.68 | 4.62 | 6.29 | 0.13 | 0.20 | 2.24 | 2.54 | 2.16 | 2.81 | 2.67 | 19.97 | 0.20 | 0.85 | 1.44 | 5.32 |
| 3 | L-β-pinene | 18172-67-3 | 1105 | 3.82 | 5.85 | 1.47 | 1.76 | 2.83 | 7.84 | 1.29 | 1.77 | 7.64 | 10.54 | 1.96 | 2.19 | 6.66 | 8.76 | 0.27 | 0.55 | 0.39 | 3.40 |
| 4 | β-pinene | 127-91-3 | 1113 | 11.66 | 15.08 | 8.26 | 11.02 | 13.60 | 41.18 | 3.26 | 5.60 | 23.93 | 34.14 | 4.77 | 6.83 | 23.57 | 41.29 | 0.34 | 1.46 | 1.92 | 24.94 |
| 5 | unidentified | 1125 | - | - | 0.65 | 3.40 | 1.66 | 6.86 | - | - | - | 6.29 | - | - | - | - | - | - | - | - | |
| 6 | δ-3-carene | 13466-78-9 | 1125 | - | - | - | - | - | - | - | - | - | 1.41 | 8.37 | 22.36 | - | - | - | - | 5.26 | 8.17 |
| 7 | sabinene | 3387-41-5 | 1142 | 7.61 | 10.09 | - | - | - | - | - | - | - | - | - | - | 10.55 | 14.87 | - | - | - | - |
| 8 | β-myrcene | 123-35-3 | 1166 | 32.75 | 89.77 | - | - | - | 23.72 | 1.25 | 2.15 | - | 1.10 | 15.79 | 36.34 | 7.16 | 16.81 | - | - | - | 5.84 |
| 9 | α-terpinene | 99-86-5 | 1185 | - | 5.24 | 1.46 | 2.46 | - | 7.67 | - | - | 1.40 | 5.58 | 8.75 | 20.01 | 13.53 | 15.37 | - | - | 7.06 | 10.74 |
| 10 | limonene | 5989-27-5 | 1204 | 12.79 | 41.70 | 9.54 | 69.15 | 9.10 | 24.29 | 1.31 | 3.24 | 7.63 | 10.62 | 26.45 | 31.16 | 31.42 | 37.96 | - | 1.13 | 7.96 | 10.28 |
| 11 | eucalyptol | 470-82-6 | 1217 | 14.95 | 15.35 | 12.15 | 35.07 | 44.98 | 96.58 | 2.91 | 4.01 | 12.47 | 25.88 | 12.50 | 38.89 | 149.37 | 244.43 | 2.13 | 5.71 | 28.75 | 47.22 |
| 12 | β-ocymene | 3779-61-1 | 1237 | 4.23 | 16.92 | - | 0.60 | 1.23 | 1.65 | - | - | 0.53 | 0.59 | 2.85 | 4.91 | 3.01 | 4.87 | - | 0.16 | 0.58 | 2.23 |
| 13 | γ-terpinene | 99-85-4 | 1252 | 13.02 | 15.83 | 3.98 | 5.32 | 5.77 | 23.11 | 1.57 | 1.62 | 8.38 | 8.80 | 27.02 | 44.46 | 27.55 | 31.98 | 0.90 | 3.24 | 13.90 | 50.86 |
| 14 | o-cymene | 527-84-4 | 1278 | 8.63 | 11.69 | 1.53 | 3.44 | 3.48 | 30.25 | 0.29 | 0.34 | 2.25 | 20.50 | 13.34 | 14.23 | 32.29 | 44.32 | 1.01 | 1.17 | 19.29 | 91.13 |
| 15 | terpinolene | 586-62-9 | 1290 | 20.01 | 21.42 | 3.33 | 4.35 | - | 11.12 | - | 1.85 | 1.79 | 2.50 | 22.57 | 27.89 | 4.90 | 13.61 | 1.15 | 3.11 | 2.01 | 2.75 |
| 16 | allo-ocimene | 3016-19-1 | 1377 | 5.48 | 43.02 | 0.25 | 0.29 | 0.68 | 1.13 | 0.21 | 0.25 | 0.42 | 0.68 | 6.65 | 13.22 | 3.53 | 5.70 | - | 0.34 | 0.65 | 1.62 |
| 17 | matsutakeol | 3391-86-4 | 1453 | 33.93 | 33.81 | 22.57 | 29.28 | 29.02 | 35.29 | 18.85 | 18.96 | 26.71 | 33.77 | 14.66 | 22.77 | 27.24 | 42.86 | 12.88 | 44.92 | 19.39 | 32.08 |
| 18 | t-chrysanthenol | 38043-83-3 | 1491 | 1.19 | 1.44 | 0.00 | 0.60 | 0.71 | 0.94 | 0.37 | 0.51 | 0.68 | 0.70 | 3.70 | 11.38 | 11.77 | 25.66 | - | 0.52 | 1.06 | 5.80 |
| 19 | α-copaene | 1000360-33-0 | 1511 | 5.19 | 21.05 | 2.38 | 4.98 | 5.91 | 8.83 | 1.89 | 5.79 | 2.00 | 8.94 | 7.74 | 11.61 | 13.72 | 26.81 | 0.36 | 2.52 | 5.25 | 6.35 |
| 20 | (t.t)3.5-octadien-2-one | 30086-02-3 | 1531 | 4.41 | 8.39 | 2.71 | 3.69 | 2.32 | 2.45 | 1.25 | 1.65 | 1.22 | 1.37 | 2.08 | 4.84 | 4.80 | 5.17 | 1.15 | 3.33 | 1.66 | 1.71 |
| 21 | t-chrisanthenyl acetate | 50764-55-1 | 1543 | 5.33 | 13.01 | 0.79 | 2.75 | 10.90 | 12.97 | 2.04 | 2.23 | 1.94 | 2.01 | 7.82 | 8.71 | 3.34 | 35.89 | 1.63 | 4.19 | - | - |
| 22 | 2-bornanone | 464-49-3 | 1546 | - | - | - | 15.39 | - | - | - | - | - | - | - | - | - | 147.47 | - | 1.66 | 17.71 | 23.85 |
| 23 | linalyl acetate | 115-95-7 | 1550 | 4.51 | 6.58 | 0.47 | 2.33 | - | 3.69 | - | 0.35 | 1.62 | 2.46 | 1.47 | 2.93 | 10.25 | 72.83 | - | 0.44 | 4.06 | 9.00 |
| 24 | calarene | 17334-55-3 | 1558 | 2.07 | 9.92 | 1.08 | 2.44 | 2.26 | 9.05 | - | - | 0.30 | 1.42 | 2.16 | 6.50 | 6.92 | 11.66 | - | 0.82 | 1.76 | 2.36 |
| 25 | 4-cyclopentene-1.3-dione | 930-60-9 | 1604 | 80.59 | 98.18 | 44.94 | 60.05 | 55.14 | 237.28 | 10.20 | 10.26 | 1.03 | 1.77 | 3.48 | 25.74 | 69.11 | 138.91 | 53.70 | 210.23 | 56.52 | 104.18 |
| 26 | β-elemene | 33880-83-0 | 1611 | - | 14.53 | - | 11.69 | - | - | - | 1.71 | - | - | 3.90 | 8.31 | - | - | - | - | - | - |
| 27 | isoledene | 95910-36-4 | 1617 | 6.10 | 14.20 | 3.62 | 6.13 | - | 16.09 | 0.81 | 3.88 | - | - | 6.38 | 9.37 | 19.79 | 22.50 | 0.67 | 7.48 | 5.40 | 7.92 |
| 28 | β-caryophyllene | 87-44-5 | 1623 | 60.02 | 162.31 | 7.39 | 14.12 | 22.45 | 29.32 | 18.19 | 26.57 | 18.51 | 21.09 | 33.38 | 45.29 | 57.46 | 98.28 | 1.62 | 11.40 | 46.77 | 77.63 |
| 29 | cis-calamenene | 72937-55-4 | 1657 | 5.33 | 22.74 | 3.40 | 6.92 | 8.92 | 16.59 | 1.47 | 6.34 | 1.83 | 7.48 | 16.37 | 15.80 | 22.53 | 31.77 | 0.53 | 4.47 | 6.72 | 9.14 |
| 30 | unidentified | 1662 | 6.72 | 26.76 | 5.71 | 10.87 | 12.54 | 23.45 | 2.05 | 10.37 | 3.02 | 10.46 | 18.55 | 24.52 | 34.92 | 46.62 | 0.73 | 6.07 | 10.54 | 13.90 | |
| 31 | β-farnesene | 28973-97-9 | 1669 | 12.45 | 24.63 | 1.34 | 1.41 | 3.60 | 4.91 | 12.49 | 12.98 | 1.54 | 1.90 | - | 5.98 | 27.50 | 47.94 | 0.20 | 5.35 | 32.06 | 36.47 |
| 32 | β-sesquiphellandrene | 555-10-2 | 1684 | 4.64 | 20.59 | 5.91 | 12.77 | - | - | 1.59 | 7.15 | - | - | - | - | - | - | - | - | 7.86 | 10.13 |
| 33 | α-elemene | 5951-67-7 | 1696 | 18.88 | 103.70 | - | - | 16.03 | 30.29 | 3.86 | 13.94 | 3.23 | 11.67 | 21.70 | 37.82 | - | - | 0.62 | 6.94 | 16.05 | 22.03 |
| 34 | unidentified | 1696 | - | - | 7.54 | 14.47 | - | - | - | - | - | 0.96 | - | - | 45.66 | 64.43 | - | - | - | - | |
| 35 | γ-curcumene | 28976-68-3 | 1702 | 2.00 | 13.31 | - | - | - | - | - | - | - | - | - | - | - | - | - | - | - | - |
| 36 | δ-elemene | 20307-84-0 | 1706 | - | - | - | 23.62 | - | - | - | - | - | 13.18 | - | - | - | - | 1.02 | 6.65 | - | - |
| 37 | γ-muurolene | 30021-74-0 | 1706 | 6.84 | 26.92 | - | 11.86 | 15.25 | 28.36 | 2.70 | 10.80 | 3.46 | 13.18 | 17.64 | 24.45 | 45.18 | 63.38 | - | - | 12.15 | 15.18 |
| 38 | 10-epi-β-acoradiene | 28477-64-7 | 1710 | - | 5.78 | - | - | - | - | - | - | - | - | - | - | - | - | - | - | - | - |
| 39 | viridiflorene | 21747-46-6 | 1713 | 3.99 | 12.95 | 3.56 | 5.52 | 3.16 | 7.44 | 0.54 | 2.25 | 0.75 | 2.85 | 3.70 | 4.93 | - | 8.79 | - | 1.95 | 4.53 | 5.03 |
| 40 | borneol | 507-70-0 | 1714 | - | 18.58 | - | 0.79 | 1.05 | 2.10 | - | - | 0.19 | - | - | 4.08 | 3.21 | 65.53 | - | - | - | - |
| 41 | epizonarene | 41702-63-0 | 1723 | 6.34 | 28.50 | 4.55 | 8.76 | 12.76 | 25.96 | 2.84 | 13.32 | 3.01 | 12.44 | 20.77 | 24.57 | 36.68 | 46.20 | - | 4.26 | 11.97 | 14.94 |
| 42 | α-muurolene | 10208-80-7 | 1731 | 7.07 | 30.15 | 4.92 | 9.62 | 11.64 | 29.61 | 1.43 | 7.55 | 2.15 | 8.96 | 13.57 | 18.82 | 43.54 | 51.02 | - | 4.48 | 8.06 | 11.28 |
| 43 | eremophilene | 10219-75-7 | 1736 | 12.53 | 141.01 | 3.66 | 12.97 | 5.93 | 6.50 | 1.27 | 7.26 | 1.11 | 6.91 | 13.50 | 21.90 | 14.04 | 15.99 | - | 3.13 | 6.34 | 6.90 |
| 44 | carvone | 99-49-0 | 1743 | 2.98 | 5.13 | 1.07 | 21.47 | 2.16 | 2.86 | 0.13 | 12.75 | - | 0.53 | 2.08 | 3.76 | 12.19 | 120.46 | - | 1.53 | 2.06 | 13.90 |
| 45 | δ-cadinene | 483-76-1 | 1754 | 10.35 | 50.07 | 8.42 | 14.36 | 18.75 | 32.61 | 3.65 | 16.39 | 4.26 | 18.20 | 27.17 | 34.13 | - | 47.20 | - | 7.91 | 15.40 | 19.96 |
| 46 | β-cadinene | 523-47-7 | 1755 | - | - | - | - | - | - | - | - | - | - | - | - | - | 68.78 | - | - | - | - |
| 47 | germacrene | 28387-44-2 | 1759 | - | - | - | - | 10.91 | 20.96 | - | - | - | 2.52 | - | - | - | - | - | 4.63 | - | - |
| 48 | γ-cadinene | 39029-41-9 | 1760 | 11.31 | 29.55 | 4.55 | 8.02 | - | - | 2.22 | 8.95 | - | 10.57 | 13.29 | 18.57 | 27.57 | 40.72 | - | - | 9.43 | 12.44 |
| 49 | copaene | 3856-25-5 | 1772 | - | 25.00 | - | - | - | - | - | - | 1.41 | 5.33 | - | - | - | - | - | - | - | - |
| 50 | cadinadiene | 16728-99-7 | 1774 | - | 4.22 | 2.30 | 2.97 | 4.44 | 9.22 | - | 4.02 | - | 5.33 | - | 12.05 | 9.85 | 17.87 | - | - | - | - |
| 51 | selina-3.7(11)-diene | 6813-21-4 | 1775 | - | - | - | 2.10 | - | - | - | - | - | - | - | 17.41 | 3.95 | 10.40 | - | - | - | - |
| 52 | α-cadinene | 24406-05-1 | 1780 | 2.01 | 9.02 | - | 3.21 | 4.16 | 7.95 | 0.66 | 3.31 | 0.91 | 3.99 | 6.20 | 8.38 | 10.25 | 15.99 | - | 1.89 | 2.98 | 3.88 |
| 53 | calamenene | 483-77-2 | 1808 | 3.06 | 10.40 | 2.73 | 4.30 | 6.74 | 10.03 | 2.09 | 6.77 | 2.61 | 6.63 | 8.88 | 9.42 | 11.83 | 14.11 | 1.11 | 2.57 | 5.72 | 6.79 |
| 54 | α-patchoulene | 560-32-7 | 1835 | 1.46 | 8.40 | - | 0.58 | 0.70 | 1.49 | 0.27 | 0.54 | 0.15 | 1.36 | 3.56 | 10.90 | 2.85 | 3.75 | 0.10 | 0.30 | 0.96 | 1.00 |
| 55 | α calacorene | 21391-99-1 | 1869 | 1.29 | 6.44 | 0.85 | 1.76 | 2.40 | 4.22 | 0.78 | 2.29 | 0.66 | 2.30 | 3.01 | 4.99 | 5.11 | 6.26 | 0.19 | 0.94 | 3.98 | 5.20 |
| 56 | thymol | 89-83-8 | 2043 | 0.32 | 0.58 | - | 0.10 | 0.58 | 16.39 | - | 0.31 | 0.16 | 0.45 | 0.59 | 0.63 | 0.60 | 0.70 | - | - | 0.48 | 72.28 |
| 57 | carvacrol | 499-75-2 | 2070 | 0.15 | 0.20 | - | 0.21 | - | 0.54 | - | 0.12 | - | - | - | - | 0.86 | 1.51 | 0.19 | 0.21 | 0.32 | 3.02 |
| 58 | cadalene | 483-78-3 | 2102 | 1.33 | 1.34 | 0.57 | 0.73 | 0.74 | 1.16 | 0.18 | 0.65 | 0.27 | 0.55 | 0.64 | 1.18 | 1.64 | 2.09 | 0.80 | 1.30 | 0.72 | 0.87 |
© 2020 by the authors. Licensee MDPI, Basel, Switzerland. This article is an open access article distributed under the terms and conditions of the Creative Commons Attribution (CC BY) license (http://creativecommons.org/licenses/by/4.0/).
Share and Cite
Peiretti, P.G.; Tassone, S.; Vahdani, N.; Battelli, G.; Gai, F. Evaluation of the Nutritive Value and the Fatty Acid, Phenol, Tannin and Terpenoid Contents of Nine Pastures in an Alpine District during the Summer Season. Agriculture 2020, 10, 42. https://0-doi-org.brum.beds.ac.uk/10.3390/agriculture10020042
Peiretti PG, Tassone S, Vahdani N, Battelli G, Gai F. Evaluation of the Nutritive Value and the Fatty Acid, Phenol, Tannin and Terpenoid Contents of Nine Pastures in an Alpine District during the Summer Season. Agriculture. 2020; 10(2):42. https://0-doi-org.brum.beds.ac.uk/10.3390/agriculture10020042
Chicago/Turabian StylePeiretti, Pier Giorgio, Sonia Tassone, Narges Vahdani, Giovanna Battelli, and Francesco Gai. 2020. "Evaluation of the Nutritive Value and the Fatty Acid, Phenol, Tannin and Terpenoid Contents of Nine Pastures in an Alpine District during the Summer Season" Agriculture 10, no. 2: 42. https://0-doi-org.brum.beds.ac.uk/10.3390/agriculture10020042