1. Introduction
With the start of crop terracing and domestication of wild plants and animals during the first agricultural revolution, mechanization and fertilizer use during the second agricultural revolution, genetically modified organisms (GMO) in altering food at the genetic level and developing hybrid strains during the third agricultural revolution, many advances have been made in the agricultural sector. Since then, various landforms are converted into farmlands. During the conversion processes, many stolid and inviolable landforms are encountering physical, chemical, and biological forces that often challenge the sustainable management of farmlands from mountain peaks to plain level. Many factors—slope, aspect, land cover, soil types, demographic, social, cultural, political, economic, and technology—interact either separately or jointly and affect sustainable land management practices to varying degrees.
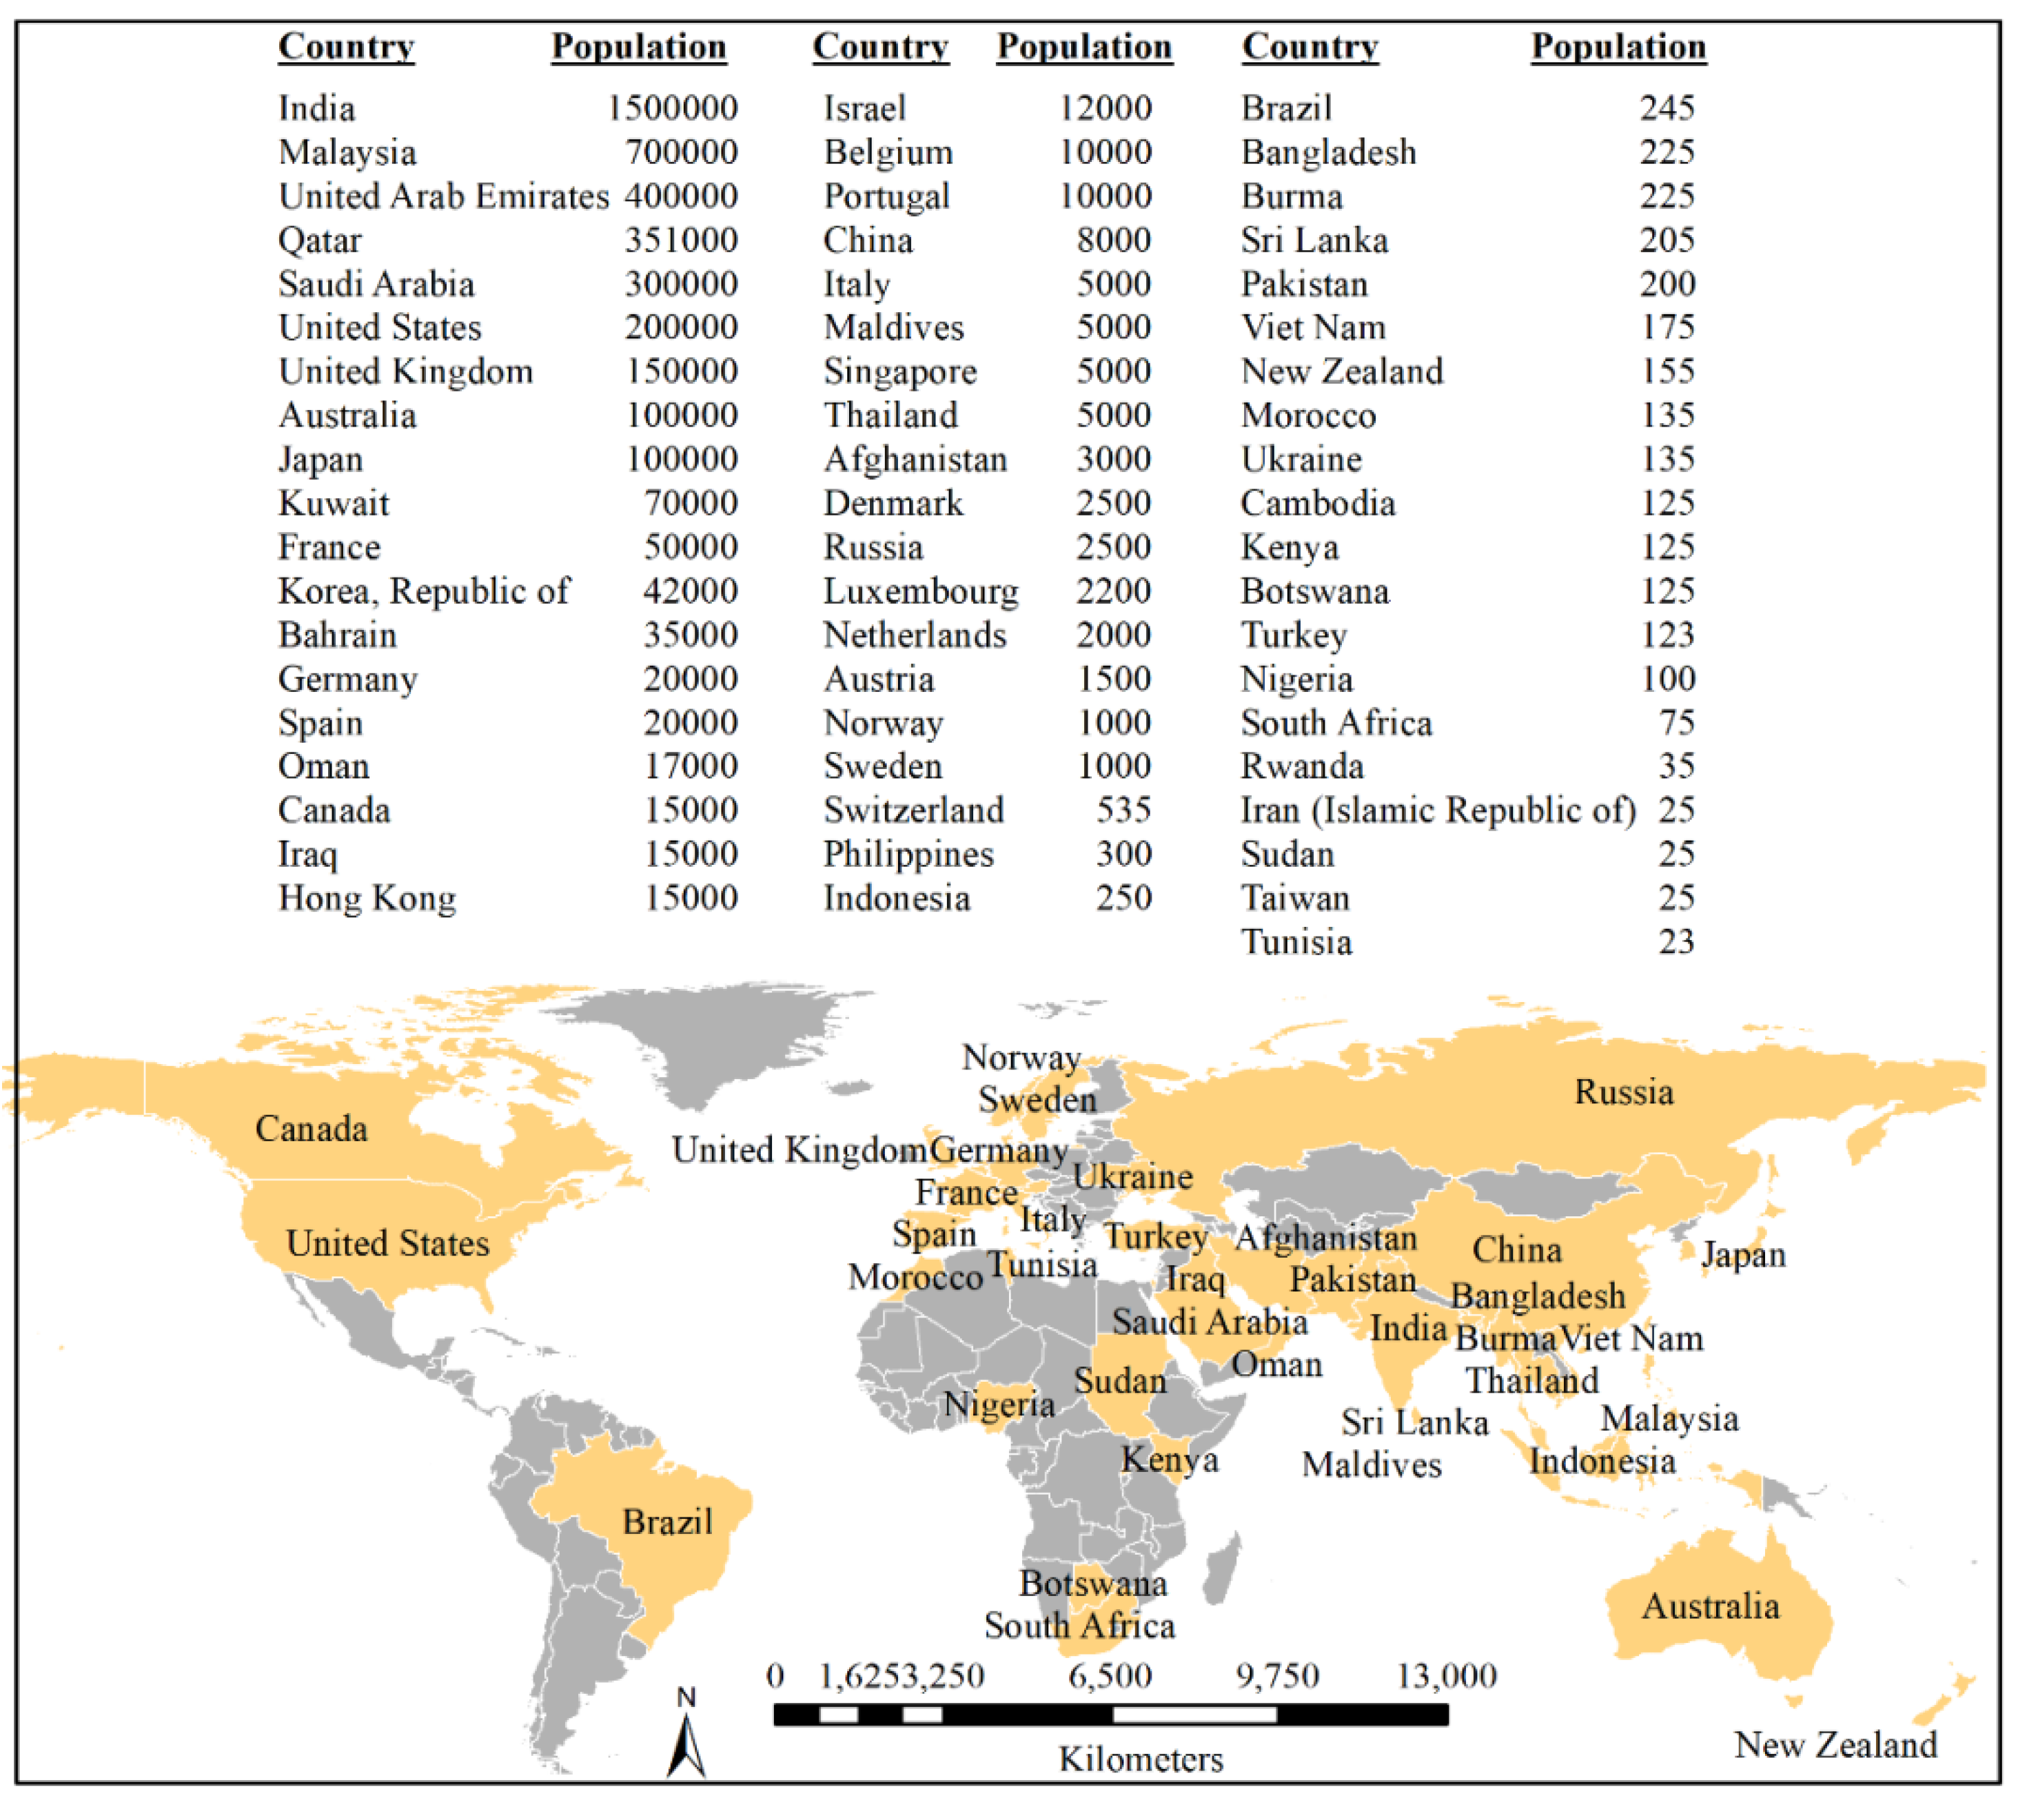
In this paper, we focus on the effects of topographic aspects, mainly the slope factors, in search of suitable farmlands to sustain the living of the Nepali farming communities. Currently, between six and eight million young people of the total 29 million people in Nepal are working in 59 countries (
Figure 1) for remittance purposes; however, this emigrated population has faced several obstacles at their places of destination.
As if these obstacles were not enough, the recent pandemic coronavirus (COVID-19) has created a panic situation on a global scale with an estimated annual economic loss of −8.75% of gross domestic product (GDP) in 210 countries. This rate of economic loss is much higher than Ebola (−8.14%) in 2014–16, methicillin-resistant
Staphylococcus aureus (MRSA) infection (−3.69%) in 2012, swine flu (−2.64%) in 2009–10, severe acute respiratory syndrome (SARS) flu (−3.05%) in 2002–04, and Spanish flu (−0.82%) in 1918 [
3]. COVID-19 is affecting 30% (
$26 trillion) of the
$80 trillion global trade. Of the 30%,
$20 trillion that would have been generated from the trade of materials and another
$6 trillion from services and intellectual properties have been severely affected. Due to the decrease in global economic growth, Nepal will lose 28% of the country’s GDP through remittances as youth working in 59 countries may lose their jobs [
4].
Many Nepali young people who abandoned their farmlands for remittance purposes are facing problems at their destinations and will be returning to Nepal. The Government of Nepal (GoN) is facing challenges to provide them alternative means of living. Due to the abandonment of many farming areas, agriculture contributions to national GDP have gone down from 80% in the 1980s to 26% in the recent decade. Every year, almost half a million youth come to the labor market and these youth along with the remitter returnees need means for their survival. By analyzing the slope areas and irrigation possibilities among others throughout Nepal, this paper seeks to identify possible agricultural sites to boost agricultural production by taking comparative advantage of the available large numbers of youth to harness opportunities offered by climate change to grow different crops at various elevations.
Topography, the slope factor, is a form of vulnerability as various types of landslides that happen on a steep slope [
4,
5,
6]. Aspect exposes the land surface to solar radiation. Aspect facing north is often shaded, while the southern side receives more solar radiation, but these effects vary with latitudinal locations. Ceteris paribus, aspect has direct effects on vegetation growth and land productivity. The aspect of a slope may have a significant influence on its local climate (microclimate) and land-cover management. Land cover, for example, vegetation, is the (bio)-physical cover on the Earth’s surface, which could be both natural and man-made. Bare land has no cover other than material structures such as soil types, rocks, where natural, physical, and chemical processes along with human activities influence land management. The intricacies of the demography and land-use relationships vary in different circumstances. It is difficult to state the exact relationship between land use and demography because of the lack of precise matching of demographic and ecological data, the lack of identification and quantification of causal connections between demographic and land use changes, and the lack of agreement among scientists about the level of observations to relate population and land use dynamics.
The social aspects of land management refer to transdisciplinary and cross-cultural cooperation among people. Cultural practices demonstrate how a community values land and manages it, such as cultivar selection, creating habitats for beneficial insects, weeding, and watering. The political aspects of land management look at the relationship between how a population mediates institutional roles and competing claims among various institutions and ethnic groups. It also involves norms and visions driving the policies, spatial integrations of sectoral issues, decision-making, budgeting, implementation of plans monitoring of results, and evaluations of economic impacts. The economic aspects look at the benefits and consequences of sustainable land management, the true costs of degrading land, and the hidden cost of land-based ecosystems from natural science and the neoclassical economics paradigms. The natural science paradigm focuses on land carrying capacity and the effects of increasing human populations on species loss and ecosystems. The neoclassical paradigm looks at the accumulation of both physical and human capital and their substitution effects. This is where technological factors play important roles in evaluating the strong and loose form of sustainability principles. Many technological factors attempt to overcome natural science but fail to govern it. For example, natural science can only predict climatic change, but it cannot completely stop this process. Thus, without a proper marriage between science and conscience, sustainable land management is difficult [
7].
The neoclassical economic paradigm argues in favor of an increasing standard of living for a growing population even in a condition of ‘finite resource base’ [
8]. Stiglitz [
9] and Simon [
10] argue that even at a condition of finite resource base, improving living standards is possible through the advancement of technology. Advanced technology makes it possible to increase production per unit of land with fertilizer and labor [
11,
12,
13]. Intensive use of farmland on slopes may degrade its quality; however, technology, such as terracing and fertilizer, could minimize ecological damage and reclaim bare land with poor soil quality to enhance agricultural production even at a higher elevation. Climate continues to warm at a higher elevation; temperature isotherms move uphill creating more favorable conditions for vegetation establishment and land productivity. This might alter the crop dynamics with the upward shift in tree and crop line [
13,
14]. These accounts reveal that sustainable land use involves multiple factors such as slope aspect, land use, soil type, materials/rocks, and elevation [
15,
16,
17,
18,
19,
20].
In Nepal, planners, policymakers, and politicians (P3) are struggling to keep up with ambitious targets/slogans to improve the living conditions of people. In reality, no governments led by any elected party/ies have been able to meet the promises made during the election. The resulting residuals between promises (expectations) minus achievements have created several political upheavals. The major political upheavals of 2008 in Nepal overthrew the 240-year old monarchial system with the establishment of the Federal Democratic Republic (FDR) in 2015. Accordingly, Nepal’s 75 districts were realigned to 77 districts and Nepal is divided into 7 provinces, 753 local units, and 6,743 hamlets (wards). The GoN aims to create jobs through sustainable land management in each province. About half a million youth join the labor market each year [
21]. There is no proper record of unemployment in Nepal, but various records indicate that the current unemployment rate is no less than 43% and it is increasing each year with a large number of the youth population. Democratization with a multiparty system and economic liberalization that started in Nepal in the 1990s raised many aspirations. Unfortunately, the aspiring youth received very little or no incentives of what actually was promised during the democratic movements; unemployment increased with the rapid monetization of previously “semi-subsistence rural communities” ([
22]:885). With increasing unemployment, Nepal has become a nation that previously supplied “Gurkha warriors” to the British and Indian armies to one supplying “global workers” for the international capitalist economy [
23]. Until the 1990s, India used to be a major destination for Nepali migrants, but today, Nepali go to over 59 countries with over 37% to the Gulf States, 37% to India, and 13% to Association of Southeast Asian Nations (ASEAN) countries (
Figure 1). Highly skilled people go to western countries in Europe and North America or Australia.
In 2010, every fifth Nepali was absent from a household, and “73% of these absentees were males” [
24]: 10) of whom 62% were married. They were in the age range of 15 to 29 years with “only 12% being women” [
24]:33). In half of the Nepali rural households, at least one person is abroad or has recently returned from remittance purposes. In rural areas, only elders and children are bearing the burden of agricultural chores [
22]. About 1200–1500 working-age people used to leave Nepal each day in search of jobs elsewhere [
25], however, COVID-19 has brought this process to a standstill. With these emigrants, Nepal was the third-biggest receiver of remittances in the world, after Tajikistan and Kyrgyzstan, and it was one of the highest absentee youths in the world. In the share of GDP for 2018, Nepal has become one of the top five recipient smaller economies, along with Tonga, Kyrgyz Republic, Tajikistan, and Haiti [
26]. In 2018 alone, Nepali migrants remitted
$8.1 billion making it the 19th biggest remittance beneficiary around the world [
26]. In 2019, the number of Nepali emigrants decreased by 39.2% as compared to a 4.9% drop in 2018; however, the amount remitted has increased by 16.39%. This makes Nepal one of the biggest remittance beneficiaries among the top 20 Asian countries ranking fourth in the South Asian region, just behind India (
$78.6 billion), Pakistan (
$21 billion) and Bangladesh (
$15.5 billion), but ahead of Sri Lanka (
$7.5 billion) [
26].
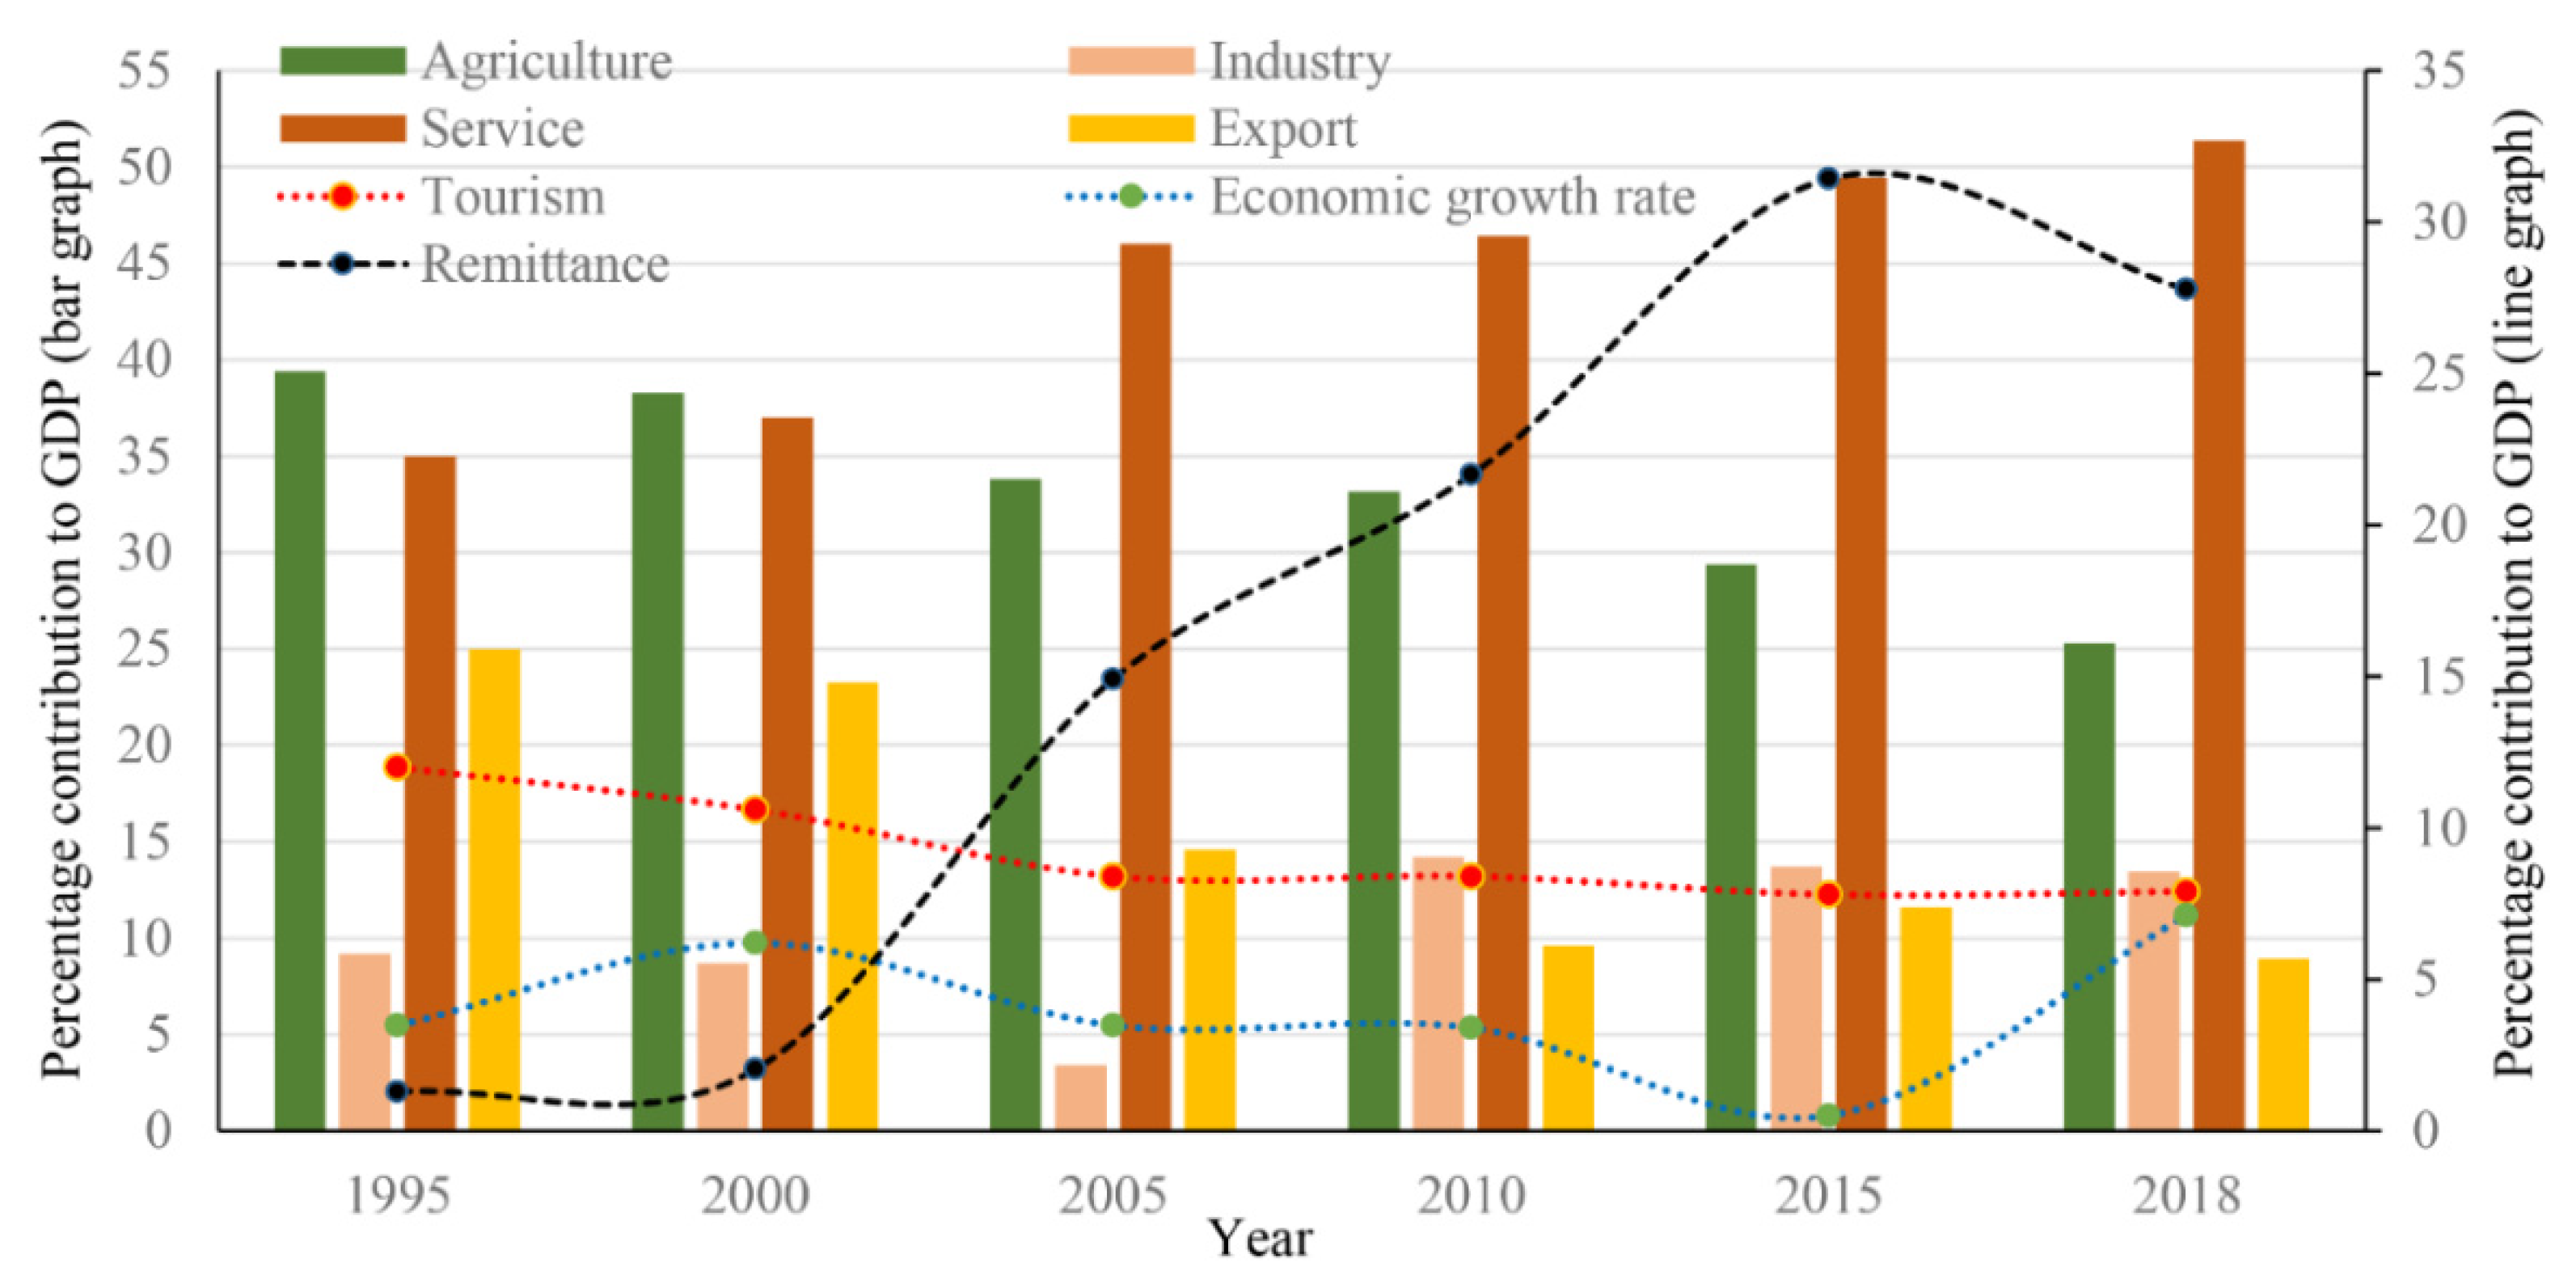
Various estimates reveal that about six to eight million youth out of 29 million of the total population live outside Nepal and remit incomes. The contribution of remittances to the total GDP has increased from 1.29% in 1995 to 27.77% in 2018, while the contribution from agriculture has decreased from 80% in the 1980s to 26% at present [
27]. Although service sectors and tourism are also contributing to the tepid economy to some extent, decreasing trade and a widening gap between import and export does not portend a positive picture for the Nepali economy [
28]. The COVID-19 pandemic has created havoc globally (Shrestha 2020), Nepal is expected to lose 1.1% (
$321.7 million) of its total GDP from COVID-19 [
28,
29]. The tourism sector has already succumbed to a loss of 0.8% of GDP from hotel and restaurant, agriculture, industry, and production sectors had already lost
$36.78 million with the outbreak of COVID-19 in 2020 [
30]. The outbreak could cost the airline industry
$113 billion in revenue on a global scale [
30]. In Nepal, already 223,000 jobs are closed from tourism due to COVID-19 [
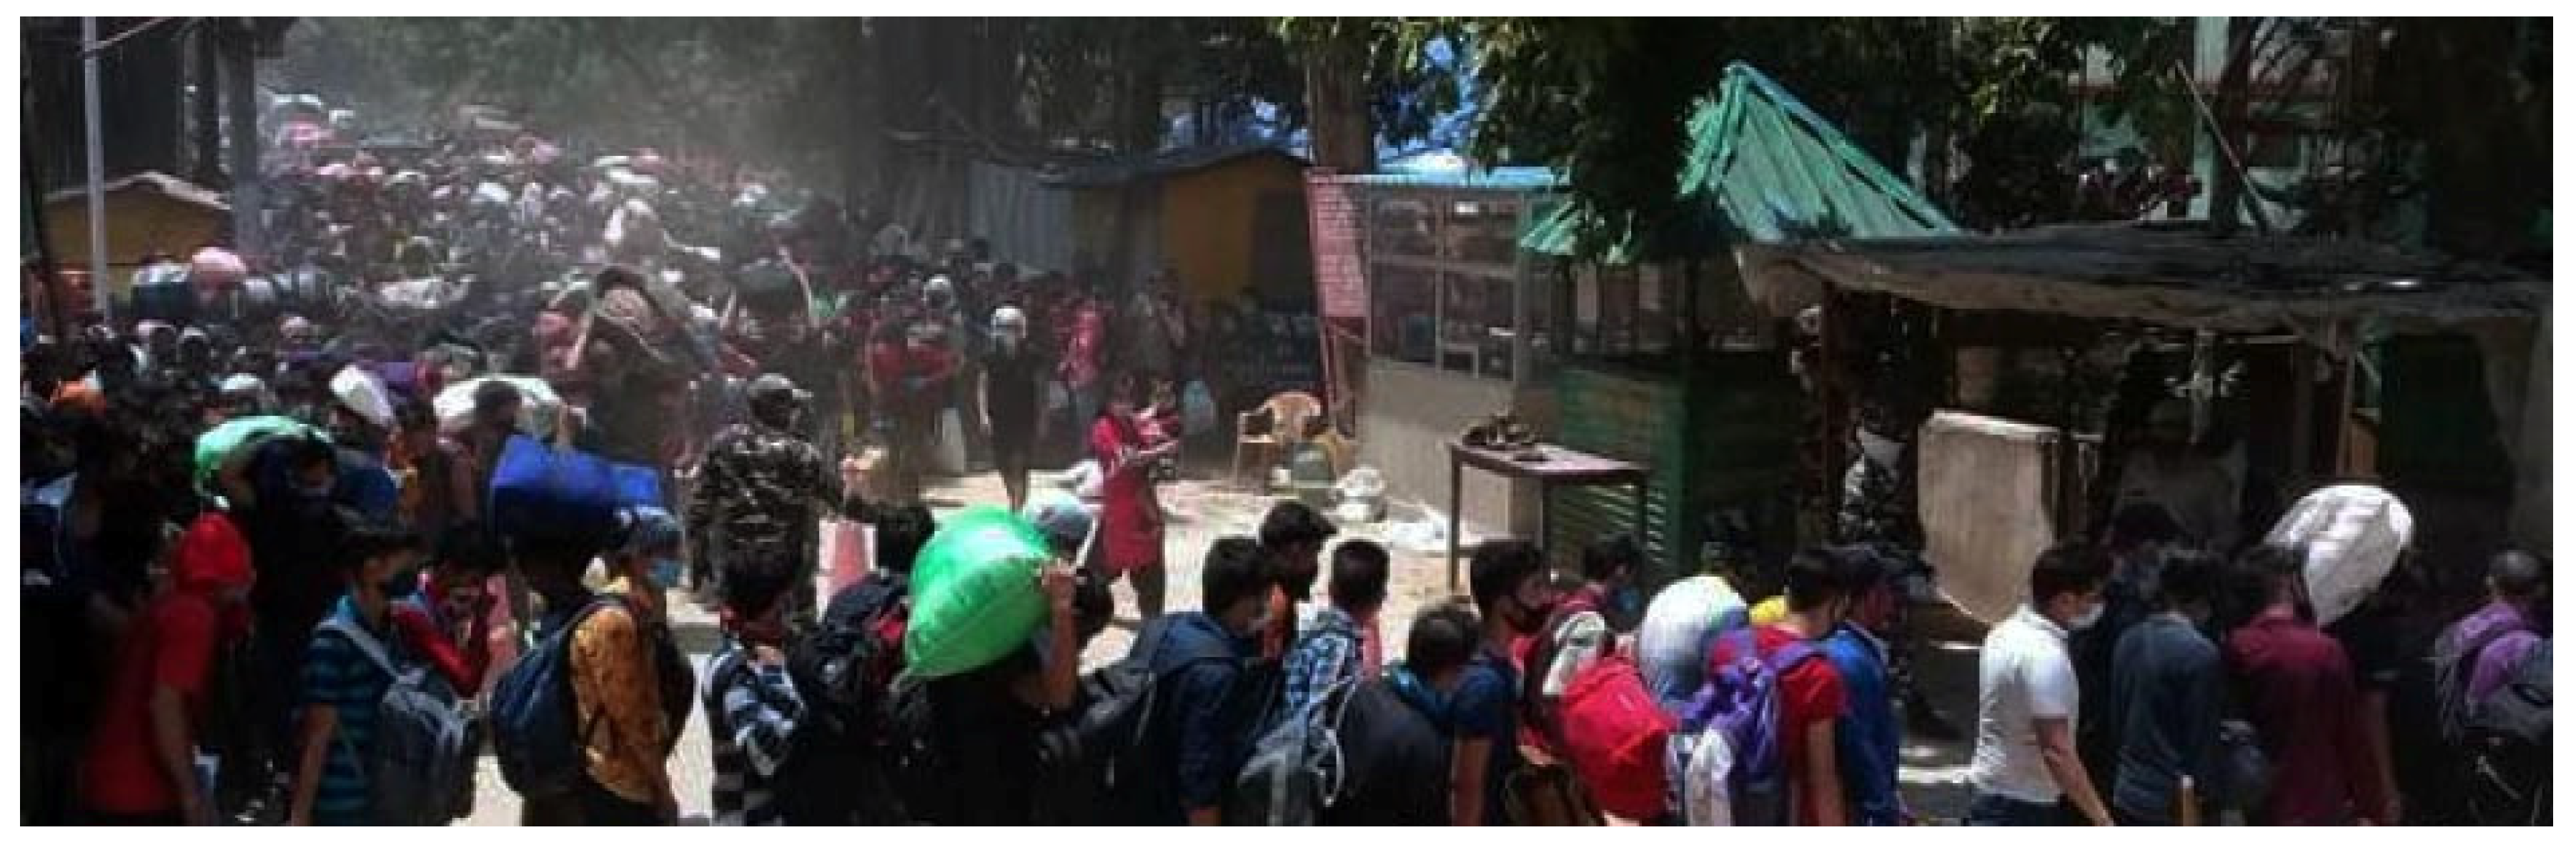
31]. Many Gulf, East Asian, and Southeast Asian, mainly Malaysia, and developed countries like Europe, Australia, and the U.S. have restricted the entries of Nepali nations. Already Saudi Arabia, the United Arab Emirates, Kuwait, and the Republic of Korea have started evicting many Nepali working in these countries. One and half million Nepali working in India are facing various troubles. Many have already been evicted and are languishing along the Nepal–India border (
Figure 2).
As of writing this paper, coronavirus has spread in 210 countries [
32]. Globally, over 7.4 million people have been infected, 413,439 have died. Although 1.5 million people have been cured at the global scale, in the U. S. alone, almost 2 million people have been infected and 113,000 have died. As of 10 June 2020, 19 people have died and over 4300 have been infected with the coronavirus in Nepal. More than 110 Nepali have died in foreign countries including the Middle East (50%), Americas (20%), Europe (20%), Asia (3%), and Oceania (1%) [
33] as of 10 June 2020. Tens of thousands of Nepali have returned to Nepal and over 1.35 million are in the process of evacuation from COVID-19 infected countries. As a result, the annual remittance has decreased from
$8790 million in 2018–2019 to
$7160 million in 2019–2020. Indians who come as blue-collar workers in Nepal remit almost
$3630 million back to India [
34]. Amidst such a fluid situation, this paper seeks to find solutions for Nepalis by exploring agricultural areas to engage them because industrial and service activities in Nepal are negligible to employ the returnees. First, it presents the materials and methods. Second, it looks at the country-level landforms and opportunities created by climate change in Nepal and the trend of intraregional migration and population concertation. Third, it explores the landforms and population distribution in 7 provinces. Fourth, it evaluates potential agricultural lands in 7 provinces. Fifth, it presents a conclusive summary with doable recommendations followed by references.
2. Methods
We explore the government publications, survey literature, utilize satellite imageries of the 1980s, 1990s, 2000s, and 2010s to explore land-use and -cover classes. We integrate the land-use and -cover classes with digital elevation data to explore the potential agricultural lands by nine slope classes. First, we explore the country landforms at the country level and then the provincial levels of landforms to explore potential agricultural lands. To be more specific, the materials included in this paper include the following:
remotely sensed images taken in the 1980s, 1990s, 2000s, and 2010s;
digital elevation model (DEM) captured by the Advanced Spaceborn Thermal Emission and Reflection Radiometer (ASTER), NASA, Washington D.C., CO, USA);
socioeconomic information from government publications;
Environmental System Research Institute (ESRI)’s ArcGIS 10.7 (Esri, Redlands, CA, USA) for Geographic Information Systems (GIS), and remote sensing image analyzing software Erdas Imagine 2016 of the Leicageosystem software packages (Hexagon AB, Stockholm, Sweden), to analyze and integrate remotely sensed images with socioeconomic and demographic information;
the computer program within Amazon Web Server (AWS, Seattle, WA, USA).
Data
The main data in this study include the land-use and land-cover classification of satellite images; for example, Multispectral Images (MSS) taken in the 1980s; Thematic Mapper taken in the 1990s; and Thematic Mapper 8 taken in the 2000s and 2010s. These images were classified in Erdas Imagine 2016 following the unsupervised and supervised classification methods. Since these methods have been well explained in many works of literature, we are not presenting the practical details of remote sensing image classifications; rather, we only present the result outcomes. We have used the outcomes of image classification that had the accuracy assessments of over 92%.
Each image was classified into: (1) mature well-stocked forest; (2) degraded forest; (3) agricultural land; (4) shrublands; (5) bare land; (6) settlements; and (7) waters. Since areas occupied by settlements and waters will not be converted into farmlands, we discarded them from the analyses because our goal is to identify potential areas for agricultural lands. We have combined both well-stocked and degraded forest under forest class; bare lands surrounded by the agricultural lands (except for rocky slope and sandy areas) and those that are within the slope ranges of 0–9.99° are merged with agricultural lands because they will be converted into agricultural lands if Nepal needs to accommodate all the Nepali including the remitters. We combined the bare lands (except for rocky slope and sandy areas) if such lands are in the vicinity of agricultural lands and surrounded by agricultural land in agricultural areas if they are within 0 to 9.99° slope because they can be easily converted into farmlands. We utilized the 30 m × 30 m resolution digital elevation model (DEM) from the ASTER [
35] and classified the elevation data into nine slope classes at an interval of 5° (
Table 1). We have integrated three land-use classes—forest, shrublands, and agriculture--with nine slope classes in a GIS platform. This data was brought to the Kibana platform (version 6.5.4, Elastic NV, Amsterdam, The Netherlands) using AWS in Windows 10 (Microsoft, Redmond, WA, USA).
Kibana is an open-source data visualization dashboard for Elasticsearch (version 6.5.4 Elastic NV, Amsterdam, The Netherlands,
https://github.com/elastic/elasticsearch). Kibana is installed using the Docker image (Docker, Inc., San Francisco, CA, USA,
https://github.com/docker/docker-ce). Docker uses operating-system-level virtualization to develop and deliver software in packages called containers. Once Kibana and AWS [
36] successfully integrate via Docker image, Kibana becomes accessible on port 5601 using
http://localhost:5601. Below is the Dockerfile for installing elasticsearch 6.5.4 version and Kibana 6.5.4.
services:
elasticsearch:
image: docker.elastic.co/elasticsearch/elasticsearch:6.5.4
container_name: elasticsearch
environment:
- cluster.name= docker-cluster
ports:
- 9200:9200
- 9300:9300
kibana:
image: docker.elastic.co/kibana/kibana:6.5.4
volumes:
- ./kibana.yml:/usr/share/kibana/config/kibana.yml
environment:
SERVER_HOST: 0.0.0.0
ports:
- “5601:5601”
- “8000:8000”
depends_on:
- elasticsearch
Thematic vector maps of Nepal with a provincial, district, and local political units were converted into geojson file and saved on a server. The geojson file was made available through the HTTP server to public use via port 8001 using the command below to spin up. The data generated from the remote-sensing and GIS platforms were joined with the geojson vector file in AWS platform: http-server --cors = “kbn-version” –p 8001.
The following kibana.yml was used to generate information at four levels: federal, provincial, district, and local political units. A user can select the federal level, a particular province, district within a province, and any local-level political units within the district to display the three land-use and –cover scenarios—forest, shrubland, and agricultural land—by nine slope classes using the following codes.
regionMap:
layers:
name: “Nepal District Map”
attribution: explorator.io
fields:
- name: “PROVINCE”
description: “PROVINCE”
- name: “DISTRICT”
description: “PROVINCE”
Nepali landforms vary from a plain area (65 m) to high mountains (8,850 m). Within this landform, Nepal’s topography varies from the Tarai (south) plain to hills and mountains in the north, where the climate varies within short spans offering varied agro-climatic conditions under the changing global climate change. Such location-specific climatic conditions have created opportunities to implement various agricultural activities within nine-slope classes. The following paragraphs first explore the topographic conditions of the whole of Nepal. This is followed by the analysis of various land-use and -cover situations from 1980 to 2010 within nine slope classes to explore possible agricultural lands.
3. Topography, Climate Change, Existing Land Resources, and Population Distribution
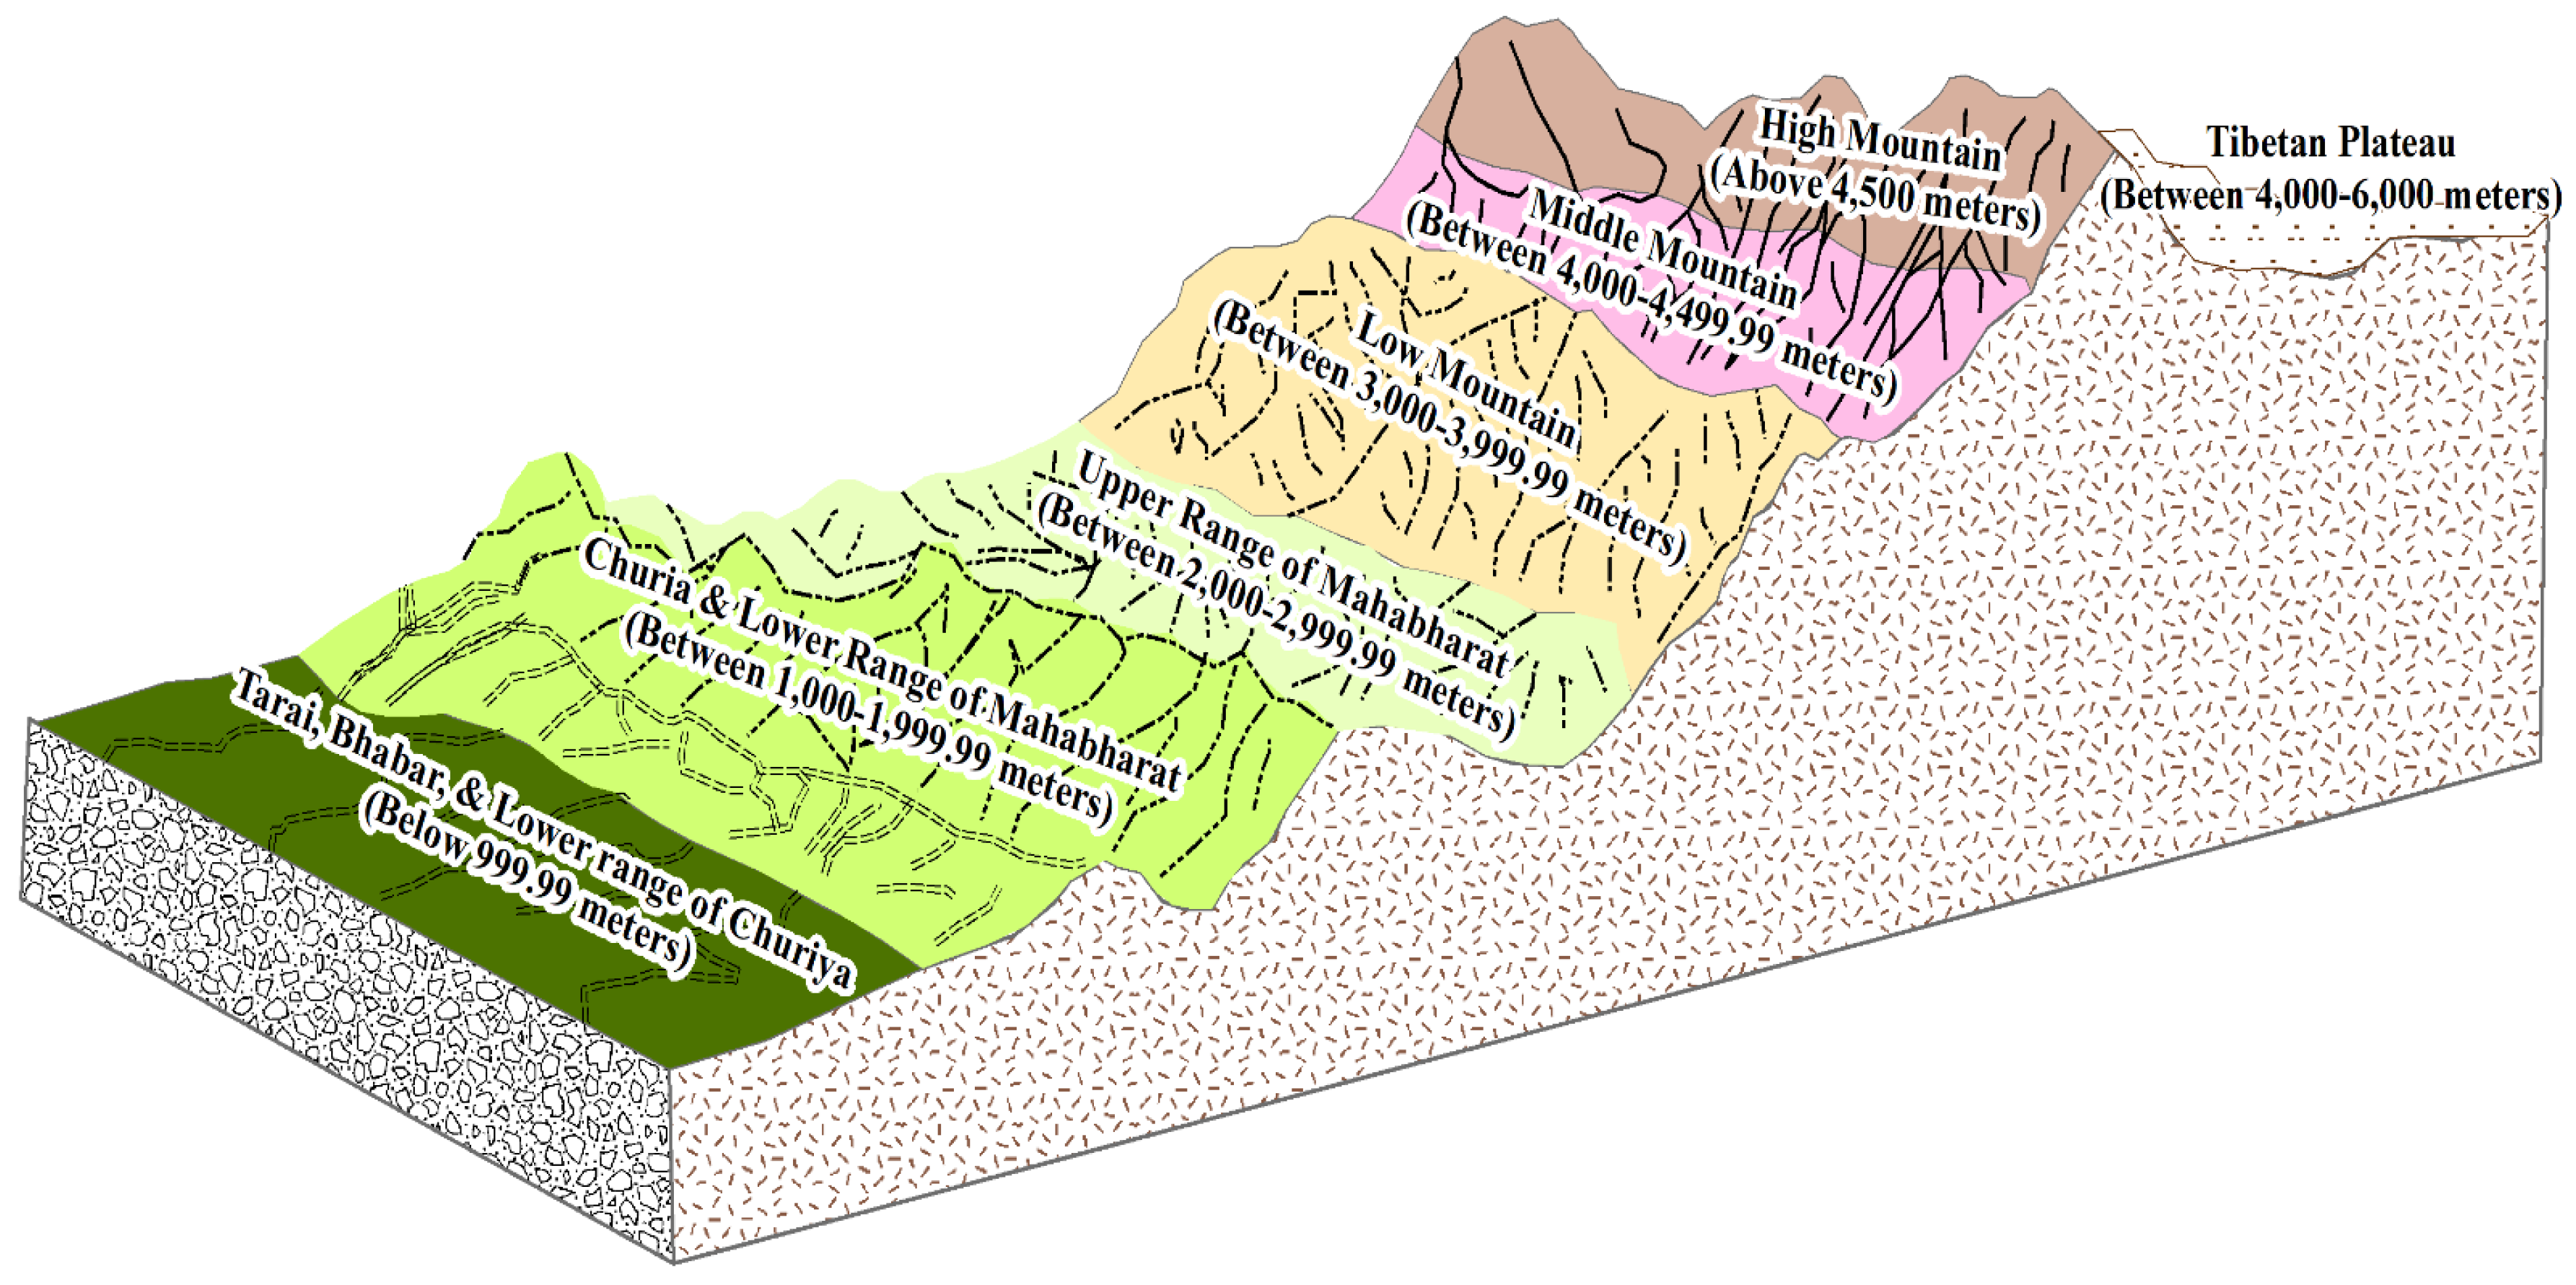
Within 147,181 sq. km physical area, Nepal’s topography ranges from the peak of the world Mt. Everest (8,850 m) in the north to 62 m lowland south within an approximate north-south width of 250 km (
Figure 3 and
Figure 4). Mountains and rugged hills cover almost 75% of the total land area. The southern Tarai region is an extension of the Indo Gangetic plain and covers only 17% of Nepal’s total geographical area. Between the high mountain and plain Tarai lies the central hill region consisting of mountains, hills, flatlands, and deep valleys, with elevations ranging from 600–3000 m (
Figure 3).
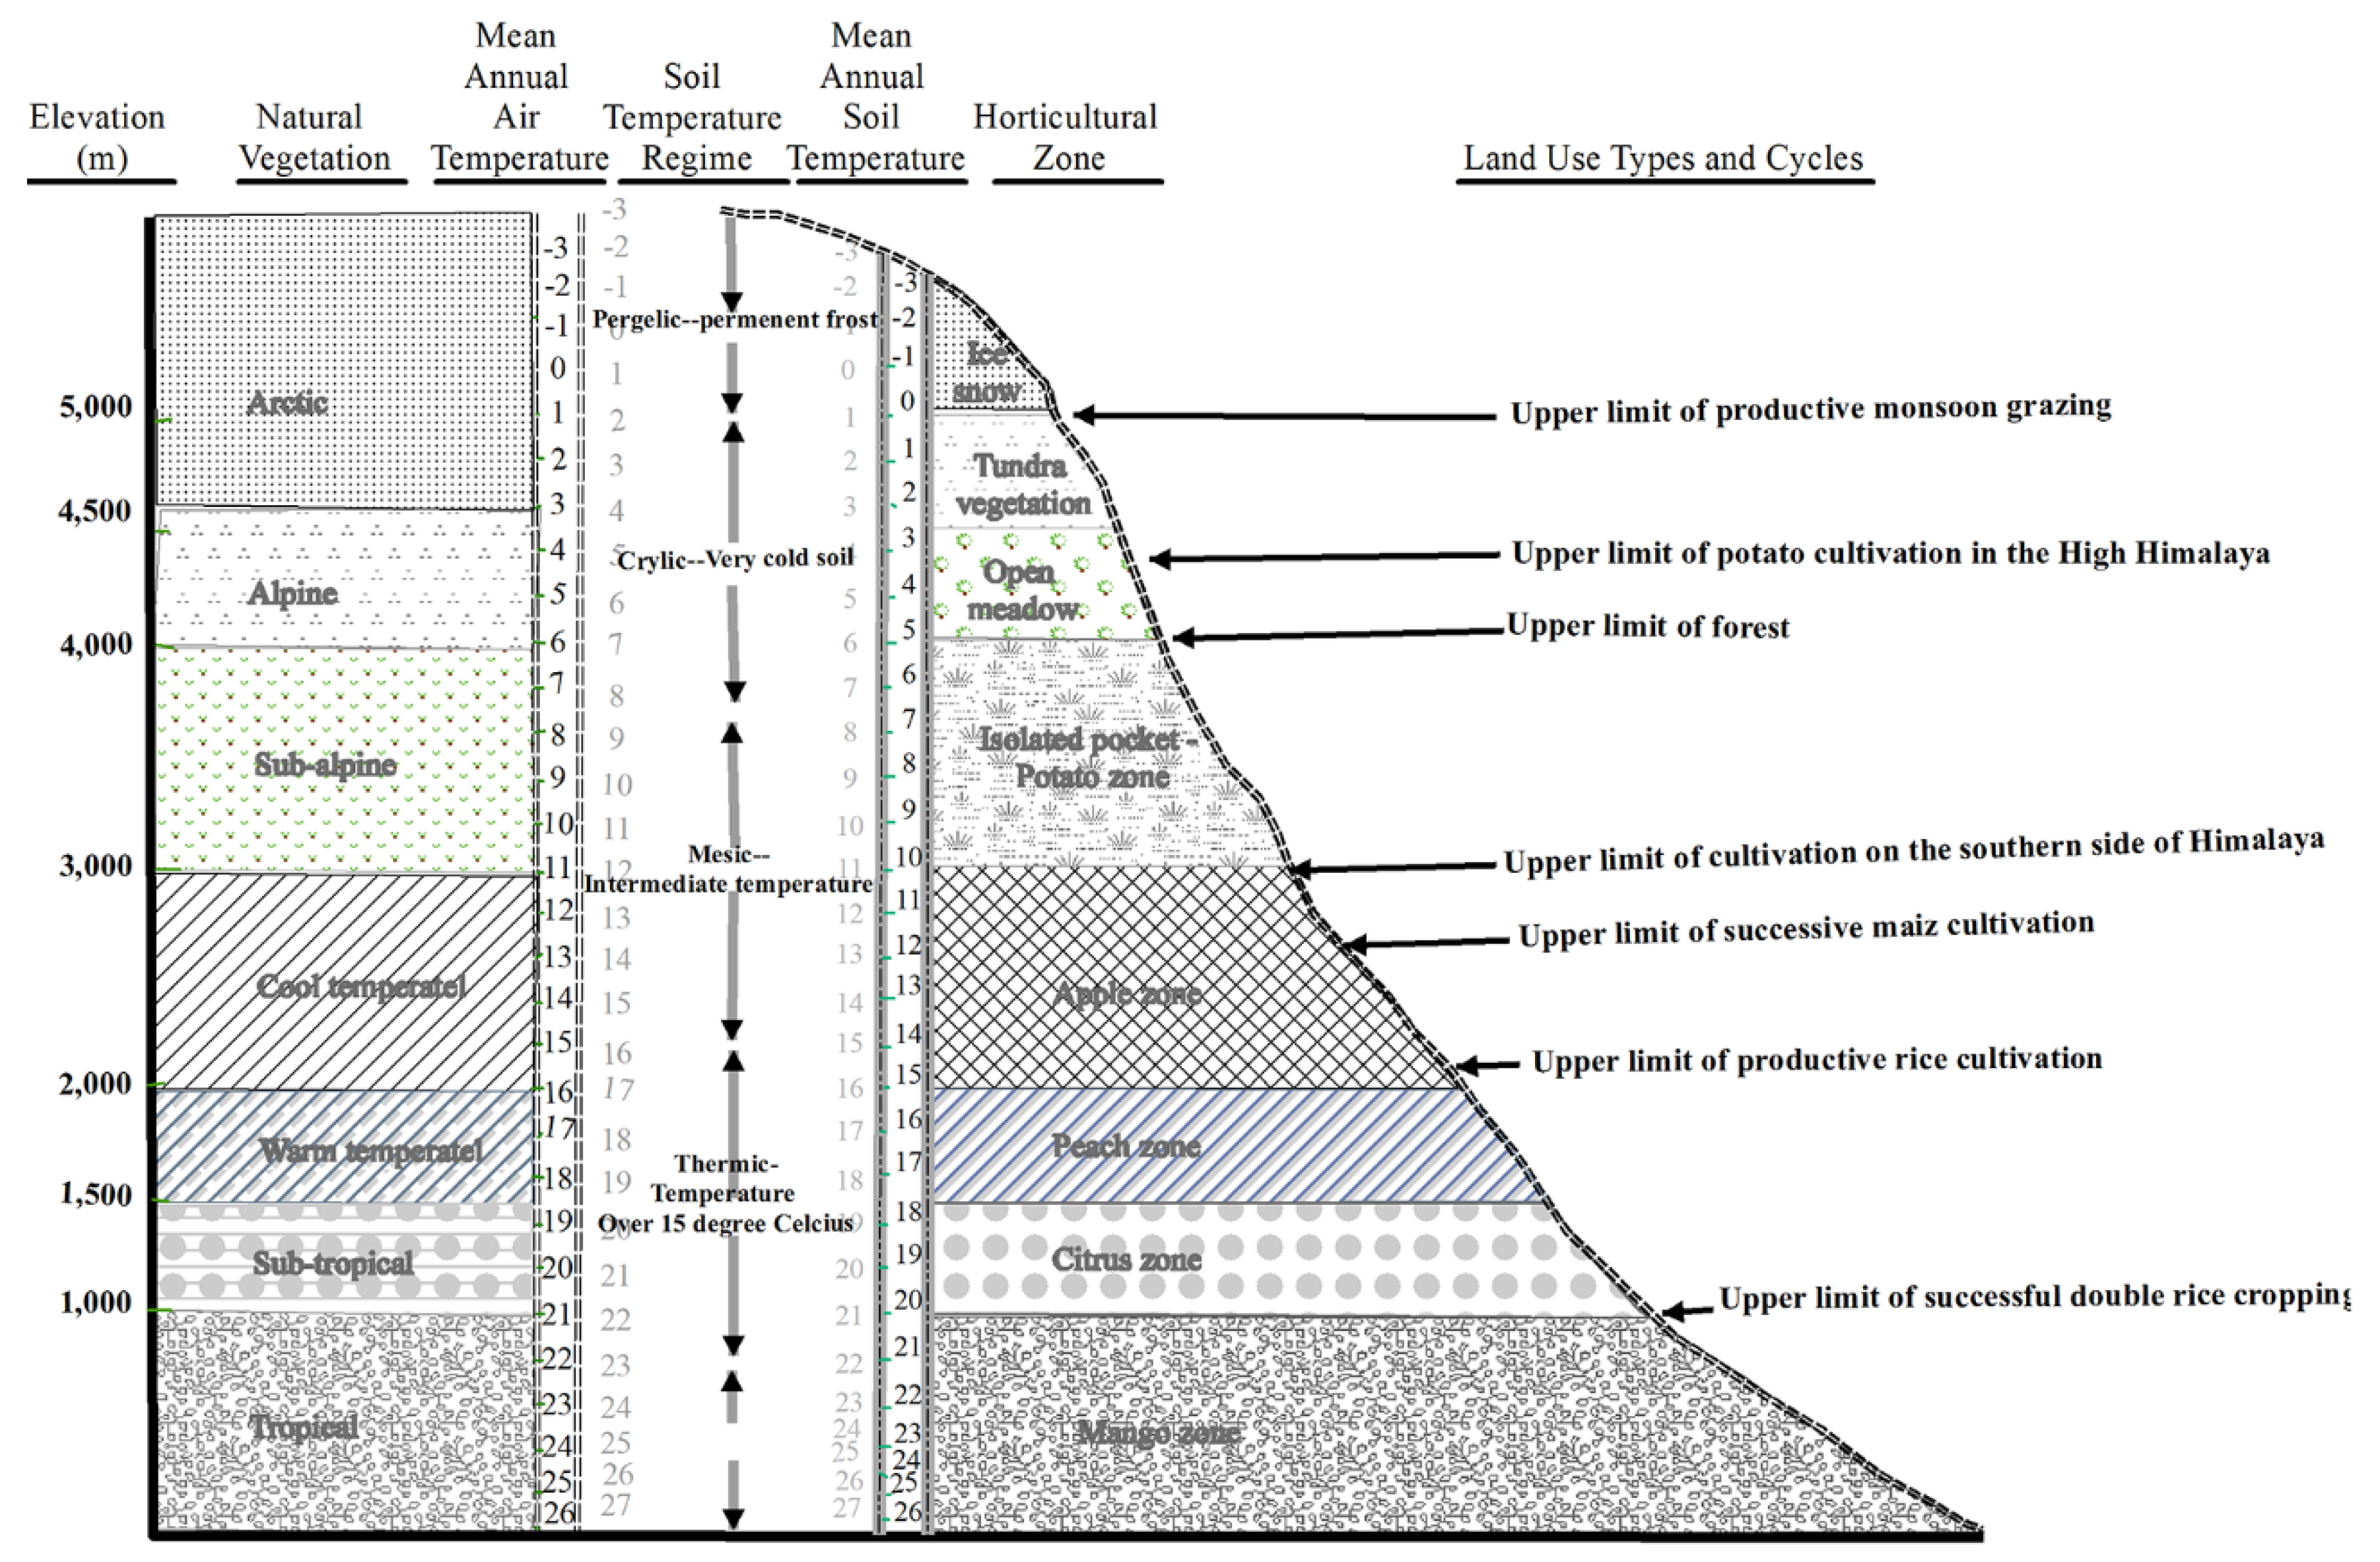
Within these elevational ranges, the climate is changing at the rate of 0.06 ± 0.015 °C year
−1 at the higher elevations (>4500 m) as compared to 0.01 °C at the lower elevation (
Figure 4). Climate change has created new opportunities to grow low elevation crops and raise low elevation cattle to a higher elevation.
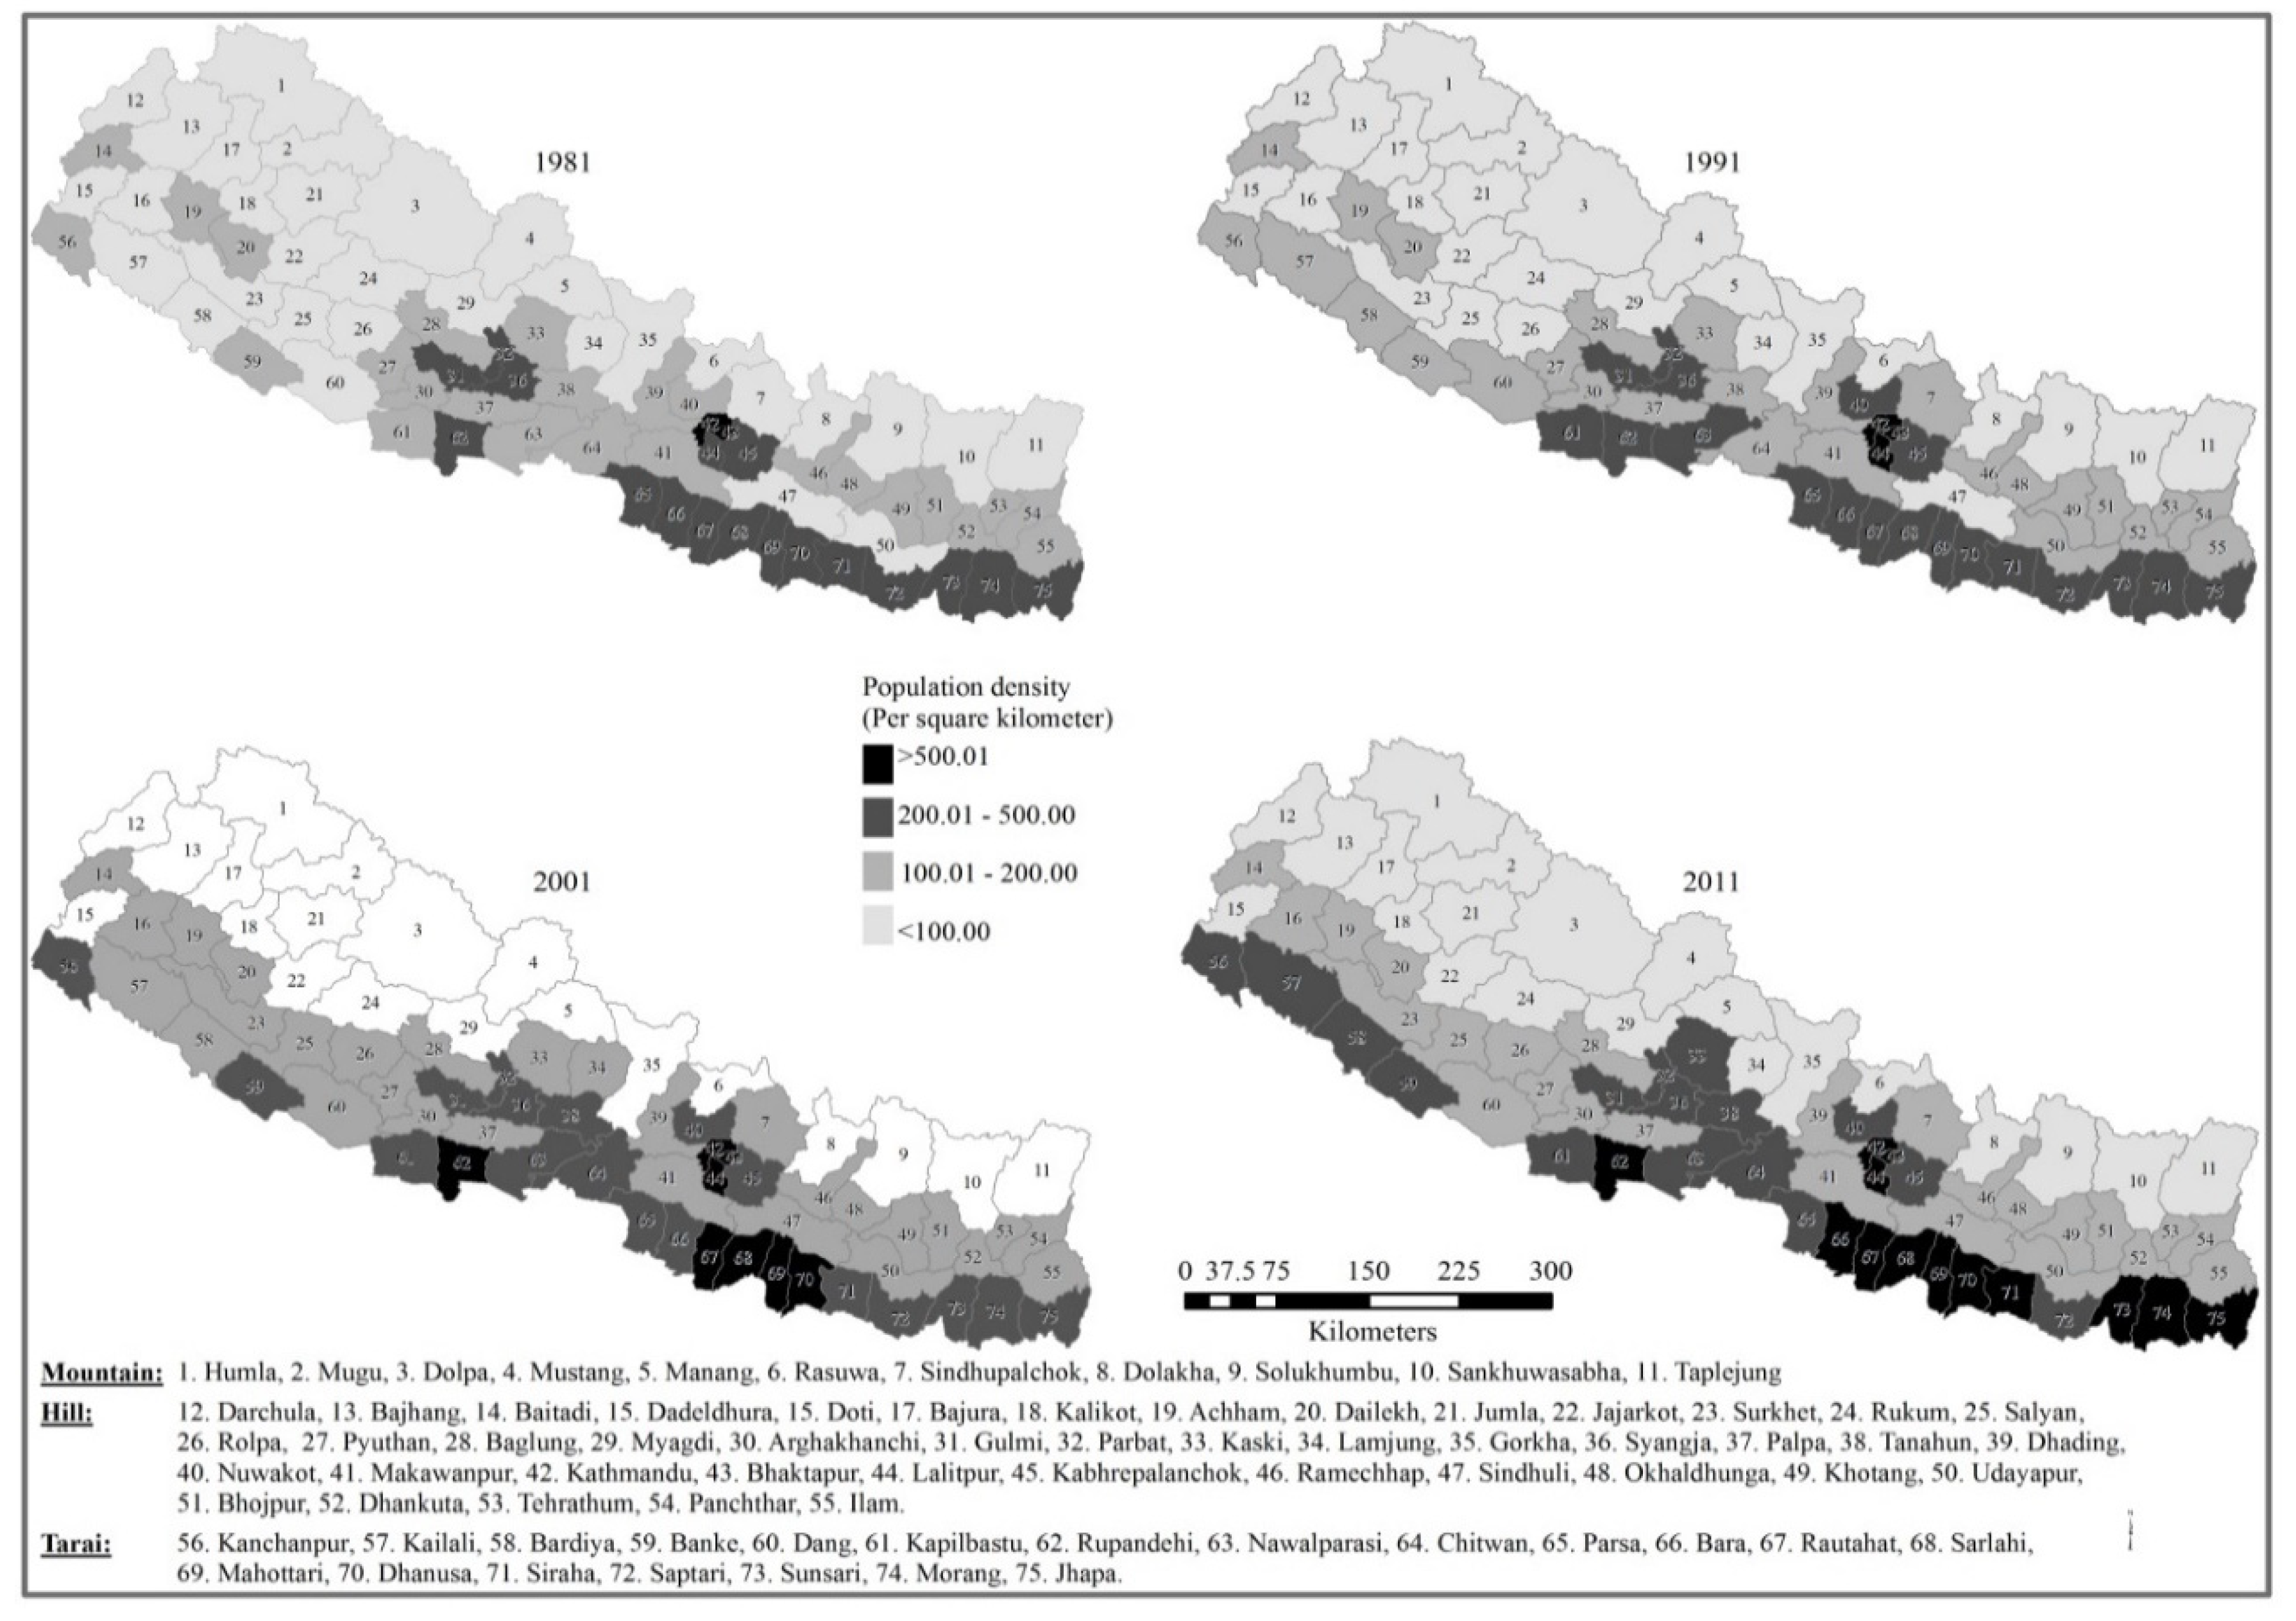
Due to undulated topography and lack of developmental activities, the population is migrating to the lower elevation (
Figure 5).
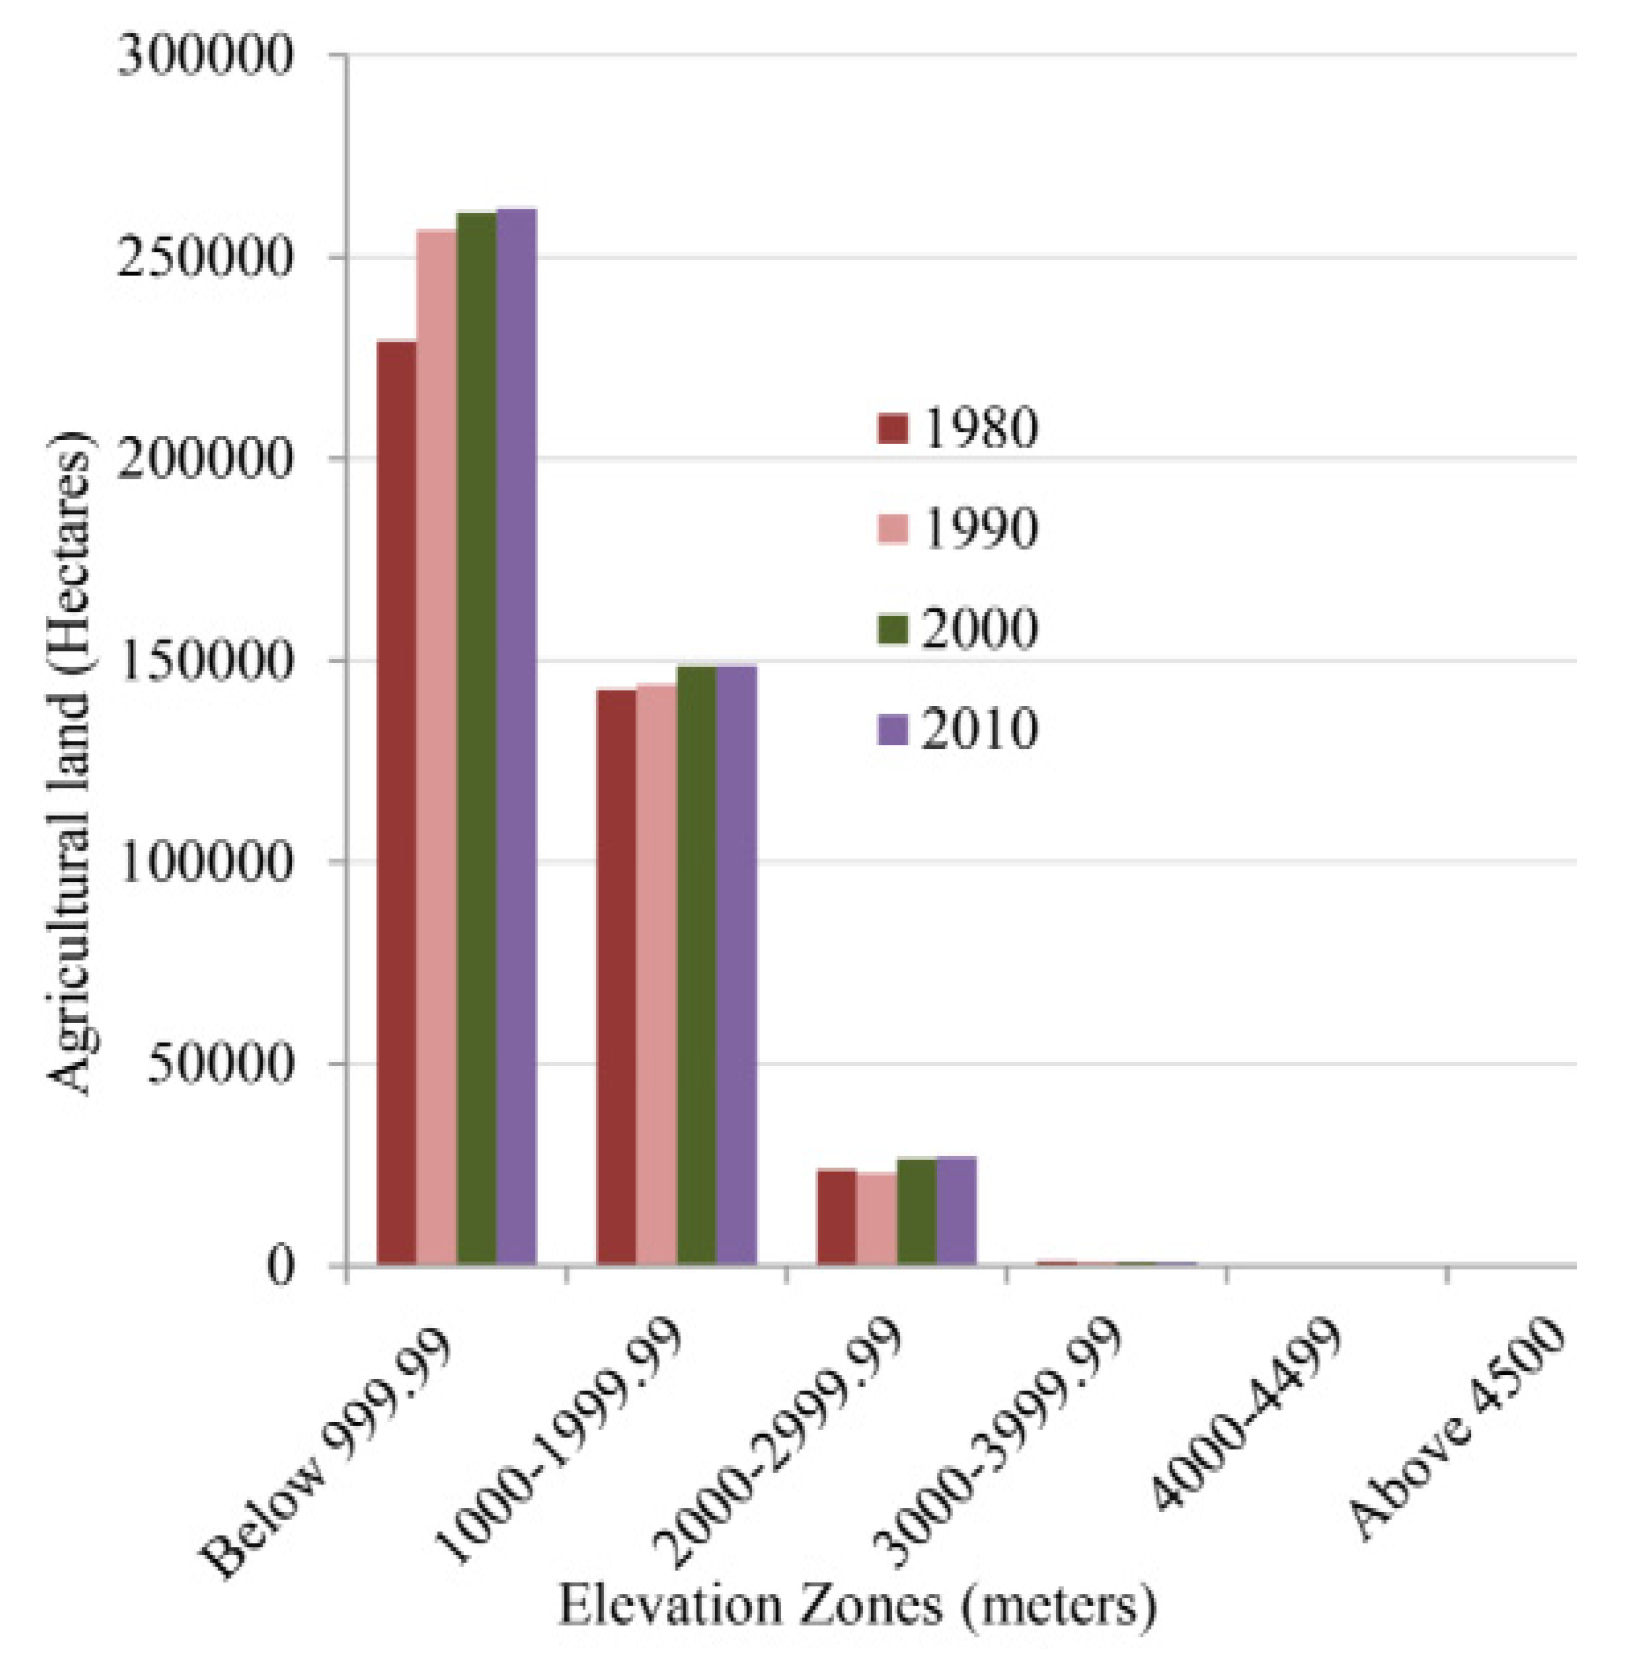
Agricultural areas are decreasing at higher elevations in successive decades, but at the lower elevation, they have been increasing (
Figure 6). At the higher elevations, the population is involved in sheep and yak herding, tourism, and collection of medicinal herbs such as Yarsha Gumba and others.
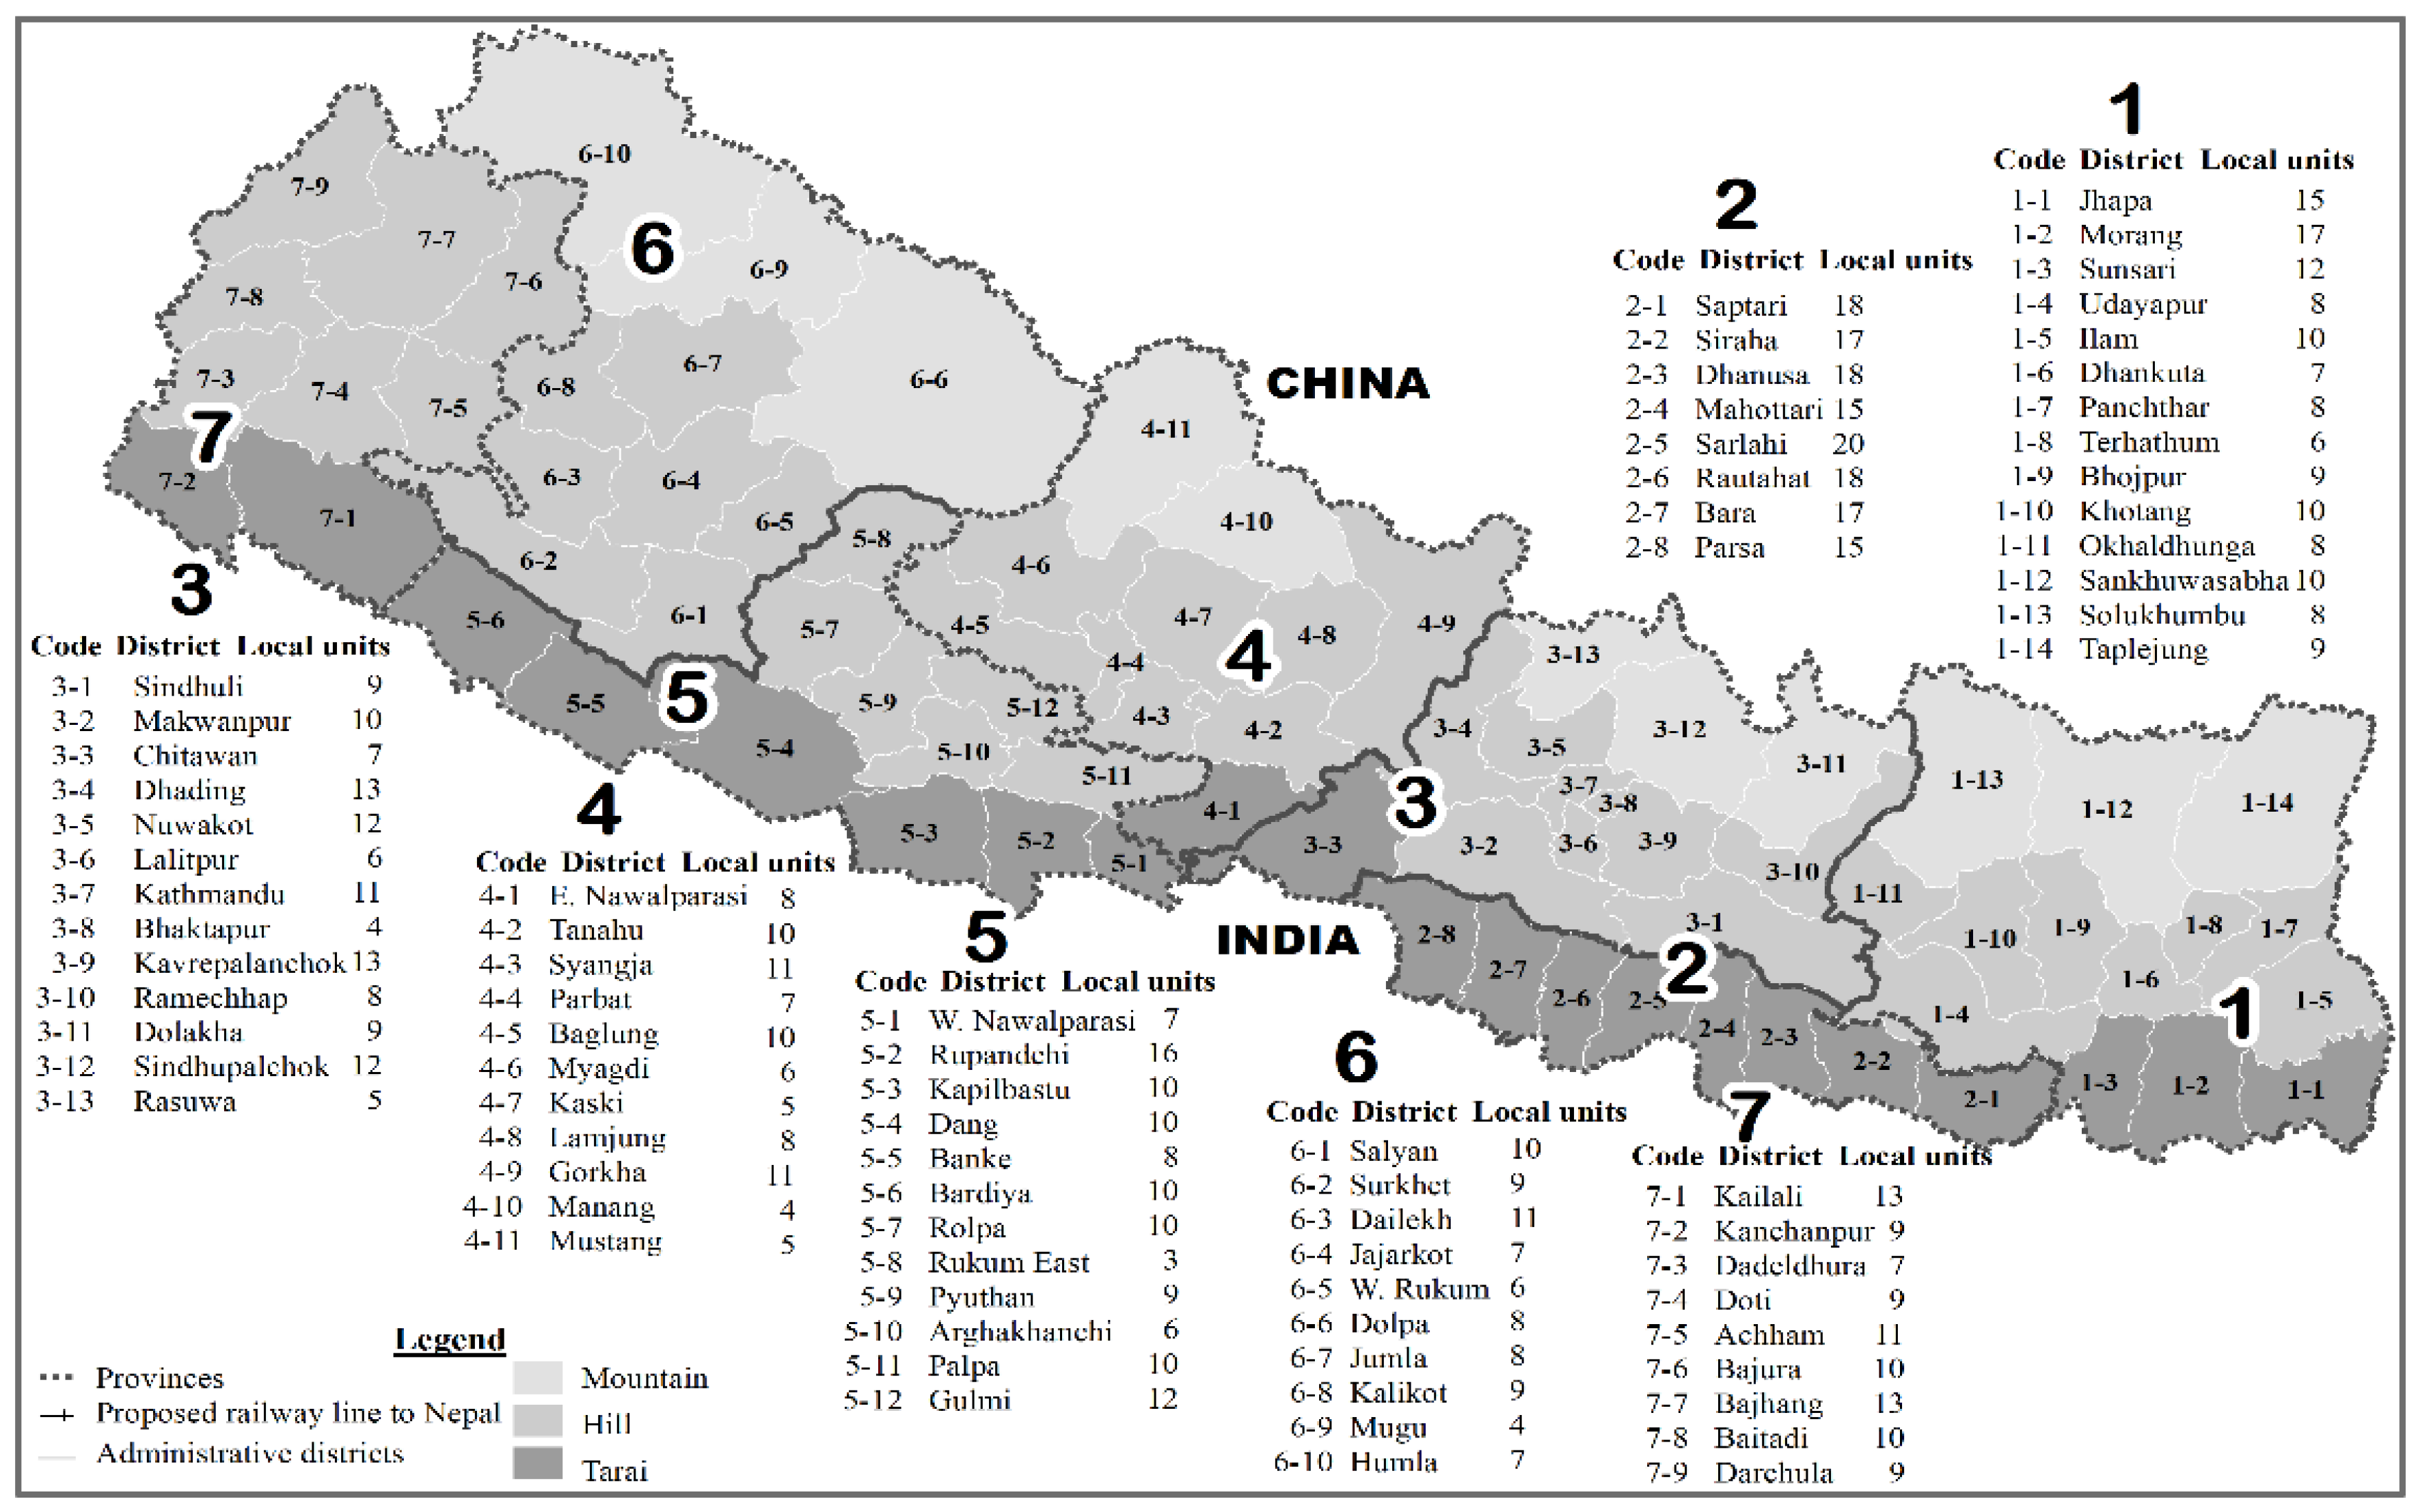
It is high time for Nepal to explore opportunities created by climate change to grow low altitudinal crops at higher elevations. This approach will help to accommodate its citizens within various physiographic regions of 7 provinces, 77 administrative districts (
Figure 7), 753 town/village authorities with 6,743 wards (lowest political units) as per the Constitution of 2015 with sustainable agricultural development practices through the analysis of various landforms. Because of the extreme variations within a short distance, Nepal’s climatic impact on agriculture has to be studied on a large scale (small area with greater detail) by dividing the entire country into 1000 × 1000 square meter grids. Such a division with 148,040 grids helps to capture location-specific edaphic, climatic, and microclimatic information. While dividing Nepal into 1k × 1k square meters grids, location-specific information of Province 1 can be captured with 26,057 grids, Province 2 with 9579 grids, Province 3 with 20,297 grids, Province 4 with 22,075 grids, Province 5 with 18,981 grids, Province 6 with 31,156 grids, and Province 7 with 19,899 grids. This overall analysis can address the impacts of slope, aspect, land cover, soil types, demographic, social, cultural, political, economic, and technological factors on agriculture. Further research is needed to address such issues.
The Post COVID-19 Situation
Despite being an agricultural country, Nepal imports millions of dollars of food grains and fruits; for example, it imported
$300 million of rice,
$60 million of apple,
$20 million of banana,
$40 million of other fruits, and
$130 million of onion and potato in 2019 [
4]. Through proper analysis, improvement is needed in the agricultural sector because its contribution to GDP has been decreasing in successive decades (
Figure 8). Other economic activities such as service and industrial sectors at present may not be able to accommodate Nepal’s growing manpower. As an immediate fix, Nepal needs to explore additional agricultural potential land areas taking into consideration the slope, aspect, land cover, soil types, demographic, social, cultural, political, economic, and technological factors. Nepali youth working in over 59 countries (
Figure 1) are likely to face difficulties in their destinations. Many will return to their natal home. GoN has to revitalize its productive agricultural lands, and look for the possible sites to accommodate them. Nepal has converted 104,000 ha agricultural land into construction sites between 2000 and 2019, and such lands are not re-convertible into farmlands. Nepal needs a good location-specific real-time land capability database to explore potential areas for farming. Without a proper database, additional agricultural land will be converted into constructional sites or constructional activities will be undertaken on unstable land areas. The establishment of infrastructure on current agricultural lands or on unstable land will not be conducive for future generations. Further conversion of agricultural land will create a further scarcity of farmlands, and building infrastructure on unsuitable areas will increase rescuing costs from natural disasters. Annually, Nepal loses almost 2.5% of total GDP in rescuing people from natural calamities [
39]. With minimum government intervention, however, Nepali people will be quick to adopt new technologies starting with new crops to take advantage of the global climate change ([
40]:135). Once the land-use planning starts, Nepal’s 7 provinces will compete to attract population to their provinces to make the agricultural-based economy vibrant with model farming.
Large-scale employment is not possible without industrialization and expanding service sectors. However, at present, agriculture becomes the only viable option for Nepal to provide immediate relief (jobs and food security) to a large number of returning young people and about half million youths who are added each year to the job market. Because of the unprecedented possible global economic recession due to COVID-19, unemployment will rise globally. Developed countries, which were potential donors to Nepal, may not be able to provide financial relief. Even the lending institutions might not be able to provide needed loans at an affordable interest rate to Nepal. Due to the global economic recession, foreign direct investment (FDI) will decrease significantly. That means mid-term plans (establishment of small and medium types of industries and implementing developmental activities to create employment opportunities) and long-term plans (establishment of large industries, construction of high dams to generate hydropower to trade with foreign countries, transforming the country’s higher education system to enhance information economy) are less likely to emerge in Nepal. Despite this adverse situation, the immediate return of millions of youth demands the creation of jobs and survival strategies. Agriculture seems to be the only option for a short-term solution. This might be the case not only for Nepal, but also for many South Asian countries in the current context. Through the exploration of potential agricultural land, immediate survival implores the young workforce to take advantage of opportunities created by the global climate change by involving themselves in agricultural activities—and the government can lend start-up fund to them. Many of the young returnees might have their fallow lands. As the country’s economy improves beyond the survival level, farming may be upgraded to an enterprise-level. Alternatively, leasehold farming will be institutionalized by consolidating many farms. By doing this, every dollar increase in the GDP through agriculture will have a much larger effect on rural employment in helping to alleviate poverty compared to the same dollar amount increase in the industrial sector. This will continue until Nepal moves to middle-income status with secondary, tertiary, quaternary, and quinary jobs. With further improvement in agricultural production, Nepal can think of long-term plans. In the long-term, increased productivity in agriculture might have a multiplier effect between 1.6 and 1.8 for every increase in a dollar, meaning that every dollar income from agriculture will help to generate 60 to 80 cents growth in non-agricultural sectors [
41]. Since 36% of the global population is in Nepal’s northern and southern neighbors, Nepali agricultural products will find sufficient international markets [
4,
21].
Between 15 December 2019 and 15 January 2020, one of the authors did a field trip to Nepal to understand the situation. The observation revealed that Nepali agricultural products—mostly the vegetables and fruits—are sold away at minimum cost in situ, while Indian agri-products are sold all over the Nepali market. This has happened because transportation costs for Nepali agri-products from the hinterlands to urban areas have become very expensive while carrying them in a traditional manner (transportation using mostly labor). However, agricultural products from India are ferried by trucks in large volumes, so they have become less expensive in the market because of the mass trade. Moreover, complaints in the Nepali markets persist that the imported agri-products from India contains a lot of pesticides and fungicides. The Government of Nepal is planning to implement severe quarantine measures at the border areas and provide subsidies to the Nepali farmers to promote organic farming that protects the health of its people and guarantees markets for homegrown agricultural products. During the month-long field visit of Nepal (15 December 2019 to 15 January 2020), COVID-19 had just started in Wuhan, China, and even the World Health Organization (WHO) had not warned about the possible global disasters from COVID-19. There was no means for us to know about the outbreak of the COVID-19 pandemic. It was merely a coincidence that we held discussions with agricultural entrepreneurs, agriculture and foreign ministry authorities of Nepal, and personnel of the Nepal Chamber of Commerce to explore the possibilities of model farming in Nepal. We discussed several models for the involvement of agricultural research institutions with farming communities to take advantage of global climate change. The outcomes of the discussion assured us that the Government of Nepal is committed to protecting its agricultural market through subsidies to farming communities and guarantees that the market for Nepali agricultural products would persist due to the establishment of proper quarantine at border points. With proper inspections of agricultural products at the border points and restrictions on pesticide-containing farm products, homegrown farm products will become relatively cheaper and much safer to consume than imported ones. Additionally, Nepal can have organic products in the market, and it may even help to promote the tourism industry through homestay practices while offering food to tourists from organic agri-products. Such a plan will help solve the dilemma of Nepal—first, by boosting agriculture and, second, by industrial activities that follow due to the multiplier effects from the increased agricultural production.
4. Ecodemographic Interactions with Various Landforms and Food Security
Various theories describe the relationship between the population and the environment. Starting from the two-centuries-old Malthusian to neo-Malthusian theories, these have discussed how Earth’s resources will be outstripped leading to ecological catastrophe if the population continues to grow exponentially in a geometric proportion against the agricultural production in an arithmetic proportion. Social scientists have rejected the possibilities of ecological catastrophes arguing that humans can survive beyond the earth’s carrying capacity by creating new resources. Ehrlich and Holdren [
47] explained the human-environmental relationships using the I = PAT equation where I refers to human impact on the environment as a factor of population (P), affluent (A), and technology (T). However, their theories do not address interactions between cultures and institutions and their impacts. The Boserupian theory [
11,
12,
13], assuming technology as an endogenous factor, argues that agricultural production increases with population growth because an increasing labor force helps in land intensification including terracing on undulated terrain using new technology [
48]. Political ecologists see environmental problems resulting from an income imbalance between the rich and poor, large vs. small landowners [
49]. The neo-Malthusians assume population growth as the major environmental problem, cornucopianism assumes market failures as the primary problem, and political ecologists assume inequalities as the main problem to sustainable land management. The vicious circle model (VCM) explains the relationships among population growth, resource depletion, and rising poverty. It argues that before the advancement of medical technology, the population grew rapidly because, in a traditional society, children are considered as old-age security. However, the increasing population has led to the development of the “tragedy of the commons” [
50] because of the overuse of resources by a powerful few. Jolly [
51] proposes a mediating theory to address the gap between rich and poor and Chi [
52] proposes a holistic theory to explain human-environmental relationships. McNicoll [
53] and Keyfitz [
54] argue that land use and the environment are mediated by social organization, technology, culture, resource consumption, and values.
It is hard to predict what the aggregate impacts of the population will be on the global environment when the world’s population reaches 9 to 10 billion, and such a population follows the consumptive patterns of the global north, and the economies of China and India continue booming except for the COVID-19 period. The linkages between population growth and the environment are complex and difficult to disentangle with a high physiological population density of 7156 people/per sq. km. in Nepal. This physiological population density is higher than 4124 people/sq. km in India, 4836 people/sq. km in Pakistan, 6405 people/sq. km in Bhutan, but it is still lower than 9031 people/sq. km in Bangladesh and 14,356 people/sq. km in Sri Lanka [
45]. Nepal’s average agricultural production 2.82 tons/ha is barely higher than that of Afghanistan with 2.16 tons/ha per hectare. It is lower than 6.08 tons/ha in China, 4.79 tons/ha in Bangladesh, 3.76 tons/ha in Sri Lanka, 3.47 tons/ha in Bhutan, 3.25 tons/ha in India, 3.12 tons/ha in Pakistan [
55]. The 29 million people requiring an average of 2200 calories each day need food grain. Assuming an average of 2.9 tones of grain production per hectare (FAO 2020), the following scenarios emerge. Following the standard practices, the Nepali population can be classified as active (10–45 years), moderately active (46–70 years), sedentary (>70 years). Food consumption patterns vary based on age because sedentary people consume less while active people consume more.
Scenario 1: Consumption of 0.53 kg/day or 191 kg of grain year−1 per person (rice—122 kg; maize 41 kg; wheat 17 kg; millet 9 kg; and others 2 kg) and generation of 4370 calories day−1. Under this scenario, it is assumed that each person consumes food like an active adult, and the person works either like an athlete or does arduous work. Under this scenario, Nepal needs 21,058.45 sq. km of land under agriculture.
Scenario 2: Consumption of 0.3 kg of cereal grain day−1 or 100.75 kg year−1 and generate 2800 calories energy day−1. Under this assumption, Nepal needs 11,108.05 sq. km. of agricultural land. Within this scenario, it is assumed that not all the people are involved in arduous work and supplement their diets consuming meat and fruits.
Scenario 3: Consumption of 0.18 kg of cereal grain day−1 or 65.7 kg year−1 to generate 1800–2000 calories day−1. Under this scenario, Nepal needs 7243.67 sq. km of agricultural land. This scenario assumes that a person does not involve in arduous, but consumes meat and fruits to supplement daily nutrition.
Scenario 4: Consumption of 150 g or 0.15 kg day−1 or 54.75 kg year−1 to generate 1400–1800 calories of energy day−1. Under this scenario, Nepal needs 6036.39 sq. km of agricultural land. Within this category, a person does very light work, but takes supplement dietary needs from meat and fruit in addition to food grain.
Scenario 5: Consumption of 0.12 kg of food day−1 or 43.80 kg year−1 to generate 1200–1400 calories of energy day−1. Under this scenario, Nepal needs 4749.73 sq. km of agricultural land. A person involves in light work and supplements dietary needs from food grains, meat, and fruit.
Scenario 6: Consumption of 0.09 kg of cereal grains day−1 or 32.85 kg year−1 to generate 1000–1200 calories of energy day−1. Under this scenario, Nepal needs 3621.83 sq. km of agricultural land. This is a food-scarce scenario where people will consume minimum food to survive that includes food grains, meat, and fruit.
Scenario 7: If many people turned into vegetarians, the amount of food grain consumption increases to about 365 kg year
−1 person
−1 [
56,
57]. Under this scenario, Nepal would need 40,242.56 sq. km of agricultural lands.
Nepal has a shortage of tertiary, quaternary, and quinary economic activities. Although about 2.5% of the total population is under sedentary conditions that would need a minimum amount of food and, on average, the Nepali population would need land areas as projected under scenarios 1 and 2 because most of them had to work arduously.
5. Current Land-Use Conditions Based on Slope Classes
Currently, Nepal has 42,100 sq. km area of agricultural lands [
45] spread in Mountain, Hills, and Tarai regions. Theoretically, this land area of 42,100 sq. km area can sustain Nepal’s population from food production under scenario 7 (above) even if the majority of the Nepali people start consuming vegetarian food and a person consumes 365 kg./year. However, not all the 42,100 sq. km area is purely under agriculture. It also includes land under permanent pastures. In reality, no more than 23,600 sq. km. arable land, with a per capita of 0.0867 hectares, is available in Nepal for farming. Many arable lands are plotted for housing purposes. Because of the uncontrolled use of arable land for constructional purposes, pressure on arable land is very high. Of the existing arable land of Nepal, since 1990, Nepal has converted over 1150 sq. km arable land areas located within 0–4.99° slope for various constructional purposes. Additionally, 23,600 sq. km land also includes areas under temporary crops, temporary meadows/pasture, kitchen gardens, and temporarily fallow. Of the remaining arable lands, some are difficult to use because of land degradation in high slope areas. Nepal needs a detailed land-use plan while taking into account the slope factor.
A proper inventory of suitable arable land would help in long-term planning if remitters working in various countries (
Figure 1) return to Nepal. When the majority of the remitters returns to Nepal, it needs additional suitable arable areas that are below the slope of 15° (
Table 1). Also, Nepal needs to explore opportunities to grow low-elevation crops at higher elevation taking advantage of global climate change (
Figure 4). Nepal has 35.55% (51,859 sq. km) within 0–4.99° slope, 32.95% (48,748 sq, km) within 5–9.99° slope, and 18.56% (27,456 sq. km) land area within 10–14.99° slope. The rest of the land area (19,118 sq. km) is above 15° slope (
Table 1).
Slope classifications:
A: 0–5°: This category includes depression level to horizontal, very flat, flat, moderate, gently sloping to gently undulating to undulating.
B: 5–10°: Moderately sloping, gently rolling
C: 10–15°: Moderately to strongly sloping
D: 15–20°: Strongly sloping
E: 20–25°: Strongly sloping to steeply sloping
F: 25–30°: Moderately hilly
G: 30–35°: Moderately hilly to hilly
H: 35–40°: Hilly to very hilly
I: 40 and above: Extremely sloping.
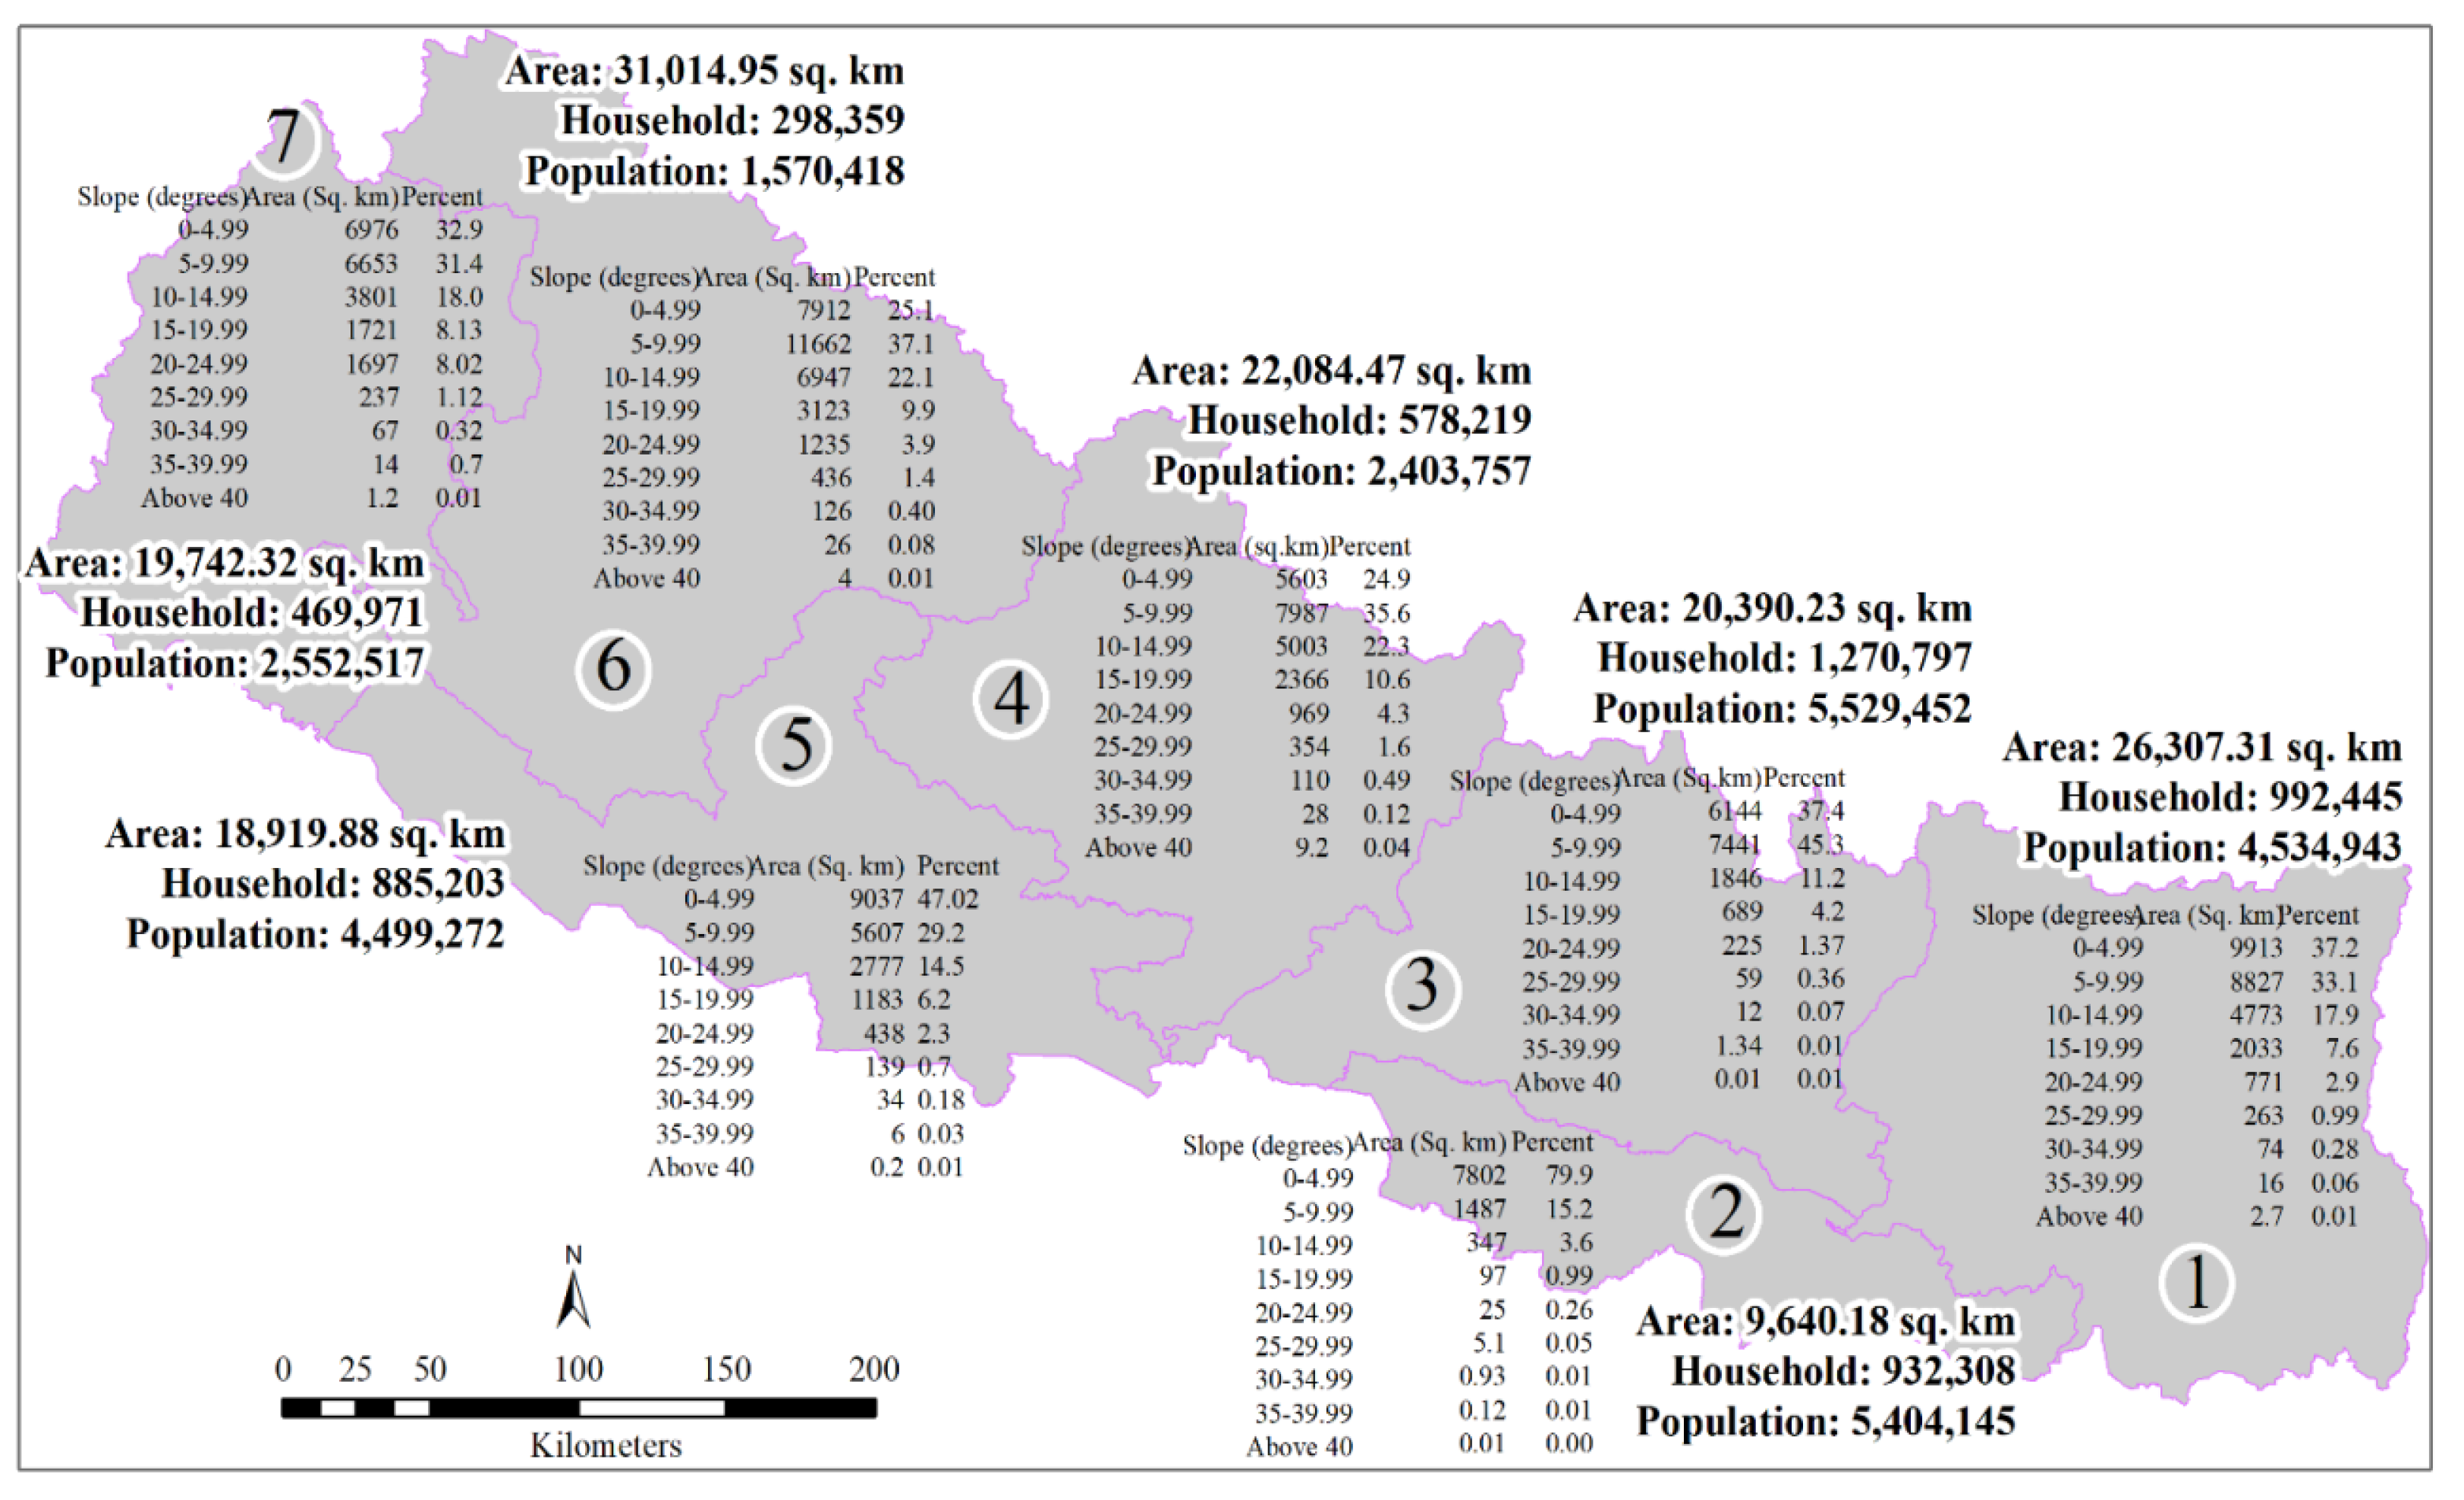
Land areas under various slope classes vary in different provinces with Province 2 having the maximum area under 0–4.99° slope classes. Province 5 follows this suite (
Figure 9).
Figure 9 presents the total area, total households, and total population along with the land areas and percentages under nine slope classes. It also reveals that although Province 6 contains maximum areas under hills and mountains, it has the maximum areas under 0–9.99° slope (19,574 sq. km), but has the lowest number of households (298,359) and population (1,570,418). Over 78% of the total land area in Province 2 is within 0–9.99° slope and its size is amallest (9640 sq. km) among all provinces. Nonetheless, Province 2 serves as the breadbasket of Nepal. Land areas between 10 and 14.99° slope, is maximum within Province 6 (6947 sq. km) followed by Province 4 (5003 sq. km), Province 1 (4773 sq. km), Province 7 (3801 sq. km), Province 5 (2773 sq. km), Province 3 (1846 sq. km), and Province 2 (347 sq. km). Areas above 15° slope are maximum in Province 6 with 4950 sq. km, followed by Province 4 (3836.2 sq. km), Province 7 (3737.2 sq. km), Province 1 (3159.7 sq. km), Province 5 (1800.2 sq. km), Province 3 (986.35 sq. km), and Province 2 (128.6 sq. km).
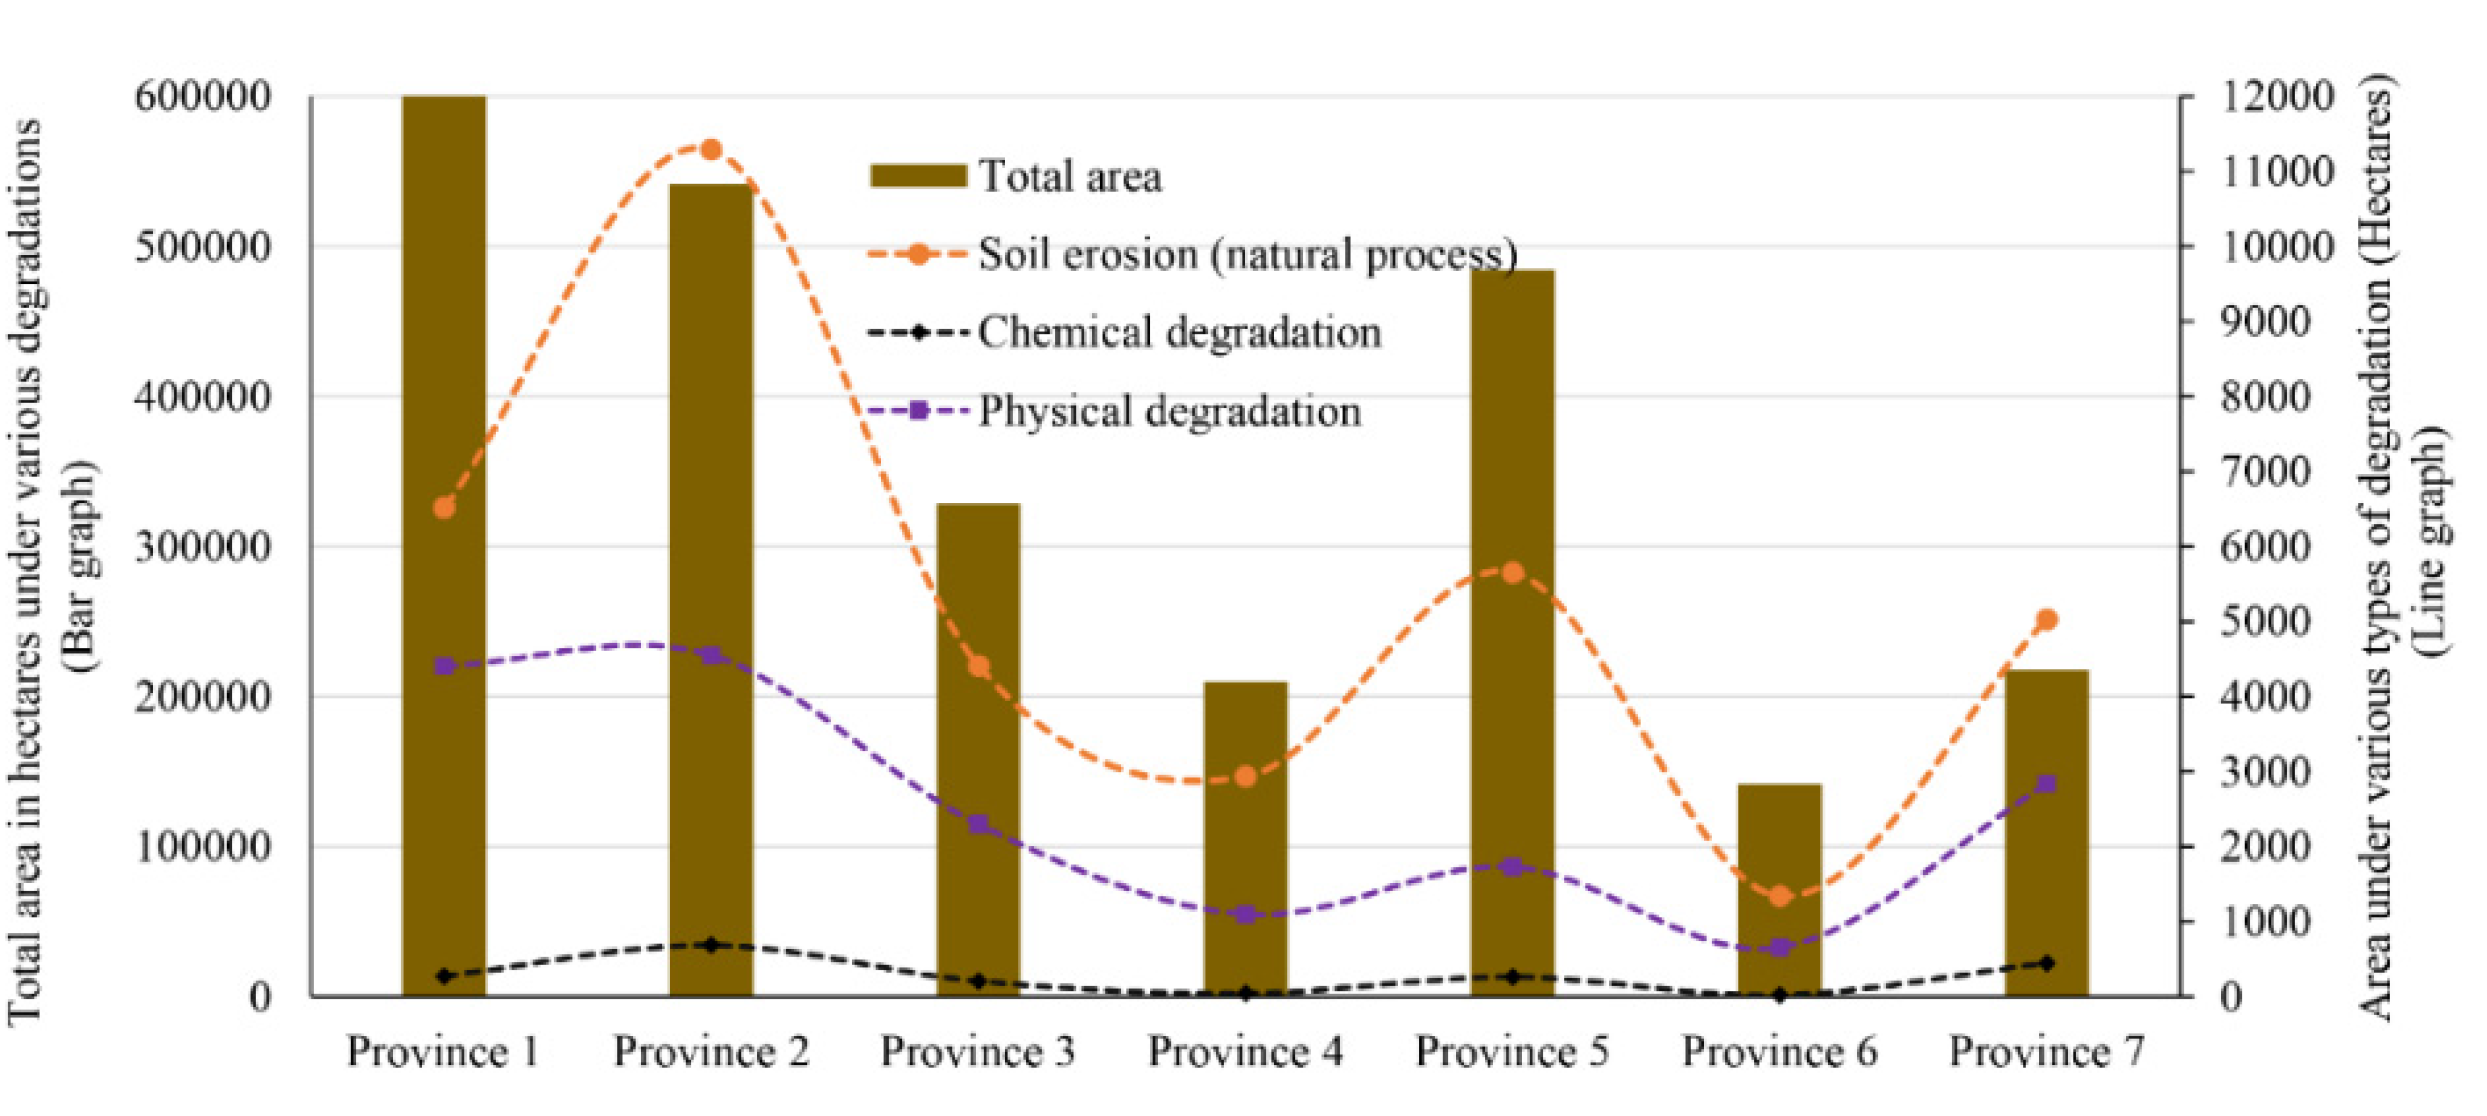
Irrespective of the slope classes, land degradation varies by various provinces. For example, despite having the maximum percentage of flat areas within province 2, soil erosion due to natural process is high in this province. Provinces 1, 5, and 7 follow this. This is because water drained from the upper watersheds accumulates in the plain areas in provinces 1, 2, 5, and 7. When water overflows from the river courses, natural erosion accelerates from non-forested areas in these provinces. Likewise, physical and chemical degradations also are higher in these provinces (
Figure 10).
The distribution of arable areas is not uniform across provinces (
Table 2), and their areas under various crops vary (
Table 3 and
Table 4) across provinces.
Arable areas presented in
Table 3a,b are not enough to sustain the population of each province. It is assumed that Nepal’s average annual food production is 2,796 kg/hectare for cereal crops [
46]. Assuming that physically active working-age Nepalis on average consume 365 kg/year, if many prefer vegetarian food the current production is not enough to sustain the existing population. Under these assumptions, only Province 1 (with an average per capita food availability of 458.68 kg.), Province 2 (with an average per capita food availability of 420.91 kg.), and Province 5 (with an average per capita food availability of 391.43 kg.) have sufficient per capita food availability to sustain the current population (
Figure 9,
Table 3a,b). Province 3 has a shortage of 126.95 kg of food per person every year. Likewise, Province 4 has a shortage of 63.51 kg of food per person, province 6 has a shortage of 38.58 kg of food per person, and Province 7 has 15.35 kg of food shortage per person each year. Since the 2796 annual production/ha is taken as average, some areas have much lower production/ha because land is fragmented (
Table 4), and poorly managed arable lands are less productive in various provinces. Based on the actual production, the national agricultural census 2011 has enumerated the status of each household and their efforts to sustain their living from various means (
Table 4) for each province.
Information presented in
Table 5 reveals that even the provinces 1, 2, and 5 also have insufficiencies in several areas despite the potential for sufficient food production assuming 2,796 kg production of cereal crops per hectare. Provinces 3, 4, 6, and 7 have food shortages to sustain the current population (
Figure 9). People from different provinces are sustaining their living from various sources (
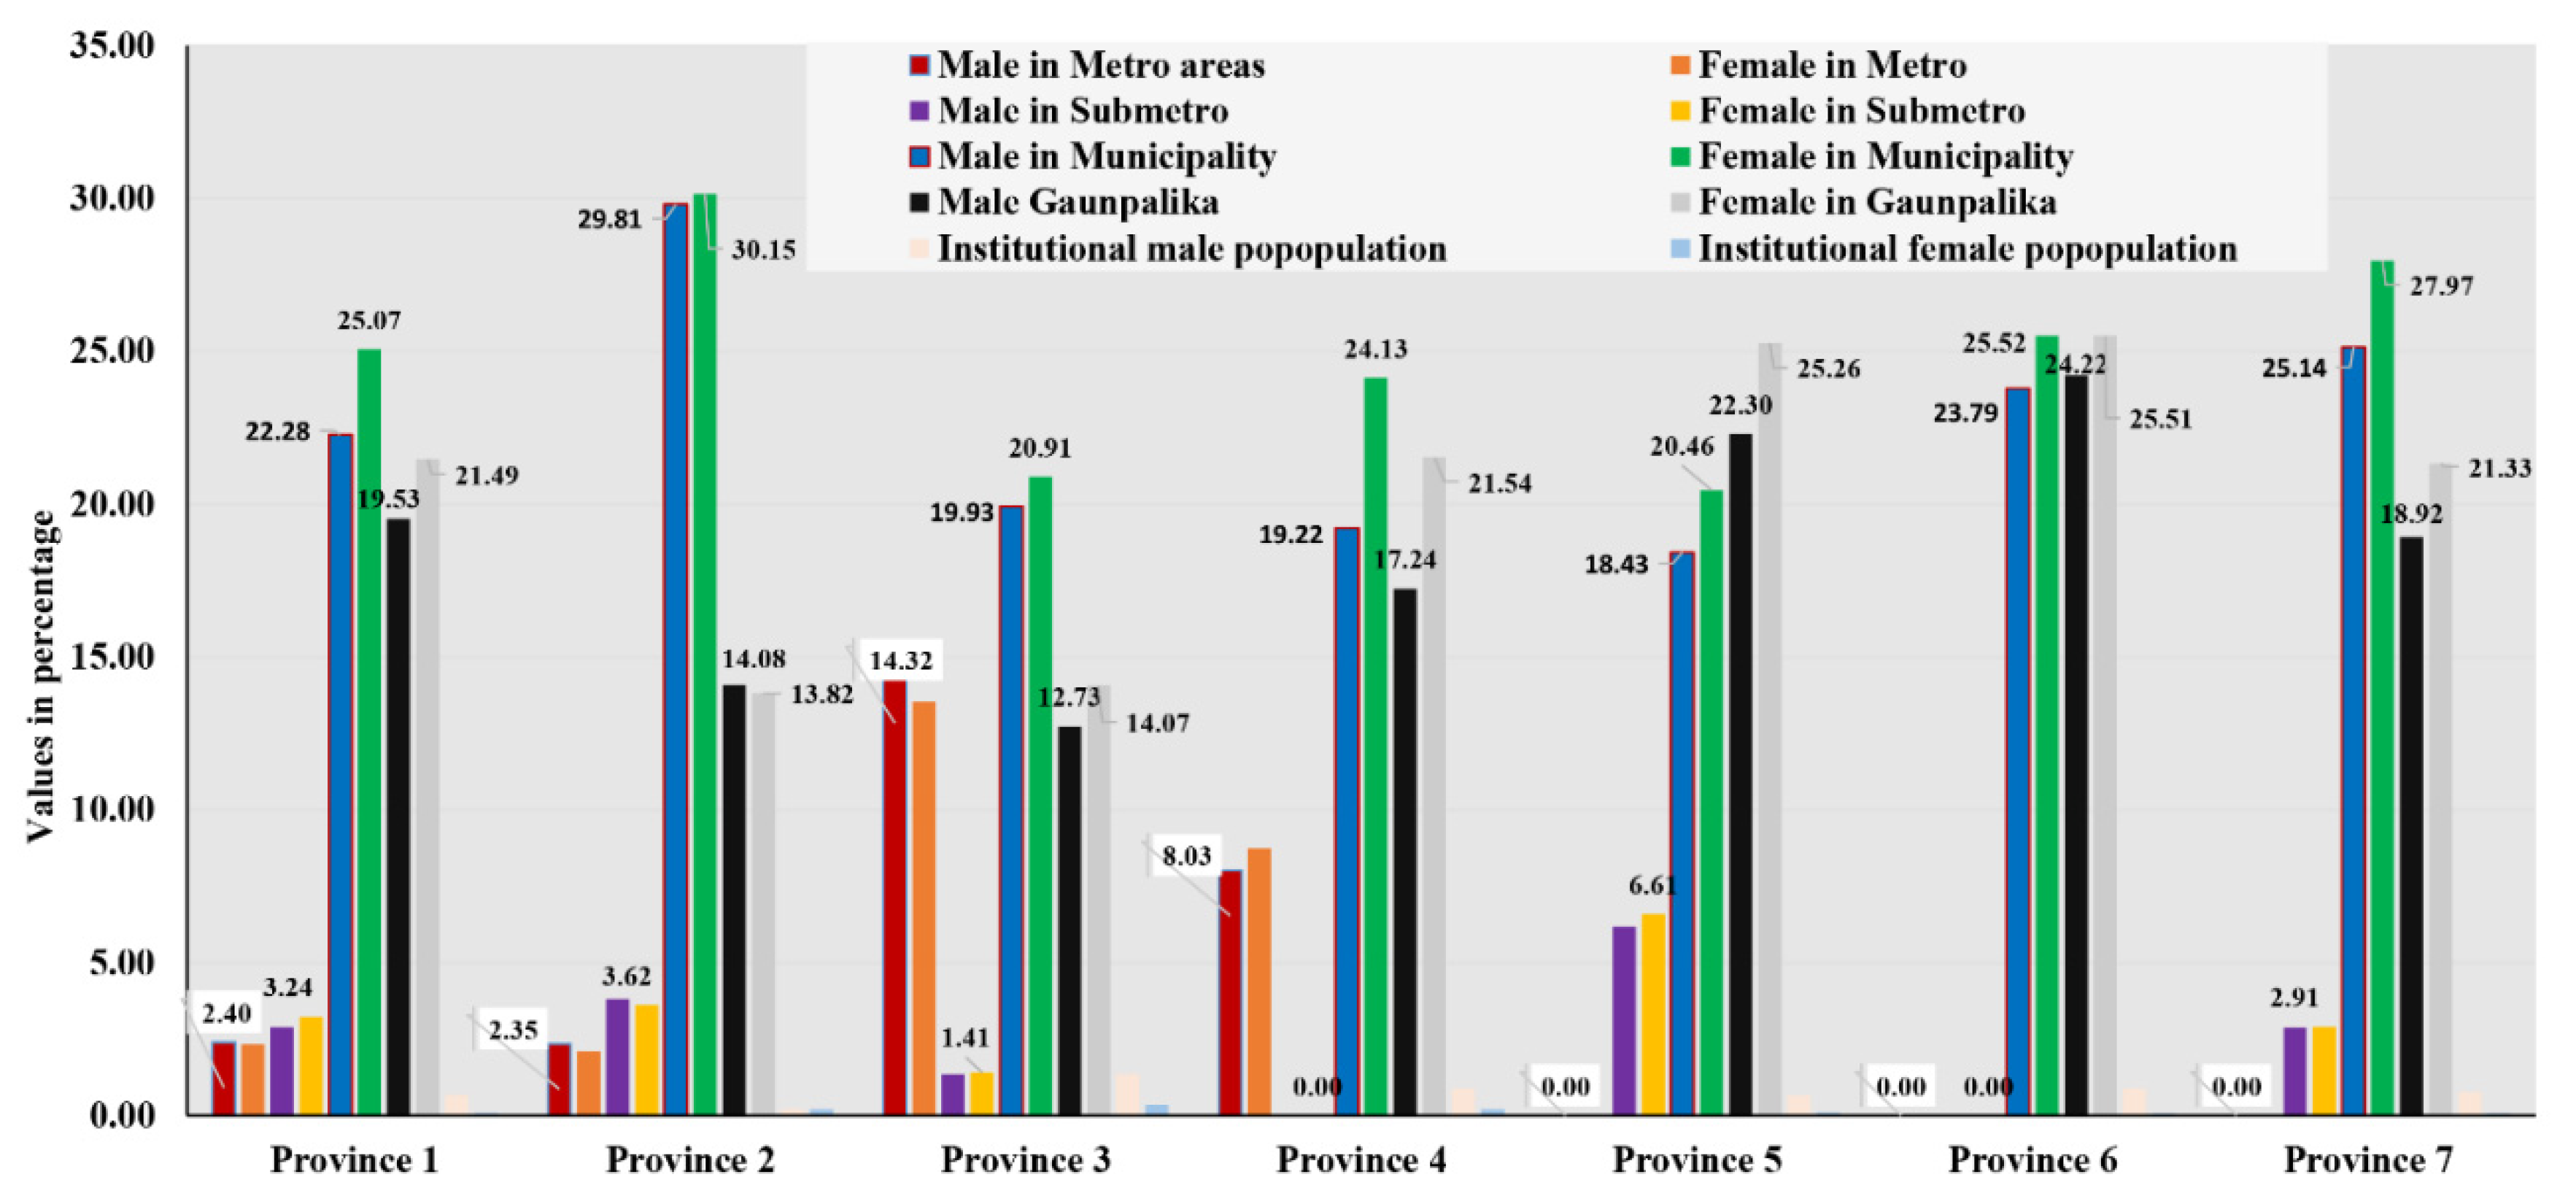
Table 5). Those unable to meet their needs at their natal places, migrate to urban centers (
Figure 11), and even to foreign countries (
Figure 1).
6. Need for Sustainable Solution
The above analyses suggest that Nepal needs to explore sustainable solutions within the country to accommodate all the Nepali, especially if remitters return to their natal homes due to difficult situations in the countries of their current destination. Despite being an agricultural country, in 2019 alone Nepal imported
$150 million worth of rice,
$60 million worth of apple,
$20 million worth of banana,
$40 million worth of other fruits, and
$130 million worth of onion, potato, and garlic [
4]. Increasing food production not only will help Nepal to lessen food imports from various countries but also export its agri-products, especially, to neighboring countries—China in the north and India in the south, where 36% of the global human capital resides. In this context, although the COVID-19 pandemic has challenged Nepal today, it might be a blessing in disguise to get back its working human capital (
Figure 1) and engage such human resources to enhance agricultural production by utilizing potential agricultural lands and decrease international trade deficits.
The availability of potential agricultural lands in various provinces varies greatly and so do the topography, climate, hydrology, and population. Of the seven provinces, six provinces include plain, hill, and mountain regions, but Province 2 includes only the tropical Tarai plain area. Province 6 covers mostly the mountainous areas. Within these varied geographic regions, rainfall, temperature, climate, and soil types differ from locations to locations, but we are looking at the potential agricultural sites only based on the slope classes, mostly the areas below 15° slope. We used the Kibana platform within the AWS to analyze land use and cover by nine-elevation classes.
6.1. Land-Use and -Cover Classes within Nine Slope Classes
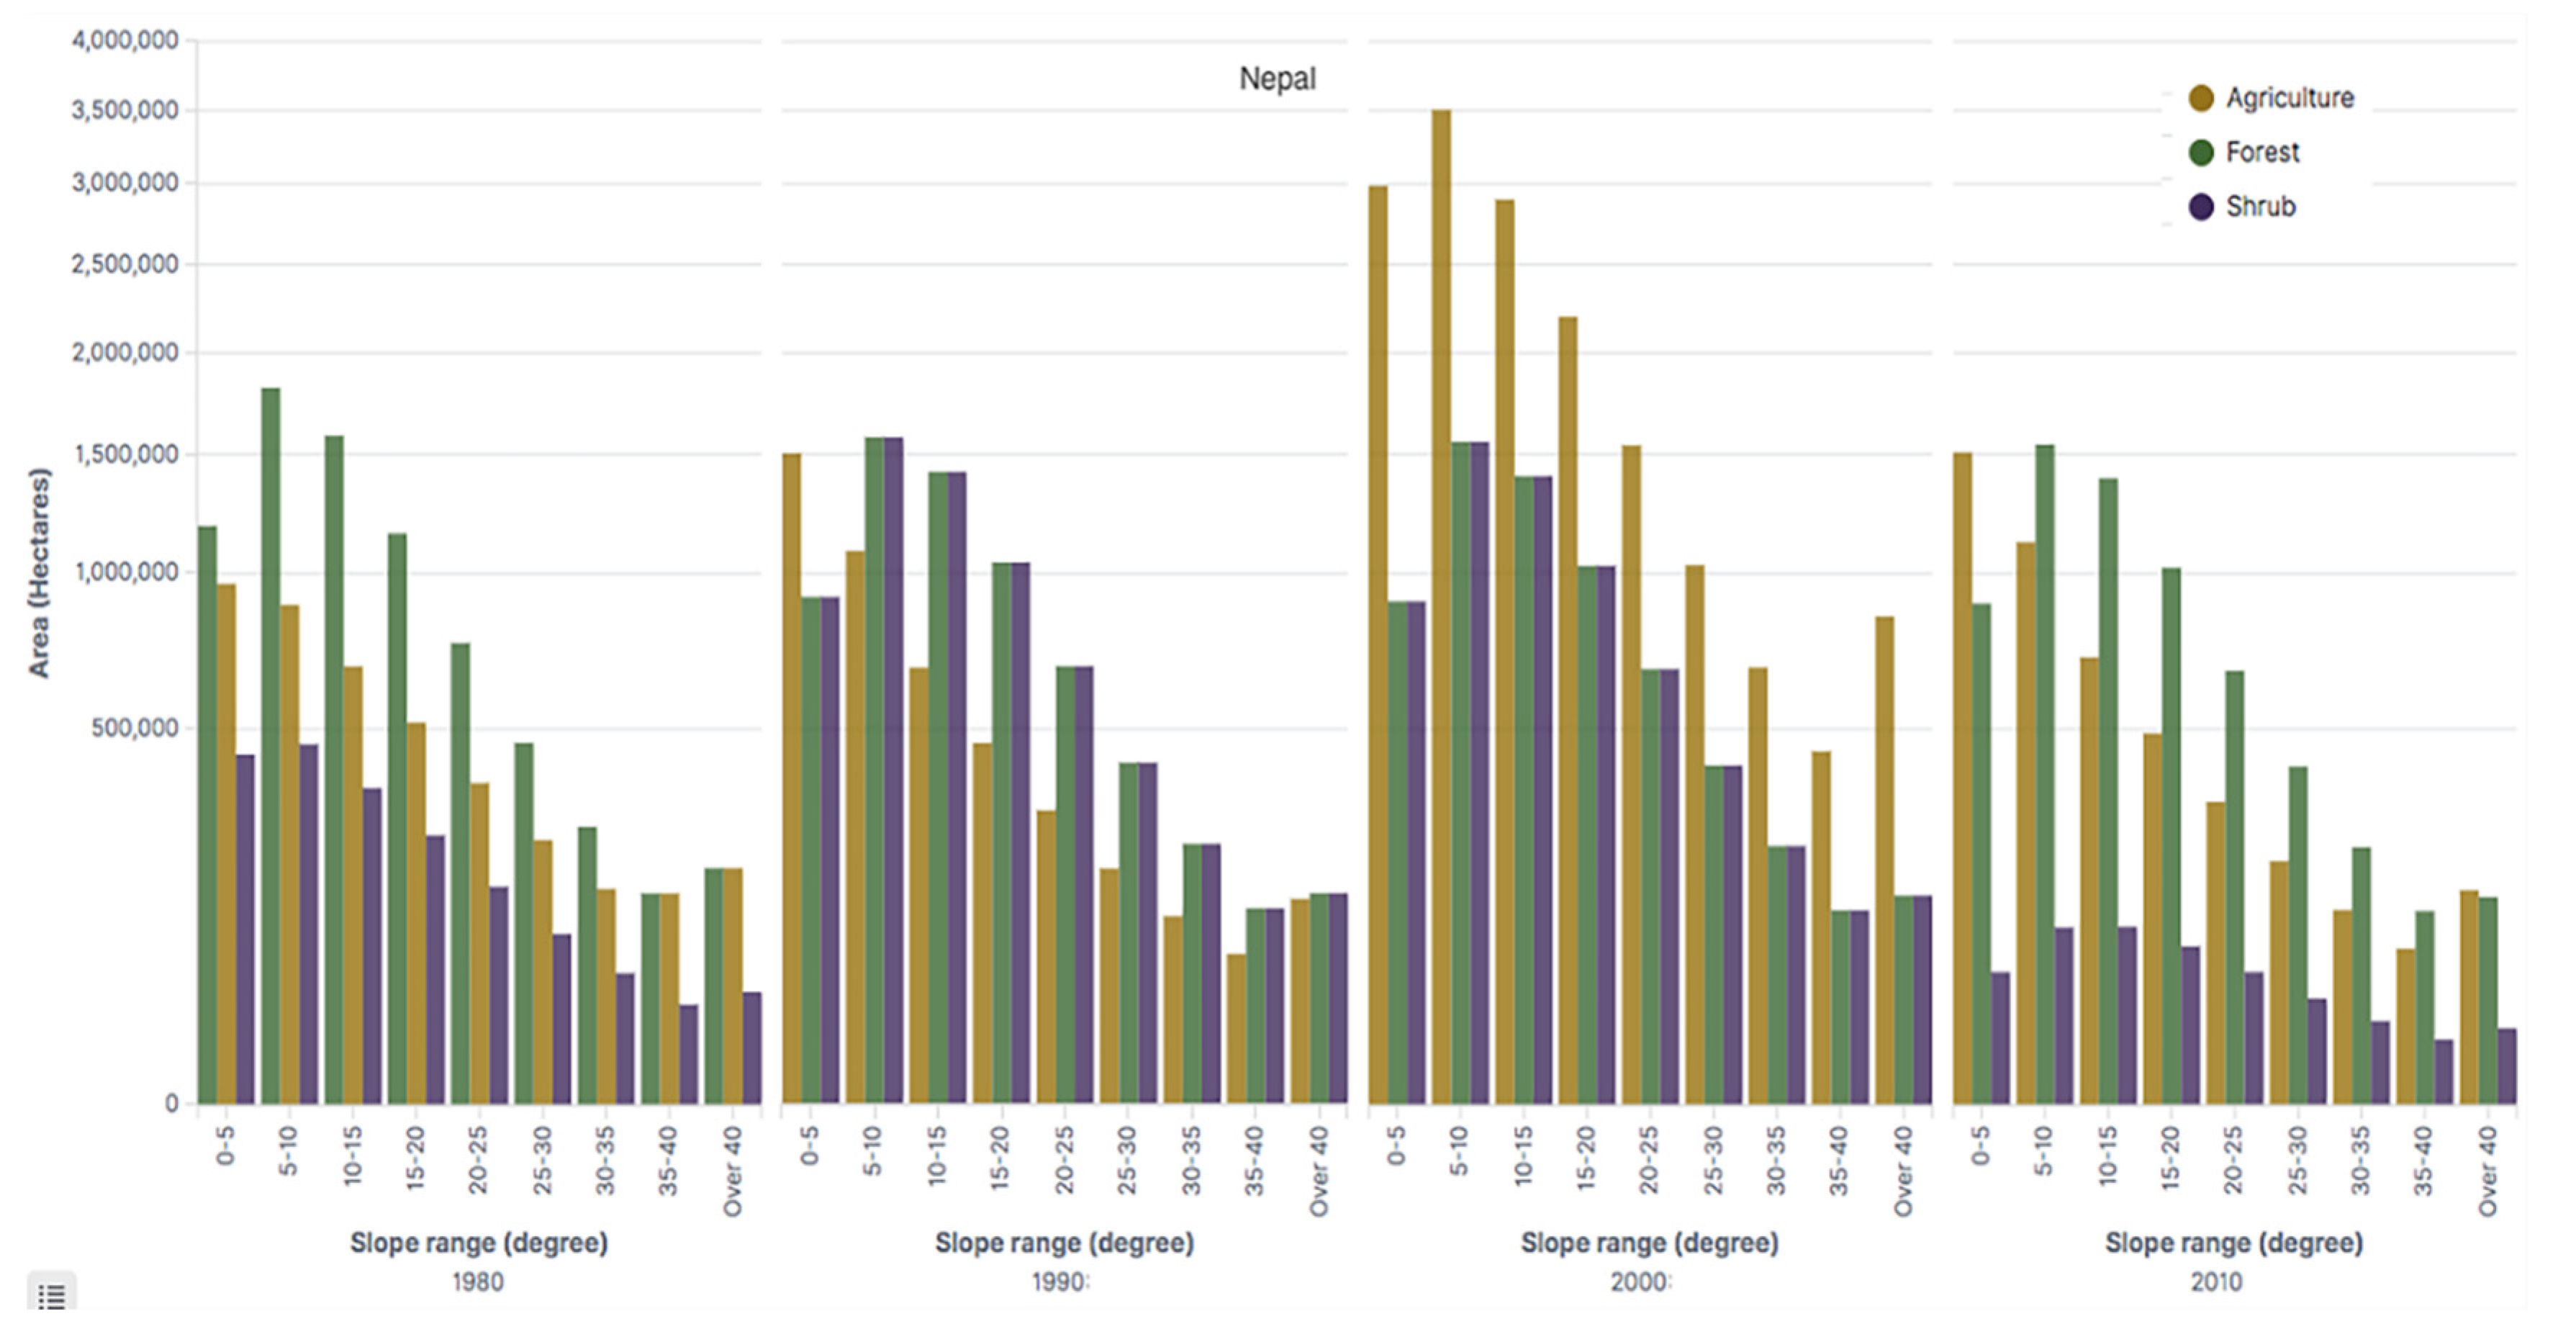
An analysis of the land-use and -cover areas integrated with the nine slope ranges for 1980 to 2010 reveals that there has been a decrease in forested areas in less slope ranges than at higher slope ranges, but the agricultural areas are just the opposite except for the 2000 and 2010 periods (
Table 3). A decrease in agricultural areas during the 2000 and 2010 period is due to the countrywide Maoist insurgency. During the insurgency period (1996–2006), many youth took shelter in urban areas fearing Maoist tyranny in rural areas. As a result, many farmlands were left fallow. Between 1980 and 2010, many shrubs decreased at low slope areas, but increased at the higher slope areas (
Figure 12;
Table 6) because many shrublands were converted into settlements and for the development of various infrastructures.
The low slope areas have a strong potential for sustainable land development because these land areas are less prone to geological disasters and ecological risks. Developmental activities in high slope areas become very expensive compared to low slope areas. Over 78% of the land area in Province 2 being almost flat, there is a potential for development at a lower cost compared to other provinces. Taking this advantage many farmlands are converted for infrastructural development. In other provinces too, there are fierce competitions for the conversion of low slope areas into infrastructural development and settlement. On the low slope areas, many farmlands are used for urban and housing developments. Such a rudderless plan without any thoughts for the long-term future land use planning has necessitated for a stringent land classification system with detailed mapping to alleviate the shortage of farmlands to accommodate the growing Nepali youth.
A review of the literature reveals that sustainable land management is achievable only if land capability classes are strictly followed. Land areas below 15° slope can be used for farming, infrastructure development, urbanization, and areas with greater than 15° slope are allocated for nature conservation and recreational purposes. There is stiff competition for different types of land use in low slope areas in the Mahabharat, Siwaliks, Bhabar and Tarai regions. Nepal needs to utilize the opportunities offered by climate change (
Figure 4) and explore possibilities to utilize new areas that are below a 15° slope situated close to the water bodies for farming purposes. Using appropriate technology, even less suitable areas can be brought under farming and settlements through the analysis of both biophysical and socioeconomic information and by strictly following the Food and Agriculture Organization’s (FAO) land suitability guidelines in each of the seven provinces.
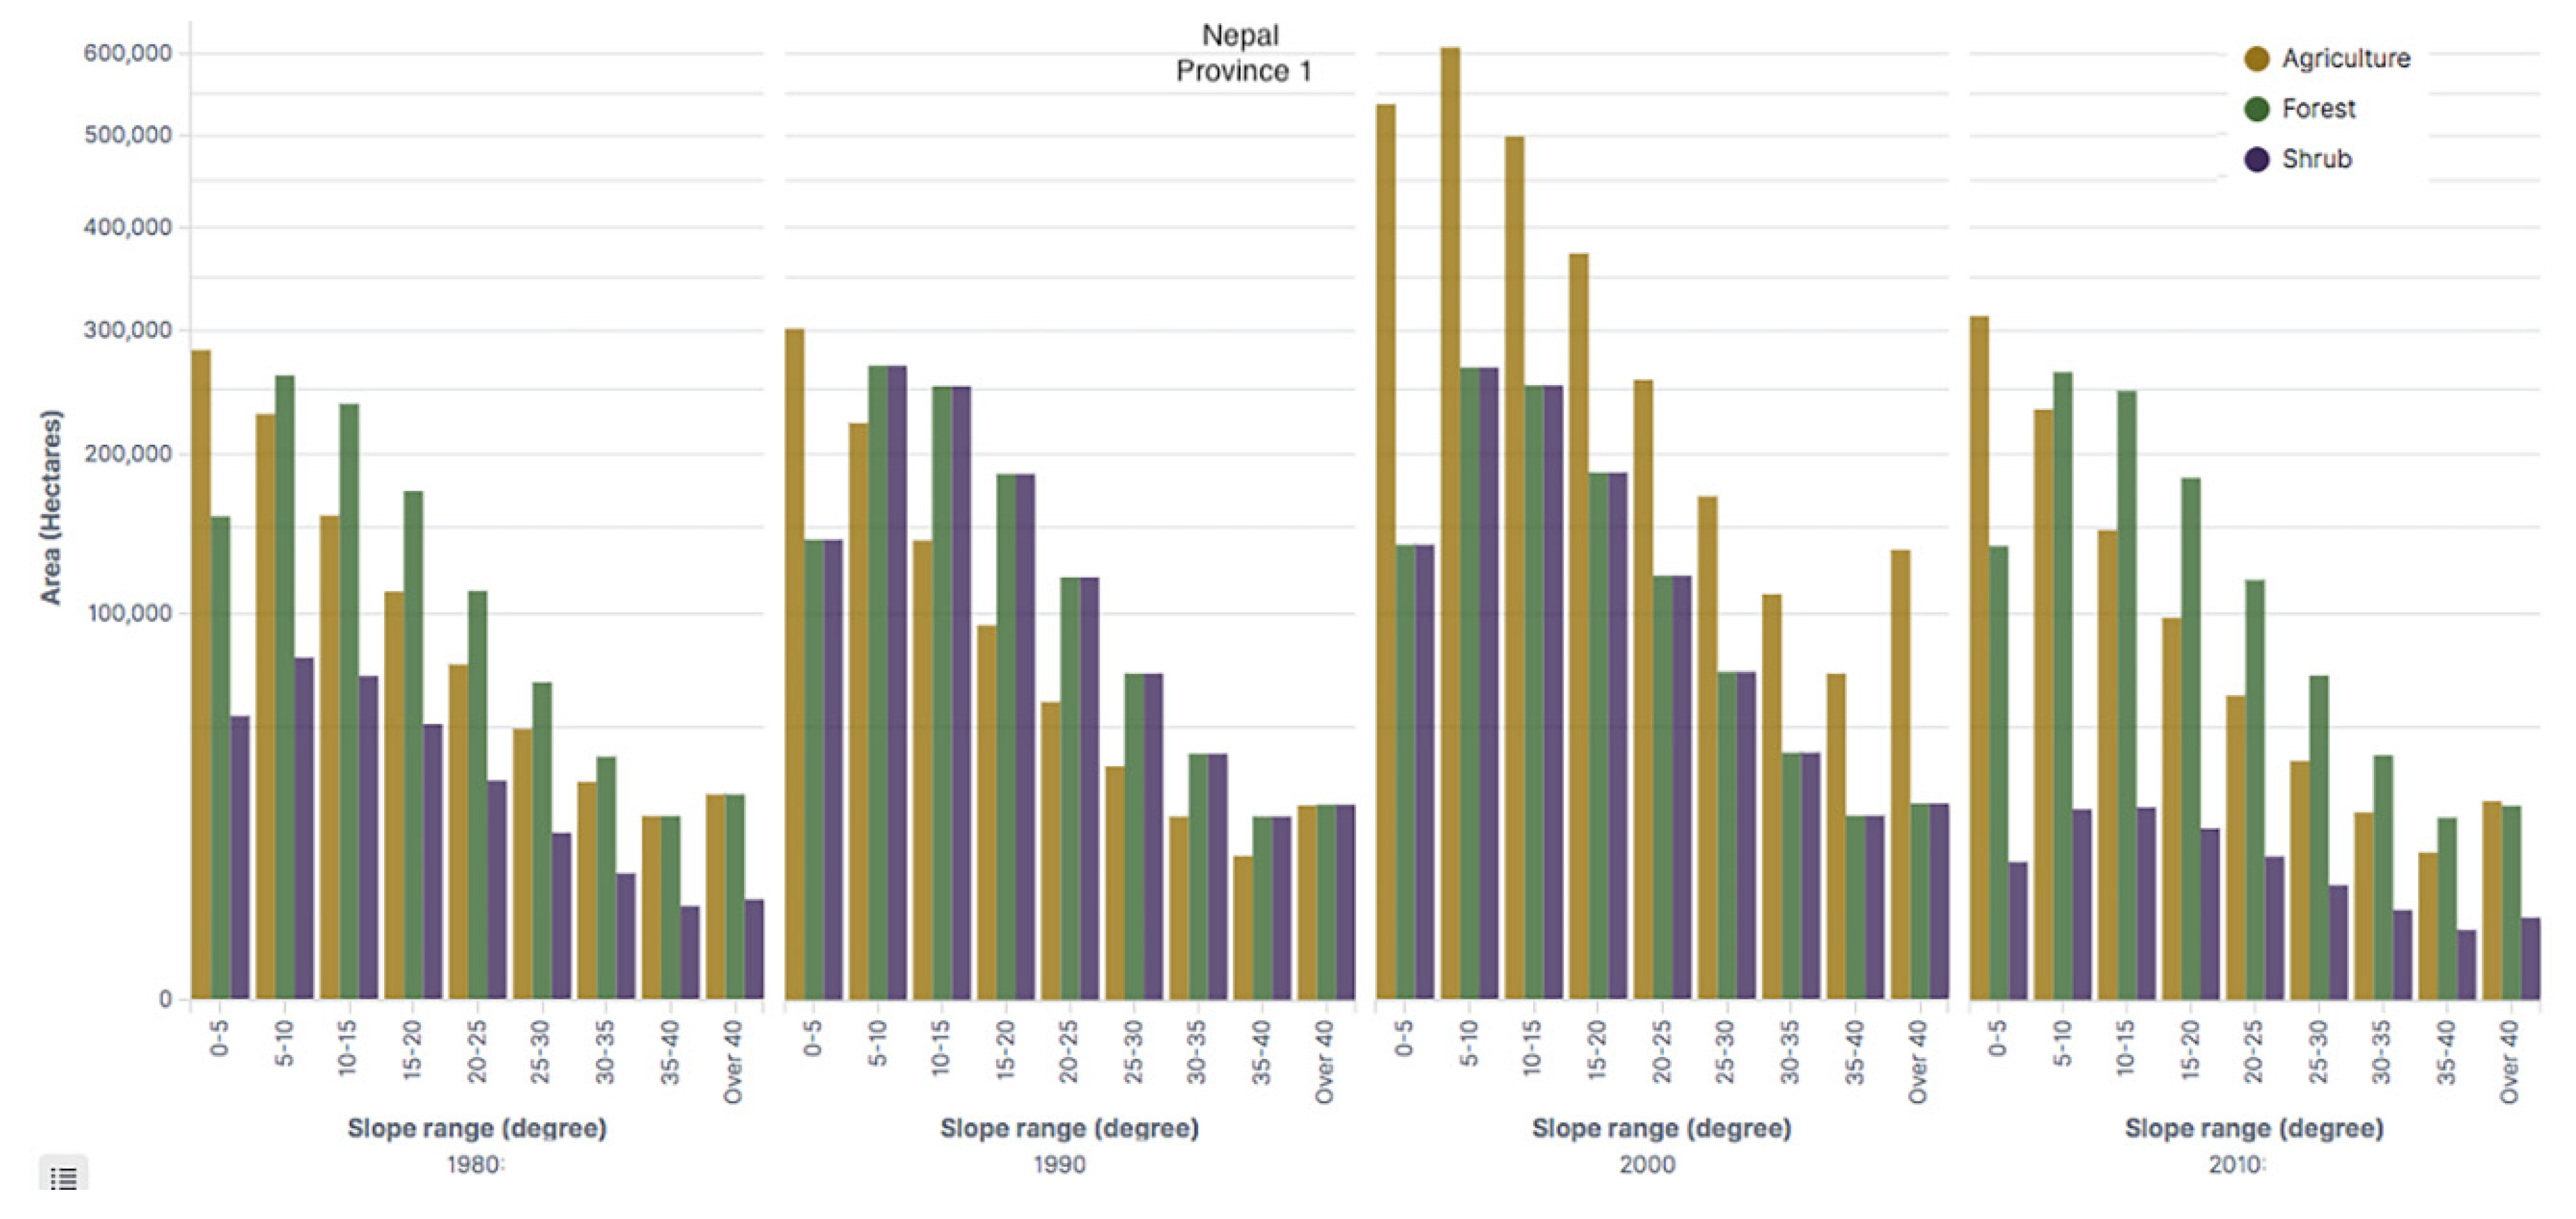
6.1.1. Province 1
Currently, Province 1 is food sufficient based on the average agricultural production of 2796 kg/ha for the current population (
Figure 9). However, 57.01% of households have some type of insufficiency (
Table 5). Of these households 9.03% are meeting their needs from their agricultural lands, 60.03% are meeting from wage earnings within the district, 5% are meeting from wage earnings outside the district, 13% from remittances, 2% from a pension, 9% from borrowing, and 1.23% from various resources. Looking at the land-use and -cover situations, there has been an increase in farming areas from 1980 to 2000, but a drastic decrease occurred in farming activities from 2000 to 2010 (
Figure 13;
Table 7). It is because, during the Maoist insurgency (1996–2006), many youth flocked to the urban areas (
Figure 11). The urban crowd could not find jobs within Nepal, thus, many emigrated to different countries (
Figure 1) for remittance purposes.
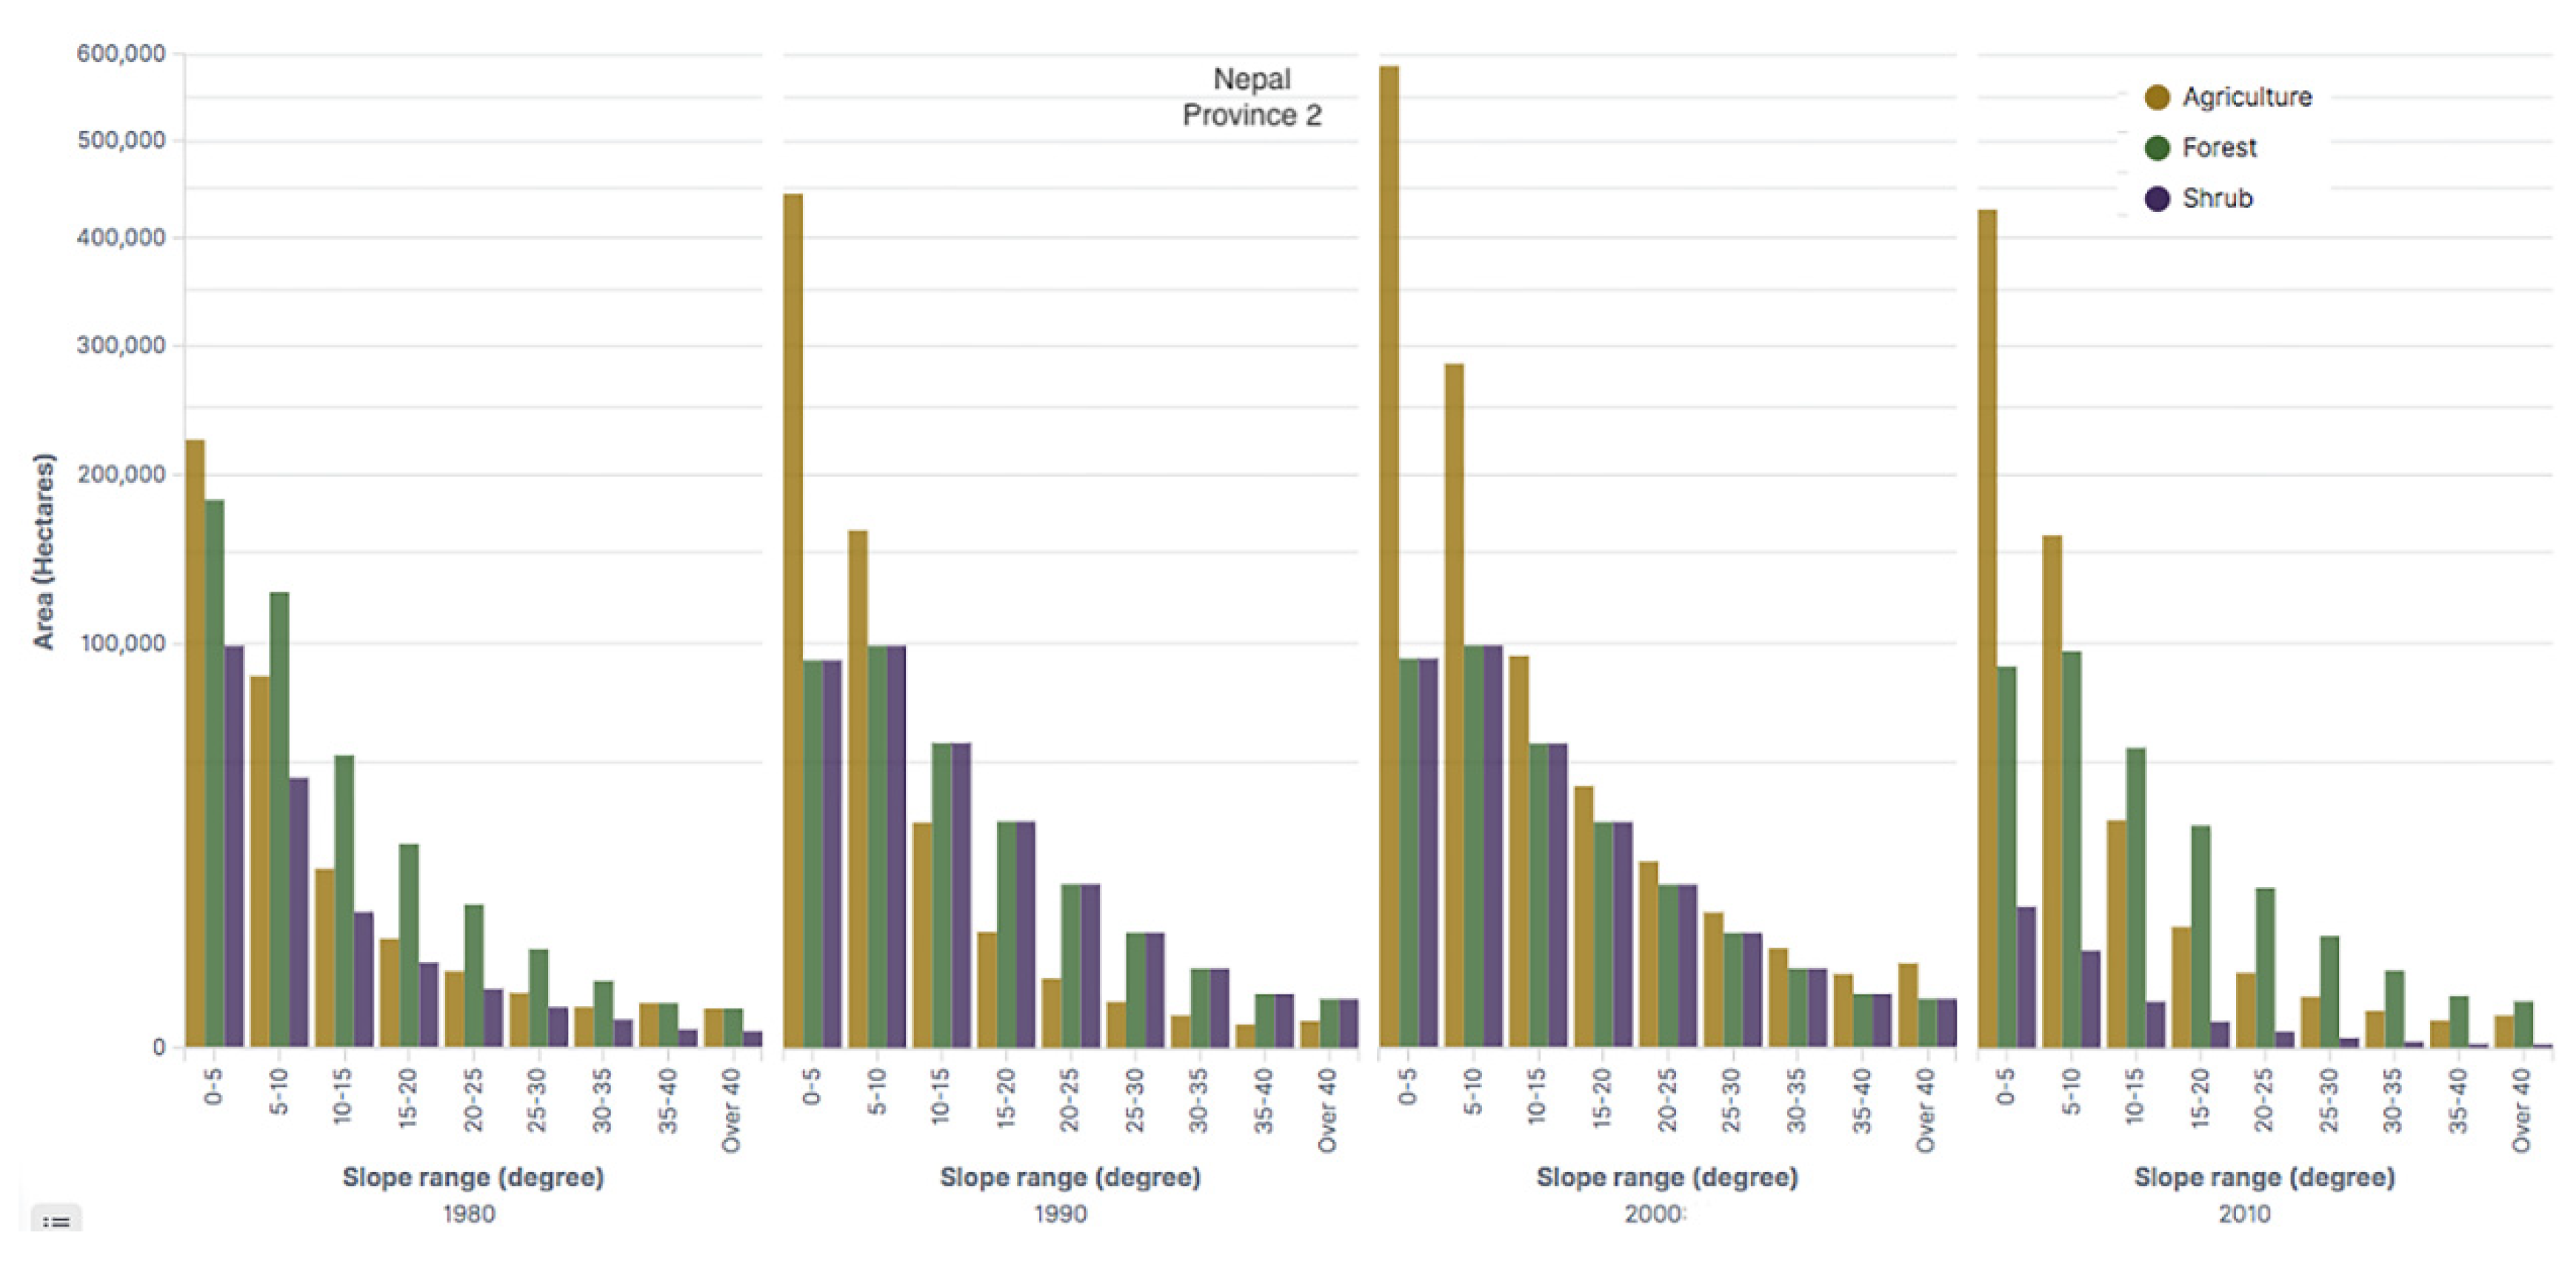
6.1.2. Province 2
Although Province 2 is considered as the breadbasket of Nepal, there is a disparity in the living conditions of people. Almost 58% of the households face some short of insufficiencies (
Table 5). Of those 58% households, about 6% meet their needs by working on own farmlands, 60% meet their needs from wage earnings within the district, 11% by working outside the district, 18% from remittances, 0.55% from a pension, 4% from borrowing, and almost one% from other resources. The land-use and -cover situations show an increase in agricultural land from 1980 to 2000 but a decrease between 2000 and 2010 (
Figure 14;
Table 8) mainly due to the emigration of youth for remittance purposes.
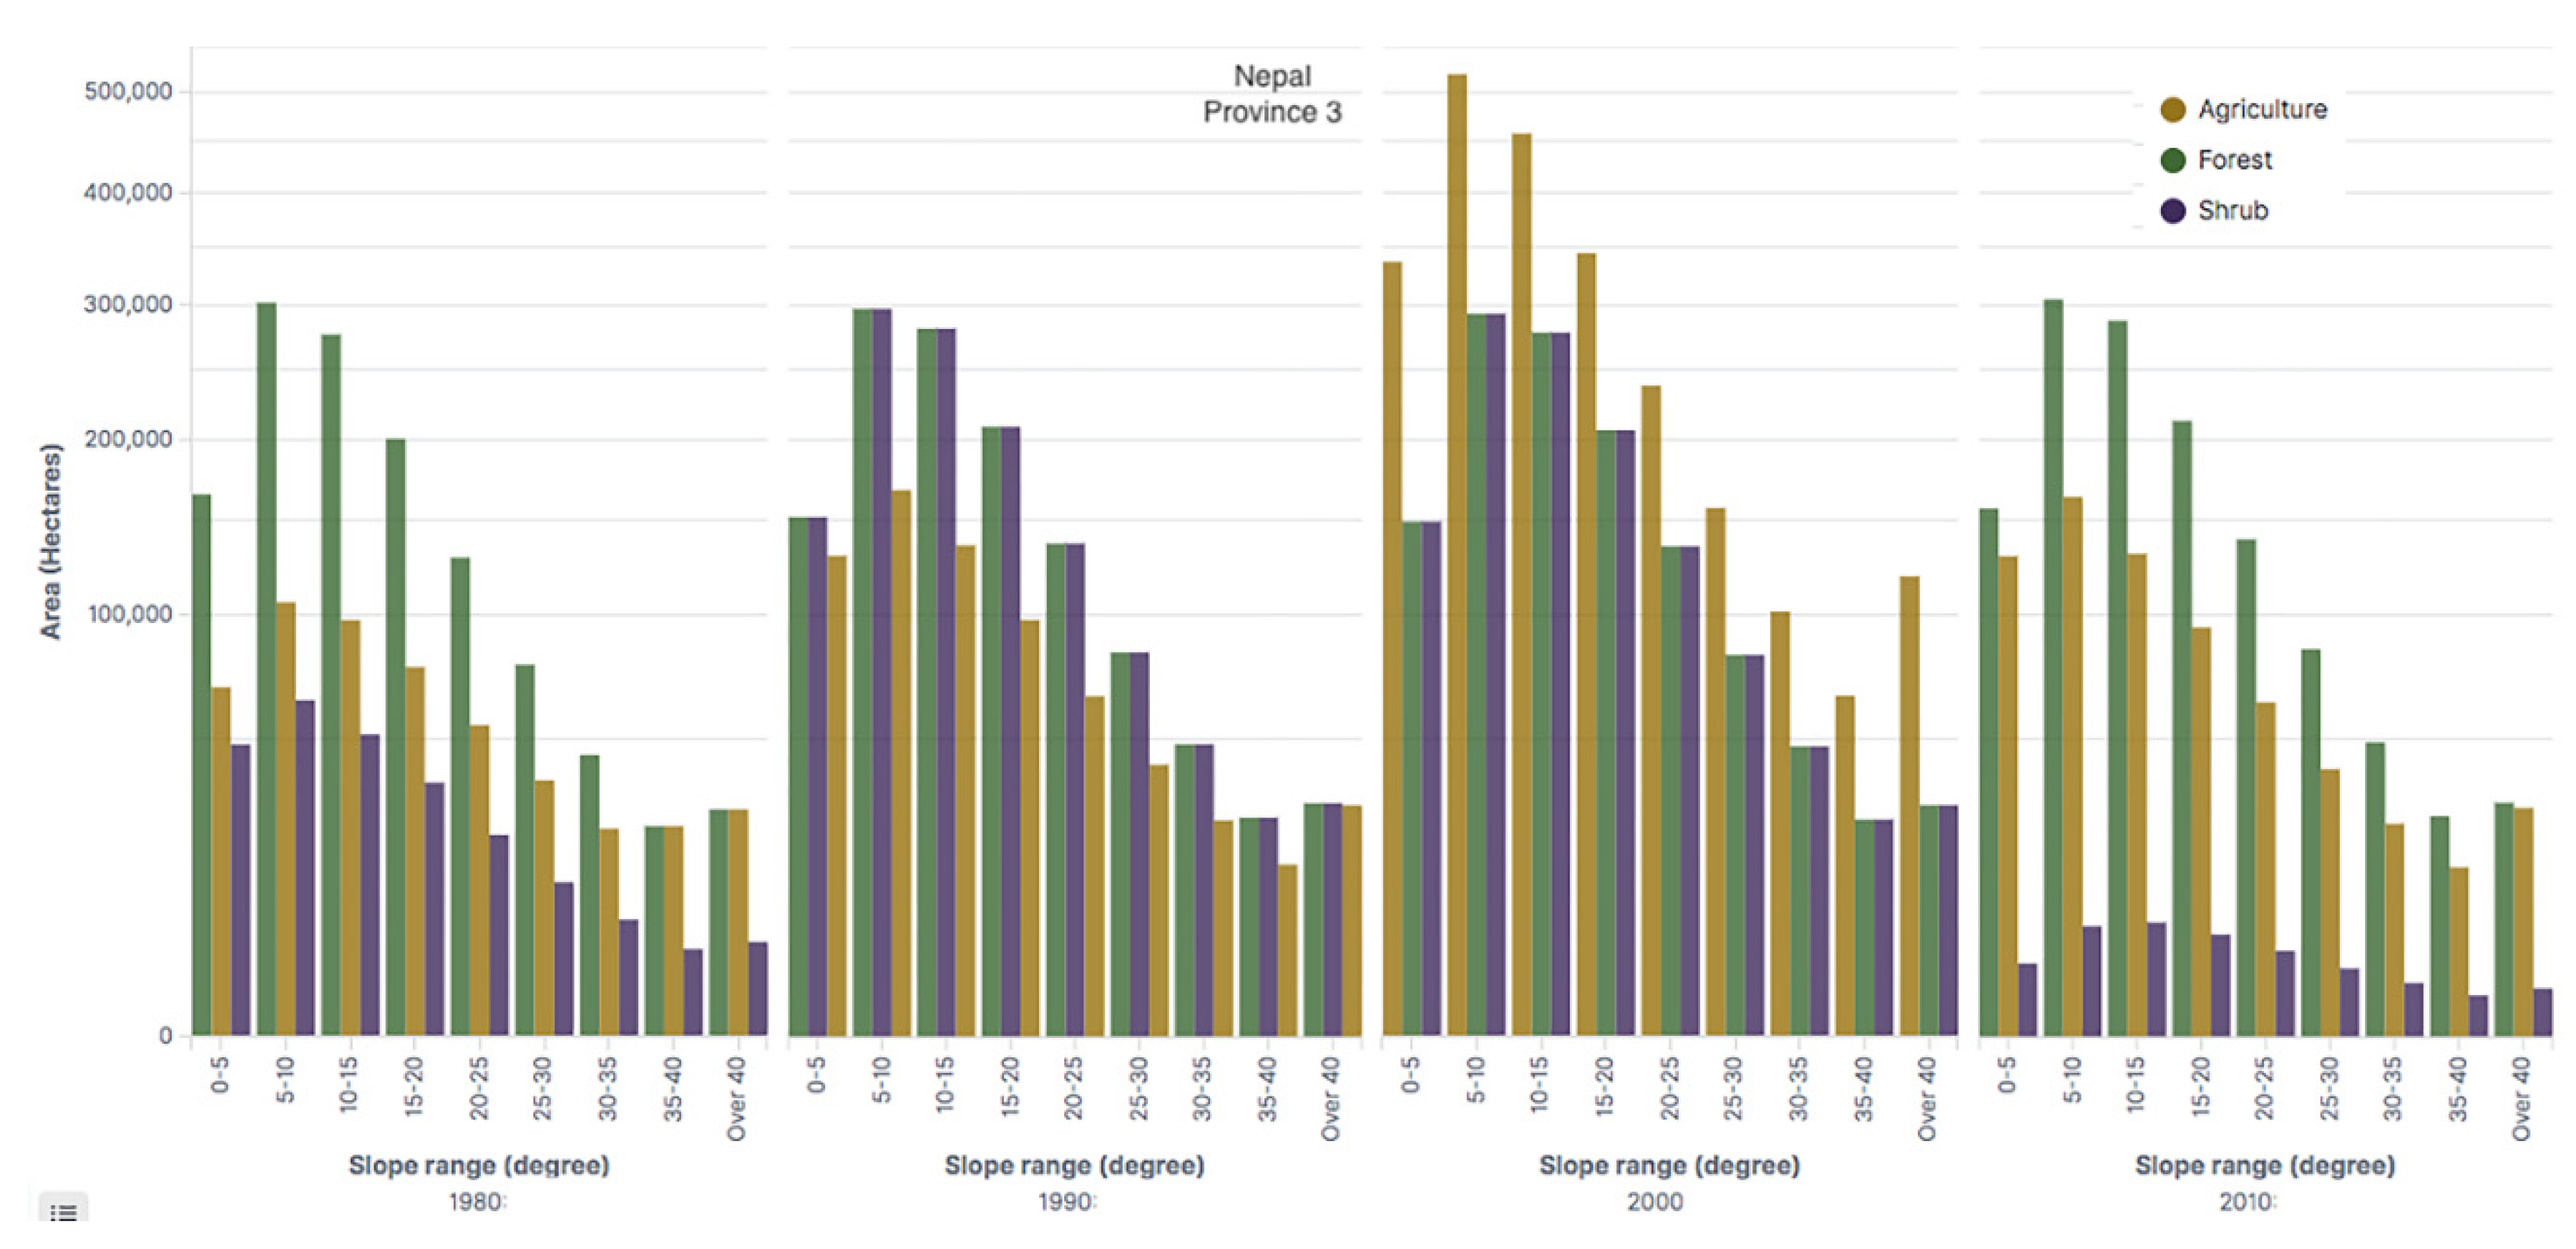
6.1.3. Province 3
The Kathmandu Valley, the federal capital is in this province, and this province is relatively well developed. Yet, almost 54% of households have some types of insufficiency. Of the 54% households, 9% meet their needs from their agricultural production, 65% from a blue-collar job within the district while 10.14% supplement their incomes working outside the district. Almost 9% of the households sustain their households living from remittances while 3% meet their needs from a pension, around 5% from borrowing and 2% from others (
Table 5). Land use and land cover scenarios are not different from provinces 1 and 2 with increasing agricultural lands from 1980 to 2000 and a decrease in agricultural land after 2000 (
Figure 15,
Table 9).
6.1.4. Province 4
This is a food deficit province, where almost 68% of the households face some sorts of insufficiencies. Of the 68% households, about 5% meet their requirements from their agricultural lands, while 48% meet their requirements from menial work within the district. About 6% of the households meet their requirements by working outside the district while 26% meet their requirements from remitted resources. In this province, 8% of the household meet their needs from a pension, especially, from India, Great Britain, and Brunei. About 5% of the households meet their needs from borrowing and about 2% do various jobs to sustain their livings. Although agricultural land increased from 1980 to 2000, because of the increasing remittance practices, it decreased between 2000 and 2010 (
Figure 16;
Table 10).
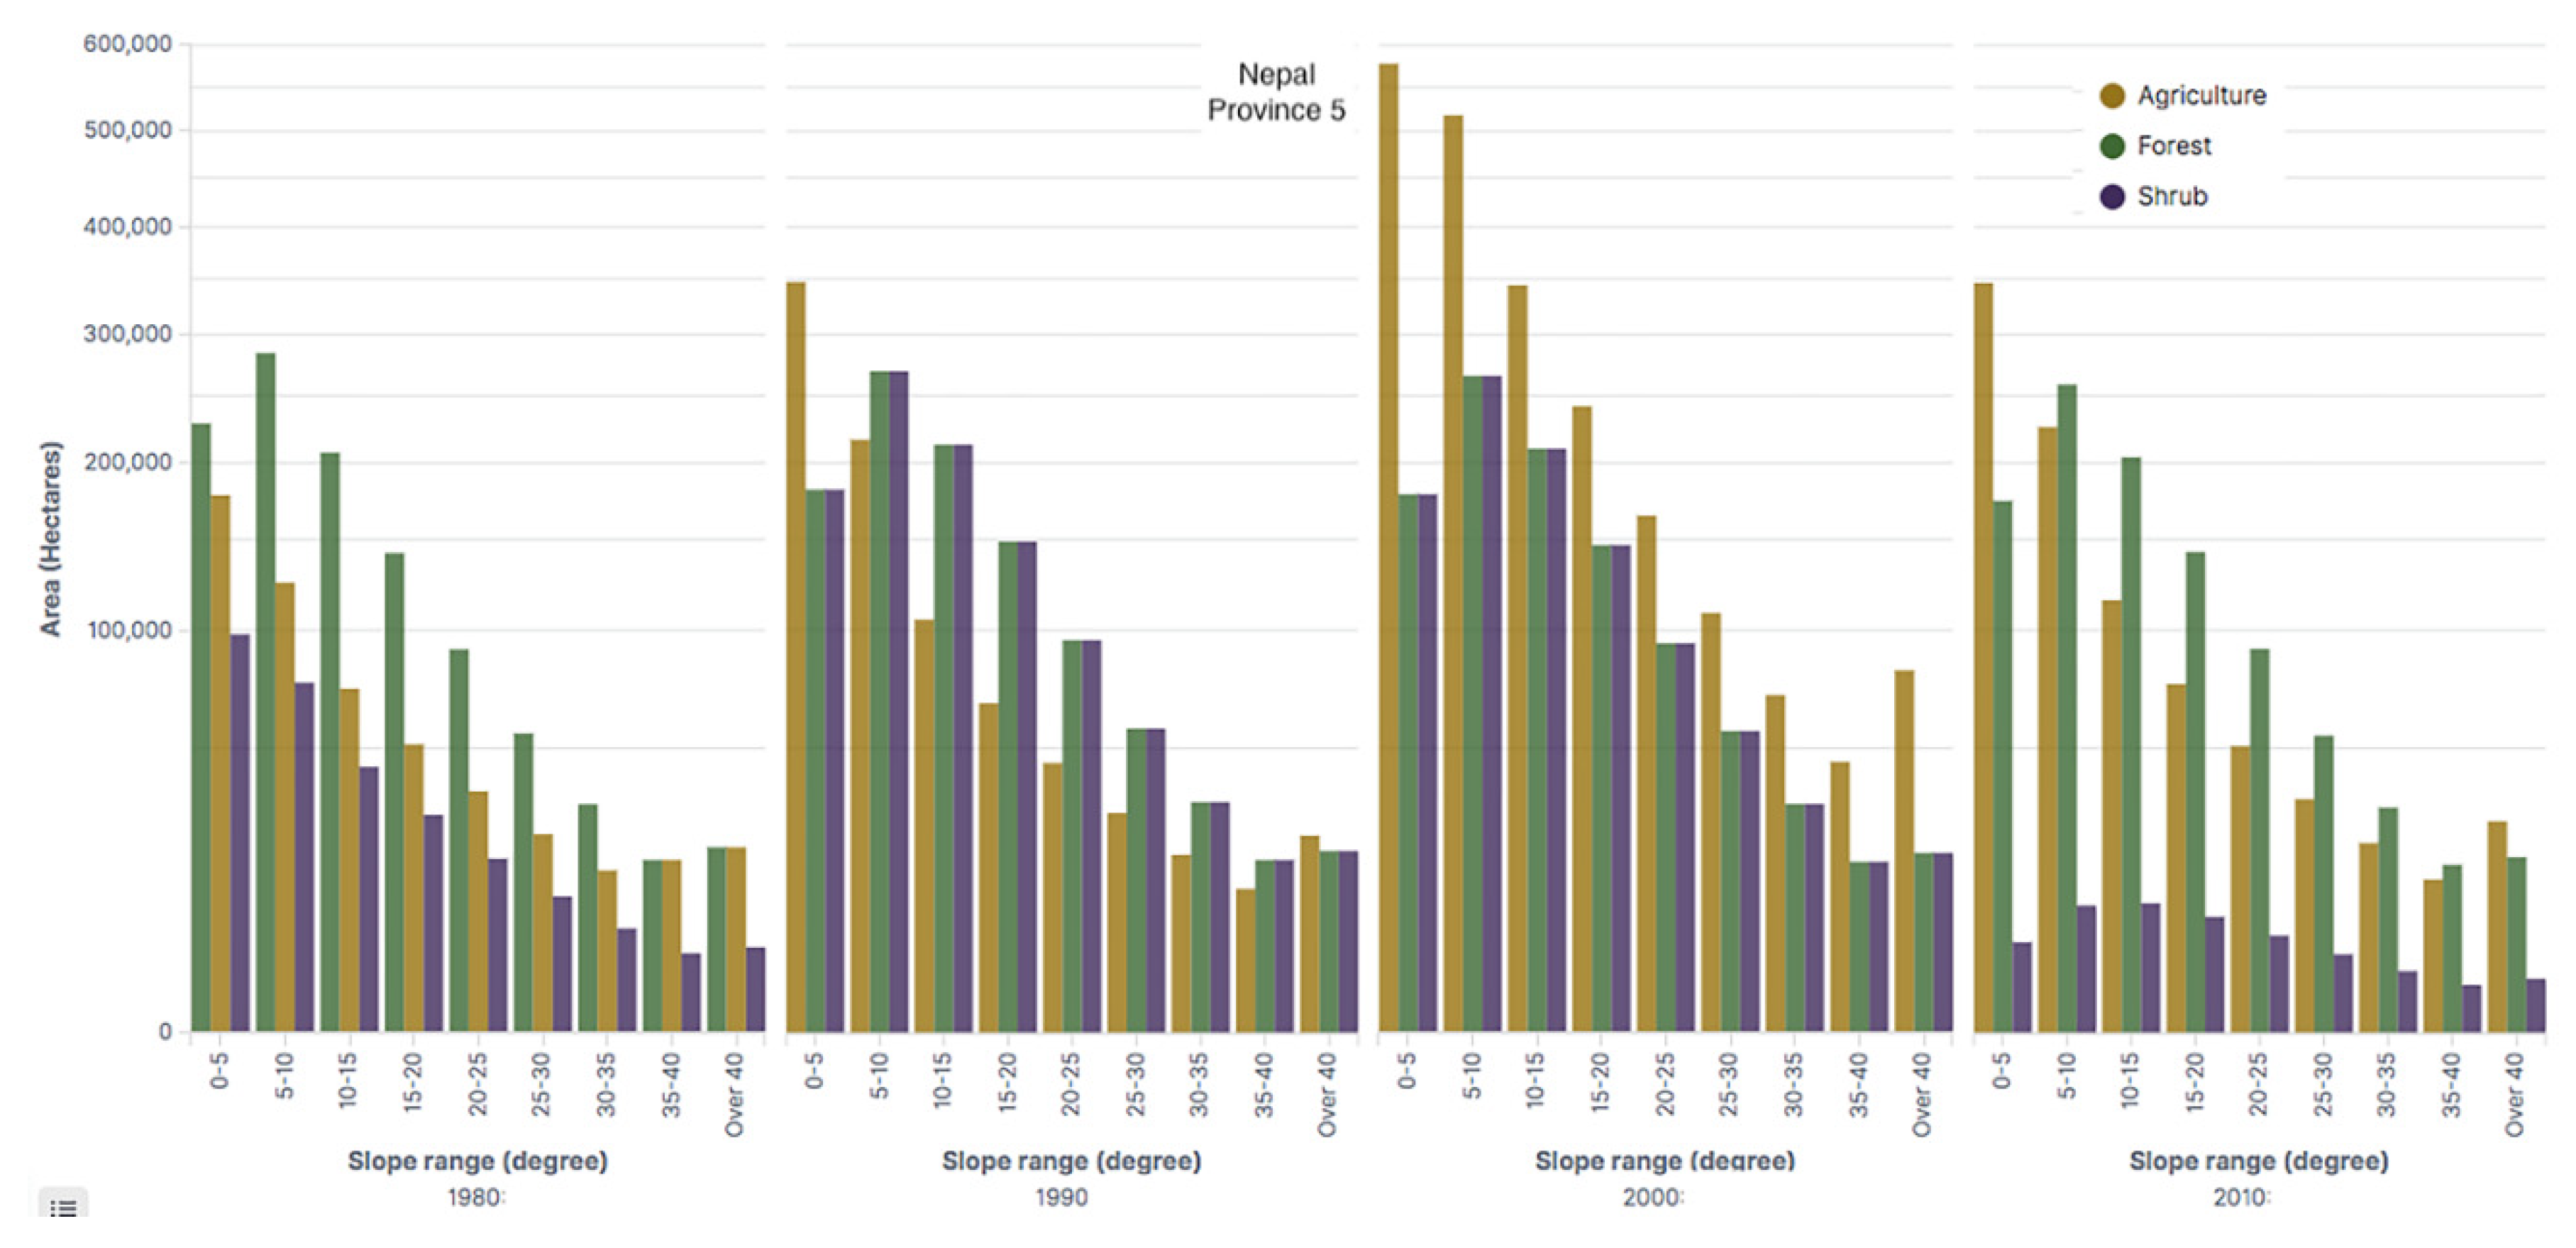
6.1.5. Province 5
This province is food sufficient for the current population (
Figure 9). Nonetheless, about 57% of the total households face some types of insufficiencies. Of these households, almost 5% meet their needs from their farms, while 54% meet their requirements by working within the district. About 6% of the households meet their needs by working outside the district while about 23% meet their requirements from remittances. About 3% of the households have incomes from a pension, about 7% from borrowing, and about 3% meet their need from a variety of resources (
Table 5). As in other provinces, agricultural land has increased from 1980 to 2000, but between 2000 and 2010, it turned into a fallow land (
Figure 17;
Table 11).
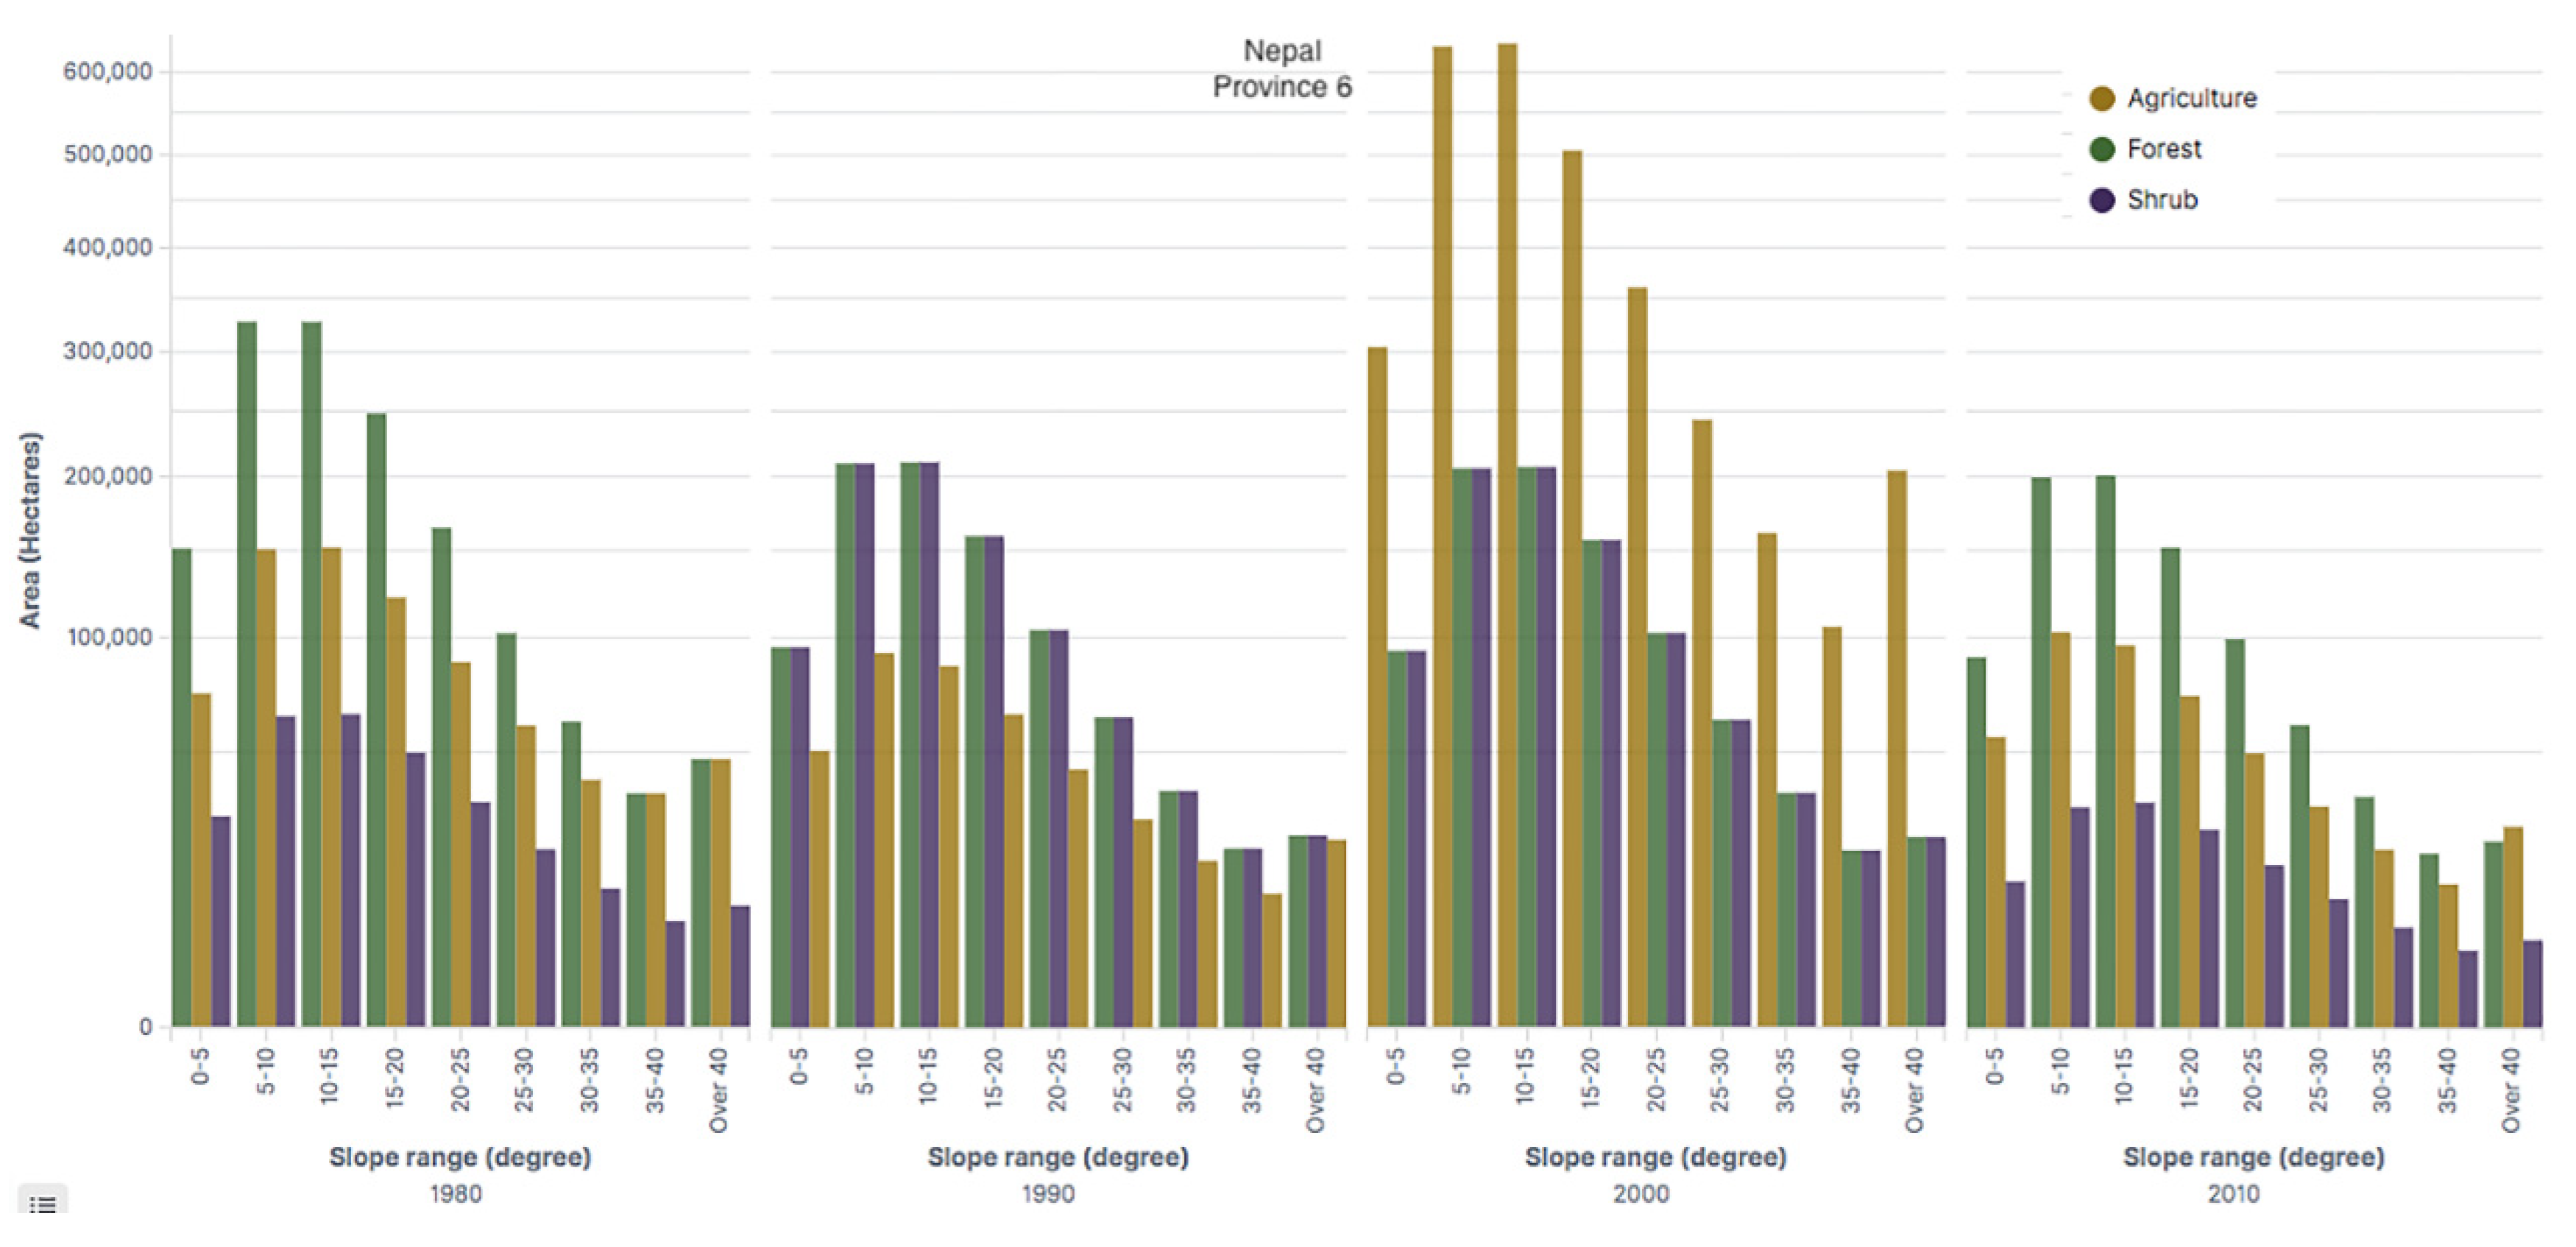
6.1.6. Province 6
This is one of the food scarcity provinces. Of the 75% of the households facing insufficiencies in various sectors, about 5% meet their needs from their agricultural lands, while 54% from working within the same district. About 6% meet their needs by working outside the district, 24% from remittances, 1% from a pension, about 7% from borrowing, and 3% depend on a variety of other resources (
Table 5). Although agricultural land increased from 1980 to 2000, many farmlands were left fallow between 2000 and 2010 (
Figure 18;
Table 12).
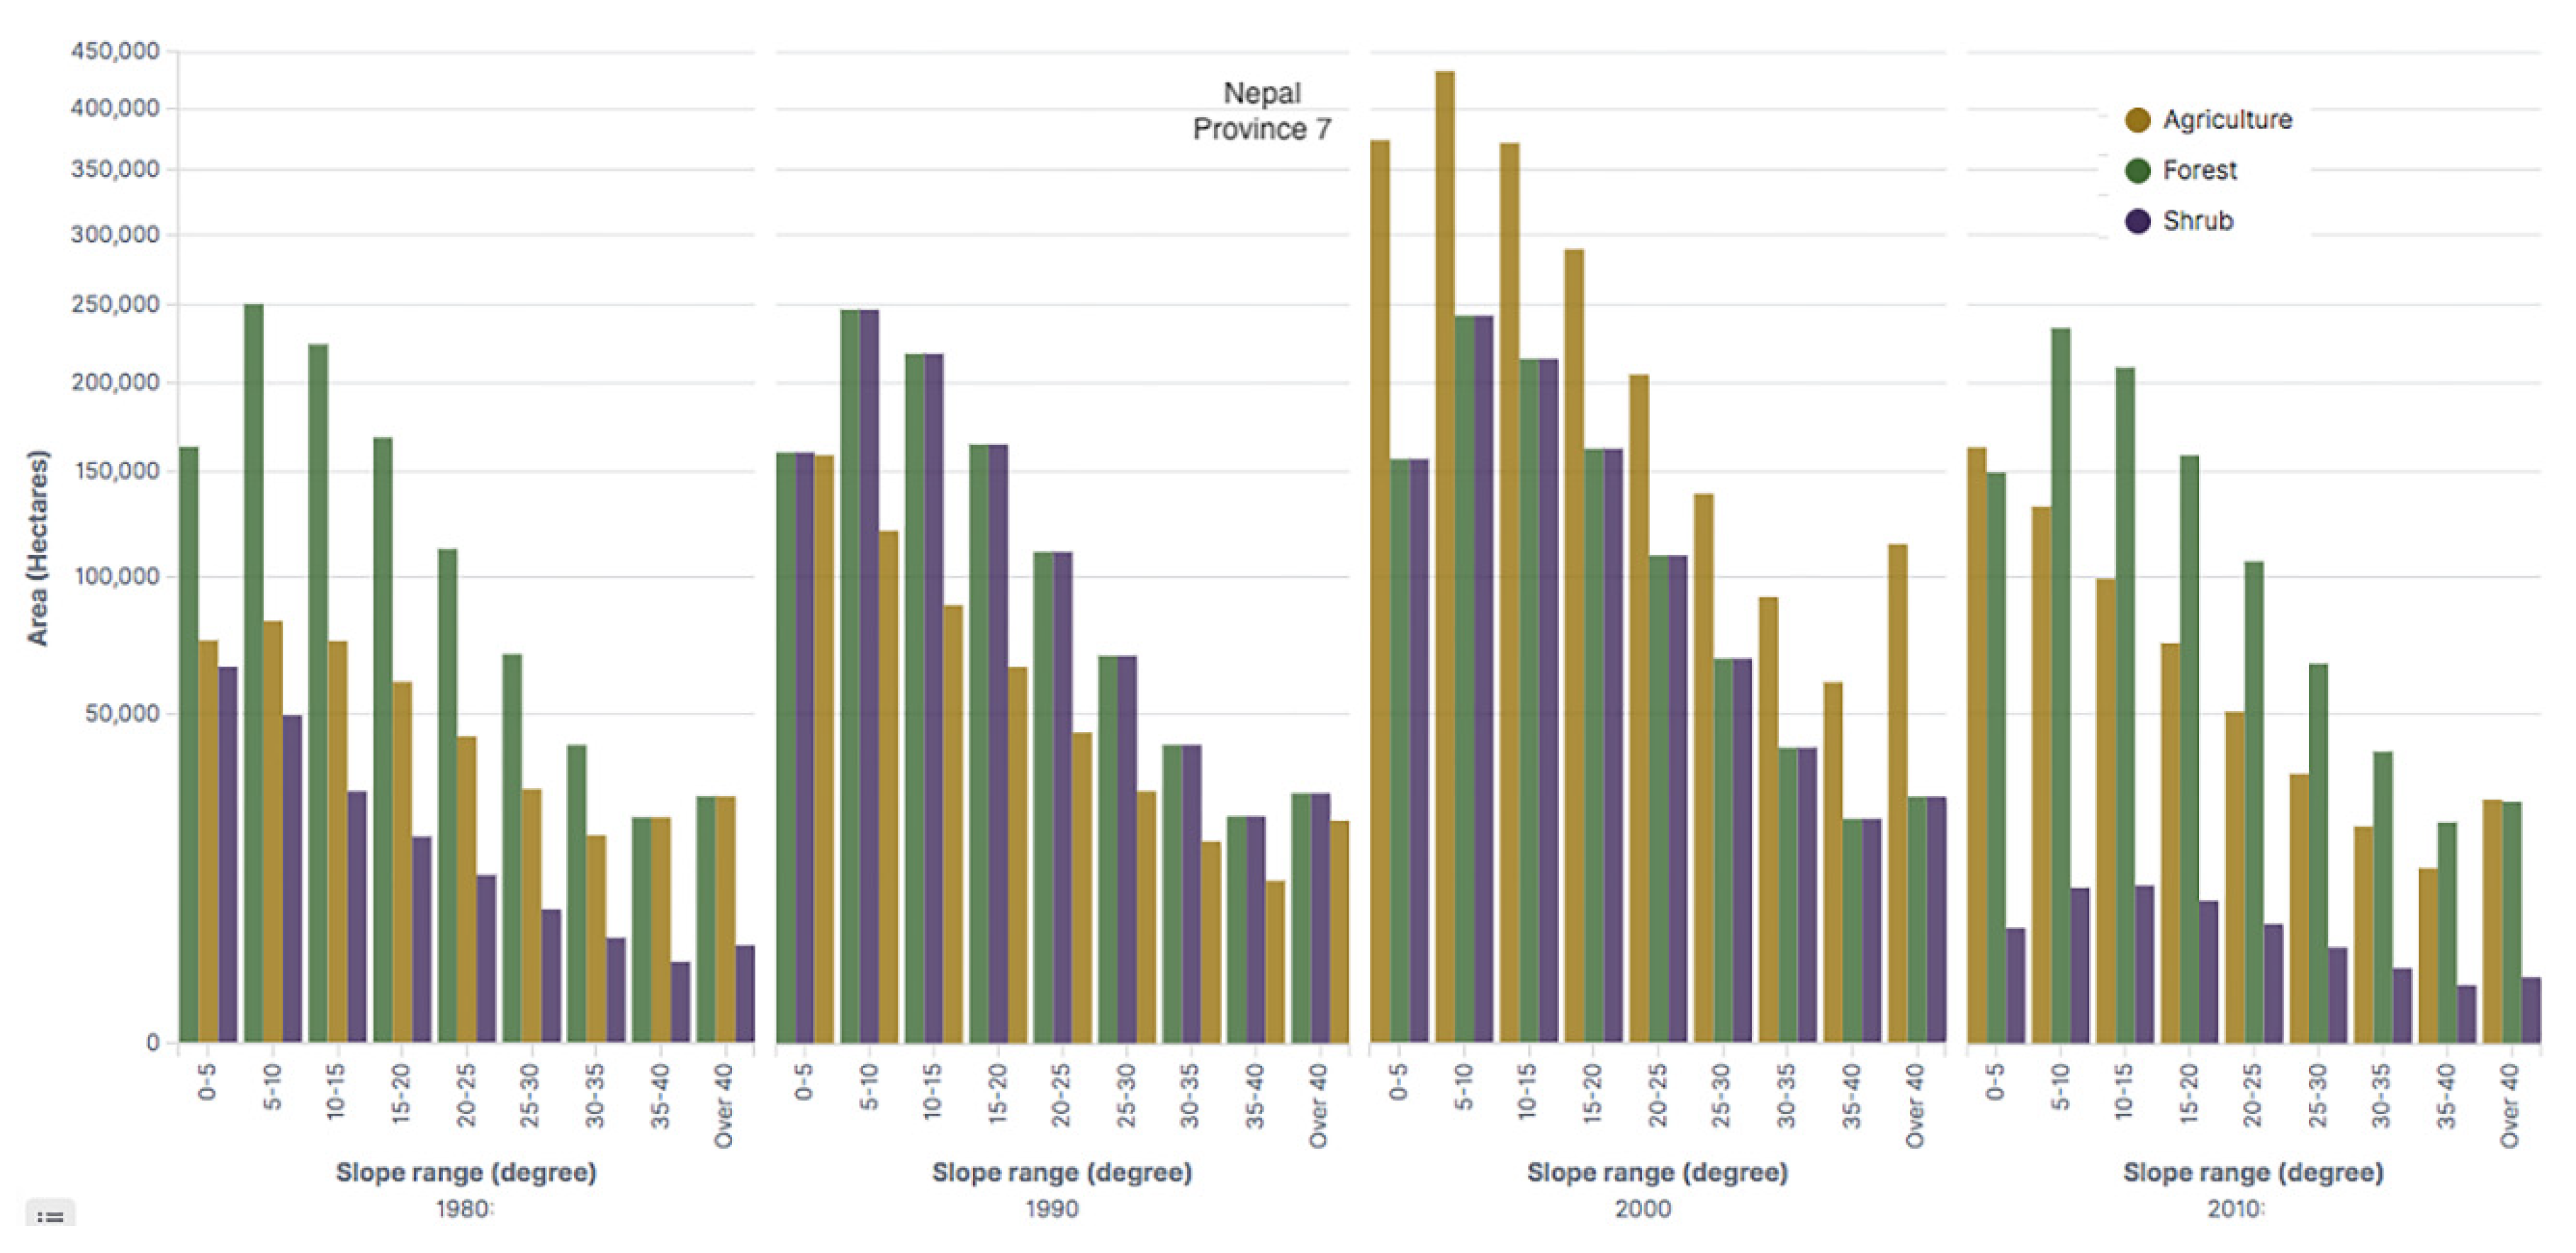
6.1.7. Province 7
Located in the far western region of Nepal, this province is economically less prosperous where about 66% of the households have insufficiencies in multiple areas. Of these households, about 6% meet their needs by working on their farmlands, and about 49% by working within the district. About 7% meet their household needs by working outside the district and almost 30% meet their needs from remittances. About 2% of the households hold pensions, about 4% meet their households’ needs by borrowing while about 3% meet their needs from multiple resources (
Table 5). Like in other provinces, agricultural land increased from 1980 to 2000, but decreased between 2000 and 2010 (
Figure 19;
Table 13).
7. New Initiative
Before the effect of COVID-19, the Ministry of Foreign Affairs of GoN had initiated a Brain Gain Initiative (BGI), and it is gaining momentum. Among the many goals of the BGI, one of them is to modernize farming in all the provinces by consolidating fragmented land parcels (
Table 4). Similar to the enclosure approaches that were adopted in Great Britain during the agricultural revolution in the 1750s, the BGI aims to engage private entrepreneurs to develop model farming by consolidating fragmented land parcels through leasing or purchasing from the landowners. The purpose of the establishment of demonstration farming is to attract youth with new innovative ideas to modernize agricultural farming and connect their innovative activities with research institutions within and outside the country to take advantage of global climate change while mitigating possible disasters and ecological risks through the creation of resilience communities. It is hoped that many research institutions will adapt land assessment tools similar to the AWS and join hands in Nepal’s long-term planning.
Long-term land-use planning requires a detailed evaluation of the relationships between slope classes and geomorphic intensity to identify areas where slope and geomorphic processes may contribute to mass movement, gully, rill, and surface wash erosive and fluvial and lacustrine accumulation processes. Considering these factors, we have identified potential farmland areas in various provinces (
Figure 20) that are suitable for farming (
Table 7,
Table 8,
Table 9 and
Table 10).
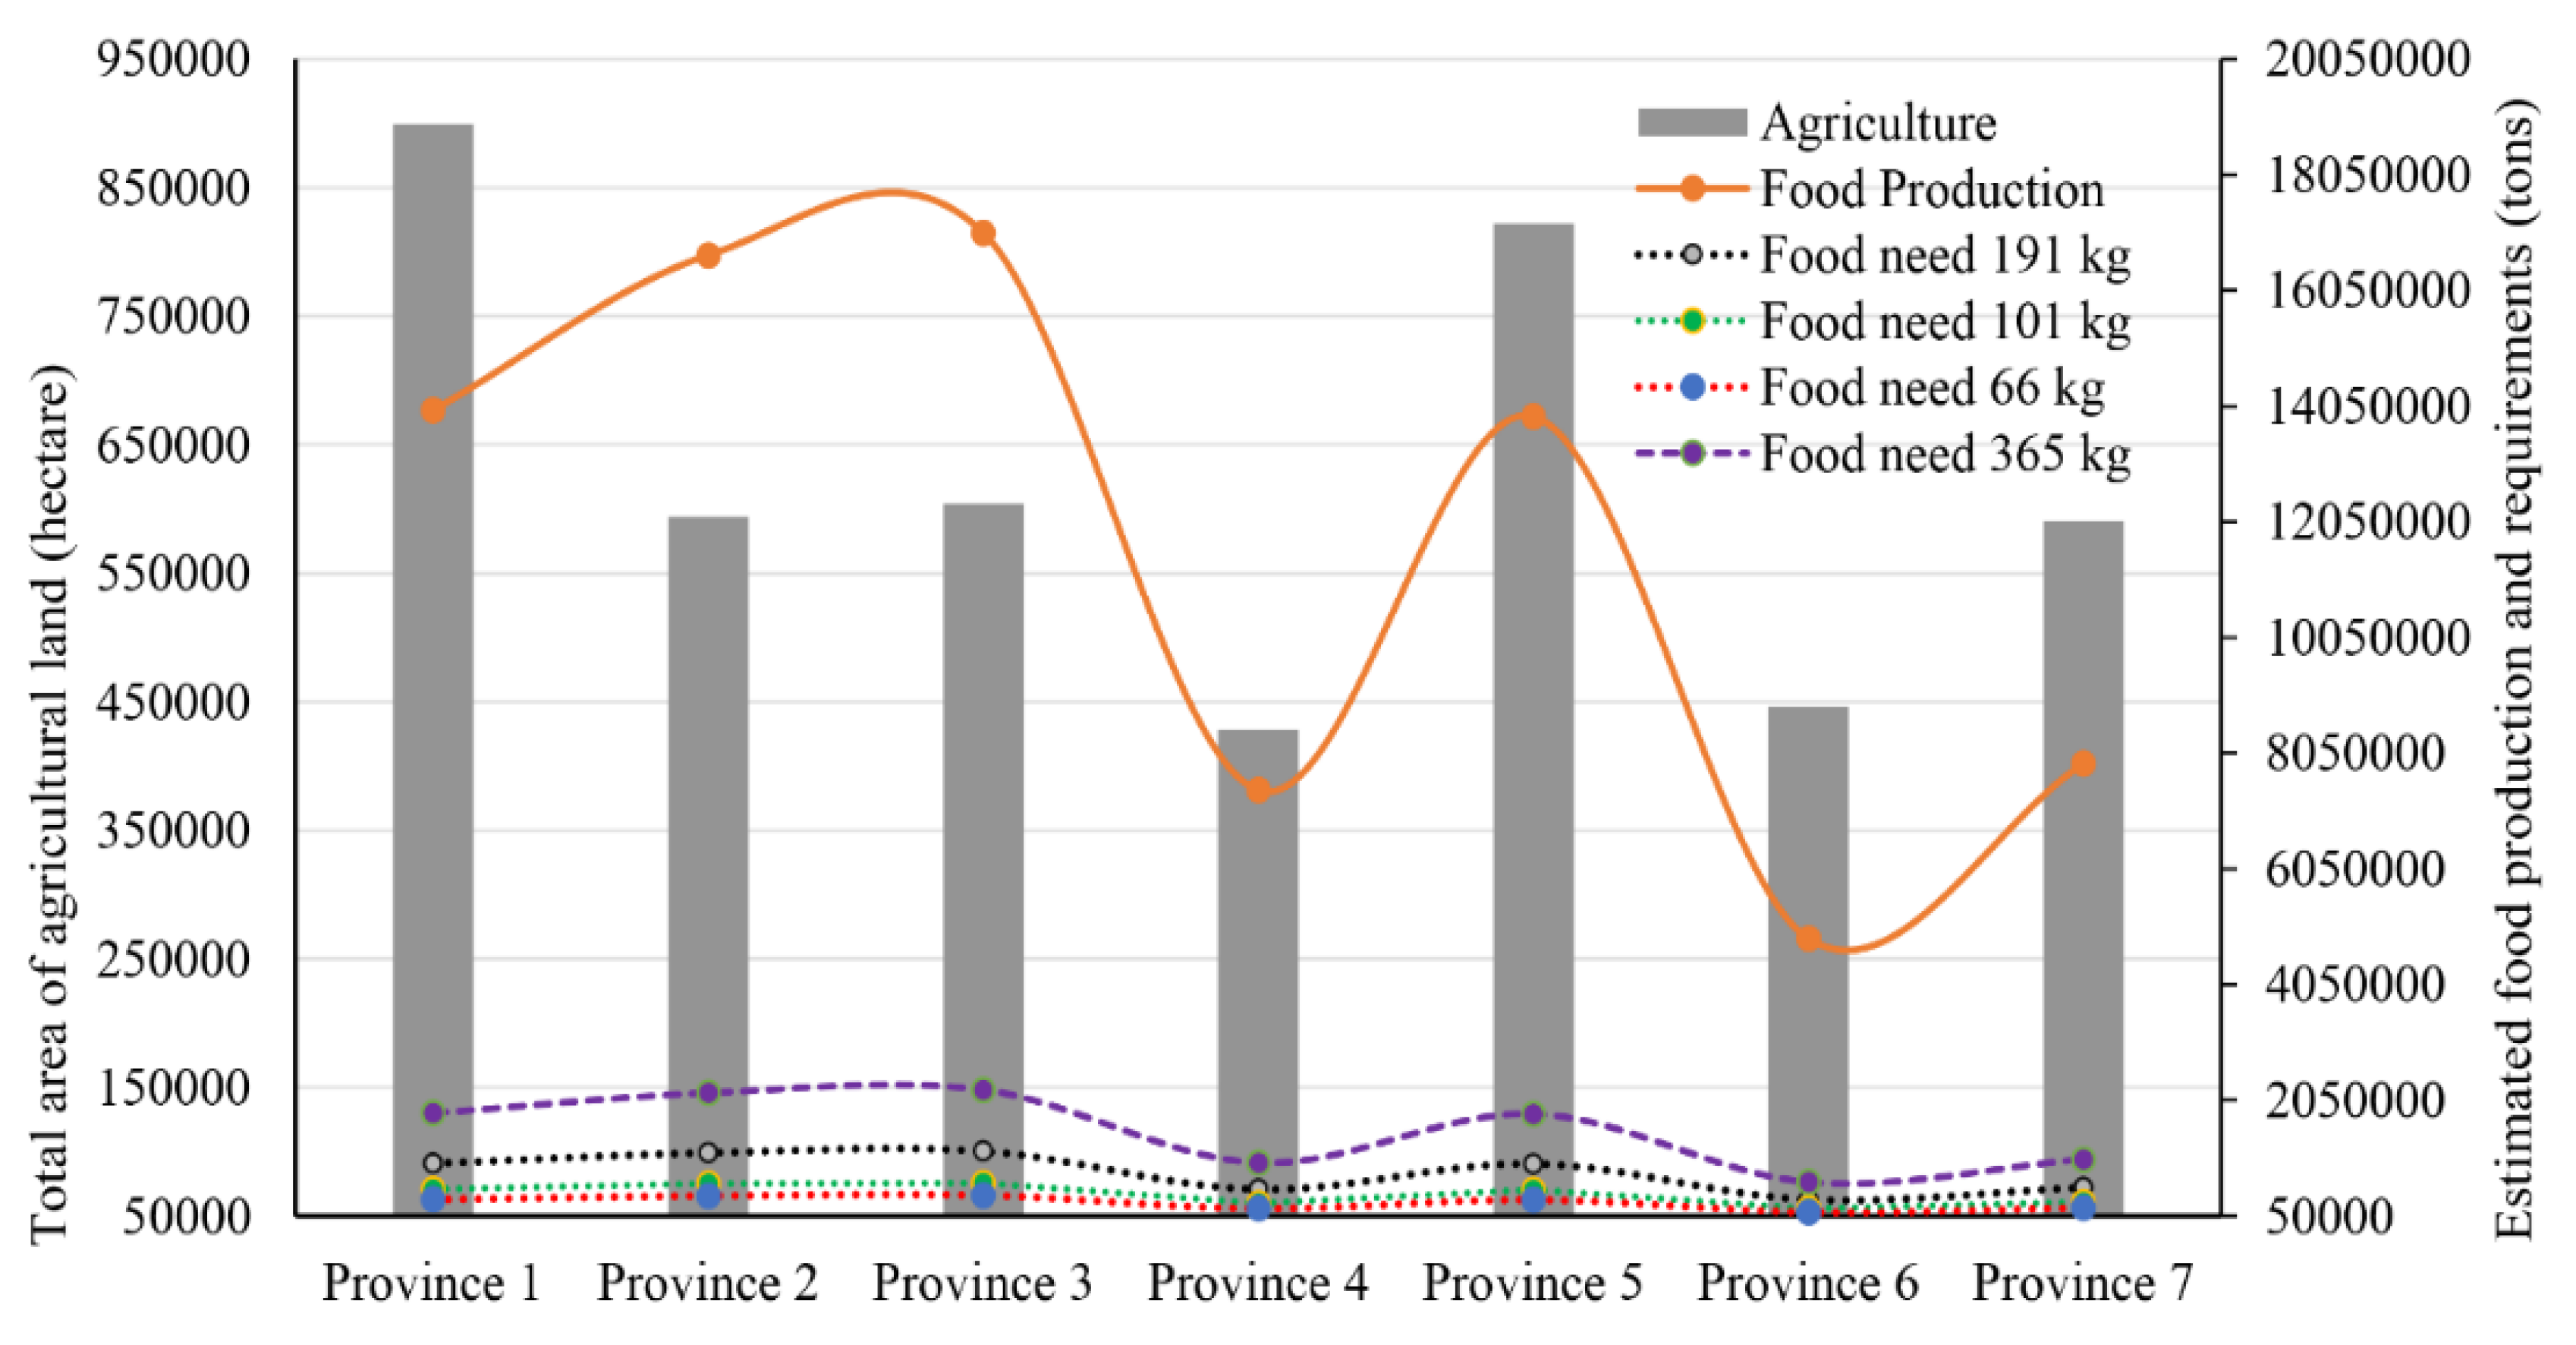
Assuming 2,796 kg per hectare of cereal production [
44] from the available agricultural lands, we calculated the total amount of food that can be produced annually. We compared the possible annual food production vs. food requirements assuming four criteria and derived the conclusion as shown in
Figure 20.
Assumption 1: Consumption of 365 kg/person/year assuming the majority of the people will become vegetarian and the majority of them are involved in arduous (physical) work;
Assumption 2: Consumption of 191 kg/person/year assuming the majority of the people are involved in both arduous and light work and they substitute their protein requirements from meat and pulses;
Assumption 3: Consumption of 101 kg/person/year assuming almost 50% of the people do arduous work and 50% work white-collar types of jobs and consume both vegetarian and non-vegetarian food;
Assumption 4: Consumption of 66 kg/person/year assuming the majority of the people consume less than what is needed to generate 2,200 calories of energy each day, and the majority of the people are elderly who require less food than young people do.
Figure 21 shows that if the available agricultural lands are properly utilized, Nepal can sustain its food production for the current population. However, the information presented in
Table 5 shows that there are shortages of agricultural production in different provinces at varying degrees. Despite such projected production possibilities, each year, Nepal imports food grains equivalent to
$30 million [
60]. This could be due to two reasons: a) the annual production information per unit hectare of land presented by the national agricultural census of 2011 [
44] is not accurate, or b) much of the available agricultural land is left fallow because of the emigration of working youth for remittance purposes. Assuming that the annual production figure is much lower than what is presented in the agricultural census (CBS 2012), extensive farming is needed. This will require bringing potential farmlands that are below 15° slope and are within 2 km distances from the perennial water resources (
Figure 22). Currently, the GoN has
$320 million in reserve of which
$30 million is in Sahakari (Cooperative) and the rest of the savings are in various sectors. These organizations are looking for areas for investment [
61]. By utilizing these resources, the GoN can start a stimulation package for the development of model farming. This model farming will be a forerunner for remitter returnees to promote organic farming.
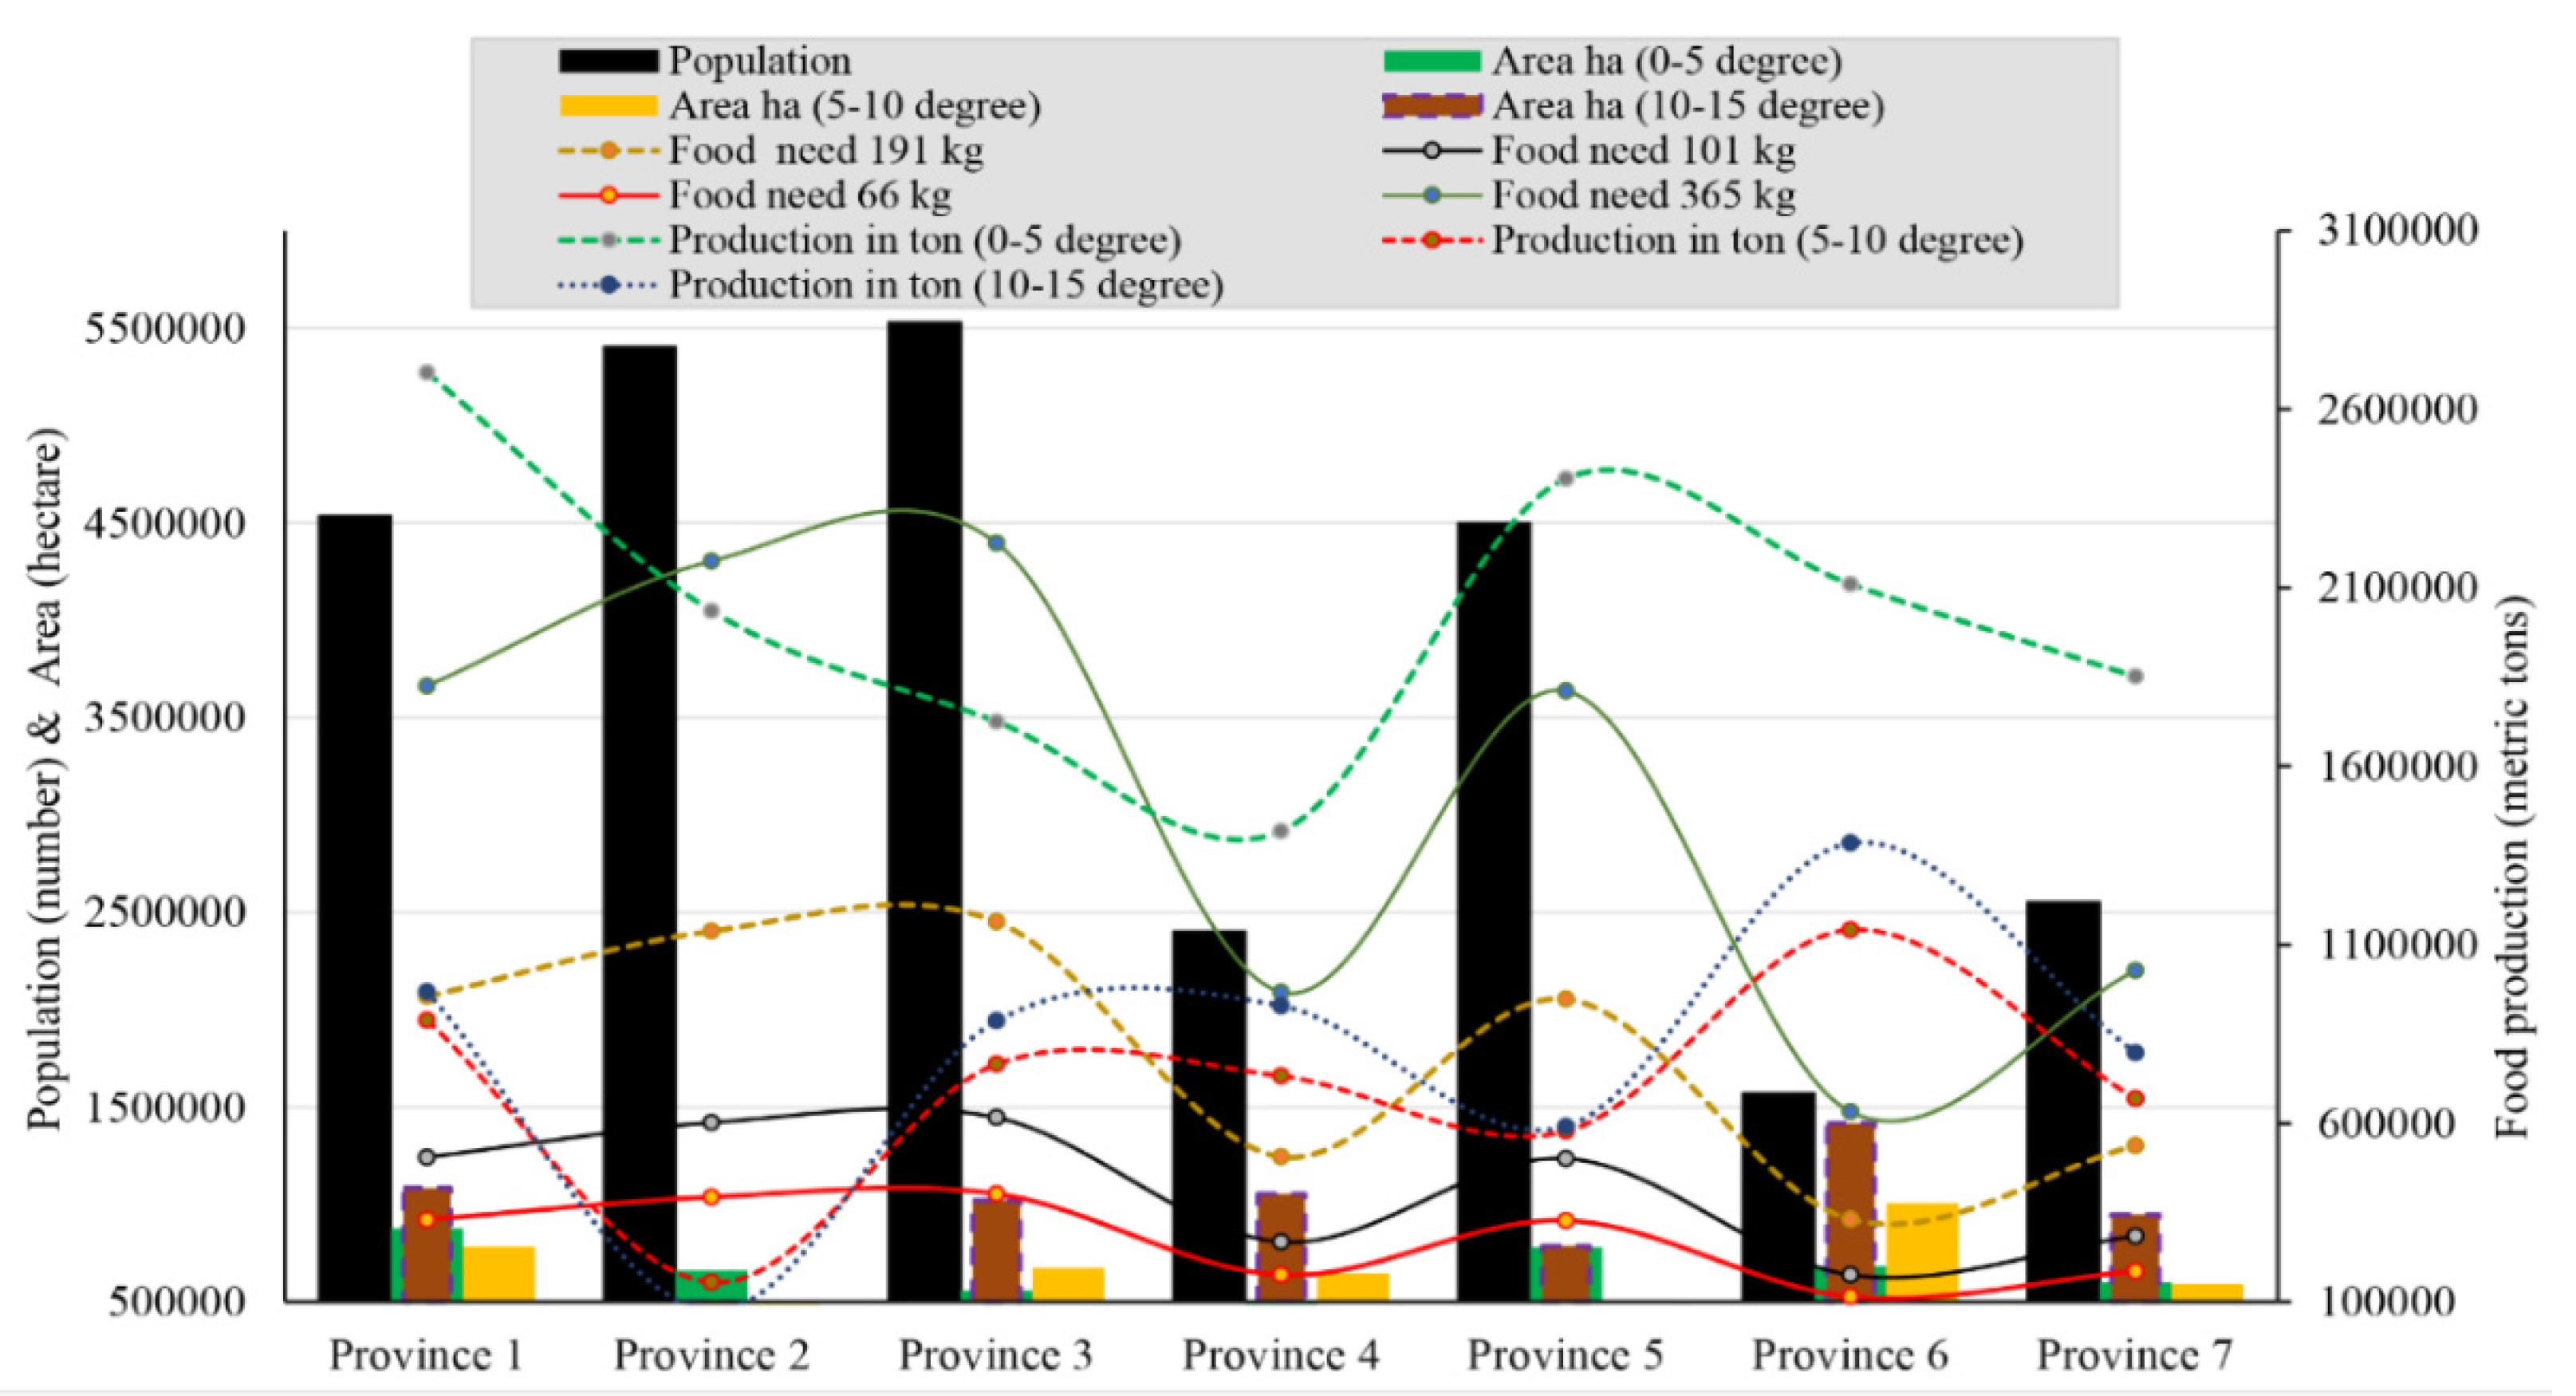
If improved technology is used and opportunities offered by the global climate change are utilized, the production from land that is within 0–5° slope will be sufficient to meet food needs for Nepali people even under scenario 1 (365 kg/person/year). Integrating goat, sheep, avian, and fish farming to meet protein needs under other scenarios (191 kg/person/year, 101 kg/person/year, and 66 kg/person/year) may be sufficient for the Nepali people. The green dotted curve (
Figure 21) indicates the production from farmland within 0–5° slope area shows that many districts will have agricultural surpluses and Nepal may return to a situation of the 1980s when it used to export rice to Bangladesh, South Korea, Myanmar, Thailand, and Indonesia. Assuming the most realistic scenario, within the slope ranges of 0–5°, 5–10°, and 10–15° even if 10–15% of the land areas available within these slope classes are used for infrastructure construction, Nepal will have sufficient farmlands to support the current population. However, research is needed to utilize the opportunities offered by climate change so that a variety of food crops can be produced at a higher elevation.
A large body of literature exists on the studies of land management and soil and water conservation. These studies include Prakasam [
62] research in India; Prakasam [
62] in Turkey; Cavelier et al. [
63] in Colombia; Birhane et al. [
64], Yimer et al. [
65], and Molla et al. [
66] in Ethiopia; Ashkenazi et al. [
67] in Israel; Contessa et al. [
68] and Stanchi et al. [
69] in Mediterranean Europe including Italy (Longji, Napo County, and Baise); Jiang et al. [
70] in China; and Boixadera et al. [
71], Fernandez [
72], and Retamero [
73] in Spain (Catalonia and Asturias). These studies suggest various methods of how to best use lands at different slope gradients. Nepal may choose the best methods to utilize potential farmlands because the conversion of forestland to cropland reduces soil fertility, alters the hydrological cycle, and degrades overall lands within watersheds. An increase in anthropogenic activities accelerates soil erosion and disturbs soil aggregate stability in various land-use/land-cover conditions. These land degradations in the mountains and hills also affect land use and cover downstream in the Tarai plain (
Figure 10). In Nepal, water-induced erosion in the mountain and hill areas is very high [
74] because of the steep slopes [
75]. Rivers flowing from hills and Churia transport heavy sediment loads due to gravitational forces [
75,
76] which are deposited at the foot plains. As sediments deposit on the river course, a river meanders and often overflows on to agricultural lands [
76]. Landslide becomes another nuisance and becomes one of the major causes of natural disasters which causes losses of billions of dollars each year. High mountain ecosystems, with strong topographic and climatic gradients, are fragile and particularly sensitive to changes in land use [
77]. Many of the cultivated lands are abandoned because working-age youth have emigrated for remittance purposes. These fallow lands are becoming shrublands and forest stands are coming back considerably on abandoned pastures and farmlands. There are linkages and interrelationships between natural, human-induced environmental and socio-economic processes within high-mountain socio-ecological systems. Thus, conservation efforts need to focus on vegetation cover and land use through sustainable resource conservation and management and for poverty alleviation [
78]. Considering these factors, proper land use at different slope gradients will help to sustain ground productivity.
8. Conclusions
Nepali youth emigrated in large numbers to various countries (
Figure 1) for remittance purposes (
Figure 8). Employment opportunities within the country are very limited. The current government led by the Communist Party of Nepal (CPN) began its rule with the slogan of “Prosperous Nepal, Happy Nepali.” However, as of the writing of this paper, the CPN–led government is running in its third year, but no additional employment opportunities are available within Nepal to make a significant difference in employment status within the country. Of the half a million youth who join the labor market each year, only a fraction find a job within Nepal and the rest emigrate to 59 different countries (
Figure 1). Various estimates put the number of emigrated youth between 6 to 8 million. These Nepali youth are facing unfavorable circumstances at the places of their destinations, especially, after the COVID-19. As these emigrants are becoming jobless, Nepal losing not only remittance incomes, but also is facing serious problems of accommodating such a large number of returnees. The Government of Nepal (GoN) cannot open high employment-generating industries on its own, and it requires FDI. Although the current government made some attempts to increase FDI through its participation from Davos to Washington D.C. [
79], there has been no significant increase in the FDI. Now with COVID-19 effects, chances of such investments are bleak with the global economic recessions. The World Bank has predicted Nepal’s economic growth for next year at 1.5% down from 7.5%. Although the Asian Development Bank (ADB 2020) had shown some hopes of predicting Nepal’s economic growth for next year at 5.5%, economic pundits say it is hard to materialize. The agricultural sector seems to be one of the major options to engage this returnee’s population. Modernizing agriculture and coordinating between research institutions and model farming and engaging the diaspora through the Brain Gain Initiatives (BGI) seems to be one of the doable options across vigorous spatial, cultural, and economic sectors to launch model farming campaigns in different ecological regions of 7 provinces.
Land use at different land gradients influences water infiltration, runoff and soil erosion and sedimentation processes that affect soil genesis and vegetation development in the downstream watersheds (
Figure 10). Maintaining a dynamic relationship between the slope gradient and land use for sustainable land/soil management will help to improve the food security of the local community. The slope gradient and the changes in land use/cover has effects on the spatial variability of topsoil characteristics that also affect sustainable soil management and food supply. Improper use of high slope areas for agriculture increases the chance of potential natural disasters. Nepal losses over 2% of its total GDP to natural disasters each year [
80]. Kibana Platform within AWS can be one of the tools to develop real-time data to monitor changes in land use and cover at various slope gradients. Using such technology, Nepal can explore potential agricultural land resources located at different elevations (
Figure 12 and
Figure 20) that are below 15° slope and within 2 km distances from perennial water sources under agriculture (
Figure 20). Enhancing agricultural production will compensate for the losses Nepal will face from remittances, which at present contributes almost 28% of the annual GDP.
Remittances contribute significantly (
Figure 8) to the Nepali economy [
81], but working environments at the destination places may not remain the same forever. Hostile working environments might force many working-age people to return home. Nepal already has a bitter experienced of evacuating people from many countries including Syria [
82]. One of the potential options for Nepal is to make a marriage between the youthful population and farmlands. Around 63% (18–64 age cohorts) of Nepal’s 29 million inhabitants used to be part of the agricultural workforce before they embarked in search of remittances [
81,
83,
84], but the contribution to the national GDP from agriculture has gone down to less 1/3rd% recently (
Figure 8).
Nepal’s economic growth rate in 2014–2015 was 5.72%; it plunged into 0.2% due to the effect of deadly earthquakes in 2015–2016. In 2017–2018, the economic growth remained 7.4%, however, after the spread of COVID-19, the growth may go down unexpectedly in 2020–2021 [
31] to 1.5% [
33]. The World Bank stated a gloomy picture while presenting the economy of South Asian countries for 2020, 2021, and 2022 (
Table 14). Previously, the Asian Development Bank (ADB) has projected that Nepal’s economic growth rate to remain within 4.3 and 5.3% for the fiscal year 2020–2021. Although the projections made by the World Bank and ADB are different, both are considering COVID-19 and a decrease in remittance, tourism, and international trades into considerations. The warnings are that the post-COVID-19 will widen the gap between the rich and poor. The development banks and econmists [
41] have suggested bringing aggressive development packages to boost the dwindling economy as soon as the lockdown is over.
Tourism growth decreased by 32% in 2015, the post effect of earthquakes, but it took a v-shaped growth in the following year. The Prime Minister’s Employment program and social security programs have become directionless. The policy of not accepting any foreign investment that is less than
$0.5 million [
79] again has hurt the Nepali economy. The only hope Nepal has is to revitalize and explore potential agricultural areas to tap the skills of youth returnees.
Although agriculture remains one of the most viable options to generate temporary employment for almost 22 million people [
85], the national average size of agricultural landholding per household has decreased from 1.1 hectares (ha) in 1995/96 to 0.7 hectares in 2010/11. With the decrease in average landholding size, the average agricultural production can support a household only for half a year [
86]. The number of small farmers holding less than 0.5 ha of land increased from 41% in 1995/96 to 53% in 2010/11, whereas the proportion of large farmers holding over 2 ha of individual farmland decreased from 13% in 1995/96 to 4% in 2010/11 [
87,
88]. Thus, to boost agricultural production to sustain household food grains, it is essential to explore additional potential agricultural land. Around 57% of major cereal crops (rice, wheat, and maize) production, which constitutes 75% of the crops, comes from the Tarai region. In the Tarai region, although the land productivity measured at 2000/01 constant price with an increase in productivity between 2006 and 2016, actual production per hectare decreased from 3.6 to 2.8 Mt/ha (metric tones per hectare) between 2015 and 2016 [
89,
90]. Moreover, about 104,000 ha of agricultural land in the Tarai has been converted into infrastructure construction between 2000 and 2019. Although the grain production per capita increased from 189 kg in 2006 to 223 kg in 2016, the production often fluctuates [
90] creating shortages for food grains. In recent years, Nepal’s agricultural sector has been diversifying towards high-value crops and products such as fruits, vegetables, spices, condiments, and livestock [
90,
91]. Yet, the average per capita production has not increased. One of the problems in agriculture is the lack of irrigation facilities. Although Nepal’s 67% of cultivable land has irrigation potential, only 25.2% of the agricultural land has such facilities. Because of these constraints, at present, annually Nepal imports grains, fruits, and vegetables equivalent to
$600 million. With proper management, per hectare average cereal crop production could be 2796 kg/year. If the available 43,849 sq. km of agricultural land (
Figure 20) is brought under agricultural production, Nepal can produce 13.52 million tons of food grain. Assuming that, on average, the food grain consumption is 191 kg per person per year to generate 2200 calories/day (assumption 4 in
Section 7) for 29 million people, Nepal can have an annual surplus of 7.42 million tons of food grains. At the current average price of
$213/metric ton [
85], Nepal can earn
$1,579 million annually from the trading of agriculture instead of importing agricultural products. Assuming, on average, 5 people are needed to farm one hectare of agricultural land [
85], Nepal can add about 1 million jobs in agriculture under manual working conditions. This assumption, however, would change once farming is mechanized by consolidating small land parcels. By that time, multiplier effects from agriculture would contribute to the establishment of various industries to generate jobs in multiple sectors. Nepal National Planning Commission (
www.npc.gov.np) and TradingEconomics [
84] state that Nepal has 41,210 sq. km. of agricultural land. The satellite image classifications (
Figure 20) reveals 43,849 sq. km. land area under potential agricultural land. Of those areas, only half of the area is under agricultural crops. If all the potential agricultural lands are borught under cultivation, with 15–20% land used for constructional purposes, still about 35,000 to 37,000 sq. km of land is farmable. These potential agricultural lands can help to generate 17–18 million jobs. However, soil erosion becomes one of the serious issues with the increase of the land slope. The amount of soil erosion in sloping areas increases if the existing ground cover is removed. On the barren steep slope land, soil erosion by water seriously threatens agricultural productivity and food security [
92]. The potentially high erosion rates caused by heavy rainfall in steep topography reduce food production [
93] because non-eroded lands have 1.5 to 5 times more plant nutrients than the eroded soils [
94]. The steeper the topography is, the more expensive it is to bring potential areas into agricultural production.
Terracing steeper slopes becomes very expensive (
$16,145.85/ha) [
94]. On the plain area, however, it would cost between 2% and 7% of the total estimated cost (
$16,145.85) per hectare to bring potential area under agricultural production. Generally, the cost of preparing a hectare of agricultural land in plain areas would be between
$48.00 and
$116 [
94]. Since the climate is changing, it is now time for Nepal to conduct more research to identify location-specific edaphic and climatic factors that influence agriculture production to explore potential agricultural lands below 15° slope. Literature suggests that with the change in climate, many of the tropical crops like rice, wheat, gram, lentil, split Bengal gram, split black gram, split green gram, split red gram, red lentil, semolina, maize, horse gram, chickpeas, and black-eyed beans can be grown in the lower part of subtropical region. Likewise, the subtropical crops can be grown at the lower parts of the temperate region. Taking advantage of the crisis created by COVID-19, it is now high time for the GoN to implement supporting policies to establish several agricultural demonstration plots in all 7 provinces. Providing financial incentives to farmers and assuring them market facilities may attract many youths to agricultural farming which will create millions of jobs.


