Article

How to Prevent Bread Losses in the Baking and Confectionery Industry?—Measurement, Causes, Management and Prevention

by
Elżbieta Goryńska-Goldmann
1,*,
Michał Gazdecki
1,
Krystyna Rejman
2,
Joanna Kobus-Cisowska
3,
Sylwia Łaba
4 and
Robert Łaba
4
1
Department of Economics and Economical Policy in Agribusiness, Poznań University of Life Sciences (PULS), Wojska Polskiego Str. 28, 60-637 Poznań, Poland
2
Department of Food Market and Consumer Research, Warsaw University of Life Sciences—SGGW, Nowoursynowska Str. 159 C, 02-776 Warsaw, Poland
3
Department of Gastronomy Sciences and Functional Foods, Poznań University of Life Sciences (PULS), Wojska Polskiego Str 28, 60-637 Poznań, Poland
4
Institute of Environmental Protection—National Research Institute (IEP-NRI), Krucza Str 5/11D, 00-548 Warsaw, Poland
*
Author to whom correspondence should be addressed.
Submission received: 28 November 2020 / Revised: 23 December 2020 / Accepted: 26 December 2020 / Published: 30 December 2020

Abstract

:
Food losses and waste are associated with inefficient use of agricultural land, water and other resources and agricultural raw materials. Reducing the scale of food wastage is one of the most urgent challenges for food system operators, starting from agriculture to food consumption in the households. This is all the more urgent as food insecurity has deepened during the COVID-19 pandemic. There are few studies on how to reduce food losses in food processing sectors, as most researchers focus on the demand side of the market, especially within household consumption. To fill the knowledge gaps related to the inefficient production system in the baking and confectionery industry (BCI), research was conducted to estimate the scale of losses in BCI in Poland, determine their causes and assess the risk of their occurrence, identify retrieve points (RP) and ways of reducing and preventing losses. Two research methods were used. Quantitative data were collected using an Internet survey method on a sample of 48 bakeries. The qualitative data was provided by 5 individual in-depth interviews with experts from the surveyed industry. The results showed that the total scale of losses in Polish BCI reached 2.39% (in 2017) and 2.63% (in 2018) of the weight of manufactured products. The loss analysis was presented within respective sections of production: raw materials magazine (RMM), production section (PS), final product magazine (FPM), final product transport (FPT). The highest loss level was reported for PS—1.56% (2017), 1.85% (2018). Additionally, 12 loss risks and nine main cause categories were identified. Potential 6 retrieve points (RP) during the baking processes were indicated: making and handling intermediate products and dough; portioning and forming of dough, baking, customised packing, shipping (storage), transport by own fleet. The type of risk, the cause of losses, their consequences, and manners of preventing losses were specified for each RP. Being the first study of this kind in Poland, its results are key to build a road map for further researches focused on reduction of food losses, more sustainable management of resources in BCI. It might contribute to corporate social responsibility and value co-creation.

1. Introduction

Food wastage is one of the major problems of the modern world [1,2,3]. It has been identified as one of the greatest sources of inefficiency in the food system. According to FAO estimations, the global volume of food wastage is 1.6 Gtonnes of “primary product equivalents”, while the total wastage for edible part of foods is 1.3 Gtonnes. This amount can be weighed against total agricultural production (for food and non-food uses), which is about 6 Gtonnes [4]. Roughly one-third of all food produced for human consumption is lost or wasted globally [1]. According to other estimates, food wastage could be as high as 50% of the food produced for human consumption [5,6]. In the European Union, almost 90 million tons of food is being wasted, as shown by estimates for 2012 [7]. However, previous analyses based on 2006 data indicated that food wastage could reach a mass of 126 million tons in 2020, if no prevention policies were undertaken [8].
The total volume of food wastage provides a sense of the magnitude of the problem [9]. Preliminary assessment of the total cost of food lost or wasted on a global scale amounted to USD 2.6 trillion annually, adding up to USD 1 trillion in economic costs. USD 700 billion in environmental costs and USD 900 billion in social costs [10]. With regard to economic costs, food wastage reduces the economic efficiency of agriculture and the food industry. Food worth over USD 750 billion (based on 2009 producer prices) is lost or wasted annually [10]. Food waste results also in a reduction in the real income of market players. Disposal of unused food products also means unnecessary financial expenses and environmental pollution, which can be reduced if it takes the form of energy production.
Food wastage contributes to the environmental damage through the unjustified emission of greenhouse gases and other harmful substances released during the production of food that will not be eaten [11,12]. Globally the carbon footprint of produced and not consumed food is estimated at 4.4 billion tons of CO2 equivalent (including land use change): as such, food wastage is ranked third among the largest emitters, after the US and Chinese economies [13]. The blue water footprint (i.e., the consumption of surface and groundwater resources) of food wastage is about 250 km3, and it also mean that 1.4 billion hectares of agriculture land (28% of the world’s total resources) produce food in vain [10]. The unproductive use of land, water and other resources to produce food that will not be consumed is important in terms of preserving global biodiversity [4,14,15,16] and green food supply chain [17,18,19]. When considering division of the food chain into two areas where a raw material or a final product may be wasted, it becomes evident that the later a defined food is wasted, the more its unitary cost, and outlays on its production and the production-related operations become higher due to their accumulation alongside the multi-stage food chain [20].
Reduction of bread loss will diminish the use of resources, leading to decreased environmental burden of agricultural production. It will also have its economic implications, e.g., by reducing transport and production costs, better use of labour resources. Additionally, it will also directly contribute to enlarge the production capacity of the baking and confectionary industry, which is particularly important due to a growing human population.
On the other hand, more efficient baking and confectionary production, combined with the growing expectation of consumers, will bring the BCI to focus on high-quality products. It will create opportunities for the development of sustainable methods of agricultural production. Although they are less efficient, they reduce the environmental burden of agriculture. Additionally, it will provide high-quality raw material thanks to traditional crop varieties and contribute to biodiversity [21]. It will create opportunities for the development of sustainable methods of agricultural production [22].
In the global dimension, cereals constitute 19% of the volume of all wasted food [23]. FAO’s [1] first estimates indicated that food processing losses constitute around 13% of the entire cereal wastage mass in Europe, accounting for 0.5% of what enters the processing step in weight (strictly understood, without packaging). The cited data show that the relatively low volume of this wastage in the processing industry results from economic duress forcing them to operate frugally. On the other hand, cereals belong to the world’s few food raw materials that are resilient to spoiling and that can be stored for longer periods. This food group represents the most important source of the world’s total food [24] and, together with tubers, are the most common food staples that is routinely consumed and that constitutes a significant proportion of the calorie and nutrients requirements in an average diet [25]. In Poland, cereals and cereal products contributed 30.4% of total dietary energy supply [26].
The negative effects of food wastage also have a social dimension, as it is associated with global food insecurity for a growing world population [27]. Meanwhile, the food groups most valuable for ensuring food security and the nutritional value of the diet are being wasted the most: cereals, roots and tubers, fruit and vegetables. These three groups account for 83% of global food waste in terms of weight, with the highest proportion of fruit and vegetables (44%). Similarly, in terms of calories, these food groups account for 80%, and cereals comprise the largest share of global food loss and waste (53%) [23]. It is stated in the latest edition of “The State of Food Security and Nutrition in the World 2020” report that in 2019, the number of undernourished people (the energy value of their diet is below the minimum dietary energy requirement) continued to grow. If the recent trends are not reversed, the number of people suffering from chronic hunger will increase to 840 million in 2030, not considering the impact of the COVID-19 pandemic. The report predicts that by the end of 2020, the pandemic could lead to chronic hunger an additional 130 million people [28]. This means that global efforts to combat hunger nowadays should increasingly focus on reducing food losses and waste, in both developing and developed countries. One of the possibilities is to create more effective strategies to recover surpluses from the food supply chain and transfer them to those in need through public benefit organizations [29].
The distribution of food wastage along the food supply chain is linked to the level of economic development of countries and regions. Developing countries mainly suffer from production and post-harvest handling and storage losses, while in highly developed countries or regions food is mainly wasted at those stages in the food chain where the consumer plays an active role: in distribution and retail, in restaurants and households [1]. In households in particular, the scale of food waste is strongly correlated with the level of gross domestic product (GDP) [12].
Solely the negative effects of food losses and waste, in environmental, economic and social terms, justify the need to intensify research in this area and then undertake preventive measures. This approach also applies to the production of bread and other bakery and confectionary products, even if the research so far shows a small scale of the problem. Nowadays, in the face of the global health crisis related to COVID-19 pandemic, it is of tremendous importance when it has become clear that it is not possible to achieve the second Sustainable Development Goal (SDG) of the United Nations agenda. The SDG 2 aims to achieve “Zero hunger” by 2030 [30].
Our research on food losses in the Polish baking and confectionery industry was carried out as part of the research project “Developing a system for monitoring wasted food and an effective program to rationalise food losses and reduce food waste” (acronym PROM) within the strategic research and development programme financed by the National Centre for Research and Development [No.Gospostrateg1/385753/1/NCBR/2018]. This study was a pilot one, the first such study in Poland. A barrier in research involving companies is their reluctance to disclose the scale of the problem and to measure it.
The aim of the study, was: 1—to estimate the scale of food losses in the baking and confectionery industry in Poland, 2—to determine the causes of losses and assess the risk of losses, 3—to identify potential food recovery points and ways to reduce and prevent food losses in this industry. The results of the study are presented in this article.

Waste of Bread and Bakery Products in the Food Supply Chain—State of the Art

Research on food waste and publications focus mainly on two stages of the food supply chain, i.e., households and retail. The problem of losses in the processing phase has been identified to the smallest extent possible [7,12,31] and have even been ignored to date [32]. According to FAO publication, in the case of cereals, in medium and high-income countries in the regions of Europe and America and Oceania, the consumer phase is the stage with the largest waste, between 40–50% of total cereal wastage or 25% of the weight of cereal products that have entered this phase of the chain. For the processing stage, it is around 5% and 0.5% respectively (plus 10% for packaging) [1].
According to first estimates of food wastage in the EU, based on Eurostat data from 2006, the share of the processing sector in generating losses in the food chain (excl. primary production and post-harvest phases) was on average 39% (by weight 34.8 million tons), but high differences were observed between Member States [8]. In general, in Western countries, households generate more than half of total food wastage (the highest percentage more than 80% in Greece and Malta, more than 70% in Denmark, Germany and France, 64% in Luxembourg and 58% in the UK). But in 12 other Member States, the processing sector generates more than half of the wastage. Poland has the largest share—73%—and the same percentage is seen in Cyprus, followed by the Netherlands, Estonia, Italy and Hungary (68, 67, 65 and 62% of all food waste in these countries, respectively) [32].
The results of the second study financed by the European Commission, the FUSIONS project [7], indicate a similar scale of food wastage across EU-28 in 2012. It was found that approx. 88 million tonnes of food intended for human consumption are lost annually along the EU supply chain (starting from primary production phase). This amounts to 173 kg per person per year, the equivalent of 20% of all food produced in the EU. Greater waste within households was shown (53% of total wastage volume) and almost two times lower volume of food losses in processing phase, i.e., 16.9 million tons +/− 12.7 million tons. Its share in the total food wastage was also smaller and amounted to 19% (which results, among others, from including the entire food supply chain in the estimates). The figures correspond to an average of 22 kg of food waste for every tonne of food produced which is equivalent to a food loss of about 2%. The estimates include both edible food and inedible parts associated with food. Losses were calculated in relation to the produced food amounts instead of amount of food sold. This entails the risk that amounts going to animal feed and bio-mass or charity is included. The cost of 1490 euros per tonne of edible food loss at the processing stage was calculated on the basis of the weighted average selling prices for 233 types of food in processing and production. Researchers stressed the considerable uncertainty of estimates for the processing sector, pointing to a likely underestimation of losses. This uncertainty is due to the fact that estimations are based on only four countries data (because out of the 19 countries that sent the data, only that many were of sufficient quality and were accepted for analysis). Uncertainty is also linked to the fact that food processing sector is very heterogeneous and multi-industry, and thus loss analysis requires a separate approach in each industry [7].
The results of the research indicate large disparities in the distribution of losses and wastage in the bread supply chain. For BCI processing, loss estimates are in the range 1.2–13.68%. The size of these losses can be classified in three categories:
losses exceeding 10%—according to Khader et al. [33] in Jordan, the total loss in wheat processing was 13.68% (which includes bran fed to animals and milling loss);
losses exceeding 5% and less than 10%
-
Katajajuuri et al. [34]: losses in bread processing in Finland amounted to 6.5–8.5% and the volume was 21–25 thousand tons,
-
Polarbröd [35]: in Sweden, losses in bread processing amounted to 6.9%,
-
Brancoli et al. [36]: in Sweden, losses in bread processing amounted to 5.2%,
-
Beretta et al. [37]: in Swiss bakeries losses were 5.1%, and the authors found that almost half of the identified losses could be avoidable;
losses of less than 5%
-
Dora et al. [38]—in Belgium losses in bread processing amounted to 3.93% (data from 9 companies),
-
Stensgård and Hanssen [39]—in Norway losses in bread processing amounted to 1.2%, but the losses were calculated as a percentage of fresh bakery products.
Comparison of these data is difficult due to different research assumptions, estimation methods or the number of companies participating in the research.
Xue et al. [12] found seven papers in the global literature (published until 2015) showing the volume of losses in processing of cereals and cereal products. The publications present estimates for the years 2007–2012. The lowest losses were reported for Finland—23,000 tons, followed by Italy—246,000 tons, South Africa (three articles) 288,000 398,000 tons, and China (two articles, both from 2012) 4.50 and 14.19 million tons. The smallest reported losses per person were in China—3.33 kg, the largest—also in China, 10.51 kg. Losses in Finland and Italy were just over 4 kg/person, and in South Africa 6–8 kg/person.
Xue et al. [12] have shown that in a 4-stage supply chain (postharvest handling and storage, processing, distribution, and retailing), the greatest waste of cereals and cereals products occurs in the retail sector. Estimates of the amount of wasted cereals products in the United States showed 3.25 million tons of losses in 2008, corresponding to 10.7 kg per person [40,41]. Estimates for 2010 showed similar retail waste of 10.4 kg/person [42]. In Norway in 2009, the scale of retail waste was incomparably lower, as 0.77 kg/person was shown [43]. According to Brancoli et al. [36] bread waste was calculated to be 80,410 tons per year in Sweden, the equivalent of 8.1 kg/person/year, and was found to be concentrated at households and in retail, specifically at the supplier-retailer interface.
Food rejection practices in supermarkets, such as take-back agreements (TBAs), have long been identified as risk factors for food waste generation at the supplier-retailer interface [44]. TBAs allow the responsibility for wasting bread to be transferred to the producer/supplier—the retailer only pays for sold products and the supplier bears the cost of the unsold products and their collection and disposal [36,44,45,46]. This form of reverse supply chain emanates from extended producer responsibility [46]. The root causes of food waste in retail sector are also related to consumer preferences and behaviours [47], erratic demand, inefficient store operations and replenishment policies, and elevated product (quality) requirements of both retail companies and customers. These causes differ across store formats and product categories [48]. Alhonnoro et al. [49] adopt the Actor-Network Theory to find out the causes of wasting bread in retail sector by focusing not only on human actors, but also on non-human actors participating in the production and/or reduction of food waste Among non-human players, three categories were analysed: bread as a commodity and its packaging, the natural-temporal actors (weather, animals, seasons etc.), and techno-material actors (technological systems and devices in place of sale, spatial arrangements, waste trolley etc.). This distributed agency approach provides novel insights into how food waste occurs in a retail outlets and how we should manage them. The highest potential for the reduction of post-farm environmental impact of production and consumption of bread lies in reducing product wastage at the retail and consumer stages [47].

2. Materials and Methods

2.1. Data Collection

Two different data collection methods were used in that study. Quantitative data were collected through the on-line survey by the Institute of Environmental Protection—National Research Institute (IEP-NRI) using the LimeSurvey system. The survey was conducted in the period from 2 January to 20 February 2020. The scope of the research covered the two years 2017 and 2018. A group of 48 baking and confectionery companies provided correctly completed questionnaires which were used for further analysis. The quantitative stage was supplemented with qualitative research.
In order to prepare for the quantitative stage, first, the analysis of European Commission documents and recommendations regards food losses was conducted. Afterwards, the online survey method was selected as a method of data collection, as this approach is proposed by EU Commission in the decision from 3 May 2019 related to the Directive 2008/98/EC of the European Parliament and of the Council of 19 November 2008 on waste and repealing certain Directives. The questionnaire was developed by IEP-NRI and then sent for review to the institutions participating in the PROM project and to the Ministry of Agriculture and Rural Development. After final approval by the steering committee of the PROM project, the questionnaire was sent to the target group.
The questionnaire consisted of 30 substantive and 10 ‘metric’ questions concerning basic information about the surveyed companies. At the beginning of the questionnaire, two definitions were presented:
(1)
food: raw materials and food products for human consumption,
(2)
food waste: raw materials and food products and products made from them which, despite their original intended use for human consumption, are not suitable/were not used as food (change of use).
It was also announced that the survey concerns only one processing plant in a given location (i.e., not the entire group). The subject of the survey were companies from the Polish baking and confectionery industry (sector name according to NACE—the Statistical Classification of Economic Activities in the EU), i.e., entities of the secondary food processing sections which produce bakery and/or confectionery products, offering food products made from cereal milling products to the market.
The second phase of data collection was designed to provide a wider understanding of the studied phenomena and to identify opportunities of reducing food losses. As we combined two research methods, for such a case, as Yin [50] suggests, a great expertise is required to bring a proper understanding of the terminology and processes in the research topic. For that purpose, we collaborated with five experts who deal with the baking and confectionary industry on a daily base. Discussions with experts focused on their opinions regards the pre-prepared concept of tools and actions undertaken to reduce losses in baking and confectionery processing plants. This concept was prepared by the authors based on the literature and previous experiences.
The group of experts represented various fields of experience related to bread production (e.g., production technologists with many years of experience, auditors with more than 15 years of experience in quality management systems, senior managers responsible for production).
The single expert discussion lasted from 1 to 2.5 h. Discussions results were then, transcripted and coded. Based on that, the final version of the manners of limiting losses in baking and confectionery processing plants were prepared. This stage contributed significantly to the whole study as allow to revision of the initial concept and adjust it to the practical conditions.
The survey’s questionnaire (Appendix A) was made available from the servers of the Institute of Environmental Protection of the National Research Institute, which guaranteed the safety and confidentiality of the collected data. Since none of the questions concerned identifying information, the survey was completely anonymous. The study’s organizer published an invitation to participate in the study at their website and attached a detailed instruction on how to fill in the survey’s questionnaire. Working with the survey was convenient due to the possibility of saving the recorded data and loading an unfinished questionnaire. This way the respondents could interrupt filling it in at any time and continue working with it at their convenience. The data were saved automatically when respondents returned to fill their survey in later. It was also possible to go back to the already filled in pages and to change the recorded data. Numerical or descriptive data had to be put in the relevant sections of the survey, pursuant to the information presented in the headers of respective questions. The questionnaire consisted of Section 1—the data about the enterprise and Section 2—the data about the volume, causes and manners of managing losses, in relation to each department in an enterprise. The questions about the volume of losses were open-ended, while the questions about the causes of losses and manners of managing them had a list of predefined responses and an “other” response that had to be expanded by the respondent. If a particular section was not active in a plant or if a question was not applicable to a company, “0” (zero) had to be recorded in this section. The organizer attached a list of contacts competent to provide additional instructions for potential respondents participating in the study.

Survey Questionnaire and the CAWI Method as a Tool for Measuring Food Losses

The Computer-Assisted Web Interview (CAWI) method assumes that the examined companies have already take up activities or are aware of the existence of the problem of food losses, which allows them to assess the said losses. In practice that means the application of the mass balance method or the direct measurement method. The common availability of information technologies (IT) solutions makes it possible to take advantage of the benefits of the possibility of web-bases data collection. These include low cost, the convenience of conducting studies and the access to a specific group of entities with desired features (who satisfy the participation criteria). The method’s main limitation comes from the difficulty in obtaining a representative sample. The limitation related to the correctness of loss estimation is connected with the method’s sensitivity to systematic errors resulting from inaccurate recording. The loss volume declarations come from the applied monitoring method. The data collected from the examined entities via questionnaires (or interviews) may have varying levels of errors. This makes it difficult to assess the accuracy of estimates. The examination tool should feature internal verification mechanisms, e.g., the mass of losses at the level of causes and management should be equal. Another limitation may come from the fact that numerous entities will not declare losses openly; it is rather clear that due to the nature of the technological process, a situation where there are no losses is impossible. Jörissen et al. [51] draw attention to the problems in obtaining reliable data from surveys, resulting, among else, from the respondent’s willingness to present themselves in the best possible light (also just for themselves). Strotmann et al. [52] have related the same behaviour to companies, especially small-size companies.

2.2. The Study’s Subject Scope

The boundaries of the food processing phase in the food supply chain have been assumed following the definition used in the FUSIONS project [7,53]. The entry point to the processing link is located at the gate to the processing plant, where raw materials are received. All sections, processes and actions within operating activity, which are performed in order to obtain a final product, were taken into account. The end-point of the processing cell is located at the gate, when the final products are leaving the processing plants.
The survey questionnaire also contained a question about losses in own fleet transport, since an assumption was made that losses may appear from the moment the final goods leave the production plant until they are received by a wholesaler/retailer/end buyer, including storage, picking (e.g., in logistics centres), loading and unloading.
The BCI enjoys a special place in Poland’s food economy. This stems from the fundamental importance of bread, as staple food, in the daily nutrition of nearly all Poles, consumed in our culture in vast quantities. The consumption of bread in Polish households reaches close to 3 kg/person in a month, which is over a half of all cereal products consumed (55% in 2019) [54]. Bread (as a food group) provides 21.9% of the energy in the average Polish diet, 36.3% of carbohydrates, 16.5 of protein and 8.1% of fat, as well as has a significant contribution to make the supply of the manganese (48.6%), iron, copper, magnesium, zinc (21.1%), folate (20.7%) and thiamine (17.4%) [26].
The important role of the BCI is also evident from the number of employed personnel and a high volume of sales [55,56]. Such enterprises make up nearly 40% of all companies operating in the Polish food industry, which needs to be accepted as an indication of the high fragmentation of the BCI. Currently, large companies represent only 2% of baking entities population still the presence of small companies is significant. This is confirmed by the structure of entities in food processing, by the number of employees and on the basis of the data from the register of economic operators. Of the total 12,172 companies, micro-enterprises accounted for 77.7%, small-size enterprises accounted for 20.5%, medium-size enterprises accounted for 1.7% and large enterprises accounted only for 0.15% [57].

2.3. Sample

The survey was attended by 59 companies located throughout the country. After preliminary analysis of the completed questionnaires, 11 were rejected due to deficiencies. Finally, data from 48 companies were analysed.
The fragmentation of the BCI is reflected in the economic size of businesses that participated in the original study. The study was dominated by micro-enterprises and small-size enterprises, which together made up 79% of the sample. The medium-size and large companies were represented by 10 businesses (Table 1). The examined enterprises produced a varied range of baking and confectionary products, with the production profile having slightly grew in 2018. Fresh bread was the dominating product. Every two out of the three examined enterprises produced fresh cakes and pastry products and every fourth one produced durable pastries.

2.4. Methods

The choice of method for measuring food losses was made on the basis of the guidelines set out in the Commission Delegated Decision (EU) 2019/1597 of 3 May 2019 supplementing Directive 2008/98/EC of the European Parliament and of the Council as regards a common methodology and minimum quality requirements for the uniform measurement of levels of food waste [58]. The Decision enables the application of many methods for measuring and analysis of the level of the food waste that is generated, performance of the studies and utilization of the data, gathered for the needs of other systems, including for the need of the waste statistics or the duties of reporting by the enterprises [59].
Quantitative data were collected using a structured questionnaire, divided into 5 thematic blocks concerning: (1) information about the enterprise and its production profile; (2) size, causes and methods of managing losses in raw materials magazine; (3) size, causes and methods of managing losses in production section; (4) size, causes and methods of managing losses in final product magazine; (5) size, causes and methods of managing losses generated during own fleet transport of final products. The questionnaire indicated various options for the causes of losses and ways of managing losses, but in each case the respondents could name others in the “miscellaneous” section.
The applied approach allowed to verify results obtained during each production stage and to better understand the existing problems with the help of information provided in the questionnaires.
To analyse the risk related to the generation of food losses in the BCI, an assumption was made according to which the risk is understood as an event or circumstances where a loss occurs (or products are wasted). Causes of occurring and consequences for the market were determined for the presented types of risk. Subsequently, possibilities of correcting risks and preventing losses in baking and confectionary enterprises were shown.
For events and circumstances where losses may be generated (or baking and confectionary products may be wasted), following the analysis, the related risks were evaluated, the significance level of each identified risk was assessed, taking into account the possible threats to consumers’ health, and in relation to the volume of losses (which matters for the enterprises, the sector, the entire economy, the environment and ultimately the planet).
Based on the risk significance level [60] in the evaluation of the phenomenon of food losses and waste, the risk was categorised with the following assumptions: (a) insignificant risk that causes minor losses, is hard to eliminate and results from the technology of production of bread and pastries, constitutes level 1; (b) risk of moderate significance which can be limited constitutes level 2; (c) very significant risk which is hard to eliminate and threatens consumers’ health or causes serious losses constitutes level 3.

2.5. Data Analysis

The loss analysis was presented in a manner that reflects the consecutive stages of the technological process within respective sections of a baking and confectionary processing company: raw materials magazine (RMM), production section (PS), final product magazine (FPM), final product transport (FPT). The volume of losses was determined in per cents as the relation of the total mass of losses to the total mass of products (raw materials) declared by all examined enterprises. The causes of losses and ways of managing them were specified for each section. Possibilities of limiting food losses and potential retrieve points were identified taking into account the specific nature of activities and operations taken at every stage of the production process in baking and confectionary production plants.
In the discussion of the results, elements of descriptive statistics, such as mean, standard deviation (SD) and coefficient of variation were used. The percentage share of correct answers was calculated. All tests were performed using Statistica 12.1. PL (StatSoft, Cracow, Poland).
In order to verify the hypothesis about the statistical significance of differences between 2017 and 2018 in terms of the frequency of causes and the frequency of various methods of managing losses, we used a test for fractions [61]. P-value statistics higher than 0.05 inform there is no significant difference. To compare the structures of the causes frequencies and their management in 2017 and 2018, the Renkonen structure similarity index was employed [62]:
p i j = k = 1 m m i n p k i , p k j
where:
  • i, j—years 2017 and 2018,
  • k—categories of causes,
  • pki,pkj—percentage of cases in 2017 and 2018.
If the value of the similarity index is 100% there is no difference between compared structures.

3. Results

3.1. Volume of Losses in the Examined Enterprises

Nearly half of the examined enterprises did not declare losses occurring at the level of RMM (Table 2). In most cases, the enterprises that declared losses estimated them at no more than 1%. The share of losses of raw materials accepted to RMM was 0.13% of the total mass of accepted raw materials in 2017 and 0.12% in 2018.
No losses in production sections were declared by slightly fewer enterprises than in the case of storage losses, namely 42% and 40% of the enterprises examined in 2017 and 2018, respectively. However, the share of enterprises reporting losses over 1% grew, to 17% and 19% in these years, respectively. The declared volume of losses in production sections was the highest among the four individual operating sections of bakeries, their share reaching 1.56% and 1.85% of the total mass of goods produced in 2017 and 2018, respectively.
On the other hand, the losses declared at the level of the shipping section were the lowest. For both examined years, 79% of the participating enterprises did not report any losses. In most bakeries the reported losses did not exceed 1%. Consequently, only 4% and 2% of the enterprises declared losses exceeding 1%. On average, the share of losses in shipping magazines in 2017 and 2018 was 0.02% and 0.03%, respectively, of the total mass of the accepted final goods. The item “management other than losses” results from the correction caused by returns from retailers.
Determination of losses at the level of the final goods transport was only possible for deliveries made with the bakeries’ own fleet transport. Similarly to the preceding section (shipping magazine), most enterprises, 58%, did not show any losses at this level, but for 12% of the examined enterprises the volume of reported losses did not usually exceed 1%. The share of losses in own fleet transport in 2017 and 2018 was 0.68% and 0.63%, respectively, of the total mass of transported goods (Table 2).

3.2. Causes of Losses

In order to estimate the total mass of losses in the examined enterprises, an assumption was made that the percentage values obtained from individual sections apply to the mass of the produced goods. This constitutes a certain simplification, because the losses were calculated in relation to the mass of raw materials (RMM), the production volume (PS), the mass of final goods accepted to the magazine (FPM) and the mass of transported goods (FPT). However, taking into account that losses mainly occur in the production section and during the transport of final products, this not only reduces the error arising from the applied simplification, but also allows to sum up the losses and compare them. Consequently, it can be concluded that the losses in the examined enterprises reached 2.39% of the mass of goods produced in 2017 and 2.63% for 2018.
The total mass of losses in the examined enterprise reached 1210.21 tons in 2017 and 1036.10 tons in 2018 (excluding, for the shipping magazine, managing the goods other than by treating them as losses). This means that there was an average of 25.21 tons and 21.59 tons of losses per enterprise in the discussed years, respectively. Having in mind the error of estimate, we calculated the volume of losses for the entire BCI at around 307,000 tons in 2017 and 263,000 tons in 2018.
The importance for the causes of losses in 2017 and 2018 was similar as no statistically significant difference was found (p-value > 0.05), and the index of structures similarity was close to 100% for each investigated department. According to the examined enterprises, the most common causes of losses in RMM are signs of spoiling, moulding and impurities, all possibly caused by improper storage and handling or poor quality of raw materials. This reason caused the wastage of 43% and 37% of the total mass of losses in the storage, respectively for 2017 and 2018 (Table 3). The second reason of the losses were mechanical damage, which caused 13% and 15% of the mass of losses in the examined years. The representatives of the examined enterprises also declared a high importance of other causes, not present in the predefined list. The expiry of shelf life dates, human errors and the lack of acceptance or improper specification acceptance were of special note.
In the PS, two potential causes of losses named in the questionnaire, namely the failure to satisfy sanitary and hygiene condition and technical breakdowns, generated around a third of the mass of production losses (Table 3). The exception was the reporting of a lower scale of losses in 2018 (24%) due to failing to satisfy sanitary and hygiene conditions. The respondents also named numerous other causes that generated 35–38% of the mass of production losses. Of these, the following were mentioned most often: technological errors (e.g., failing to add a raw material according to the recipe, burning the product during baking), failure to satisfy quality requirements by the final products (the so-called production waste), technological problems due to inconsistent quality of raw materials, low qualifications of freshly hired and insufficiently skilled employees.
Most losses from the three pre-defined causes came from damaged packaging. These losses accounted for 27–29% of the declared, section-specific losses (Table 3). The impact of breakdowns differed significantly for the two years, reaching, respectively, 16% and 4%, which is generally substantiated by the factor’s random nature. In the respondents’ view, other causes of losses generated 48% and 57% of losses in this section. Among else, returns of unsold bread were listed.
According to the examined enterprises, the losses during own fleet transport were caused, in 85–87% cases, by errors during the process of placing orders. This means that such losses result from errors made by employees or errors attributed to order placement and handling systems. Around 10% of the losses resulted from damaged packaging of final goods. The respondents did not point to other causes of losses at this stage of operations (Table 3).

3.3. Manner of Managing Losses

The preferred manner of managing food losses in the examined enterprises was appropriating them to feed animals (Table 4). This manner accounted for managing from 55% of the mass of losses in RMM (2018) to practically 100% of losses in shipping magazines and during own fleet transport, for the two examined years. About 52% of the mass of losses in production sections was used for fodder production in 2017 and the number reached 68% in 2018. The obtained results show that during the two discussed years, the percentage of food losses uses in this environmentally beneficial manner (through prevention) increased significantly, as per the food recovery hierarchy (FRH) [58].
Industrial uses and composting was the second manner of management. This manner was only used in two departments—in RMM and PS. In this case, the changes took the opposite direction during the two examined years. The volume of losses managed in this manner decreased, from 32% to 23% in RMM, and from 38% to 25% in PS. This change should also be regarded positively, because this manner of managing losses is one of the two least required in FRH. Landfill disposal is the worst one and it was used in the same two bakery departments. However, it only applied to a much lower volume of losses, 14% and 16% of their mass in RMM, and 10% and 6% in PS.
Other manners of managing losses were indicated by only a few enterprises and they were too applied in the same two sections. This was around 7% of the volume of losses in RMM and less than 1% in PS. One of the examined enterprises declared gifting products of imperfect quality (e.g., poorly shaped or discoloured) to hospices.

3.4. Risk of Losses and Possibilities of Limiting Them

The specific nature of baking and confectionary production requires that a chronological order of operations within the process must be maintained [63,64]. Consequently, the losses depend, to a large degree, on the manner of managing certain operations and activities preceding the processing and distribution. The results of the survey and interviews with experts made it possible to analyse the occurrence of various types of the risk of losses and food wastage in bakery and confectionary enterprises. The 12 types of risks of losses were identified, taking into account the bakeries’ operating sections:
-
raw materials failing to satisfy the accepted quality criteria,
-
improper raw materials storage conditions,
-
errors during the preparation of mixtures of raw materials for specific recipes and when weighing them,
-
physical impurities,
-
improper conditions of performing individual stages of the production process,
-
unqualified and untrained employees,
-
secondary impurities,
-
improper conditions of slicing and packing,
-
improper marking or damage of the final products,
-
microbiological hazards,
-
overproduction,
-
damage during the transport of final products.
The monitoring of volumes and causes of losses should be maintained across all individual technological operations. The 11 operations can be identified during the baking of bread, 6 of which as potential food retrieve points (RP) (Figure 1).
For each RP the type of risk, the cause of losses, their consequences and manners of preventing losses were specified (Table 5).
The level of significance of the identified types of risk was evaluated for each of the stages identified as RP, having in mind its negative impact on achieving goals and performing tasks. The probability of occurrence of all types of risk was determined as foreseeable [60]. For all 6 RP’s, except storage, the level of significance of the risk was evaluated as moderately significant, namely with a possibility of limiting (level 2 of the 3 distinguished level). The risk was classified as very significant, namely difficult to eliminate and hazardous for the consumer’s health or causing serious losses (level 3, the highest one) only at the stage of shipping (storage).

4. Discussion

Food wastage studies have been extensively discussed in academic papers, with their leading issues analysed in relation to entire, basic food groups. There are far fewer papers on the issue of estimating food losses or waste for individual food commodity groups, including the BCI. We showed that the losses in this industry reached 2.39% of the mass of goods produced in 2017 and 2.63% for 2018.
These results are very flattering for the Polish baking sector, because the results of studies from other countries (Finland, Sweden, Switzerland, Belgium) show a higher percentage of bread losses at the processing stage, between 3.93 and 8.5% [34,35,36,37,38]. Only in Norway the losses were smaller (1.2%) [39], but they were calculated in relation to fresh bakery products. In volume, food losses in the Polish BCI was 307,000 tons in 2017 and decreased in the subsequent year to 263,000 tons. This volume of losses is higher than reported in Italy [65] by 25 and 7%, respectively. The losses per person were 8.1 and 6.9 kg in Poland and 4.1 kg in Italy, respectively.
The losses in the processing industry have various causes. The later a product is lost or wasted in the supply chain, the higher the costs are for the environment, due to the additive nature of impact on the environment throughout all links of the food supply chain [4,66]. Studies aiming to examine the causes of losses in food processing are, by nature, divided and there is a relative lack of studies explaining the causal mechanisms within the industry. We have identified nine categories of causes of losses based on our own quantitative research within the four considered sections of the bakery enterprise:
-
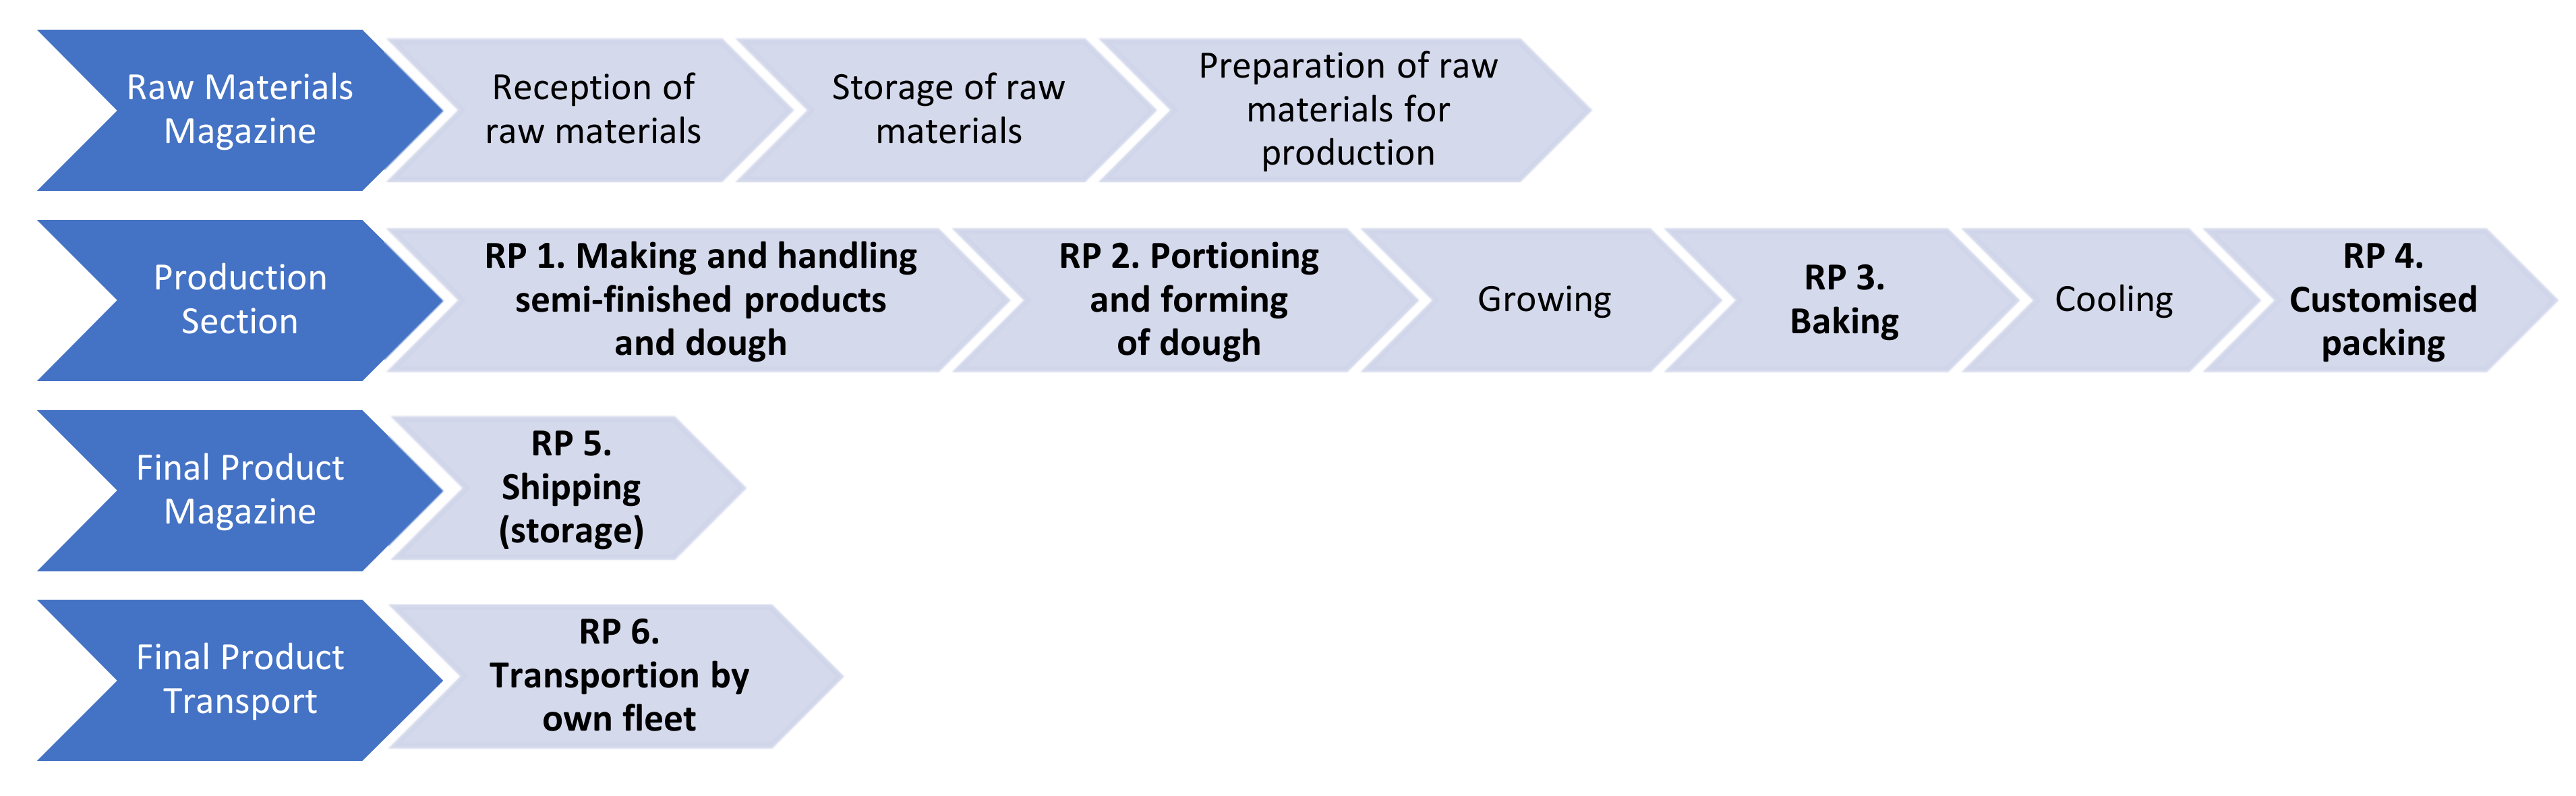
three in the RMM: mechanical damage, magazine pests, signs of spoiling, moulding and impurities;
-
two in the PS: hygiene and sanitary requirements, technical breakdowns;
-
two in the FPM: damaged packaging, hygiene and sanitary requirements/food safety hazards, technical breakdowns, and
-
four in the FPT: errors in placed orders, damaged unit packaging, technical breakdowns, incomplete collective packaging.
The main reason of wastage of baking and confectionary products in the supply chain rests in how quickly they lose freshness [52,67,68] and in the consumers’ preferences [69]. Given the short shelf life of bread and non-permanent pastry products, the time factor (as a budget and labour) in the activity of both production and trade enterprises must be the central point of attention of their managers. Situation plans, diagrams and schedules belong to the most important tools for planning and streamlining the multi-stage processes of baking bread and other bakery and pastry products [63,70] which considers the real world resource limitations (such as budget, time, labour), optimized the product resources [71]. The complex nature of the quality management process in bakery and pastry production is confirmed by Spiegel et al. and Garske et al. [72,73], who go on to emphasize the key role of human activities. Improper management of activities within the production may lead to quality problems. For example, failing to maintain the controlled temperature of pastries with unstable additives (cream, fresh fruit, meat, etc.) may lead to the proliferation of micro-organisms, in turn leading to problems related to food safety, product failures and customer complaints. The improper organisation of production activities and the distribution of goods leads to overproduction of certain product range groups, and in turn to the loss of raw materials and materials that could be used for the production of other goods, whose supply suffered shortages. This problem is also highlighted by Mena et al. [74] and Ribeiroa et al. [75]. The lack of strategy for managing losses and no vision for issues other than profit prohibit the limitation of losses and flexible approach to preventing and limiting the phenomenon.
The problem of losses in the BCI is mainly evident in ‘small and medium-sized enterprises’, where low production volumes and focus on daily operations (and often the pressure exerted by management) curb the development of efficient counteracting forms [52]. The cited authors suggest to use the so-called participatory approach which, rather than being a universal method of solving problems, is a way that enterprises can follow to address their respective losses. This method consists of four, consecutive phases in a Plan-Do-Check-Act (PDCA) cycle, also known as the Deming or Shewhart cycle.
The role of human capital on the path to limit losses plays a fundamental role in the BCI [76,77]. Many categories of causes (among else mechanical damage, presence of magazine pests, improper conditions of storage of raw materials and the quality of raw materials sent for production, such as damage during picking or wrongly picked orders) stem from the low awareness of both employees and the management, their failure to observe recipes, procedures and production instructions, work-station instructions, and sometimes from lacking engagement. No training and low knowledge of employees, low qualifications, unverified skills, high rotation of employees all lead to low awareness of both lower- and higher-tier employees. Joardder and Masud [78] point to the fact that more mechanical damage in foods is observed in developing countries as food handling and packaging are mainly accomplished manually in those countries.
Our studies confirm that losses in food processing are also related to the failure to observe hygiene and sanitary requirements, including the personnel’s work hygiene, washing and disinfection control [29]. Non-compliance with food processing hygiene may lead to the production of goods that fail to satisfy requirements and must be, consequently, removed and wasted. Ribeiro et al. [75] and Mena et al. [74] point to the problems related to management, the weight of natural causes (as a climatic condition) and market trends, as some of the conditions of generating losses and wasting food at the producer-retailer line. Buchner et al. [65] emphasise the importance of the nature of agreements binding the suppliers and distributors, including those addressing the pick-up system, among the possible causes. The withdrawal of certain products from the market, due to their failure to satisfy specific quality and safety standards, is pointed out by Buchner et al. [65]. Lewis et al. [79] and Ribeiroa et al. [75]. The causes deriving from neglecting pest protection and also the removal of solid and liquid waste were also brought up by Bilska et al. [29]. Losses at raw material storage and the final goods storage are mainly caused by: failure to secure the magazine from pests; no prophylactic actions in the field of disinfection, disinsectization and rodent control; the management’s lack of awareness of the necessity to use the services of professional pest-control companies.
The results of this study show that breakdowns constitute a category of causes that creates losses across most stages in baking and confectionary processing. The most commonly identified causes in this industry are the interruption of the cold chain due to a defect of the means of transportation, the refrigerated storage or negligence in controlling storage conditions, or inefficiency of supervision over maintaining the cold chain. The existence of such hazards is discussed by Lewis et al. [79], Capone et al. [2]. The presence of such causes may be related to the lack of supervision over the equipment and failing to adopt strategies of preventative actions in departments responsible for the proper maintenance of machinery and equipment. The operation of obsolete machinery or their poor technical condition are common causes of defects and losses. The lack of supervision over the means of transportation may also be listed as a cause (technical inspection of refrigerating units). Buchner et al. [65] and Caldeira et al. [80] confirm that technical defects in early stages of processing of farming products and semi-final products also cause losses and wastage. The results obtained by Raak et al. [31] are interesting in this regard. When asked to characterise food losses resulting directly from their operations, German enterprises active in the food and drink industry (including bread producers) stated that major problems occur infrequently. Such issues would occur fewer than twice a year, e.g., due to power shortage or equipment defect and, consequently, the related material losses were minimal.
The best possible, optimal management of food losses is a significant problem in the context of sustainable development challenges and the concern for the planet and future generations. The common approach model is the food recovery hierarchy [81], called food waste hierarchy or waste management hierarchy [58] or food wastage hierarchy in EU studies [82]. There are two groups of activities within a hierarchy: waste prevention and waste treatment. Environmental and social benefits of different management options depend significantly on local conditions, such as population density and proximity to other industries and farms.
One of the ways of managing losses is burning the bread to reclaim energy, as mentioned by Vandermeersch et al. [83] and Kot el at. [84], ranking as one of the less preferred waste treatment possibilities. The following are solutions used by baking and confectionary enterprises participating in the study, listed from the most commonly used ones: use for fodder production, use in biogas plants, use as biofuel (energy production), composting and, occasionally, disposal to a landfill. A new use has been discussed recently in reference sources, namely fermenting the wasted bread with the help of microorganisms, in order to generate energy [85,86].
Surveyed companies declared combating the wastage of the produced bread by appropriating it for social needs, to feed people. Such solutions are the most desired ones (at the top tier of FRC) and it is exactly this possibility that we are pointing to in 5 RP for every six cases of identified risk. Many papers are promoting the saving of food at risk of wastage by appropriating it for charity purposes, including food banks [29,87]. The dynamic growth of the food-sharing movement (at the end of 2019, 29 food-sharing establishments were operating in Poland’s capital, Warsaw) may be one of the ways to limit the wastage of food fit for consumption, including bread and other bakery and confectionary products [88]. Around 84% of respondents surveyed in 2017 by the Federation of Polish Food banks [89] declared that they would shop in stores that gift the unsold food social organisations. Solutions are also being developed in the area of innovative possibilities of reusing bread in the processing industry, in turn reducing wastage costs at the level of enterprises. Innovative products such as ‘bread pudding’ and ‘olive crostini’ may be examples of using the two most popular, and still fresh, bread products in Great Britain (baguettes and batons, a type of short baguette), both coming from the largest source of food waste from bakeries operating in one of the network retailers [90].
The results of our studies clearly indicate the need to raise awareness and qualifications of employees as a method of limiting food losses. To this end, it is necessary to develop guidelines for individual enterprises, taking into account their specificity, the production profile and the scale of production (e.g., artisanal bakeries vs. industrial bakeries). The transfer of information and education may help reduce the phenomenon of losses not only for food processing enterprises, but also for other participants of the supply chain.
This paper presents a comprehensive look at the volume of losses, their underlying causes, ways of managing them in the BCI. It also shows potential risks, places and points of retrieving food. The results of our project, PROM proved helpful in developing educational materials “Handbook of Good Practices for Limiting Food Losses and Wastage in the Baking and Confectionary Industry” (Pol. Poradnik dobrych praktyk ograniczania strat i marnotrawstwa żywności w produkcji piekarsko-cukierniczej) [91]. The handbook is mostly addressed to bread and confectionary producers, to help them develop food loss management programs, but also to various organisations in the institutional environment of this industry, for use as an educational and information tool. As a part of an earlier Polish project MOST, a handbook was developed for the purpose of implementation of the “Model of Limiting Food Losses and Wastage for the Benefit of the Society” (Pol. Model Ograniczania Strat i Marnowania Żywności z Korzyścią dla Społeczeństwa) [92]. The handbook is based on operating procedures for HACCP.

5. Conclusions

The obtained results are of key importance for pursuing further research and show premises for developing road maps leading to the reduction of food losses in the BCI. The business solutions implemented in the sector’s enterprises should be rooted in the principles of corporate social responsibility and creating common value, where loss limitation is taken into account.
The completed studies reflected the scale of losses in the Polish BCI, reaching 2.39% (in 2017) and 2.63% (in 2018) of the mass of the produced goods, with the highest losses attributable to the Production Section (respectively: 1.56% and 1.85%), which puts this industry in favourable light in comparison to estimates from other countries. However, taking into account the important position of the processing sector in the Polish food and drink industry, the volume of domestic production of bread, being the outcome of the country’s population and the customarily sizeable consumption of bread, even such proportions play a role and determine the necessity to limit losses and, subsequently, to introduce optimal management. The results of the quantitative and qualitative study permitted the identification of food retrieval points in processing companies in this industry, along with the potential risks, and thus causes and consequences of losses and methods of preventing them, accompanied with recommendations of specific intervention activities.
Given its pioneer nature, the paper serves as a starting point for further considerations on the losses in the BCI industry, in the economic, environmental and organisational (technological) aspects.

Strengths and Limitations

In the future, the studies on losses in the processing area of the BCI should account for the volume of losses generated by returning the bread from retailers to the producers and suppliers. Limiting the losses in the industry due to this reason should be considered one of the most pressing problems to be solved when taking actions to limit losses in the baking and confectionary industry.

Author Contributions

Conceptualization E.G.-G., K.R., M.G., S.Ł. and J.K.-C.; methodology, S.Ł., R.Ł., E.G.-G., K.R. and M.G.; formal analysis, M.G., E.G.-G., K.R. and J.K.-C.; investigation, E.G.-G., K.R. and M.G.; writing—original draft preparation, E.G.-G., K.R. and M.G.; writing—review and editing, E.G.-G., K.R.; M.G. and J.K.-C.; visualization, M.G. and E.G.-G.; supervision, E.G.-G., K.R. and M.G.; funding acquisition, S.Ł., R.Ł., E.G.-G. and M.G. All authors have read and agreed to the published version of the manuscript.

Funding

This publication has been developed under the contract with the National Centre for Research and Development No.Gospostrateg1/385753/1/NCBR/2018 for carrying out and funding of a project implemented as part of the “The social and economic development of Poland in the conditions of globalizing markets—GOSPOSTRATEG” program called “Developing a system for monitoring wasted food and an effective program to rationalize losses and reduce food wastage” (acronym PROM).

Institutional Review Board Statement

Not applicable.

Informed Consent Statement

Not applicable.

Data Availability Statement

Not applicable.

Conflicts of Interest

The authors declare no conflict of interest.

Appendix A

Table A1. Types of data to be prepared by processing plants in the bakery and confectionery industry with regard to deliveries of raw materials, the mass of losses and their causes at various stages of the production process.
Section:Raw Materials MagazineProductionFinal Products MagazineOwn Fleet Transport of Final Products
Raw materials/product balance for every section with indication of the mass (in tons):
mass of raw materials/final products accepted to a section
mass of raw materials/products released from a section
mass of losses generated in a section/transport
number of shipments made with own fleet transport not applicable
number of shipments made with outsourced transportnot applicable
Causes of losses in a section with indication of the mass (in tons):
mechanical damage not applicable
signs of spoiling, moulding and impurities
magazine pests
hygiene and sanitary requirements, health hazardsnot applicable not applicable
technical breakdownsnot applicable
defects of unit packagingnot applicable
incomplete collective packagingnot applicable
wrong volume/type of order
miscellaneous
Manner of managing losses in a section with indication of the mass (in tons):
fodder/feeding farm animals/production of fodder
biogas plants e.g., biofuel, composting etc.
landfill
miscellaneous

References

  1. Gustavsson, J.; Cederberg, C.; Sonesson, U. Global Food Losses and Food Waste: Extent, Causes and Prevention; Study Conducted for the International Congress Save Food! At Interpack 2011, 16–17 May, Düsseldorf, Germany; Food and Agriculture Organization of the United Nations: Rome, Italy, 2011; ISBN 978-92-5-107205-9. [Google Scholar]
  2. Capone, R.; Bilali, H.; Debs, P.; Bottalico, F.; Cardone, G.; Berjan, S.; Elmenofi, G.A.; Abouabdillah, A.; Charbel, L.; Arous, S.A.; et al. Bread and Bakery Products Waste in Selected Mediterranean Arab Countries. Am. J. Food Nutr. 2016, 40–50. [Google Scholar] [CrossRef]
  3. MacDonald, A.J. Minimizing Terminal Food Waste within the Food Supply Chain; Dalhousie University: Halifax, NS, Canada, 2019. [Google Scholar]
  4. FAO. Food Wastage Footprint: Impacts on Natural Resources: Summary Report; FAO: Rome, Italy, 2013. [Google Scholar]
  5. Parfitt, J.; Barthel, M.; Macnaughton, S. Food Waste within Food Supply Chains: Quantification and Potential for Change to 2050. Philos. Trans. R. Soc. B Biol. Sci. 2010, 365, 3065–3081. [Google Scholar] [CrossRef] [PubMed] [Green Version]
  6. Fox, D.T.; Fimeche, C. Global Food: Waste Not, Want Not; Institution of Mechanical Engineers: London, UK, 2013; p. 36. [Google Scholar]
  7. FUSIONS Estimates of European Food Waste Levels. FUSIONS Reducing Food Waste through Social Innovation. Food Use for Social Innovation by Optimising Waste Prevention Strategies (FUSIONS). Swedish Environmental Research Institute: Stockholm, Sweden, 2016. Available online: https://www.eu-fusions.org/phocadownload/Publications/Estimates%20of%20European%20food%20waste%20levels.pdf (accessed on 23 November 2020).
  8. Bio Intelligence Service Preparatory Study on Food Waste across EU 27; Technical Report—2010—054; European Commission (DG ENV—Directorate C): Brussels, Belgium, 2011.
  9. The economist intelligence unit global food security index 2014: An annual measure of the state of global food security. In Special Report: Food Loss and Its Intersection with Food Security; The Economist Intelligence Unit: London, UK, 2014.
  10. Food Wastage Footprint Food Wastage Footprint Full-Cost Accounting: Final Report; Food Wastage Footprint: Rome, Italy, 2014.
  11. Scholz, K.; Eriksson, M.; Strid, I. Carbon footprint of supermarket food waste. Resour. Conserv. Recycl. 2015, 94, 56–65. [Google Scholar] [CrossRef]
  12. Xue, L.; Liu, G.; Parfitt, J.; Liu, X.; Van Herpen, E.; Stenmarck, Å.; O’Connor, C.; Östergren, K.; Cheng, S. Missing Food, Missing Data? A critical review of global food losses and food waste data. Environ. Sci. Technol. 2017, 51, 6618–6633. [Google Scholar] [CrossRef]
  13. FAO. Food Wastage Footprint & Climate Change. FAO: Rome, Italy, 2015. [Google Scholar]
  14. Feldstein, S. Wasting biodiversity: Why food waste needs to be a conservation priority. Biodiversity 2017, 18, 75–77. [Google Scholar] [CrossRef]
  15. Newsome, T.M.; Van Eeden, L.M. The effects of food waste on wildlife and humans. Sustainability 2017, 9, 1269. [Google Scholar] [CrossRef] [Green Version]
  16. Śmiglak-Krajewska, M.; Wojciechowska-Solis, J.; Viti, D. Consumers’ purchasing intentions on the legume market as evidence of sustainable behaviour. Agriculture 2020, 10, 424. [Google Scholar] [CrossRef]
  17. Matani, D.A.G.; Tripathi, M.S.; Doifode, D.S.K.; Gowardhan, S.D. Green supply chain management in food industries. Int. J. Eng. Tech. Res. IJETR 2015, 3, 2454–4698. [Google Scholar]
  18. Mogale, D.G.; Kumar, S.K.; Tiwari, M.K. Green food supply chain design considering risk and post-harvest losses: A case study. Ann Oper Res 2020, 295, 257–284. [Google Scholar] [CrossRef]
  19. Phawitpiriyakliti, C.; Keawkunti, B.; Saisama, C.; Sangma, W. Towards Environmental sustainability: A case study of green supply chain management practice. J. Secur. Sustain. Issues 2020, 9, 747–762. [Google Scholar] [CrossRef]
  20. Bilska, B.; Tomaszewska, M.; Kołożyn-Krajewska, D.; Szczepański, K.; Łaba, R.; Łaba, S. Environmental aspects of food wastage in trade – a case study. Environ. Prot. Nat. Resour. 2020, 31, 24–34. [Google Scholar] [CrossRef]
  21. Szczepanek, M.; Prus, P.; Knapowski, T. The assessment of market demand for products obtained from primary wheat forms with increased nutritional value. In Proceedings of the 27th International Scientific Conference Agrarian Perspectives XXVII ’Food Safety–Food Security’, Prague, Czech Republic, 19–20 September 2018; Czech University of Life Sciences: Prague, czech Republic, 2018; pp. 381–387. [Google Scholar]
  22. Prus, P. Sustainable farming production and its impact on the natural environment—Case study based on a selected group of farmers. In Proceedings of the International Scientific Conference “RURAL DEVELOPMENT 2017”, Kaunas, Lithuania, 23–24 November 2017; pp. 1280–1285. [Google Scholar] [CrossRef] [Green Version]
  23. Lipinski, B.; Hanson, C.; Waite, R.; Searchinger, T.; Lomax, J.; Kitinoja, L. Reducing food loss and waste. Working Paper, Installment 2 of Creating a Sustainable Food Future. Washington, DC: World Resources Institute. 2013. Available online: http://www.worldresourcesreport.org. (accessed on 23 November 2020).
  24. Klerks, M.; Bernal, M.J.; Roman, S.; Bodenstab, S.; Gil, A.; Sanchez-Siles, L.M. Infant cereals: Current status, challenges, and future opportunities for whole grains. Nutrients 2019, 11, 473. [Google Scholar] [CrossRef] [PubMed] [Green Version]
  25. Fathima, S.J.; Nallamuthu, I.; Khanum, F. 12—Vitamins and minerals fortification using nanotechnology: Bioavailability and recommended daily allowances. In Nutrient Delivery; Nanotechnology in the Agri-Food Industry; Grumezescu, A.M., Ed.; Academic Press: Cambridge, MA, USA, 2017; pp. 457–496. ISBN 978-0-12-804304-2. [Google Scholar]
  26. Laskowski, W.; Górska-Warsewicz, H.; Rejman, K.; Czeczotko, M.; Zwolińska, J. How important are cereals and cereal products in the average Polish diet? Nutrients 2019, 11, 679. [Google Scholar] [CrossRef] [PubMed] [Green Version]
  27. Pawlak, K.; Kołodziejczak, M. The role of agriculture in ensuring food security in developing countries: Considerations in the context of the problem of sustainable food production. Sustainability 2020, 12, 5488. [Google Scholar] [CrossRef]
  28. FAO; IFAD; UNICEF; WFP; WHO. The State of Food Security and Nutrition in the World 2020; FAO: Rome, Italy, 2020. [Google Scholar]
  29. Bilska, B.; Wrzosek, M.; Kołożyn-Krajewska, D.; Krajewski, K. Risk of food losses and potential of food recovery for social purposes. Waste Manag. 2016, 52, 269–277. [Google Scholar] [CrossRef]
  30. FoodDrinkEurope Every Crumb Counts; Joint Food Waste Declaration: Brussels, Belgium, 2013; Available online: https://everycrumbcounts.eu/ (accessed on 23 November 2020).
  31. Raak, N.; Symmank, C.; Zahn, S.; Aschemann-Witzel, J. Food losses in the german food industry: Insight from expert interviews. In Proceedings of the Material form 4th International ISEKI Food Conference, Vienna, Austria, 6–8 July 2016. [Google Scholar]
  32. Sheahan, M.; Barrett, C.B. Review: Food loss and waste in Sub-Saharan Africa. Food Policy 2017, 70, 1–12. [Google Scholar] [CrossRef]
  33. Khader, B.F.Y.; Yigezu, Y.A.; Duwayri, M.A.; Niane, A.A.; Shideed, K. Where in the value chain are we losing the most food? The case of wheat in Jordan. Food Sec. 2019, 11, 1009–1027. [Google Scholar] [CrossRef] [Green Version]
  34. Katajajuuri, J.-M.; Silvennoinen, K.; Hartikainen, H.; Heikkilä, L.; Reinikainen, A. Food waste in the Finnish food chain. J. Clean. Prod. 2014, 73, 322–329. [Google Scholar] [CrossRef]
  35. POLARBRÖD, A. Polarbröds Hållbarhetsredovisning. 2016. Available online: https://sverigesmiljomal.se/contentassets/700d6251720644afa32622b419f0e4bd/polarbrod-hallbarhetsredovisning.pdf (accessed on 23 November 2020).
  36. Brancolia, P.; Lundina, L.M.; Boltona, K.; Eriksson, M. Bread loss rates at the supplier-retailer interface – analysis of risk factors to support waste prevention measures. Resour. Conserv. Recycl. 2019, 147, 128–136. [Google Scholar] [CrossRef]
  37. Beretta, C.; Stoessel, F.; Baier, U.; Hellweg, S. Quantifying food losses and the potential for reduction in Switzerland. Waste Manag. 2013, 33, 764–773. [Google Scholar] [CrossRef] [Green Version]
  38. Dora, M.; Wesana, J.; Gellynck, X.; Seth, N.; Dey, B.; De Steur, H. Importance of sustainable operations in food loss: Evidence from the Belgian food processing industry. Ann Oper Res 2020, 290, 47–72. [Google Scholar] [CrossRef] [Green Version]
  39. Stensgård, A.E.; Hanssen, O.J. Food Waste in Norway 2010–2015; Final Report from the ForMat Project (No. OR.17.16); Østfoldforskning, 2016; ISBN 978-82-7520-750-8. [Google Scholar]
  40. Buzby, J.C.; Hyman, J. Total and per capita value of food loss in the United States. Food Policy 2012, 37, 561–570. [Google Scholar] [CrossRef]
  41. Hodges, R.J.; Buzby, J.C.; Bennett, B. Postharvest losses and waste in developed and less developed countries: Opportunities to Improve resource use. J. Agric. Sci. 2010, 149, 37–45. [Google Scholar] [CrossRef] [Green Version]
  42. Buzby, J.C.; Farah-Wells, H.; Hyman, J. The estimated amount, value, and calories of postharvest food losses at the retail and consumer levels in the United States. Econ. Inf. Bull. EIB-121, Econ. Res. Serv. U.S. Dep. Agri. Wash. 2014. [Google Scholar] [CrossRef] [Green Version]
  43. Stenmarck, Å.; Werge, M.; Hanssen, O.J.; Silvennoinen, K.; Katajajuuri, J.M. Initiatives on Prevention of Food Waste in the Retail and Wholesale Trades; TemaNord; Nordic Council of Ministers, 2011. Available online: http://www.refreshcoe.eu/wp-content/uploads/2017/06/B1988.pdf (accessed on 23 November 2020).
  44. Eriksson, M.; Ghosh, R.; Mattsson, L.; Ismatov, A. Take-back agreements in the perspective of food waste generation at the supplier-retailer interface. Resour. Conserv. Recycl. 2017, 122, 83–93. [Google Scholar] [CrossRef]
  45. Lebersorger, S.; Schneider, F. Food loss rates at the food retail, influencing factors and reasons as a basis for waste prevention measures. Waste Manag. 2014, 34, 1911–1919. [Google Scholar] [CrossRef]
  46. Ghosh, R.; Eriksson, M. Food waste due to retail power in supply chains: Evidence from Sweden. Glob. Food Secur. 2019, 20, 1–8. [Google Scholar] [CrossRef]
  47. Svanes, E.; Oestergaard, S.; Hanssen, O.J. Effects of packaging and food waste prevention by consumers on the environmental impact of production and consumption of bread in Norway. Sustainability 2019, 11, 43. [Google Scholar] [CrossRef] [Green Version]
  48. Teller, C.; Holweg, C.; Reiner, G.; Kotzab, H. Retail store operations and food waste. J. Clean. Prod. 2018, 185, 981–997. [Google Scholar] [CrossRef] [Green Version]
  49. Alhonnoro, L.; Leipämaa-Leskinen, H.; Syrjälä, H. Distributed agency in food waste—a focus on non-human actors in retail setting. In Food Waste Management: Solving the Wicked Problem; Närvänen, E., Mesiranta, N., Mattila, M., Heikkinen, A., Eds.; Springer International Publishing: Cham, Switzerland, 2020; pp. 141–167. ISBN 978-3-030-20561-4. [Google Scholar]
  50. Yin, R.K. Qualitative Research from Start to Finish, 1st ed.; The Guilford Press: New York, NY, USA, 2010; ISBN 978-1-60623-701-4. [Google Scholar]
  51. Jörissen, J.; Priefer, C.; Bräutigam, K.-R. Food Waste generation at household level: Results of a survey among employees of two european research centers in Italy and Germany. Sustainability 2015, 7, 2695–2715. [Google Scholar] [CrossRef] [Green Version]
  52. Strotmann, C.; Göbel, C.; Friedrich, S.; Kreyenschmidt, J.; Ritter, G.; Teitscheid, P. A participatory approach to minimizing food waste in the food industry—A manual for managers. Sustainability 2017, 9, 66. [Google Scholar] [CrossRef] [Green Version]
  53. Łaba, S. (Ed.) Straty i Marnotrawstwo Żywności w Polsce. Skala i Przyczyny Problemu; Instytut Ochrony Środowiska-Państwowy Instytut Badawczy: Warszawa, Poland, 2020; p. 127. ISBN 978-83-60312-68-1. [Google Scholar]
  54. Statistics Poland. Household Budget Survey in 2020; Statistics Poland: Warsaw, Poland, 2020; ISBN 0208–9793. [Google Scholar]
  55. Borowska, A.; Kowrygo, B. Innowacyjność produktowa na przykładzie sektora piekarskiego; SGGW: Warszawa, Poland, 2013; ISBN 978-83-7583-516-8. [Google Scholar]
  56. Goryńska-Goldmann, E.; Ratajczak, P. Polish bakery market after the year 2000. Ann. Pol. Assoc. Agric. Agribus. Econ. 2010, 12, 88–94. [Google Scholar]
  57. Statistics Poland. Household budget survey in 2019; Statistics Poland: Warsaw, Poland, 2019; ISBN 0208–9793. [Google Scholar]
  58. European Parliament. Directive 2008/98/EC of the European Parliament and of the Council of on Waste and Repealing Certain Directives (Text with EEA Relevance). EU: Brussels, Belgium, 2008. [Google Scholar]
  59. Łaba, S.; Niedek, M.; Szczepański, K.; Łaba, R.; Kamińska-Dwórznicka, A. Regulation of the food waste measuring in the EU in the light of the need of counteracting the food wastage. Environ. Prot. Nat. Resour. 2019, 30, 1–7. [Google Scholar] [CrossRef]
  60. Wróblewski, D. Zarządzanie Ryzykiem: Przegląd Wybranych Metodyk; Centrum Naukowo-Badawcze Ochrony Przeciwpożarowej im. J. Tuliszkowskiego. Państwowy Instytut Badawczy: Józefów, Poland, 2018; ISBN 978-83-948534-0-2. [Google Scholar]
  61. Freund, J.E.; Simon, G.A. Modern elementary statistics; Prentice-Hall: Englewood Cliffs, NJ, USA, 1967; Volume 256. [Google Scholar]
  62. Walesiak, M. Classification and Indicators of Economic Structures Similarity; Scientific Works of AE in Wrocław: Wrocław, Poland, 1984; pp. 57–78. [Google Scholar]
  63. Goryńska-Goldmann, E.; Ratajczak, P. Organisation of Bakery Products Production vs. Time of Consumers Supply with Bakery Products. Handel Wewn. 2013, 3, 302–310. [Google Scholar]
  64. Xing, R.X. Discussion on bread manufactures technology. Food Eng. 2007, 1, 49–50. [Google Scholar]
  65. Buchner, B.; Fischler, C.; Gustafson, E.; Reilly, J.; Riccardi, G.; Ricordi, C.; Verones, U. Food Waste: Caudses, Impact and Proposals; Barilla Center for Food and Nutrition. 2012, p. 71. Available online: https://www.barillacfn.com/m/publications/food-waste-causes-impact-proposals.pdf (accessed on 23 November 2020).
  66. FAO online food loss and waste database. Dataset of Food Loss and Waste Esti Mates from Grey Literature, National and Sectoral Reports; FAO: Rome, Italy, 2020. [Google Scholar]
  67. Ratinger, T.; Tomka, A.; Boskova, I. Sustainable consumption of bakery products; a challenge for Czech consumers and producers. Agric. Econ. Czech 2016, 62, 447–458. [Google Scholar] [CrossRef] [Green Version]
  68. Wojciechowska-Solis, J.; Śmiglak-Krajewska, M.S. Consumer education and food waste: An example of the bakery market - the case of young consumer. Eur. Res. Stud. J. 2020, 23, 89–96. [Google Scholar] [CrossRef]
  69. Østergaard, S.; Hanssen, O.J. Wasting of fresh-packed bread by consumers—influence of shopping behavior, storing, handling, and consumer preferences. Sustainability 2018, 10, 2251. [Google Scholar] [CrossRef] [Green Version]
  70. Goryńska-Goldmann, E. Standardization of the bakery goods. J. Agribus. Rural Dev. 2010, 2, 61–72. Available online: https://www1.up.poznan.pl/jard/index.php/jard/article/view/774 (accessed on 23 November 2020).
  71. Kumar, P.P. Goal Programming through bakery production. Int. J. Sci. Technol. Res. 2019, 4, 3722–3725. [Google Scholar]
  72. Van Der Spiegel, M.; Luning, P.A.; Boer, W.J.D.; Ziggers, G.W.; Jongen, W.M.F. Measuring effectiveness of food quality management in the bakery sector. Total Qual. Manag. Bus. Excel. 2006, 17, 691–708. [Google Scholar] [CrossRef] [Green Version]
  73. Garske, B.; Heyl, K.; Ekardt, F.; Weber, L.M.; Gradzka, W. Challenges of food waste governance: An assessment of european legislation on food waste and recommendations for improvement by economic instruments. Land 2020, 9, 231. [Google Scholar] [CrossRef]
  74. Mena, C.; Adenso-Diaz, B.; Yurt, O. The causes of food waste in the supplier–retailer interface: Evidences from the UK and Spain. Resour. Conserv. Recycl. 2011, 55, 648–658. [Google Scholar] [CrossRef]
  75. Ribeiroa, A.P.; Rokb, J.; Harmsena, R.; Carreóna, J.R.; Worrella, E. Food waste in an alternative food network – A case-study. Resour. Conserv. Recycl. 2019, 149, 210–219. [Google Scholar] [CrossRef]
  76. Kozera-Kowalska, M. Kapitał Intelektualny w Tworzeniu Wartości Dodanej Przedsiębiorstw Rolnych; Uniwersytet Przyrodniczy w Poznaniu: Poznań, Poland, 2017; p. 248. ISBN 978-83-7160-879-7. [Google Scholar]
  77. Jabłońska-Porzuczek, L.; Smoluk-Sikorska, J.; Kalinowski, S. The conditions of competitiveness in the confectionary and bakery industry. Intercathedra 2016, 32, 78–85. [Google Scholar]
  78. Joardder, M.U.H.; Masud, M.H. Food Preservation in Developing Countries: Challenges and Solutions; Springer International Publishing AG: Cham, Switzerland, 2019; ISBN 978-3-030-11529-6. [Google Scholar] [CrossRef]
  79. Lewis, H.; Downes, J.; Verghese, K.; Young, G. Food Waste Opportunities within the Food Wholesale and Retail Sectors; Institute for Sustainable Futures University of Technology Sydney: Sydney, NSW, Australia, 2017; pp. 1–99. [Google Scholar]
  80. Caldeira, C.; Corrado, S.; Goodwin, L.; Sala, S. Global Food Waste. Encycl. UN Sustain. Dev. Goals 2019, 1–12. [Google Scholar] [CrossRef]
  81. United States Environmental Protection Agency. Food Recovery Hierarchy. US EPA 2019. Available online: https://www.epa.gov/sustainable-management-food/food-recovery-hierarchy (accessed on 23 November 2020).
  82. Agency, S. FoodDrinkEurope. Food Wastage Hierarchy. Available online: https://www.fooddrinkeurope.eu/our-actions/foodwaste-toolkit/food-wastage-hierarchy (accessed on 23 November 2020).
  83. Vandermeersch, T.; Alvarenga, R.A.F.; Ragaert, P.; Dewulf, J. Environmental Sustainability assessment of food waste valorization options. Resour. Conserv. Recycl. 2014, 87, 57–64. [Google Scholar] [CrossRef]
  84. Kot, W.; Adamski, M.; Durczak, K. Usefulness of the bakery industry west for biogas production. J. Res. Appl. Agric. Eng. 2015, 60, 43–45. [Google Scholar]
  85. Adessi, A.; Venturi, M.; Candeliere, F.; Galli, V.; Granchi, L.; De Philippis, R. Bread wastes to energy: Sequential lactic and photo-fermentation for hydrogen production. Int. J. Hydrog. Energy 2018, 43, 9569–9576. [Google Scholar] [CrossRef]
  86. Salihoglu, G.; Salihoglu, N.K.; Ucaroglu, S.; Banar, M. Food loss and waste management in Turkey. Bioresour Technol 2018, 248, 88–99. [Google Scholar] [CrossRef]
  87. Wielicka-Regulska, A.; Mitmańska, Ż.; Kiss, M. Rola i Aktywność Banków Żywności w Ograniczaniu Strat Żywności i Niedożywienia w Polsce. Handel Wewn. 2018, 3, 395–405. [Google Scholar]
  88. Sapała, M. Na Marne; Czarne: Wołowiec, Poland, 2019; ISBN 978-83-8049-873-0. [Google Scholar]
  89. Borowski, M. Przeciwdziałanie Marnowaniu Żywności to Wspólna Odpowiedzialność. In Forum Odpowiedzialnego Biznesu: 17 Wyzwań Dla Polski – 17 Odpowiedzi: Co Firmy w Polsce Mogą Zrobić Dla Realizacji Celów Zrównoważonego Rozwoju? FOB: Warszawa, Poland, 2018. [Google Scholar]
  90. Deonath, G. UK’s largest supermarket chain will turn unsold bread into new products to fight food waste. Available online: https://www.globalcitizen.org/fr/content/uk-supermarket-chain-fight-food-waste/ (accessed on 23 November 2020).
  91. Łaba, S.; Goryńska-Goldmann, E. Poradnik Dobrych Praktyk Ograniczania Strat i Marnotrawstwa Żywności w Produkcji Piekarsko-Cukierniczej; Instytut Ochrony Środowiska – Państwowy Instytut Badawczy: Warszawa, Poland, 2020; Available online: https://ios.edu.pl/wp-content/uploads/2017/11/PROM-Poradnik-produkcja-piekarsko-cukiernicza.pdf (accessed on 23 November 2020)pp. 1–40. ISBN 978-83-60312-73-5.
  92. Bilska, B.; Kołożyn-Krajewska, D. Model Ograniczania Strat i Marnowania Żywności z Korzyścią Dla Społeczeństwa (MOST): Przewodnik Wdrażania; PTTŻ: Kraków, Poland, 2016; Available online: https://bankizywnosci.pl/wp-content/uploads/2018/01/4_procedura-MOST.pdf (accessed on 23 November 2020).
Figure 1. Bread baking operations with potential RP’s highlighted (in bold).
Agriculture 11 00019 g001
Table 1. The profile of baking and confectionary enterprises participating in the survey.
VariableCharacteristicsNumber of Entities%
Category of enterpriseMicro 1–9 employees1735.42
Small 10–49 employees2143.74
Average 50–249 employees816.67
Large 250 and more24.17
Total48100.00
Number of entities declared products from selected products categories%%
2017 *2018 *2017 *2018 *
Product categoriesBread 383879.1779.17
Pastry product, fresh323366.6768.75
Confectionery 282958.3360.42
Durable pastries 121325.0027.08
Other baking products7814.5816.67
Total 117121243.75252.08
* each company declared product assortment for 2017 and 2018, each entity might declared more than one product category.
Table 2. Declared level and volume of losses in individual operating sections in the examined enterprises.
Declared
Level of Losses
Percentage of Enterprises (%) Volume of LossesTotal Volume of Losses
201720182017 2018
Raw Materials Magazine (RMM)
No losses47.9245.83 Total mass of received raw materials (tons)46,056.6643,736.52
<0.99%43.7543.75Total mass of losses in magazine (tons)61.6454.11
≥ 1%8.3310.42Share of losses (%)0.130.12
Total100.00100.00
Production Section (PS)
No losses41.6739.58 Total mass of received raw materials (tons)61,565.0843,409.35
<0.99%39.5839.58Total mass of losses in magazine (tons)959.77804.76
≥1%16.6718.75Share of losses (%)1.561.85
No response2.082.08
Total100.00100.00
Final Product Magazine (FPM)
No losses79.1779.17 Total mass of final products received in the magazine (tons)59,177.7740,259.25
<0.99%16.6718.75Total mass of final products issued from the magazine (tons)49,447.5430,485.62
≥1%4.172.08Management other than losses (mass of accepted products minus mass of issued products) (tons)9730.239773.63
Total100.00100.00Mass of losses 11.9310.93
Share of losses (%)0.020.03
Final Product Transport (FPT)
No losses58.3358.33 Total mass of transported products (tons)26,091.4526,285.92
<0.99%12.5012.50Total mass of losses (tons)176.87166.30
≥1%6.256.25Share of losses (%)0.680.63
No response22.9222.92
Total100.00100.00
Table 3. Reasons for losses in bakery departments indicated by the surveyed companies as a percentage (%) of the total weight of losses in a given section *.
Categories of CausesPercentage (%)
20172018
Raw Materials Magazine
Mechanical damage13.4514.77
Magazine pests2.002.42
Signs of spoiling, moulding and impurities43.3537.43
Miscellaneous41.2145.39
Total100.00100.00
Index of structure similarity94.08%
Production Section
Hygiene and sanitary requirements35.7224.14
Technical breakdowns29.0537.61
Miscellaneous35.2338.26
Total100.00100.00
Index of structure similarity88.42%
Final Product Magazine
Damaged packaging26.8229.14
Hygiene and sanitary requirements9.6010.26
Breakdowns16.013.91
Miscellaneous47.5756.68
Total100.00100.00
Index of structure similarity87.90%
Final Product Transport
Errors in placed orders85.4086.94
Damaged packaging11.559.12
Breakdowns2.973.40
Incomplete packaging0.080.54
Miscellaneous0.000.00
Total100.00100.00
Index of structure similarity97.58%
* The importance for the causes of losses in 2017 and 2018 was similar as no statistically significant difference was found, p-value vary from 0.21 to 0.91.
Table 4. Manner of managing losses in individual sections of the examined enterprises, as a percentage (%) of the total mass of losses in a department.
Manner of Managing *Raw Materials MagazineProduction SectionFinal Product Magazine Final Product Transport
20172018201720182017201820172018
Fodder/feeding farm animals47.7855.2952.2568.1999.0699.8998.0699.89
Industrial uses and composting32.0421.7037.6225.340.000.000.000.00
Moving to landfills13.6415.759.866.130.940.110.940.11
Other6.547.260.270.340.000.000.000.00
Total100.00100.00100.00100.00100.00100.00100.00100.00
Index of structure similarity89.65%84.00%99.17%99.17%
* The manner of managing losses in 2017 and 2018 was similar as no statistically significant difference was found, p-value vary from 0.11 to 0.95.
Table 5. Manners of limiting losses in baking and confectionary processing plants from the perspective of significance of the risk of losses and product wastage.
RP (Retrieve Point)RiskCausesConsequences/Character of LossesMethods of Prevention/CorrectionRecommended Actions
RP 1. Making and handling semi-finished products and doughImproper conditions of performing individual stages of the production process.
Unqualified and untrained employees.
Secondary impurities.
Improper organisation of the environment in which baking and confectionary products are made. Secondary impurities.
Human factor.
Ambient impurities—physical hazard.
Impurities caused by pests.
Contamination caused by employees due to not respect hygiene procedures.
Production losses or customer complaints.
  • Properly supervised production vicinity, elimination of damaged equipment, supervision over plastic and glass, elimination of dangerous items that may be potential sources of impurities.
  • Training for employees. Observance of GHP and GMP by employees and controllers. Health and hygiene control before commencing work, ongoing supervision. Periodical supervision, particularly concerning the observance of hygiene principles by employees. Hair nets, hygiene training for employees.
  • Medical check-ups of employees prior to employment.
  • Cleaning and disinfecting machinery and equipment according to the sanitary schedule in place, using proper agents and correct concentrations.
  • Pest control, e.g., window nets, impenetrable building, insecticide lamps, preventative activities performed and supervised by outsourced pest control specialists.
Correction of the production process, corrective actions aiming to reuse clean dough.
Baking and application as fodder.
Baking and retailing as reduced quality goods.
Application as biomass.
Lack of supervision over machinery and equipment.Improper quality of semi-finished products ready for baking.
Production losses.
  • Supervision over machinery and equipment—inspections and overhauls scheduled according to operation and maintenance documentation.
  • Observance of legal regulations on the supervision of machinery and equipment.
  • Employment of qualified employees and providing relevant training.
Correction of the production process, corrective actions aiming to reuse clean dough.
Baking and application as fodder.
Application as biomass.
RP 2. Portioning and shaping (including shaping the dough, placing it in baking moulds, cutting, forming the dough, sprinkling)Improper conditions of performing individual stages of the production process.
Unqualified and untrained employees.
Secondary impurities.
Improper conditions of production of baking and confectionery products.
Secondary impurities.
Human factor.
Ambient impurities—physical hazard. Impurities caused by pests.
Impurities caused by employees failing to observe good hygiene practices.
Production losses and customer complaints.
  • Properly supervised production vicinity, elimination of defective machinery and equipment, dangerous items that may be potential sources of impurities. Reduction, to the minimal possible extent, the presence of dangerous items, e.g., glasses not allowed in the production process, staples not permitted to use, elimination of glass. Supervision over glass and plastic, daily controls and records. Control of moulds and elimination of any damaged ones.
  • Training for employees. Observance of GHP by employees and controllers. Health and hygiene control before commencing work, ongoing supervision. Periodical supervision (including the observance of hygiene principles by employees). Hair nets.
  • Medical check-ups of employees prior to employment.
  • Cleaning and disinfecting machinery and equipment according to the sanitary schedule in place, using proper agents and correct concentrations.
  • Pest control, e.g., window nets, impenetrable building, insecticide lamps, preventative activities performed and supervised by outsourced pest control specialists.
  • Daily control of raw materials for sprinkling. Established rules to eliminate cross-contamination with allergens; training for employees.
Correction of the production process, corrective actions aiming to reuse clean dough.
Baking and application as fodder.
Baking and retailing as reduced quality goods.
Use for social needs.
Improper handling of the production process.Products failing to satisfy the specified quality criteria.
Improper net weight of the weighed dough portions.
Production losses.
  • Control of the semi-finished product net weight before baking, making records from the control, daily supervision.
  • Strict observance of work position instructions.
  • Training for employees and supervision.
  • Qualified supervising personnel.
Corrective actions (e.g., adding more dough before baking).
Sale at reduced price—lower quality, lower net weight.
Use for social needs.
RP 3. BakingImproper baking conditions.
Unqualified and untrained employees.
Improper operation of the oven, no supervision over the device.Failure to observe the process parameters; oven defect.
Production losses.
  • Control of the time and temperature of baking.
  • Supervision over machinery and equipment—inspections and overhauls of the oven scheduled according to operation and maintenance documentation.
  • Training for oven operators
Sale at reduced price—lower quality.
Use for social needs.
RP 4. Customised packing (slicing, packing)Improper conditions of slicing and packing.
Secondary impurities.
Lack of supervision over machinery and equipment.Improper supervision of maintenance of slicing equipment.
Dull knives may deform or damage the sliced products and reduce the aesthetics of the goods.
Slicing losses.
  • Supervision over machinery and equipment—inspections and overhauls scheduled according to operation and maintenance documentation.
  • Training for employees.
  • Supervision over the process of packing and control before releasing the goods for sale.
Sale at reduced price—lower quality.
Use for social needs.
Internal sales.
Employees’ errors and neglect during bulk packing activities.Damage and deformation of the goods (sometimes forcing the disposal of the final goods to waste).
Losses identified during storage of the final goods or in retail.
  • Packaging of proper quality to ensure safe transport.
  • Training for employees on handling and packing the goods.
  • Supervision over the packing process.
  • Releasing safe, but reduced quality goods for sale (deformed, minimal defects, poorly shaped) at reduced prices.
Sale at reduced price—lower quality.
Use for social needs.
Internal sales.
RP 5. Shipping (storage)OverproductionOverestimation of orders.Too many final products with short shelf live stored in the magazine.
Shelf life expiration.
Production losses in the Final Product Magazine.
  • Optimizing production volume.
  • Allowing for seasonality of production.
  • Observance of FIFO rule.
Use for social needs.
RP 6. Transportion
by own fleet
Damage in transport.Improper means of transportation, unfit for transporting foodstuffs, no sanitary approval.
Improper sanitary and hygiene condition of the means of transportation.
Reduced quality of the transported goods.
Permanent damage of the final goods making them unmarketable.
Losses in transport.
  • Means of transportation certified for the transport of foodstuffs.
  • Control of temperature and sanitary condition prior to loading.
  • Training for drivers.
  • Verification of recordings from washing and disinfecting the load compartment.
  • Qualification of transport service providers.
Sale at reduced price—lower quality.
Use for social needs.
Internal sales.
Publisher’s Note: MDPI stays neutral with regard to jurisdictional claims in published maps and institutional affiliations.

