
The Role of Cooperatives in Brazilian Agricultural Production
by
 ,
,
Mateus de Carvalho Reis Neves
1,* ,
,
Felipe de Figueiredo Silva
2,
Carlos Otávio de Freitas
3 and
Marcelo José Braga
1 1
Departamento de Economia Rural, Universidade Federal de Viçosa, Edson Potsch Magalhães Building, Purdue St., Campus Universitário, Viçosa 36570-900, Brazil
2
Department of Agricultural Sciences, Clemson University, 235 McAdams Hall, Clemson, SC 29634, USA
3
Departamento de Ciências Administrativas, Universidade Federal Rural do Rio de Janeiro, BR 465 Rd., Km 07, Seropédica 23890-000, Brazil
*
Author to whom correspondence should be addressed.
Agriculture 2021, 11(10), 948; https://0-doi-org.brum.beds.ac.uk/10.3390/agriculture11100948
Submission received: 3 September 2021
/
Revised: 23 September 2021
/
Accepted: 27 September 2021
/
Published: 29 September 2021
(This article belongs to the Special Issue Agricultural Cooperative in the Face of the Challenges of Globalization, Sustainability and Digitalization)
Abstract
:Much of the established literature on agricultural cooperatives describes their myriad contributions to farmers’ economic performance. In Brazil, one of the world’s leading agricultural exporters, there were more than 1500 agricultural cooperatives with 1 million members in 2020, and in 2017, 11% of all Brazilian farms were associated with one of these cooperatives. In this paper, we estimate the factors associated with the municipality share of cooperative membership (MSCM) and how municipality-level production value changes with MSCM. Our analysis is at the municipality level using aggregate data from the 2017 Agricultural Census. We find that in Brazil, higher education and smaller property sizes are associated with membership in agricultural cooperatives. To estimate how MSCM is associated with farm profits, we use a generalized propensity score and find that an increase in MSCM increases net municipal farm income, driven mostly by an increase in the value of agricultural production compared to a smaller increase in the cost of production.
JEL:
Q12; Q13; C311. Introduction
Brazil is one of the largest net exporters of agricultural commodities in the world [1]. However, three-quarters of its agricultural sector’s income is produced by the largest farms, which represent fewer than 10% of the farms in the country [2], indicating that Brazil’s agricultural sector is composed mostly of small farms. Small farmers often encounter marketing obstacles that result in lower profits [3], and this phenomenon is particularly pronounced in developing countries, such as Brazil, where marketing channels are often characterized by market failures.
Cooperatives (although the word “cooperative” can be applied to different types of collectively developed activities, we use the term to describe a democratically controlled and managed business model. In many countries, as in Brazil, cooperatives are defined legally as a specific kind of corporation and are subject to specific national legislation [4]) can serve as an alternative marketing option, especially for small farms, and may be used to narrow this wide disparity between large and small farms [5,6,7,8,9]. Agricultural cooperatives can help farmers obtain higher prices compared to alternatives such as capital-owned firms [10,11,12,13]. These small farmers also benefit from the support provided by cooperatives for adopting better agricultural practices and new technologies, as well as from access to inputs at lower prices [14,15,16,17]. For example, members of cooperatives in the Brazilian state of Paraná were the first farms to introduce a new technology in the 1980s, so-called “no-till farming” (Portuguese: plantio direto), which minimizes the impact of cultivation on the soil [1]. In Brazil, cooperatives can have a great impact on household income. According to the Brazilian National Sample Survey of Households (PNAD) of 2014 [18], 90% of households in rural areas that reported being associated with a cooperative carried out some marketing activity through the cooperatives.
Historically, cooperatives in rural areas have been encouraged by the Brazilian government. Several articles of the Brazilian Constitution establish that the government is to encourage the creation of cooperatives; indeed, the law that regulates the operation of cooperatives highlights the role of the government in encouraging their development (Law no. 5764 of 16 December 1971 is known as the Brazilian Cooperative Law. Based on this law, the National Cooperative Policy was defined, and the legal regime of cooperative societies was instituted, in addition to other measures). In 2017, the municipality share of cooperative membership (MSCM) (The municipality share of cooperative membership (MSCM) is the ratio of farms associated with a cooperative in a municipality compared to all farms in this same municipality) was 11.42%, according to IBGE [19] data (see Table 1). Even though the number of farms is greater in the Northeastern region—home to 45% of all Brazilian farms—their contribution to the national gross value of production (11.58%) is far less than in the South (26.41%), Southeast (28.23%) and Midwest (27.07%). The number of farms associated with a cooperative follows a similar pattern, constituting almost 37% of all farms in the South. Despite these disparities, nearly 578,000 Brazilian farms are associated with a cooperative, which suggests that cooperatives may be positively related to the national gross value of production and still have room to grow (For a more comprehensive view of the heterogeneities of the Brazilian rural environment, cf. [1,20]. The paper by Neves et al. [21] conducts an initial analysis of the heterogeneity of Brazilian cooperativism in its different regions).
A number of studies have investigated the effect of cooperative membership on farmers’ production and/or income for specific regions or commodities [13,22,23,24,25]. Cazzuffi [22] found that cooperative membership increased the income of milk producers in three Italian provinces, especially among small farmers and those distant from consumer centers. Jardine et al. [23] found that cooperative membership increased the income of Alaskan fishermen. Focusing on small rural banana producers in Rwanda, Verhofstadt and Maertens [13] found that participation in cooperatives increased income. Also in Rwanda, Ortega et al. [24] found that cooperative membership increased the income of coffee producers, as well as their access to inputs. Kumse et al. [25] focused on the marketing component of cooperatives for rice farmers in Thailand and found that marketing through cooperatives had a direct effect and a spillover effect on prices.
There are also a few studies that estimate the role of cooperative membership on economic and/or technical efficiency [9,26,27,28]. Exploring the determinants of technical efficiency among farmers in the Midwestern region of Brazil, Helfand and Levine [26] found that cooperative membership is associated with increased efficiency. For coffee producers in Costa Rica, Wollni and Brümmer [27] found no effect of cooperatives on productive efficiency. For small maize producers in Nigeria, Olagunju et al. [9] found that cooperative membership increased technical production efficiency. For Brazil, Costa et al. [28] found that cooperative membership is associated (as constructed in this paper) with higher technical efficiency among family-owned farms. In another paper concerning Brazil, Neves et al. [29] estimated an agricultural production function and found a positive effect for the share of cooperative membership on the gross value of production (GVP) in the Southern and Southeastern regions, where there are more cooperative members.
In 2018, the Organization of Brazilian Cooperatives (Organização das Cooperativas Brasileiras—OCB) [30], which has more than 6000 cooperatives as members, released a request for application (RFA) to stimulate research on cooperatives (The RFA 07/2018 was carried out and conducted by the National Council for Scientific and Technological Development (CNPq), aiming to use the wide expertise of CNPq in this type of activity. It also aimed to guarantee the impartiality and absence of conflicts of interest between researchers and the research funding entity, the Organization of Brazilian Cooperatives (OCB)). One of the priority areas of the RFA was the estimation of the economic impact of cooperatives. This is also evidence of the lack of studies on the economic impact of cooperatives. In this paper, we estimate the effect of municipality share of cooperative membership (MSCM) on net income in Brazil, breaking it down into the effect on GVP production costs (e.g., wages, fertilizers, seeds, pesticides, veterinary medicines and animal feed). To estimate how MSCM is associated with farm profits, we use a generalized propensity score that allows us to control for bias from the observable characteristics of Brazilian rural establishments.
Our study contributes to the literature in that it is one of the first to analyze the role of cooperatives for all types of farms using the most recent available data from the 2017 Census of Agriculture. Although Costa et al. [28] used the same dataset, they focused on family-owned farms, whereas we consider all farms in Brazilian municipalities. Our analysis also sheds light on the drivers of the effect of MSCM on agricultural producers’ net income. Although only a few papers are studying this topic for Brazil, several studies have found a positive effect for cooperatives in other countries [13,22,23,24,25].
2. Materials and Methods
2.1. Empirical Strategy
To estimate the effect of MSCM on agricultural income in Brazil, we used the generalized propensity score (GPS) method proposed by Imbens [31]. Hirano and Imbens [32] argued that GPS accounts for the selection bias caused by observable characteristics when dealing with a continuous treatment variable. Our measure of cooperatives is the ratio of producers associated with cooperatives in each Brazilian municipality compared to all producers in the same municipality. It implies that traditional methods of treatment effect, such as propensity score matching proposed by Rosenbaum and Rubin [33], would not be adequate for this analysis, as they are applicable in situations where treatment is a dichotomous variable.
2.1.1. Generalized Propensity Score
The objective of the generalized propensity score (GPS) is to estimate an average dose-response function, which allows for the identification of the treatment effect considering different intensities of this treatment. In the context of this investigation, it allows us to identify the average effect of cooperatives for different levels of the MSCM. We first build a control group based on a vector of observable characteristics, simulating a quasi-experimental scenario.
For the application of the method, consider a sample consisting of i = 1, …, N municipalities. According to Hirano and Imbens [32], for each i, there is a set of potential results called Y (t), with t being the level of treatment, such that . The mean dose-response function can be defined as:
where determines the potential response of Y (in this research: average agricultural net income, value of production and expenses), given the level of the observed MSCM (). For each municipality i, there is a set of observable characteristics (vector ), which are considered in the estimation of the generalized propensity score (GPS). This, in turn, is obtained by the conditional density of the treatment given the vector X, . Thus, Hirano and Imbens [32] define GPS as:
The GPS and the propensity score in the PSM method both must confirm the balance property, indicating that for municipalities with the same propensity score (, the probability of presenting a certain intensity in the MSCM does not depend on the observable characteristics X. Thus, the model controls for bias due to observable heterogeneity when estimating the conditional expectation of the response variable, depending on the level of treatment and the GPS () and, subsequently, obtaining the dose-response function for a given treatment level (), as follows:
The practical implementation of this approach has three main stages. First, under the hypothesis of normality for the treatment distribution (MSCM), the is estimated by maximum likelihood:
After testing the balancing hypothesis, the second stage consists of calculating the conditional expectation of , given the treatment level and the , considering a quadratic approximation:
Although ’s parameters have no direct interpretation, their statistical significance can be considered as evidence of the existence of the bias generated by the characteristics considered [32]. Once the parameters of the second stage were obtained, in the third stage, we estimated the average dose-response function at treatment level t, as follows:
From (7), it becomes possible to obtain the average potential result of for each treatment level. That is, it is possible to identify the effect of different levels of MSCM on average agricultural net income, as well as on the value of production and expenses.
2.1.2. Data
We use the municipality-level dataset from the 2017 Brazilian Agricultural Census [19] (data on the Brazilian Agricultural Census 2017 can be retrieved from the IBGE Automatic Recovery System (Sistema IBGE de Recuperação Automática—SIDRA), accessible at <https://sidra.ibge.gov.br/pesquisa/censo-agropecuario/censo-agropecuario-2017>, accessed on 27 September 2021). We estimated the effect of the MSCM on three response variables: gross value of production, production cost and net income. The variable MSCM is a proxy for farmer engagement with cooperatives at the municipal level. To build this variable, we use the question, “Are you a member of a cooperative?” (in Portuguese, “Voce é associado de alguma cooperativa?”). The response or outcome variables of interest are net income, the gross value of agricultural production (GVP) and production costs (expenses), all in Brazilian reais—BRL (Brazilian currency). The GVP is the sum of the value for all Brazilian agricultural production in 2017, encompassing crops, livestock, forestry and types. The expenses are the sum of costs related to wages, soil correctives, fertilizers, pesticides, livestock medicines, seeds and seedlings, salt/feed and fuel, and is used as a proxy for agricultural inputs. Net income is obtained by subtracting production costs from the gross value of agricultural production.
Based on the previous literature, we account for several variables that determine MSCM: investments, experience, hired work (in the Brazilian Agri Census 2017, it is verified whether the farms have rural workers: (i) below the age of 14 and (ii) above the age of 14), education, access to credit (except from cooperatives), access to rural extension (technical assistance) (except from cooperatives), land ownership, farm size and Brazilian microregion dummies (see Table 2). To control for outliers, we dropped the top and bottom one percentile based on the municipal gross value of production, similarly to Helfand et al. [34]. Our sample consisted of 5252 municipalities in all regions of Brazil for 2017.
It is important to consider the regional differences of Brazil when analyzing the production function for the municipalities. According to Buainain et al. [35], Neves et al. [21] and Homma et al. [20], in addition to the natural conditions, the Brazilian territory presents heterogeneities arising from other factors, such as those related to the diverse agricultural products grown in different areas of the country. With this in mind, the regression is estimated by considering fixed effects at regional levels in an attempt to control for this spatial heterogeneity. To do so, the variable of interest was being regressed on dummies for each macroregion of the country (North, Northeast, Southeast and Midwest, with the South as the base category). The dummy variables take the value of 1 when the municipality belongs to a unit of the federation, and 0 otherwise. Thus, these variables are included in the model to represent the MSCM of each region in Brazil.
3. Results and Discussion
To our knowledge, the study by Costa et al. [28] is the sole existing analysis of cooperatives using the 2017 Agricultural Census (Ag. Census). Due to the dearth of studies analyzing the results of the Ag. Census, we first discuss the results of the Ag. Census before then discussing the econometric results.
3.1. Cooperative Membership in the 2017 Agricultural Census
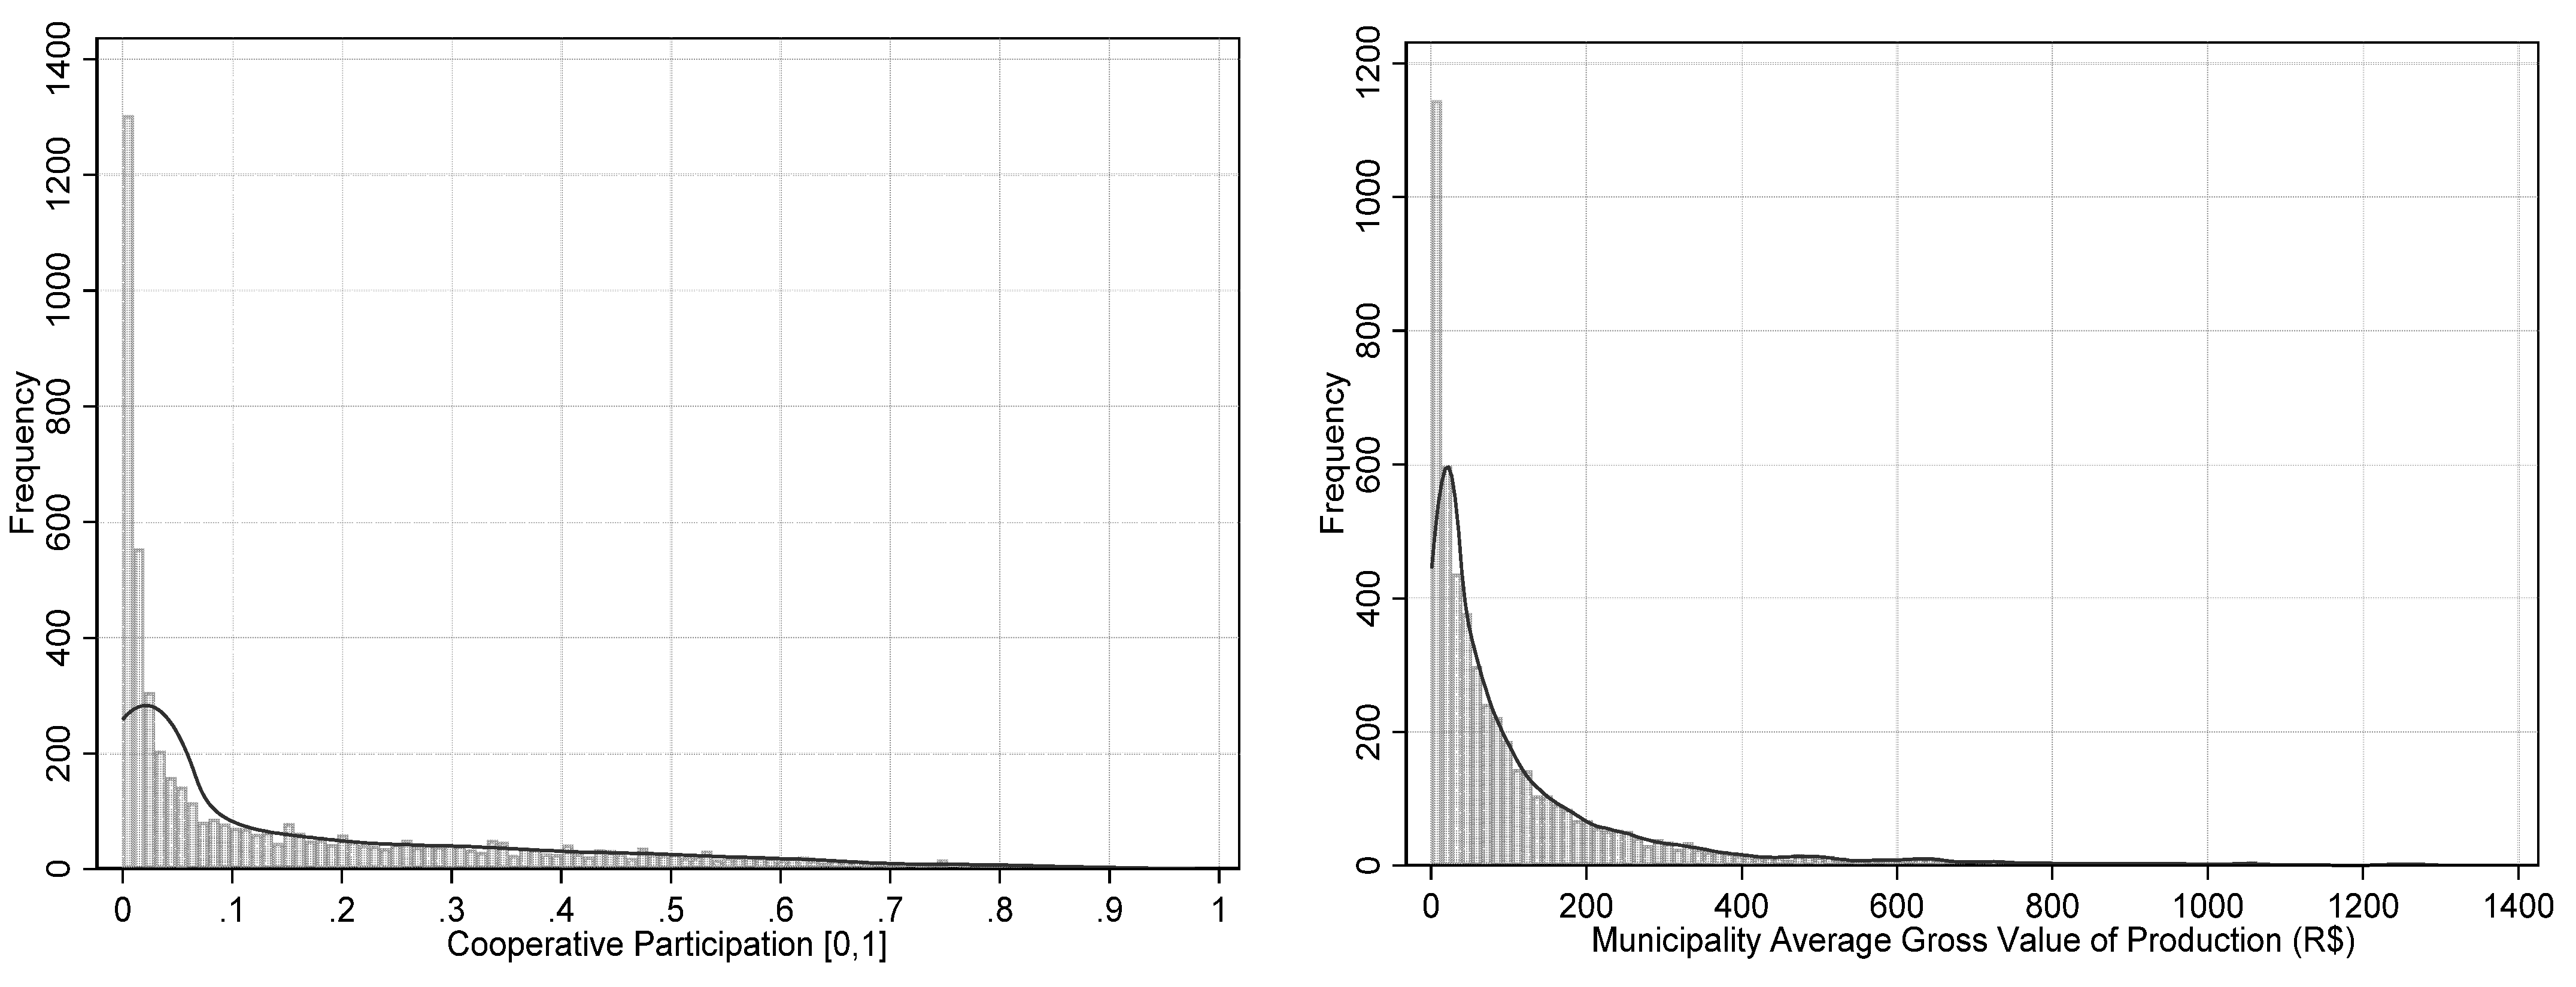
As of 2017, only 11.4% of Brazilian farms are associated with cooperatives. Figure 1 (left graph) shows the histogram of the MSCM. Most municipalities have low MSCM—indeed, almost one-third of the municipalities has a share equal to or less than 1%.
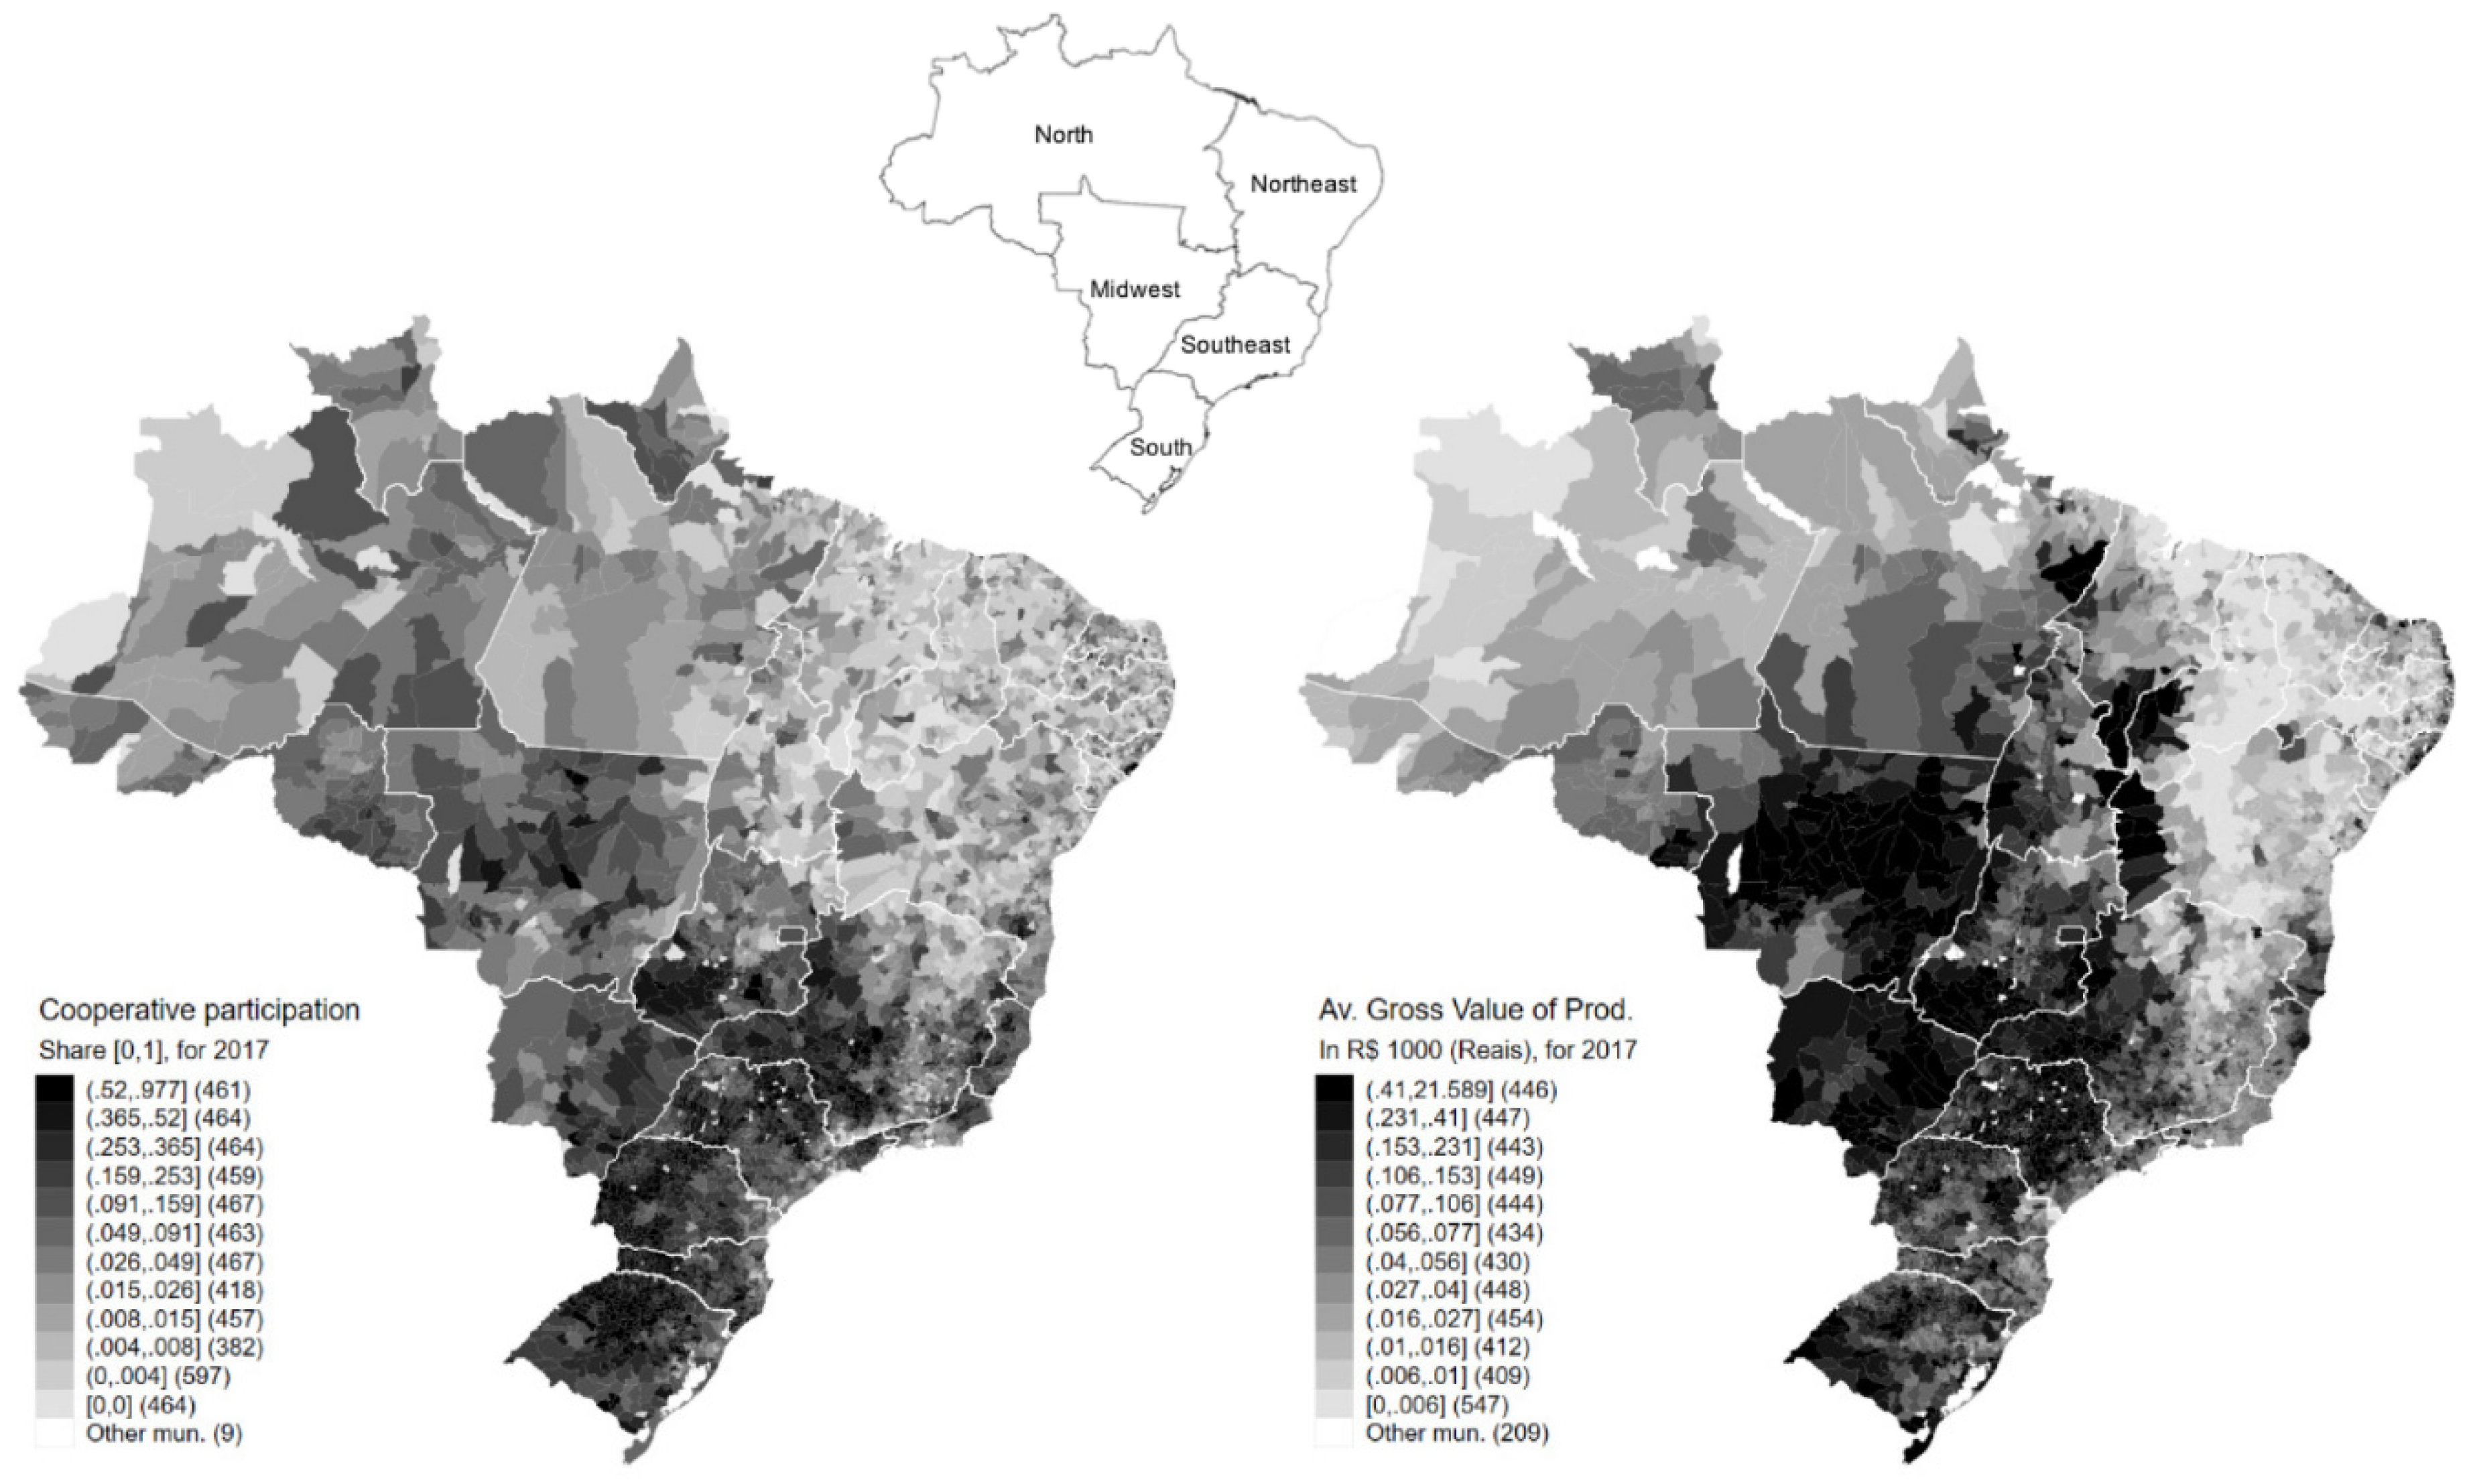
Despite the overall low MSCM, some regions of the country stand out (see Table 1). Figure 2 displays the geographic distribution of the MSCM and the GVP; both show a similar pattern. It shows that regions with greater GVP also have a greater MSCM. The economic relevance of the Southern, Southeastern and Midwestern regions to Brazil’s national agricultural production is well documented [1,2,20]. Therefore, a similar pattern in the distribution of GVP is expected. Historical factors associated with regional development of agriculture and the commodities allocation in each region play a role in the development of the Brazilian agricultural sector, which also resulted in a wide range of MSCM across the country.
An exception to this pattern, also shown in Figure 2, is the newest agricultural frontier, known as the “MATOPIBA” region, a continuous area formed by the states of Maranhão (MA), Tocantins (TO), Piauí (PI) and Bahia (BA). The predominant biome in this region is the Cerrado, characterized by high grain productivity attributable primarily to large rural estates [36] (for a characterization of the most recent agricultural frontier of Brazil, known as “MATOPIBA”, cf. Araújo et al. [36]) with a low MSCM. The Northeastern and Northern regions also show low MSCM. In the Amazon Rainforest region, even though there is no strong tendency toward cooperative membership, some cooperatives support small farms and so-called “extractivists” in their sustainable activities. These organizations have achieved good results (e.g., higher prices for members) by improving marketing capabilities and working conditions for families [37,38]. These results demonstrate the potential of using incentives such as governmental programs to increase cooperative membership in the Amazon rainforest.
The farm size, Group of Area shown in Table 2, is the municipality’s average farm size. As of 2017, 54% of Brazilian municipalities have an average farm size between 20 and 100 hectares. Fewer than 2% of municipalities have an average size greater than 500 hectares. As MSCM increases, the number of municipalities with average farm sizes of 20–100 hectares and 100–500 hectares increases. Whereas 32% of the municipalities are in the Northeast, only 8% are in the South (column labeled Overall). This distribution is inversely correlated with the average size of municipalities in each region, given that the North has large municipalities, such as Altamira with an area of 159,533 (bigger than England). In 2017, 74% of the municipalities with MSCM equal to 0 were in the Northeast, compared to less than 1% in the South. By contrast, the South and Southeast accounted for 93% of the municipalities where more than 20% of farms are associated with a cooperative.
Historically, incentives to participate in cooperatives target rural producers with small- and medium-sized farms [28]. As described by Chaddad [1], the Southeastern and Southern regions of the country, which are marked by higher levels of cooperative membership, have a land structure dominated by medium-sized farms. Whereas the Northeastern region, with low rates of cooperative membership, is the region with the smallest average farm sizes, the Midwestern and Northern regions have the largest farms.
Table 2 also shows that average labor (average number of workers older than 14 years) grows as the MSCM increases in Brazil. However, in municipalities with the highest MSCM, average labor decreases. The opposite is found for capital (in units of tractors, combine harvester, fertilizer spreader, seeder and other tools). Studies analyzing the total productivity of factors, such as Alves et al. [39], Helfand et al. [40], Gasques et al. [41] and Rada et al. [42], found that purchased inputs and capital are responsible for the greatest productivity gains in Brazil, especially on the largest farms. These production factors replace labor on many farms, mainly in the Southern, Southeastern and Midwestern regions. Valentinov [12] and Cechin [14] argue that cooperatives facilitate their members’ access to inputs and capital goods, in addition to providing access to extension and technical assistance. This may also be associated with the farmers’ investments, here measured by the value of the livestock and buildings on the farms.
3.2. Econometric Results
A more adequate analysis would consider the distribution of MSCM displayed in Figure 1. The generalized propensity score (GPS) approach allows us to represent these clusters as treatment intervals [32,43]. To do so, based on the distribution of this variable (Figure 1), we split the sample into four treatment intervals: (1) observations with MSCM within the first 0.25 percentile of the distribution, which consists of values in the range (0–0.0099); (2) observations between 0.25 and 0.50 percentiles with values in the range (0.0099–0.055); (3) observations between 0.50 and 0.90 percentiles with values in the range (0.055–0.49); and (4) observations higher than 0.90 percentile with values in the range (0.49–0.97) (Table A1, in the Appendix A, displays the test of conditional means for all treatment intervals). We estimate the effect of the share of farms that are members of a cooperative within a municipality (MSCM) on response variables.
In Table 3, we display the results for the first stage of the GPS, which yield the propensity score used in the dose-response estimation (as displayed in Figure 1, the distribution of the MSCM is skewed, which led us to use a zero-skewness log transformation on this variable to estimate the propensity score). The results of Tobit in Table 3 cannot be interpreted as marginal effects. However, the sign of these estimated parameters still indicates whether the variable contributes positively or negatively to the MSCM.
These results indicate that municipalities with higher investments in fixed capital (“Capital” in Table 3)—tractors, combine harvesters, fertilizer spreaders and seeders—are associated with greater MSCM. We find the same results for other investments, which accounts for land rental, animal purchase, transportation and logistics costs, energy cost and others. Both associations indicate that municipalities with higher investment capabilities also have greater proportions of farms associated with cooperatives. The dummy variables for the regions (using the Southern region as the base) confirm the numbers in Table 1, indicating that most of the farmers in cooperatives are in the Southern, Southeastern and Midwestern regions. Chaddad [1] and Barros [2] state that at the beginning of the 1990s, cooperatives started to assist producers in the acquisition of inputs and machinery, as well as in better management of their rural properties.
We also find that education is associated with higher levels of cooperative membership. This finding indicates that larger shares of people in a municipality who can read and write (“Literate”) and who have a college degree or higher are associated with a higher MSCM. Iliopoulos and Cook [44] and Cechin et al. [45] agreed that farmers’ levels of education influence their decision-making behavior and can affect their information levels as well. According to the authors, education is a key factor in the decisions to become a member and to remain a member, as well as to take better advantage of the opportunities within these collective organizations. At the farm level, several studies have also found a positive relationship between education and farmers’ cooperation, including Bernard and Spielman [46] for Ethiopia, Fischer and Quaim [6] and Abate [47] for Kenya, Cechin et al. [45] for Brazil, and Olagunju et al. [9] for Nigeria.
Other key variables associated with MSCM are access to credit and extension. The provision of governmental rural extension mostly targets family-owned farms but also reaches non-family-owned farms. Freitas et al. [48] found that extension was provided to all farm sizes in all regions of Brazil. Table 3 shows that MSCM is positively associated with governmental rural extension and access to credit. Furthermore, it has been reported that governmental extension service technicians sometimes seek to inform farmers about the benefits of cooperatives and encourage them to organize themselves into cooperatives [49].
MSCM also varies by region. All regions have a negative association compared to the base group: the Southern region. As shown in Table 2, more than 99% of the municipalities in the Southern region have at least one farmer associated with a cooperative. Neves et al. [29] emphasized the presence of cooperative clusters in the Southern and Southeastern regions of Brazil and argued that these organizations generate GVP gains. Furthermore, they conditioned these gains to the long history of cooperatives in these regions as well as improvements in management and governance throughout the decades. On the other hand, they also emphasize previous failed attempts to create cooperatives (top-down cooperative initiatives involving local elites resulted in cooperatives in which the members were mere employees and suppliers. In addition, many such endeavors had disastrous economic outcomes, with poor management leading to losses and the dissolution of cooperatives) in the Northeastern region as a factor that may discourage farmers from this kind of organization. Rios [50] and Silva et al. [51] also discussed these traumatic events.
We find a positive association of all groups by area (farm size) compared to the group of farms larger than 500 hectares (control group). Verhofstadt and Maertens [13] reported similar findings. According to an exhaustive literature review by Höhler and Kühl [52], farm size is the dimension most often analyzed in studies that investigate cooperatives and the heterogeneity of producers. Wiggins et al. [53] state that smaller farms are associated with higher external transaction costs because they cannot achieve economies of scale. They also assert that smaller farms have higher unit costs when purchasing inputs or obtaining credit, technical assistance, and certification services.
Our main result lies in the outcome of the dose response, shown in Figure 3, with Table A2 (in Appendix A) containing the results of the dose-response regression (second step of the GPS approach). Although not directly interpretable, the parameters obtained are used to calculate the average effect of membership in cooperatives for different levels of treatment (Figure 3). Figure 3a shows that as MSCM increases, net income also rises at an increasing rate up to the 0.30 percentile (30% of farms are members of cooperative(s) in the municipality). At the peak, there is an average gain of approximately BRL 150,000 per year per farm. After the peak, net income continues to increase as the treatment variable increases until reaching the 0.75 percentile.
The dose-response for net income does not indicate whether this gain occurs via changes in GVP (Figure 3b) or production costs (Figure 3c). We find a similar pattern for these two other variables, but a higher increase in the average GVP compared to the increase in the average production costs, yielding a positive impact on net income. Zhang et al. [11] and Valentinov [12] argued that cooperatives can lead to an increase in the value of production, possibly driven by an increase in production and prices obtained, which may be determined by greater access to modern inputs.
Our results on GVP are also supported by previous research using PSM at the farm level. Fischer and Qaim [6] found a positive effect on income for Kenyan banana producers. Wossen et al. [54] found an increase in the income of cassava producers in Nigeria. Hoken and Su [55] and Liu et al. [56] also found similar results for Chinese rice producers. Kumar et al. [57], using an endogenous switching regression, found that milk producers in India achieved an increase in their net income. Michalek et al. [58] also found a positive effect on net income for farmers in Slovakia.
In turn, an expansion in production is expected to increase production costs, unless it is achieved solely through an increase in productivity via costless improved management practices. Helfand et al. [34] and Gasques et al. [41] showed that there has been a gain in productivity in Brazil through better use of the land. However, this has occurred mainly through the adoption of modern inputs and equipment, which ultimately increase farmers’ expenses. The optimal approach to change is to increase production costs at a slower pace than the increase in the value produced on the farms. Giannakas and Fulton [59] argued that cooperatives may promote the adoption of innovations, which can lead to both greater productivity and better use of inputs. Ortega et al. [24] documented this positive effect for coffee producers in Rwanda, where cooperative membership was linked to greater access to inputs and an increase in income.
4. Conclusions
In this paper, we estimate how municipality share of cooperative membership (MSCM) affects the value of production, production cost and net income using the generalized propensity score approach and aggregate data from the 2017 Ag. Census. We find that increases in cooperative membership share among farmers in Brazilian municipalities (MSCM) result in increases in net income, mostly driven by a greater expansion in the value of agricultural production compared to the increase in the production cost.
The findings of this study have important implications for public policies in Brazil. The results suggest that incentivizing cooperative membership may be a good instrument to improve the value of production of Brazilian farmers. Thus, public policies seeking to promote cooperatives and increase cooperative membership would have positive effects on the net income of farms. Public policies that directly and indirectly encourage and support cooperatives, such as the “Capitalization of Agricultural Cooperatives Program” (PROCAP-Agro) (program carried out by the National Bank for Economic and Social Development (BNDES). It aims to offer financing for working capital to cooperatives) [60] and the “More Cooperative Brazil Program” (Programa Brasil Mais Cooperativo) (an initiative of the Ministry of Agriculture, Livestock and Supply (MAPA), the "Brasil Mais Cooperativo Program" aims to support rural cooperatives through the provision of specialized assistance, the promotion of cooperation among cooperatives, technical training and the qualification of management, production processes and marketing) [61] can increase net income. However, farmers who are already marginalized because of low educational attainment, land access, social status and market accessibility may require additional support systems to improve their capacities, skills and resources before they can benefit from cooperative membership.
The method used in this paper does not allow us to rule out the possibility that part of these positive effects of cooperatives may be linked to spillovers caused by the presence of cooperatives’ members in the Brazilian municipalities. This method also does not account for potential endogeneity issues arising from unobserved characteristics. Future research should account for these limitations. One suggestion could be to use more than one Ag. Census, with farm-level data, and the application of methodologies that correct bias of unobservable characteristics, such as Diff-Diff.
Author Contributions
Conceptualization, M.d.C.R.N., F.d.F.S., C.O.d.F. and M.J.B.; data curation, C.O.d.F.; formal analysis, M.d.C.R.N., F.d.F.S., C.O.d.F. and M.J.B.; funding acquisition, M.d.C.R.N., F.d.F.S., C.O.d.F. and M.J.B.; methodology, M.d.C.R.N., F.d.F.S. and C.O.d.F.; project administration, M.d.C.R.N.; resources, M.d.C.R.N., F.d.F.S., C.O.d.F. and M.J.B.; software, M.d.C.R.N., F.d.F.S. and C.O.d.F.; supervision, M.d.C.R.N. and M.J.B.; Validation, M.d.C.R.N., F.d.F.S., C.O.d.F. and M.J.B.; writing—original draft, M.d.C.R.N., F.d.F.S. and C.O.d.F.; Writing—review and editing, M.d.C.R.N., F.d.F.S., C.O.d.F. and M.J.B. All authors have read and agreed to the published version of the manuscript.
Funding
This research is financed by the Chamada CNPq # 01/2018, process # 427764/2018-1 and Chamada CNPq/Sescoop # 07/2018, process # 403068/2018-5. It is also supported by OCEMG. Opinions, mistakes and omissions are the authors’ own.
Institutional Review Board Statement
Not applicable.
Informed Consent Statement
Not applicable.
Acknowledgments
Conselho Nacional de Desenvolvimento Científico e Tecnológico (CNPq), Serviço Nacional de Aprendizagem do Cooperativismo (Sescoop) e Organização das Cooperativas do Estado de Minas Gerais (OCEMG).
Conflicts of Interest
The authors declare no conflict of interest.
Appendix A

Table A1.
Test of conditional means of the pretreatment variables under the generalized propensity score, Brazil, 2017.
Table A1.
Test of conditional means of the pretreatment variables under the generalized propensity score, Brazil, 2017.
| Interval 1 | Interval 2 | Interval 3 | Interval 4 | |||||
|---|---|---|---|---|---|---|---|---|
| Mean Difference | t-Value | Mean Difference | t-Value | Mean Difference | t-Value | Mean Difference | t-Value | |
| Capital | 0.751 | 3.753 | 0.415 | 2.269 | −0.250 | −1.842 | −0.764 | −2.277 |
| Other Investments ($) | 45.439 | 3.846 | 30.718 | 2.842 | −51.770 | −6.157 | −20.581 | −1.176 |
| Land used (ha) | 7644.200 | 4.449 | 1804.300 | 1.196 | −2811.300 | −1.730 | 3330.300 | 0.911 |
| Labor (Age >14 years old) | 215.360 | 2.354 | 149.100 | 1.721 | 264.760 | 2.808 | 1062.100 | 4.757 |
| Landowner | 0.028 | 4.825 | 0.005 | 1.001 | −0.006 | −1.104 | −0.049 | −4.132 |
| Literate | 0.107 | 38.464 | 0.034 | 7.106 | −0.063 | −15.909 | −0.121 | −10.030 |
| College degree or higher | 0.037 | 10.886 | 0.001 | 0.376 | −0.027 | −11.625 | −0.012 | −2.189 |
| Experience | −0.002 | −4.733 | −0.0002 | −0.499 | 0.002 | 3.833 | 0.005 | 4.874 |
| Governmental Extension | 0.020 | 3.531 | 0.001 | 0.240 | 0.011 | 2.807 | −0.070 | −7.712 |
| Private Extension | 0.129 | 17.736 | 0.074 | 11.748 | −0.012 | −2.183 | −0.106 | −12.485 |
| Credit | 0.058 | 13.330 | 0.047 | 12.343 | −0.009 | −2.515 | −0.047 | −7.484 |
| North | −0.010 | −1.245 | −0.013 | −1.965 | −0.024 | −2.499 | 0.081 | 3.523 |
| Midwest | 0.032 | 2.504 | −0.041 | −4.088 | −0.063 | −7.132 | 0.027 | 1.200 |
| Southeast | 0.062 | 3.158 | 0.002 | 0.099 | −0.181 | −13.044 | 0.015 | 0.427 |
| Northeast | −0.293 | −33.780 | −0.055 | −4.455 | 0.200 | 15.918 | 0.289 | 7.941 |
| 0–5 ha | −0.017 | −4.092 | −0.006 | −1.329 | 0.017 | 3.522 | 0.018 | 1.600 |
| 5–20 ha | −0.050 | −3.229 | −0.058 | −4.036 | 0.135 | 9.732 | −0.062 | −1.912 |
| 20–100 ha | 0.019 | 0.931 | 0.030 | 1.631 | −0.037 | −2.197 | 0.002 | 0.062 |
| 100–500 ha | 0.039 | 2.219 | 0.039 | 2.523 | −0.104 | −7.693 | 0.029 | 0.954 |
Source: The authors.
Table A2.
Results for the dose-response regression for the municipality averages of net income, gross value of production, and agricultural expenses, Brazil, 2017.
Table A2.
Results for the dose-response regression for the municipality averages of net income, gross value of production, and agricultural expenses, Brazil, 2017.
| Variables | Av. Mun. Net Income | Av. Mun. Gross Value of Production | Av. Mun. Agricultural Expenses |
|---|---|---|---|
| MSCM | 814.31 *** | 1386.25 *** | 571.94 *** |
| (90.1) | (120.53) | (65.05) | |
| Squared MSCM | −1979.42 *** | −3346.27 *** | −1366.85 *** |
| (286.15) | (382.81) | (206.59) | |
| Cubic MSCM | 1176.76 *** | 2044.54 *** | 867.78 *** |
| (248.73) | (332.75) | (179.57) | |
| GPS | −732.09 *** | −948.79 *** | −216.7 |
| (264.94) | (354.44) | (191.28) | |
| Squared GPS | 2801.36 ** | 3668.12 ** | 866.76 |
| (1160.11) | (1552) | (837.57) | |
| Cubic GPS | −3135.1 ** | −4089.49 ** | −954.39 |
| (1461.54) | (1955.26) | (1055.2) | |
| Interaction MSCM—GPS | 413.21 *** | 728.88 *** | 315.67 *** |
| (110.36) | (147.65) | (79.68) | |
| Constant | 70.66 *** | 90.08 *** | 19.42 |
| (17.49) | (23.4) | (12.63) |
Note: Standard errors are reported in parentheses. *** significant at 1%, ** at 5%.
References
- Chaddad, F. The Economics and Organization of Brazilian Agriculture, 1st ed.; Elsevier: London, UK, 2016; ISBN 9780128016954. [Google Scholar]
- Barros, G.S.C. Agriculture, industry and the economy: From extensive farming to a global agro-food power. In Agricultural Development in Brazil: The Rise of a Global Agro-Food Power; Series: Routledge Studies in Agricultural Economics, 2019; Buainain, A.M., Lanna, R., Navarro, Z., Eds.; Routledge: New York, NY, USA, 2019; pp. 12–29. ISBN 9781351029742. [Google Scholar]
- Jayne, T.S.; Zulu, B.; Nijhoff, J.J. Stabilizing Food Markets in Eastern and Southern Africa. Food Policy 2006, 31, 328–341. [Google Scholar] [CrossRef]
- Zeuli, K.A.; Radel, J. Cooperatives as a Community Development Strategy: Linking Theory and Practice. J. Reg. Anal. Policy 2005, 35, 43–54. [Google Scholar]
- Bernard, T.; Taffesse, A.S.; Gabre-Madhin, E. Impact of Cooperatives on Smallholders’ Commercialization Behavior: Evidence from Ethiopia. Agric. Econ. 2008, 39, 147–161. [Google Scholar] [CrossRef]
- Fischer, E.; Qaim, M. Linking Smallholders to Markets: Determinants and Impacts of Farmer Collective Action in Kenya. World Dev. 2012, 40, 1255–1268. [Google Scholar] [CrossRef] [Green Version]
- Bizikova, L.; Nkonya, E.; Minah, M.; Hanisch, M.; Turaga, R.M.R.; Speranza, C.I.; Karthikeyan, M.; Tang, L.; Ghezzi-Kopel, K.; Kelly, J.; et al. A Scoping Review of the Contributions of Farmers’ Organizations to Smallholder Agriculture. Nat. Food 2020, 1, 620–630. [Google Scholar] [CrossRef]
- Batzios, A.; Kontogeorgos, A.; Chatzitheodoridis, F.; Sergaki, P. What Makes Producers Participate in Marketing Cooperatives? The Northern Greece Case. Sustainability 2021, 13, 1676. [Google Scholar] [CrossRef]
- Olagunju, K.O.; Ogunniyi, A.I.; Oyetunde-Usman, Z.; Omotayo, A.O.; Awotide, B.A. Does Agricultural Cooperative Membership Impact Technical Efficiency of Maize Production in Nigeria: An Analysis Correcting for Biases from Observed and Unobserved Attributes. PLoS ONE 2021, 16, e0245426. [Google Scholar] [CrossRef]
- Merrett, C.D.; Walzer, N. A Cooperative Approach to Local Economic Development, 1st ed.; Quorum Books: Westport, CT, USA, 2001; ISBN 9781567203950. [Google Scholar]
- Zhang, J.; Goddard, E.; Lerohl, M. Estimating Pricing Games in the Wheat-handling Market in Saskatchewan: The Role of a Major Cooperative. In Cooperative Firms in Global Markets; Novkovic, S., Sena, V., Eds.; Emerald Group Publishing Limited: West Yorkshire, UK, 2007; ISBN 9780762313891. [Google Scholar]
- Valentinov, V. Why Are Cooperatives Important in Agriculture? An Organizational Economics Perspective. J. Inst. Econ. 2007, 3, 55–69. [Google Scholar] [CrossRef]
- Verhofstadt, E.; Maertens, M. Can Agricultural Cooperatives Reduce Poverty? Heterogeneous Impact of Cooperative Membership on Farmers’ Welfare in Rwanda. Appl. Econ. Perspect. Policy 2015, 37, 86–106. [Google Scholar] [CrossRef] [Green Version]
- Cechin, A. Cooperativas brasileiras nos mercados agroalimentares contemporâneos. In O Mundo Rural no Brasil do Século 21: A Formação de um Novo Padrão Agrário e Agrícola; Buainain, A.M., Alves, E., da Silveira, J.M., Navarro, Z., Eds.; Embrapa: Brasília, Brazil, 2014; pp. 479–507. [Google Scholar]
- Herrera, G.P.; Lourival, R.; da Costa, R.B.; Mendes, D.R.F.; Moreira, T.B.S.; de Abreu, U.G.P.; Constantino, M. Econometric Analysis of Income, Productivity and Diversification among Smallholders in Brazil. Land Use Policy 2018, 76, 455–459. [Google Scholar] [CrossRef]
- Ma, W.; Abdulai, A.; Goetz, R. Agricultural Cooperatives and Investment in Organic Soil Amendments and Chemical Fertilizer in China. Am. J. Agric. Econ. 2018, 100, 502–520. [Google Scholar] [CrossRef]
- Zhang, S.; Sun, Z.; Ma, W.; Valentinov, V. The Effect of Cooperative Membership on Agricultural Technology Adoption in Sichuan, China. China Econ. Rev. 2020, 62, 101334. [Google Scholar] [CrossRef]
- IBGE. Instituto Brasileiro de Geografia e Estatística. Microdados da Pesquisa Nacional por Amostra de Domicílios (PNAD). Available online: https://www.ibge.gov.br/estatisticas/sociais/populacao/9127-pesquisa-nacional-por-amostra-de-domicilios.html?edicao=9451&t=downloads (accessed on 22 May 2021).
- IBGE. Instituto Brasileiro de Geografia e Estatística. SIDRA - Sistema IBGE de Recuperação Automática: Censo Agropecuário. 2017. Available online: https://sidra.ibge.gov.br/pesquisa/censo-agropecuario/censo-agropecuario-2017 (accessed on 22 April 2020).
- Homma, A.K.O.; Lima, J.R.F.; Vieira, P.A. Structural heterogeneity in rural Brazil: Three regional cases. In Agricultural Development in Brazil: The Rise of a Global Agro-Food Power; Buainain, A.M., Lanna, R., Navarro, Z., Eds.; Routledge: New York, NY, USA, 2019; pp. 189–207. [Google Scholar]
- Neves, M.C.R.; Castro, L.S.; Freitas, C.O. Cooperatives and Brazilian Agricultural Production: A Spatial Analysis. In Proceedings of the 46th Brazilian Economics Meeting, Rio de Janeiro, Brazil, 11–14 December 2018. ANPEC—Associação Nacional dos Centros de Pós-graduação em Economia [Brazilian Association of Post-Graduate Programs in Economics]. [Google Scholar]
- Cazzuffi, C. Small Scale Farmers in the Market and the Role of Processing and Marketing Cooperatives: A Case Study of Italian Dairy Farmers. Ph.D. Thesis, University of Sussex, Brighton, UK, 2012. [Google Scholar]
- Jardine, S.L.; Lin, C.Y.C.; Sanchirico, J.N. Measuring Benefits from a Marketing Cooperative in the Copper River Fishery. Am. J. Agric. Econ. 2014, 96, 1084–1101. [Google Scholar] [CrossRef]
- Ortega, D.L.; Bro, A.S.; Clay, D.C.; Lopez, M.C.; Tuyisenge, E.; Church, R.A.; Bizoza, A.R. Cooperative Membership and Coffee Productivity in Rwanda’s Specialty Coffee Sector. Food Secur. 2019, 11, 967–979. [Google Scholar] [CrossRef]
- Kumse, K.; Suzuki, N.; Sato, T.; Demont, M. The Spillover Effect of Direct Competition between Marketing Cooperatives and Private Intermediaries: Evidence from the Thai Rice Value Chain. Food Policy 2021, 101, 102051. [Google Scholar] [CrossRef]
- Helfand, S.; Levine, E. Farm Size and the Determinants of Productive Efficiency in the Brazilian Center-West. Agric. Econ. 2004, 31, 241–249. [Google Scholar] [CrossRef]
- Wollni, M.; Brümmer, B. Productive Efficiency of Specialty and Conventional Coffee Farmers in Costa Rica: Accounting for Technological Heterogeneity and Self-Selection. Food Policy 2012, 37, 67–76. [Google Scholar] [CrossRef] [Green Version]
- Costa, R.A.; Vizcaino, C.A.C.; Costa, E.M. Participação em Cooperativas e Eficiência Técnica entre Agricultores Familiares no Brasil. In Uma Jornada Pelos Contrastes do Brasil: Cem anos de Censo Agropecuário; Vieira Filho, J.E.R., Gasques, J.G., Eds.; IPEA: Brasília, Brazil, 2020; pp. 243–255. ISBN 9786556350110. [Google Scholar]
- Neves, M.D.C.R.; Castro, L.S.D.; Freitas, C.O.D. O Impacto das Cooperativas na Produção Agropecuária Brasileira: Uma Análise Econométrica Espacial. Rev. Econ. Sociol. Rural. 2019, 57, 559–576. [Google Scholar] [CrossRef]
- OCB. Organização das Cooperativas Brasileiras. Anuário do Cooperativismo Brasileiro 2020; OCB: Hochiminh City, Vietnam, 2020. [Google Scholar]
- Imbens, G. The Role of the Propensity Score in Estimating Dose-Response Functions; Biometrika: Cambridge, MA, USA, 1999. [Google Scholar]
- Hirano, K.; Imbens, G.W. The Propensity Score with Continuous Treatments. In Applied Bayesian Modeling and Causal Inference from Incomplete-Data Perspectives; John Wiley & Sons: Hoboken, NJ, USA, 2004. [Google Scholar]
- Rosenbaum, P.R.; Rubin, D.B. The Central Role of the Propensity Score in Observational Studies for Causal Effects. Biometrika 1983, 70, 41–55. [Google Scholar] [CrossRef]
- Helfand, S.M.; Magalhães, M.M.; Rada, N.E. Brazil’s Agricultural Total Factor Productivity Growth by Farm Size; IDB Working Paper Series; Inter-American Development Bank: Washington, DC, USA, 2015. [Google Scholar]
- Buainain, A.M.; Gonzáles, M.G.; Souza Filho, H.M.; Vieira, A.C.P. Alternativas de Financiamento Agropecuário: Experiências no Brasil e na América Latina; Buainain, A.M., Gonzáles, M.G., Eds.; IICA: Brasília, Brazil, 2007. [Google Scholar]
- de Araújo, M.L.S.; Sano, E.E.; Bolfe, E.L.; Santos, J.R.N.; dos Santos, J.S.; Silva, F.B. Spatiotemporal Dynamics of Soybean Crop in the Matopiba Region, Brazil (1990–2015). Land Use Policy 2019, 80, 57–67. [Google Scholar] [CrossRef]
- Silva, L.D.J.D.S.; Pinheiro, J.O.C.; Dos Santos, E.M.; Da Costa, J.I.; Meneghetti, G.A. O Cooperativismo Como Instrumento Para a Autonomia de Comunidades Rurais da Amazônia: A Experiência dos Agricultores Extrativistas do Municipio de Lábrea, AM. Boletín Asoc. Int. Derecho Coop. 2019, 55, 199–226. [Google Scholar] [CrossRef] [Green Version]
- Futemma, C.; de Castro, F.; Brondizio, E.S. Farmers and Social Innovations in Rural Development: Collaborative Arrangements in Eastern Brazilian Amazon. Land Use Policy 2020, 99, 104999. [Google Scholar] [CrossRef]
- Alves, E.; Souza, G.D.S.; Rocha, D.D.P. Lucratividade da Agricultura. Rev. Política Agrícola 2012, 21, 45–63. [Google Scholar]
- Helfand, S.M.; Rada, N.E.; Magalhães, M.M. L’agriculture Brésilienne: S’agit-Il Uniquement de Grandes Exploitations? EuroChoices 2017, 16, 17–22. [Google Scholar] [CrossRef]
- Gasques, J.G.; Bacchi, M.R.P.; Bastos, E.T. Nota Técnica IV-Crescimento e Produtividade da Agricultura Brasileira de 1975 a 2016. Carta Conjunt. 2018, 1–9. [Google Scholar]
- Rada, N.; Helfand, S.; Magalhães, M. Agricultural Productivity Growth in Brazil: Large and Small Farms Excel. Food Policy 2019, 84, 176–185. [Google Scholar] [CrossRef]
- Bia, M.; Mattei, A. A Stata Package for the Estimation of the Dose-Response Function through Adjustment for the Generalized Propensity Score. Stata J. Promot. Commun. Stat. Stata 2008, 8, 354–373. [Google Scholar] [CrossRef] [Green Version]
- Iliopoulos, C.; Cook, M.L. The Efficiency of Internal Resource Allocation Decisions in Customer-Owned Firms: The Influence Costs Problem. In Proceedings of the Annals of 3rd Annual Conference of the International Society for New Institutional Economics, Washington, DC, USA, 16–18 September 1999. [Google Scholar]
- Cechin, A.; Bijman, J.; Pascucci, S.; Zylbersztajn, D.; Omta, O. Drivers of Pro-Active Member Participation in Agricultural Cooperatives: Evidence from Brazil. Ann. Public Coop. Econ. 2013, 84, 443–468. [Google Scholar] [CrossRef]
- Bernard, T.; Spielman, D.J. Reaching the Rural Poor through Rural Producer Organizations? A Study of Agricultural Marketing Cooperatives in Ethiopia. Food Policy 2009, 34, 60–69. [Google Scholar] [CrossRef]
- Abate, G.T. Drivers of Agricultural Cooperative Formation and Farmers’ Membership and Patronage Decisions in Ethiopia. J. Co-Oper. Organ. Manag. 2018, 6, 53–63. [Google Scholar] [CrossRef]
- de Freitas, C.O.; Silva, F.D.F.; Braga, M.J.; Neves, M.D.C.R. Rural Extension and Technical Efficiency in the Brazilian Agricultural Sector. Int. Food Agribus. Manag. Rev. 2021, 24, 215–232. [Google Scholar] [CrossRef]
- Costa, B.A.L.; Junior, P.C.G.A.; Da Silva, M.G. As Cooperativas de Agricultura Familiar e o Mercado de Compras Governamentais Em Minas Gerais. Rev. Econ. Sociol. Rural. 2015, 53, 109–126. [Google Scholar] [CrossRef] [Green Version]
- Rios, G.S.L. Pré-cooperativismo: Etapa queimada. In A Problemática Cooperativista no Desenvolvimento Econômico; Uwe, J., Ed.; Fundação Friedrich Naumann: São Paulo, Brazil, 1973; pp. 315–347. [Google Scholar]
- Silva, E.S.; Salomão, I.L.; McIntyre, J.P.; Guerreiro, J.; Pires, M.L.L.S.; Albuquerque, P.P.; Bergonsi, S.; Vaz, S.C. Panorama do Cooperativismo Brasileiro: História, Cenários e Tendências. Rev. uniRcoop 2003, 1, 75–102. [Google Scholar]
- Höhler, J.; Kühl, R. Dimensions of member heterogeneity in cooperatives and their impact on organization—A literature review. Ann. Public Coop. Econ. 2018, 89, 697–712. [Google Scholar] [CrossRef]
- Wiggins, S.; Kirsten, J.; Llambí, L. The Future of Small Farms. World Dev. 2010, 38, 1341–1348. [Google Scholar] [CrossRef]
- Wossen, T.; Abdoulaye, T.; Alene, A.; Haile, M.G.; Feleke, S.; Olanrewaju, A.; Manyong, V. Impacts of Extension Access and Cooperative Membership on Technology Adoption and Household Welfare. J. Rural. Stud. 2017, 54, 223–233. [Google Scholar] [CrossRef] [PubMed]
- Hoken, H.; Su, Q. Measuring the Effect of Agricultural Cooperatives on Household Income: Case Study of a Rice-Producing Cooperative in China. Agribusiness 2018, 34, 831–846. [Google Scholar] [CrossRef]
- Liu, Y.; Ma, W.; Renwick, A.; Fu, X. The Role of Agricultural Cooperatives in Serving as a Marketing Channel: Evidence from Low-Income Regions of Sichuan Province in China. Int. Food Agribus. Manag. Rev. 2019, 22, 265–282. [Google Scholar] [CrossRef]
- Kumar, A.; Saroj, S.; Joshi, P.K.; Takeshima, H. Does Cooperative Membership Improve Household Welfare? Evidence from a Panel Data Analysis of Smallholder Dairy Farmers in Bihar, India. Food Policy 2018, 75, 24–36. [Google Scholar] [CrossRef] [Green Version]
- Michalek, J.; Ciaian, P.; Pokrivcak, J. The Impact of Producer Organizations on Farm Performance: The Case Study of Large Farms from Slovakia☆. Food Policy 2018, 75, 80–92. [Google Scholar] [CrossRef]
- Giannakas, K.; Fulton, M. Process Innovation Activity in a Mixed Oligopoly: The Role of Cooperatives. Am. J. Agric. Econ. 2005, 87, 406–422. [Google Scholar] [CrossRef]
- BNDES. Banco Nacional de Desenvolvimento Econômico e Social. PROCAP-Agro. Available online: https://www.bndes.gov.br/wps/portal/site/home/financiamento/produto/procap-agro (accessed on 3 February 2021).
- MAPA. Ministério da Agricultura, Pecuária e Abastecimento. Programa Brasil Mais Cooperativo. Available online: https://www.gov.br/agricultura/pt-br/assuntos/agricultura-familiar/brasil-mais-cooperativo (accessed on 3 February 2021).
Figure 1.
Histogram of MSCM (left) and municipality average GVP (right), Brazil, 2017. Source: the authors used aggregated data from the 2017 Ag. Census made available by IBGE [19].
Figure 1.
Histogram of MSCM (left) and municipality average GVP (right), Brazil, 2017. Source: the authors used aggregated data from the 2017 Ag. Census made available by IBGE [19].

Figure 2.
Geographic distribution of MSCM (left) and municipal averages of GVP (right), Brazil, 2017. Source: the authors used aggregated data from the 2017 Ag. Census made available by IBGE [19].
Figure 2.
Geographic distribution of MSCM (left) and municipal averages of GVP (right), Brazil, 2017. Source: the authors used aggregated data from the 2017 Ag. Census made available by IBGE [19].

Figure 3.
Estimated dose response of MSCM (treatment level) on municipality averages of agricultural (a) net income, (b) GVP and (c) expenses (in 1000 BRL), Brazil, 2017. Source: The authors. Notes: 95% confidence bands; average exchange rate in August 2017: BRL 3.15/USD 1.
Figure 3.
Estimated dose response of MSCM (treatment level) on municipality averages of agricultural (a) net income, (b) GVP and (c) expenses (in 1000 BRL), Brazil, 2017. Source: The authors. Notes: 95% confidence bands; average exchange rate in August 2017: BRL 3.15/USD 1.

Table 1.
Number of municipalities, population, farms, municipality share of cooperative membership (MSCM) and participation in gross value of production (GVP), Brazilian regions, 2017.
Table 1.
Number of municipalities, population, farms, municipality share of cooperative membership (MSCM) and participation in gross value of production (GVP), Brazilian regions, 2017.
| North | Northeast | Southeast | South | Midwest | Brazil | |
|---|---|---|---|---|---|---|
| Municipalities (#) | 450 | 1797 | 1668 | 1191 | 467 | 5570 |
| Population (#) | 17,936,201 | 57,254,159 | 86,949,714 | 29,644,948 | 15,875,907 | 207,660,929 |
| Farms (#) | 580,613 | 2,322,719 | 969,415 | 853,314 | 347,263 | 5,073,324 |
| Members of cooperatives (#) | 20,309 | 33,592 | 165,630 | 313,763 | 46,144 | 579,438 |
| MSCM (%) | 3.50 | 1.45 | 17.09 | 36.77 | 13.29 | 11.42 |
| Gross value of production (%) | 6.72 | 11.58 | 28.23 | 26.41 | 27.07 | 100 |
Source: The authors used aggregated data from the 2017 Ag. Census made available by IBGE [19].
Table 2.
Average of selected variables used in the model by different levels of MSCM, Brazil, 2017.
| Municipality Share of Cooperative Membership | ||||||
|---|---|---|---|---|---|---|
| Overall | 0.0 | <0.01 | 0.01–0.05 | 0.05–0.2 | >0.2 | |
| Net Income ($) 1 | 84.77 | 40.08 | 20.29 | 45.23 | 105.92 | 150.35 |
| Gross Value of Production ($) 1 | 141.93 | 57.88 | 30.96 | 69.94 | 171.66 | 263.43 |
| Ag. Expenses ($) 1 | 57.16 | 17.81 | 10.67 | 24.71 | 65.74 | 113.09 |
| Land used (ha) | 18,190.00 | 8669.45 | 13,413.73 | 16,751.39 | 23,599.24 | 20,157.60 |
| Labor (Age > 14 years old) 2 | 2645.13 | 1614.10 | 3701.33 | 3142.27 | 2372.89 | 1891.37 |
| Capital (units) 3 | 1.06 | 0.41 | 0.16 | 0.44 | 1.40 | 2.02 |
| Other Investments ($) 4 | 56.24 | 14.50 | 10.24 | 23.91 | 64.18 | 112.55 |
| Group of Area | ||||||
| 0–5 ha | 0.02 | 0.05 | 0.06 | 0.02 | <0.01 | <0.01 |
| 5–20 ha | 0.21 | 0.23 | 0.35 | 0.27 | 0.13 | 0.13 |
| 20–100 ha | 0.54 | 0.53 | 0.46 | 0.49 | 0.57 | 0.60 |
| 100–500 ha | 0.21 | 0.18 | 0.13 | 0.18 | 0.26 | 0.25 |
| 500+ ha (base) | 0.02 | 0.02 | 0.01 | 0.03 | 0.04 | 0.01 |
| Landowner | 0.82 | 0.77 | 0.77 | 0.81 | 0.82 | 0.85 |
| Literate | 0.82 | 0.66 | 0.66 | 0.76 | 0.89 | 0.95 |
| College degree or higher | 0.09 | 0.05 | 0.04 | 0.07 | 0.12 | 0.13 |
| Experience 5 | 0.01 | 0.02 | 0.02 | 0.02 | 0.01 | 0.01 |
| Governmental Extension 6 | 0.10 | 0.08 | 0.06 | 0.08 | 0.12 | 0.14 |
| Private Extension 6 | 0.17 | 0.04 | 0.04 | 0.07 | 0.17 | 0.36 |
| Credit 6 | 0.10 | 0.03 | 0.06 | 0.07 | 0.10 | 0.18 |
| Regions | ||||||
| North | 0.08 | 0.09 | 0.11 | 0.16 | 0.08 | <0.01 |
| Northeast | 0.32 | 0.74 | 0.74 | 0.48 | 0.10 | 0.01 |
| Southeast | 0.30 | 0.14 | 0.11 | 0.22 | 0.45 | 0.39 |
| South (base) | 0.22 | <0.01 | 0.01 | 0.05 | 0.21 | 0.54 |
| Midwest | 0.08 | 0.03 | 0.02 | 0.10 | 0.16 | 0.06 |
Notes: 1 Value in millions of Brazilian reais (BRL); average exchange rate in August 2017: BRL 3.15/USD 1. 2 Average number of workers older than 14 years. 3 Units of tractors, combine harvesters, fertilizer spreaders, seeders and other tools. 4 Value (in BRL) of the livestock and buildings present on the farms. 5 Share of farms managed by farmers with 20 or more years of experience. 6 Share of farms that have access to these services. Source: The authors used aggregated data from the 2017 Ag. Census made available by IBGE [19].
Table 3.
Results for the first stage of the GSP: regression on MSCM, Brazil, 2017.
| Variables | Parameter | Standard Error | t-Test | p-Value |
|---|---|---|---|---|
| Capital | 0.005 | 0.003 | 1.84 | 0.07 |
| Other Investments ($) | 0.001 | 5.12 × 10⁻⁵ | 4.19 | <0.01 |
| Land used (ha) | −2.49 × 10⁻⁷ | 2.86 × 10⁻⁷ | −0.87 | 0.38 |
| Labor (Age > 14 years old) | 7.37 × 10⁻⁶ | 5.03 × 10⁻⁶ | 1.46 | 0.14 |
| Landowner | −0.001 | 0.086 | −0.02 | 0.99 |
| Literate | 2.098 | 0.154 | 13.65 | <0.01 |
| College degree or higher | 1.701 | 0.217 | 7.83 | <0.01 |
| Experience | 2.023 | 1.096 | 1.85 | 0.065 |
| Governmental Extension | 0.716 | 0.106 | 6.74 | <0.01 |
| Private Extension | 2.227 | 0.096 | 23.29 | <0.01 |
| Credit | 1.776 | 0.140 | 12.69 | <0.01 |
| North | −1.221 | 0.063 | −19.39 | <0.01 |
| Midwest | −0.716 | 0.060 | −11.9 | <0.01 |
| Southeast | −0.599 | 0.040 | −14.82 | <0.01 |
| Northeast | −1.299 | 0.062 | −21.12 | <0.01 |
| 0–5 ha | 0.136 | 0.130 | 1.04 | 0.27 |
| 5–20 ha | 0.360 | 0.102 | 3.53 | <0.01 |
| 20–100 ha | 0.407 | 0.096 | 4.22 | <0.01 |
| 100–500 ha | 0.428 | 0.091 | 4.69 | <0.01 |
| Constant | −4.984 | 0.183 | −27.25 | <0.01 |
Source: The authors.
Publisher’s Note: MDPI stays neutral with regard to jurisdictional claims in published maps and institutional affiliations. |
© 2021 by the authors. Licensee MDPI, Basel, Switzerland. This article is an open access article distributed under the terms and conditions of the Creative Commons Attribution (CC BY) license (https://creativecommons.org/licenses/by/4.0/).
Share and Cite
MDPI and ACS Style
Neves, M.d.C.R.; Silva, F.d.F.; Freitas, C.O.d.; Braga, M.J. The Role of Cooperatives in Brazilian Agricultural Production. Agriculture 2021, 11, 948. https://0-doi-org.brum.beds.ac.uk/10.3390/agriculture11100948
AMA Style
Neves MdCR, Silva FdF, Freitas COd, Braga MJ. The Role of Cooperatives in Brazilian Agricultural Production. Agriculture. 2021; 11(10):948. https://0-doi-org.brum.beds.ac.uk/10.3390/agriculture11100948
Chicago/Turabian StyleNeves, Mateus de Carvalho Reis, Felipe de Figueiredo Silva, Carlos Otávio de Freitas, and Marcelo José Braga. 2021. "The Role of Cooperatives in Brazilian Agricultural Production" Agriculture 11, no. 10: 948. https://0-doi-org.brum.beds.ac.uk/10.3390/agriculture11100948
Note that from the first issue of 2016, this journal uses article numbers instead of page numbers. See further details here.