
Shelterbelt Structure and Crop Protection from Increased Typhoon Activity in Northeast China


1
College of Forestry, The Northeast Forestry University, Harbin 150040, China
2
Mills College, Oakland, CA 94613, USA
3
Qiqihar Branch of Heilongjiang Academy of Forestry, Qiqihar 161005, China
4
National Permanent Scientific Research Base on Shelter forest in Nenjiang Plain, Qiqihar 161005, China
*
Author to whom correspondence should be addressed.
Agriculture 2021, 11(10), 995; https://0-doi-org.brum.beds.ac.uk/10.3390/agriculture11100995
Submission received: 25 July 2021
/
Revised: 12 September 2021
/
Accepted: 7 October 2021
/
Published: 13 October 2021
(This article belongs to the Section Agricultural Systems and Management)
Abstract
:Global warming has led to increases in the frequency and intensity of typhoons. In recent years, super typhoons have had a greater impact on agriculture in the black soil farmland of Northeast China, posing serious threats to crop growth. Planting trees as windbreaks and to reduce erosion is common in this region, but their protective effects against crop damage from typhoons is still unknown. This paper studied the protective effect of different shelterbelt structures on crops that encountered a super typhoon. The results show that the distance between shelterbelt rows and shelterbelt porosity have significant influences on the starting lodging distance of crops behind the shelterbelt. Increasing the shelterbelt distance between shelterbelt rows or reducing shelterbelt porosity can enhance their protective effects on crops. Among the main crops, rice has the strongest lodging resistance, followed by soybeans, with maize being the least resistant. The protective effect of mixed tree and shrub shelterbelts is better than that of single tree species shelterbelts. Dead or missing trees reduce the shelterbelt protective effect. These results provide strategies for reducing the impact of more intense and frequent super typhoons.
1. Introduction
The intensification of super typhoons, the tropical cyclones found in the western North Pacific, ranks among the most destructive natural hazards under the conditions of global warming [1]. Typhoons are an important feature of China’s climate and can cause extensive property damage. While the southeast coast is the region of China most frequency affected by typhoons [2], over the past 50 years, the effects of typhoons have increasingly been moving further north, with records showing that more typhoons with a greater intensity are arriving in Northeast China [3,4]. In 2019, super Typhoons Lekima and Lingling had an impact on crops in Northeast China [5,6]. In 2020, three super typhoons affected China’s northern-most province, Heilongjiang—Typhoon Bavi made landfall in North Korea in late August, followed in quick succession by Typhoon Maysak, which crossed the Korean Peninsula into China in early September, and then Typhoon Haishen followed just days later. Typhoon Maysak was the strongest typhoon to reach East Asia in the past 20 years, continuing into Inner Mongolia. Strong winds and heavy precipitation accompanied these super typhoons, causing widespread crop damage in Heilongjiang Province.
Crop lodging is one of the major factors contributing to crop yield and quality reduction [7]. Lodging (the term refers to the bending or breaking of the stems) occurs when plants do not stand upright, leading to yield loss when the combine fails to harvest the grain from the lodged plants [8]. Severe lodging destroys much of the plant itself, resulting in a reduction of the photosynthetic ability, grain yield, and harvesting efficiency. While crop lodging can be caused by excess soil nitrogen [9], the direct effects of wind and rain can also result in lodging [10]. Prior studies have documented grain crop damage—particularly lodging and yield reductions—following typhoons. Crops are frequently damaged by typhoons in Southern China. For example, in Fujian Province, located on the southeast coast, Typhoon Sula caused 47,610 hectares of damage in 2012, and Typhoon Tamei caused 80,480 hectares of damage in 2013 [11]. In recent years, accelerated by global warming, some typhoons have reached North China. Typhoon Bolaven, which crossed Northeast China as the most powerful storm of 2012, was found to induce lodging, reducing maize yields by 17–20%, and increase harvest costs [12]. Since, historically, few typhoons have directly affected Northeast China [13], previous studies of typhoon-induced crop damage have mainly focused on middle and low latitudes. However, with global warming, typhoons are tending to increase in intensity and affect larger areas [14], making it more likely that Northeast China will be affected by super typhoons.
Around the world, shelterbelts are commonly employed to combat wind erosion, water erosion, and desertification. The major factors that determine the efficacy of windbreaks are the height of trees, the degree of shelterbelt porosity, and the width and orientation of the belt [15,16,17]. Planting trees as shelterbelts or windbreaks is a common strategy in successful agricultural systems throughout the world, enhancing agricultural sustainability and profitability [18]. Shelterbelts have been used for centuries to improve microclimate and environmental conditions and to increase crop yields. The selection and placement of trees planted in shelterbelts must consider the needs of the land manager and the desired protective effect [18,19,20]. Thus, the optimized design of a shelterbelt should consider parameters such as the number of rows, shelterbelt length, height, and width [21,22,23,24,25]. In China, strategic tree planting dates back centuries, enshrined in local customs and national policies under the Qing Dynasty and in the National Forest Law of 1914 [26,27]. Under the People’s Republic, annual tree planting was made a constitutional obligation, with massive mobilizations across the country, most notably in the Three Norths Shelterbelt (also known as the Great Green Wall), for which 66 billion trees have been planted since 1978 to combat erosion and desertification [28]. In much of South and East China, planting shelterbelts is a common method to reduce crop damage from typhoons. The primary function of farmland shelterbelts is to reduce wind speed, thus improving microclimate conditions in the sheltered area [29]. The completeness or porosity of trees in a shelterbelt is an obvious indicator of the belt’s ability to reduce the wind speed. Perera et al. [30] found that with a very dense shelterbelt (less than 0.25 porosity), the wind speed on the leeward side of the shelterbelt was still very high. Prior studies of wind erosion have determined that the optimal degree of shelterbelt porosity is between 0.25 and 0.50 [31]. In the coastal region of Jiangsu Province (North of Shanghai), Zhang et al. [32] found that the production loss of farmland protected by shelterbelts was reduced by two thirds from rice lodging compared with the unprotected farmland; the greatest protection occurred where the main windbreak had over 90% tree coverage.
The black soil region of China encompasses most of the three northeastern provinces (Heilongjiang, Liaoning, and Jilin) and extends into neighboring Inner Mongolia [33]. The western part of this region is subject to soil erosion from strong spring winds, mostly from the northwest, resulting in land degradation and loss of agricultural productivity. Windbreaks are often planted in this region to protect crops and soils from wind erosion. In Northeast China, wind protection on the windward side of the shelterbelt has been found to extend to a horizontal distance of up to 10 times that of the average height of the shelterbelt, denoted as 10 h; and on the leeward side of the shelterbelt, the protection extends up to 20 h [16]. One study in the northeast black soil region found effective protection on the leeward side extending to 28 h, reducing wind speed by an average of 21% [34].
However, the design of windbreaks in Northeastern China did not originally take into account the threat from typhoons. We do not know whether the existing windbreaks are effectively protecting crops from typhoons. Wind erosion in this region does not generally cause crop lodging, and prior studies have measured the effectiveness of windbreaks in terms of reducing wind speed and soil erosion or increasing crop production, rather than focusing on the kind of crop damage caused by typhoons.
This investigation examines the effectiveness of existing windbreaks in protecting against typhoon-induced crop lodging in the black soil region of Northeast China. The study measures the effectiveness of shelterbelts in protecting crops against damage from typhoons in terms of the lodging situation of crops behind the shelterbelt [31]. One such measure is the ILCD (initial lodging distance of crops behind the shelterbelt divided by the height of the trees), as many scholars use the tree height multiple instead of the actual distance to compare the protective effects of differ shelterbelts [17,35]. This paper uses drone imagery taken over affected farmland to analyze the prevalence of crop lodging in relationship to windbreaks. It is important to see whether the farmland shelterbelt has some protective effect against typhoons, as well as their relationship with the shelterbelt structure. This research aims to quantify how well existing windbreaks protect crops from lodging under scenarios of increased typhoon activity in Northeast China.
2. Materials and Methods
2.1. Site Conditions
The research sites for this project are located in the Songnen Plain of western Heilongjiang Province and belong to the typical black soil region. The area falls into the temperate continental monsoon climate zone, with four distinct seasons: a dry and windy spring, a hot and rainy summer, a short autumn with early frost, and a long dry and cold winter. Gannan County is located in the Songnen Plain. The common crops are maize (corn), rice, and soybeans. The area began to set up farmland shelterbelts in the late 1970s in a network pattern; their main purpose is to reduce wind erosion in springtime and water erosion during the summer rainy season. In recent years, in view of the degradation of commonly seen in Populus simonii × P. nigra shelterbelts, some degraded stands have been renovated by replacing poplars with pines. The tree species used for renovation are mostly Populus simonii × P. nigra, Pinus sylvestris var. mongolica, Larix gmelinii, Picea wilsonii., and Ulmus pumila. The transformation methods are single-row, multi-row, and integral replacement. In mid-September 2020, this site was affected by super Typhoon Maysak, with a maximum daily rainfall of 106.9 mm, which is about 20% of the annual rainfall, and a maximum daily wind speed of 10.7 m/s.
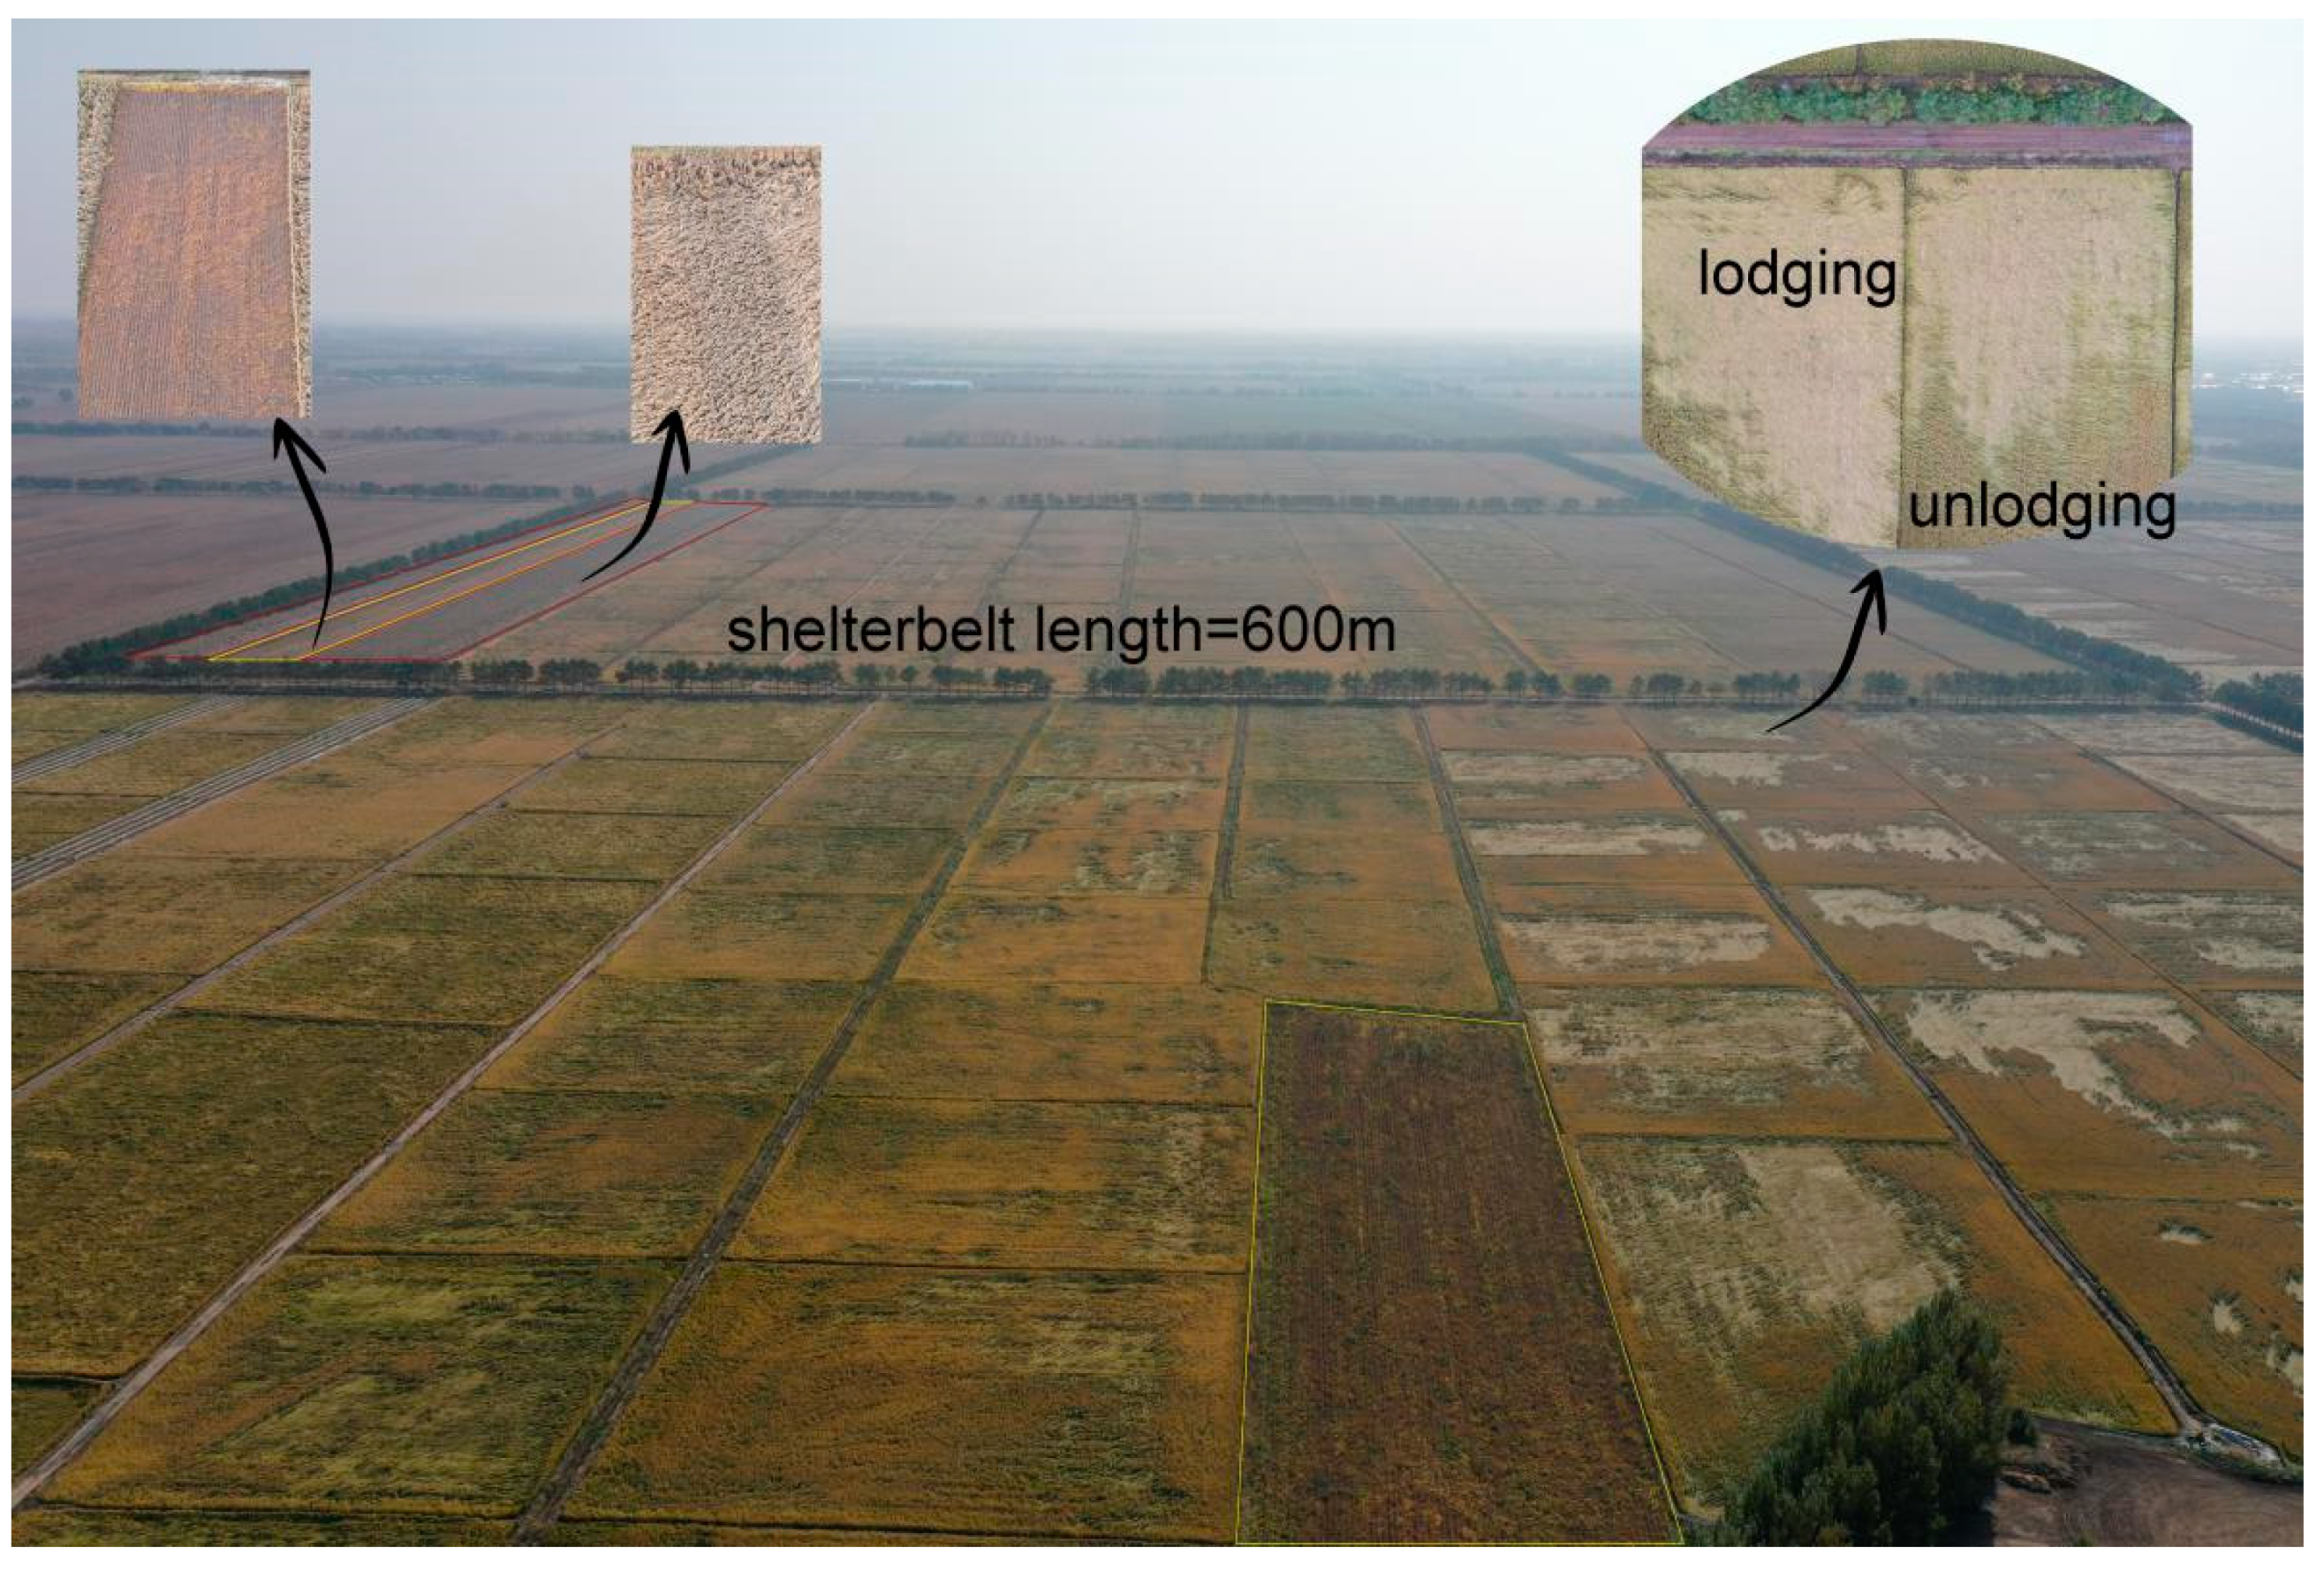
Figure 1 provides a schematic diagram of the crop lodging in farmland caused by Typhoon Haishen in Northeast China in 2020. The light-colored areas in the photos indicate lodging. As can be seen, the typhoon had a severe impact on crops and caused serious crop lodging, even in shelterbelt-protected farmland.
2.2. Selection of Research Site
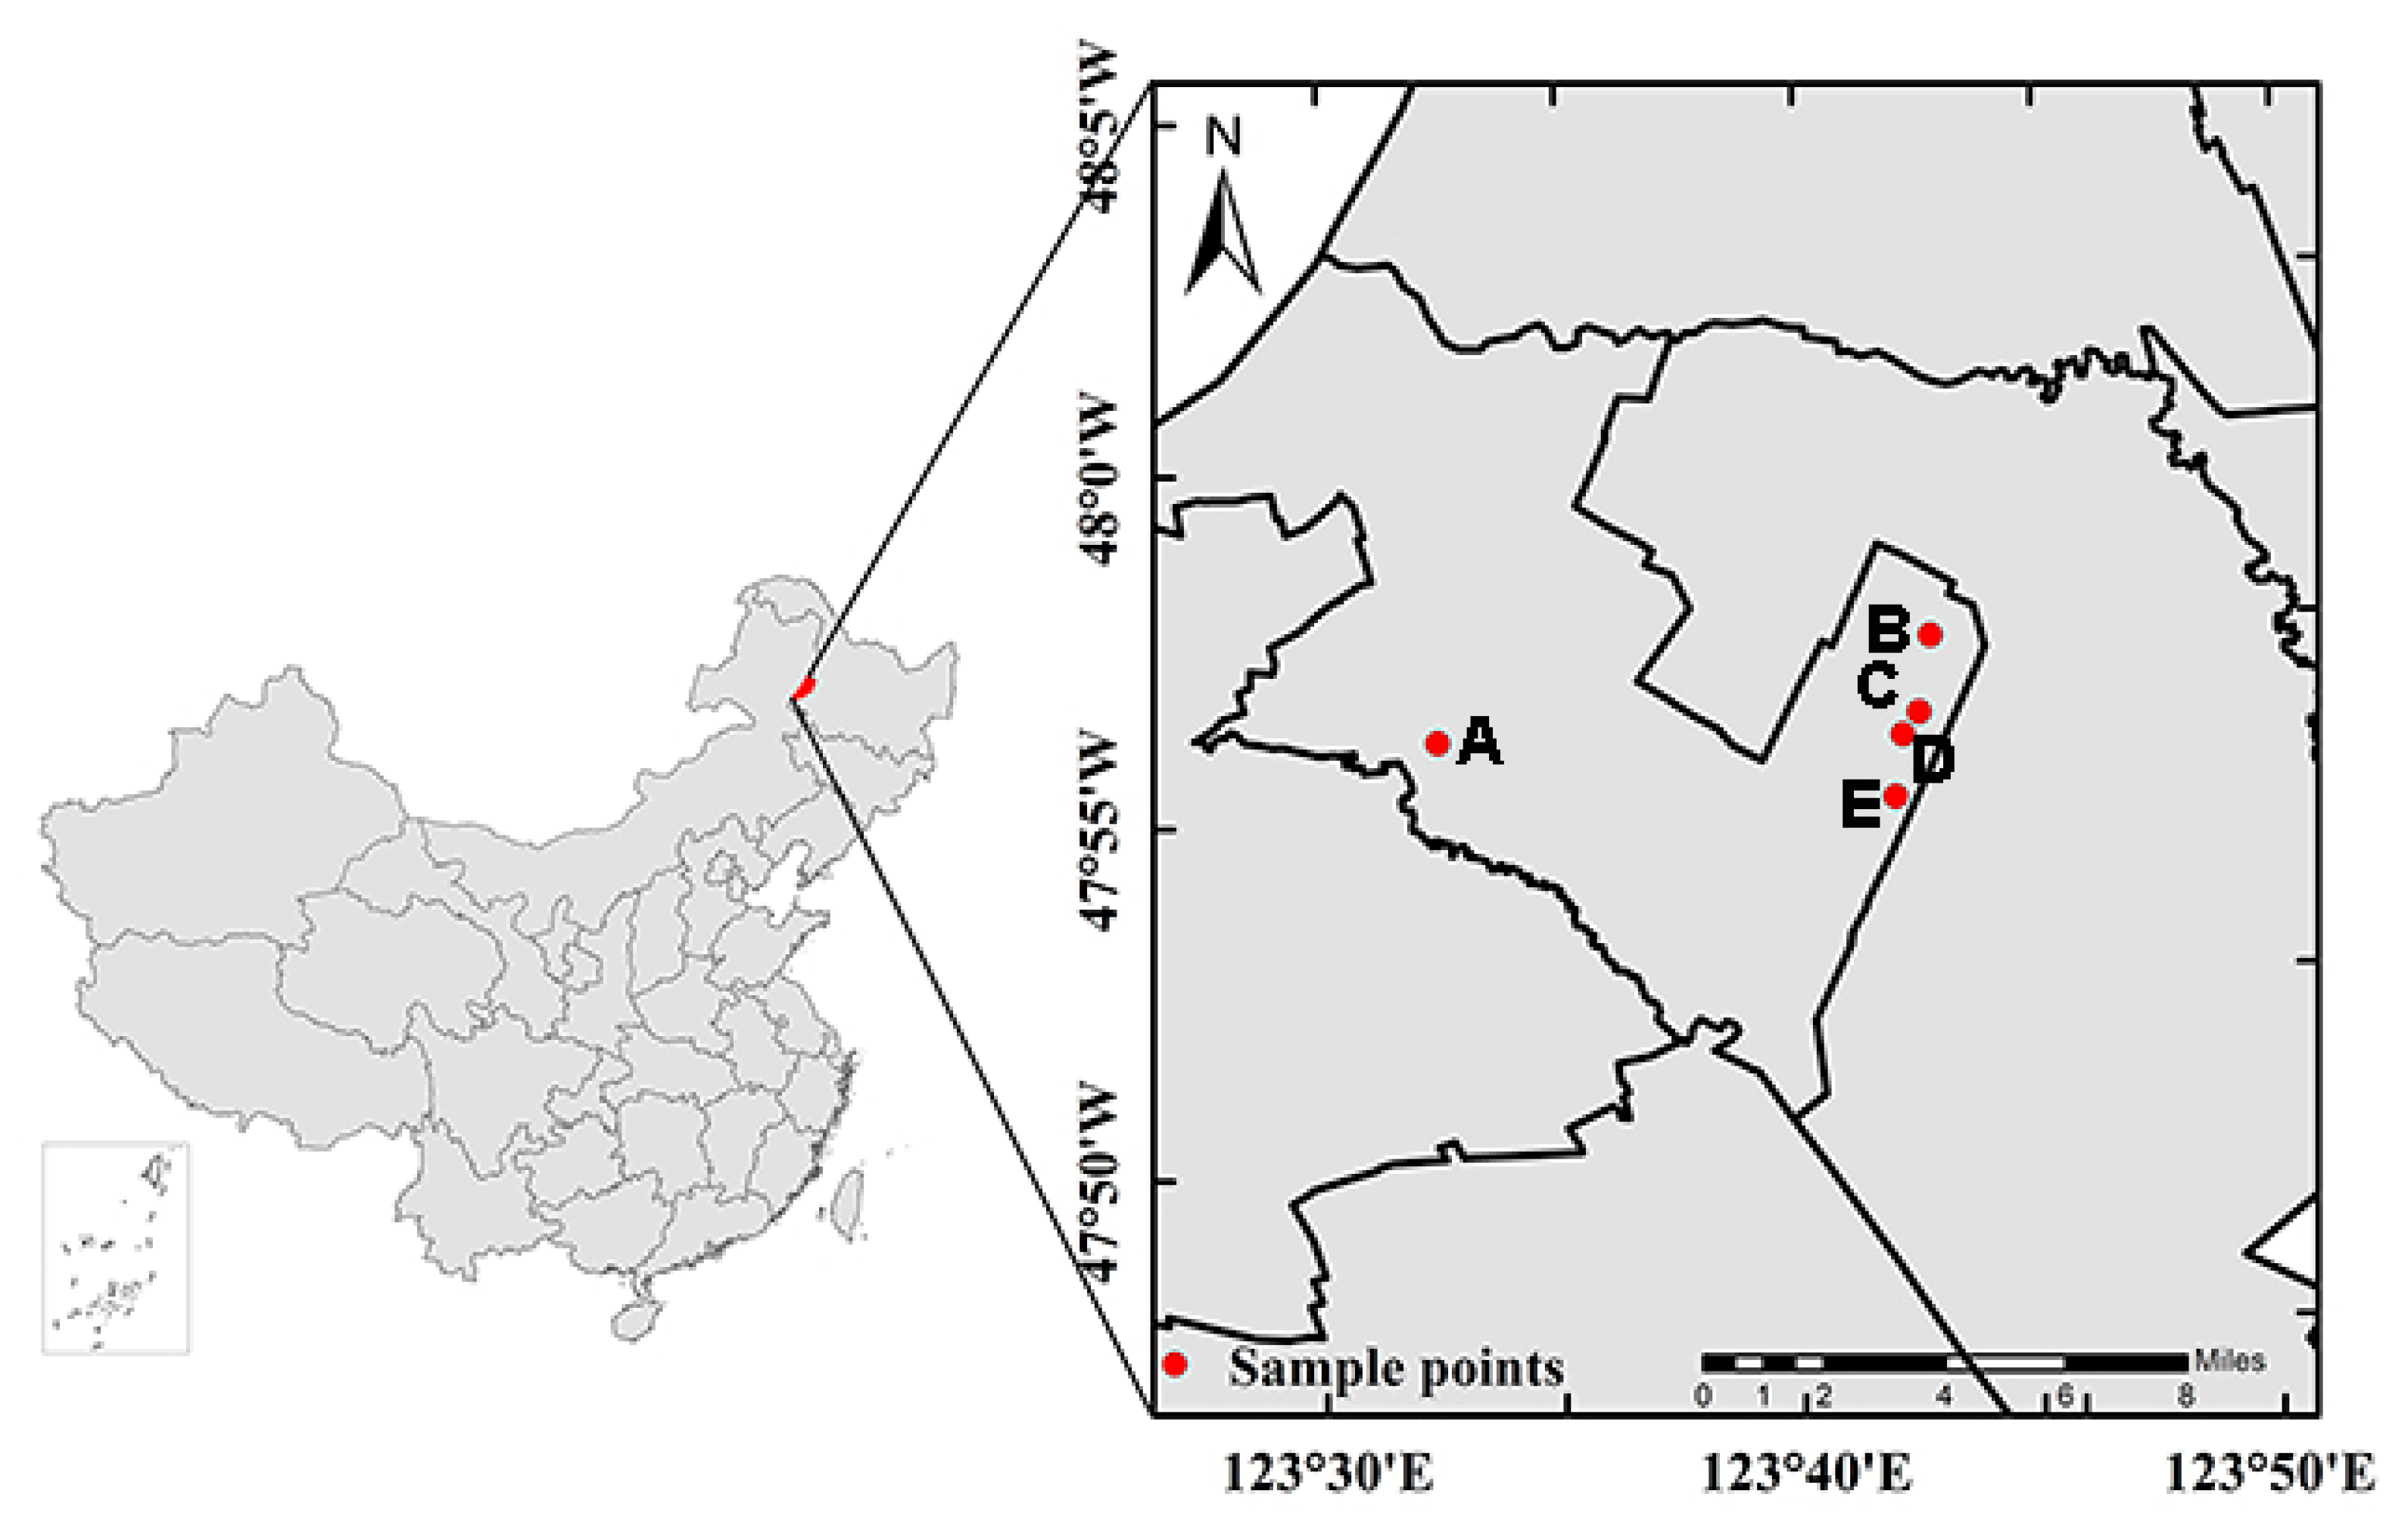
After an initial reconnaissance in October 2020, 19 Songneng Plain shelterbelts were selected for further study from the five study sites, including five degraded shelterbelts, two non-degraded shelterbelts, and 12 renovated shelterbelts (Figure 2). The condition of the shelterbelts was classified as follows:
- severely degraded, with over 40% of trees dead or near death;
- moderate degraded, with 10% to 40% of trees dead or near death;
- mildly degraded, with up to 10% of trees dead or near death;
- non-degraded, with no trees dead or near death [36].
The study sample area only had severely degraded and non-degraded shelterbelts. The severely degraded shelterbelts included three pure Larix gmelinii and two pure Populus simonii × P. nigra belts. Another two pure Populus simonii × P. nigra belts were classified as non-degraded. Among the renovated shelterbelts, there were three pure Pinus sylvestris var. mongolica belts, two mixed Pinus sylvestris var. mongolica and Larix gmelinii belts, one mixed Pinus sylvestris var. mongolica and Ulmus pumila belt, and six mixed Pinus sylvestris var. mongolica and Populus simonii×P. nigra belts (Figure 2).
2.3. Data Collection
First, we collected the shelterbelt structure information by selecting a 30 m section of the shelterbelt and took ground-level photos from 25 m to 30 m perpendicular to the transect (following [24]) with a high-power digital camera. To compensate for the different angles of incident sunlight during our field measurements, we took photos on both sides of the shelterbelt. The height of each tree in the 30-m section of the shelterbelt was measured with an automatic altimeter (accurate to 0.5 m). The diameter at breast height (DBH) at 1.3 m was measured with a DBH ruler. The width of the shelterbelt and the distance between rows were measured 1.5 m above the ground surface with a flexible ruler.
Then, to collect the lodging information, a DJI Mavic Air 2 UAV (Unmanned Aerial Vehicle) was used to collect images of the shelterbelts and crops between belts; a total of 64 photos were taken by hovering the UAV vertically 120 m above the shelterbelt. The aerial photos were stitched together to establish a complete image of the shelterbelt and the farmland between the belts. We also filmed a typical shelterbelt network continuously to establish a complete image of a small grid cell of farmland.
2.4. Data Processing Methods
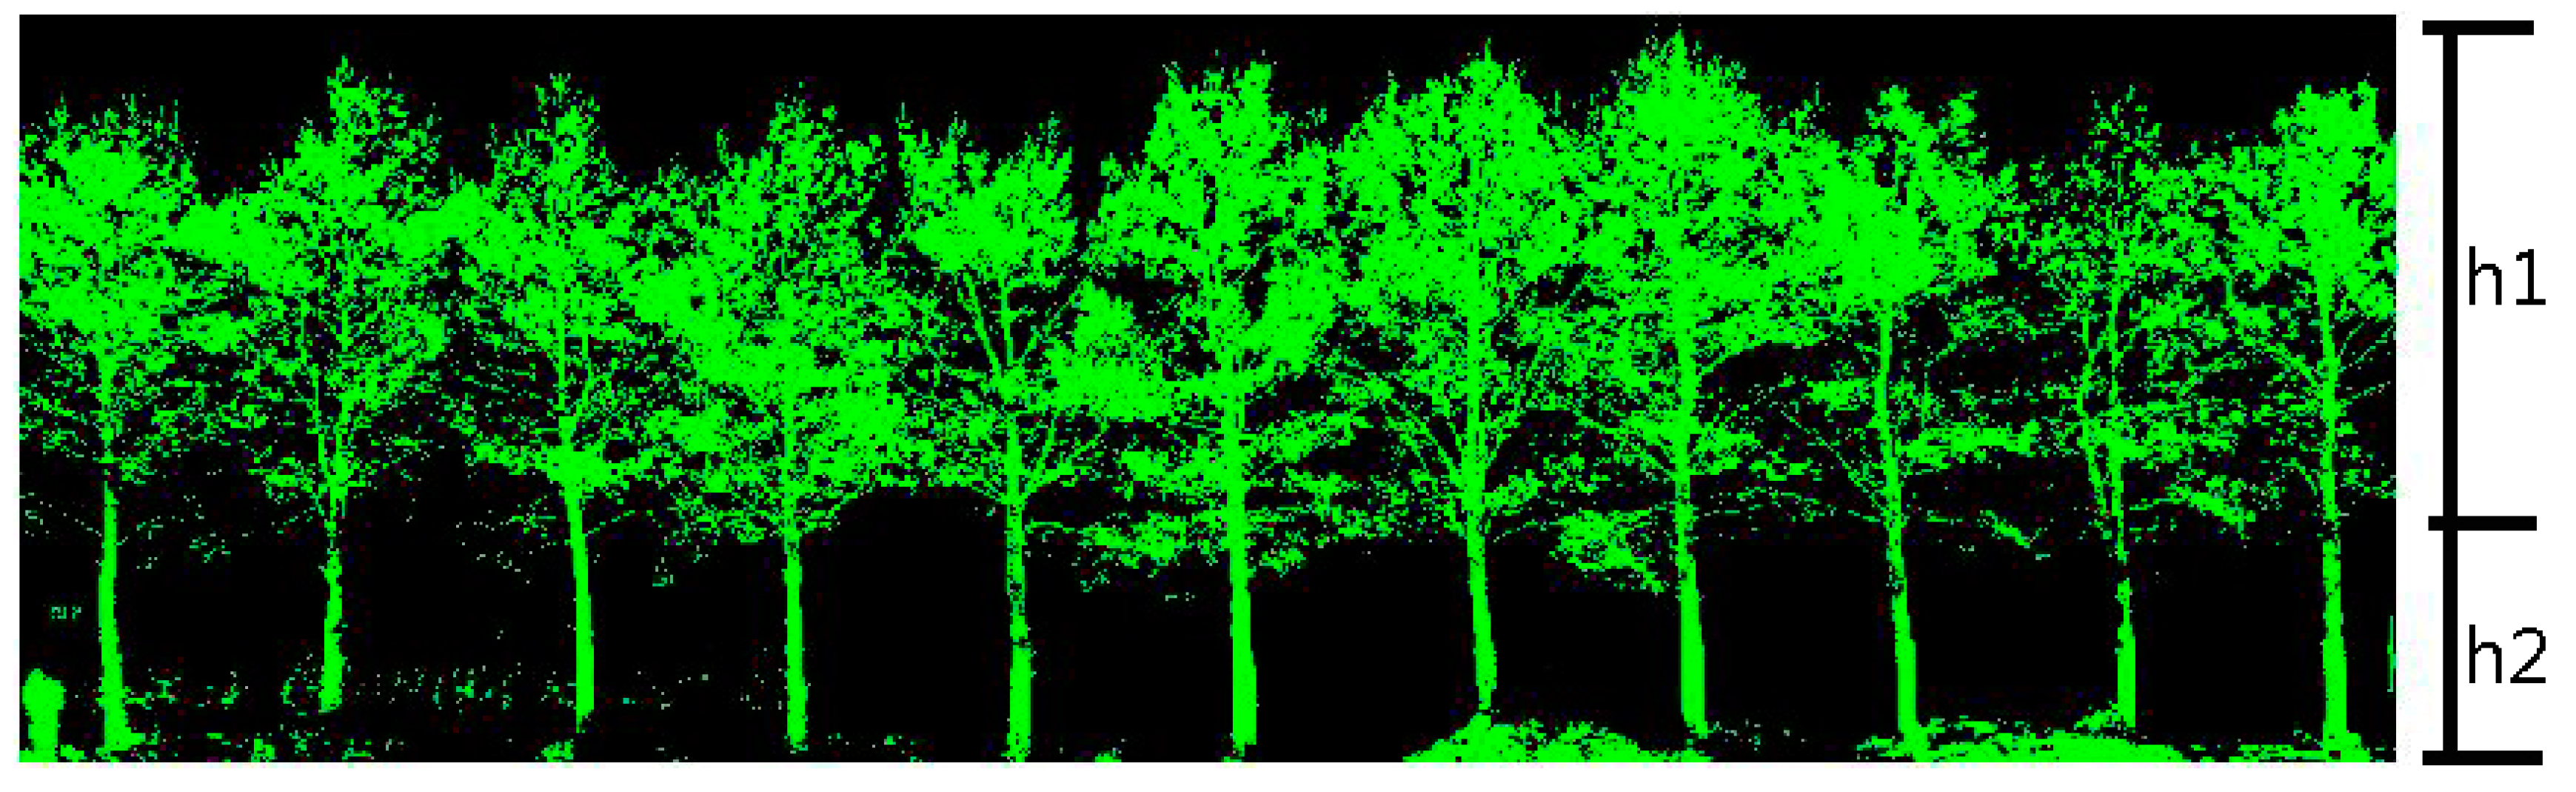
We used digital image processing methods to extract the porosity of the ground-level photos taken perpendicular to each shelterbelt. First, the images taken by the high-power camera were imported into Adobe Photoshop for image segmentation, dividing the images into tree crowns and tree trunks. Then, the processed images were imported into ENVI 5.3 software and a supervised classification was performed to distinguish between the tree parts and light transmittance (Figure 3). The pixels for each class were extracted to calculate the porosity as follows:
where β is the porosity, β1 is the canopy porosity, β2 is the stem porosity, h is the average height of the shelterbelt, h1 is the average height of the canopy, and h2 is the average height of the stem.
β = (β1 × h1 + β2 × h2)/h
2.5. Lodging Recognition and Extraction Method
We used Photoshop to splice the images taken by the UAV’s CMOS sensor with 48 million pixels (Figure 4a). The data quality of images for five shelterbelts was not sufficient for further analysis, so we finally selected 14 shelterbelts (two degraded poplar shelterbelts and 12 renovated shelterbelts) in the above 19 shelterbelts for the analysis. For this study, we divided the 14 shelterbelts into two porosity ranges: 0.25 to 0.50 and greater than 0.50. Ten shelterbelts fell into the former category, which we selected for further study of the structural factors influencing the relationship between their configuration and the ILCD.
Finally, 15 complete images of the monitoring area were obtained (14 shelterbelts and one small grid cell, which was enclosed by four Pinus sylvestris var. mongolica belts), including shelterbelts and protected farmland. ENVI software was used to perform geometric correction and radiometric correction, and the ROI (region of interest) tool combined with visual interpretation [37] was used to identify whether or not the correction was made (Figure 4b). We determined the lodging area using the field investigation as a training reference to distinguish the crop situation on the UAV image. Back to the lab, using the method of visual interpretation, we identified the field sites as the interest area, and then designated the known lodging areas as red and non-lodging areas as green, allowing for the use of the maximum likelihood method to classify the rest of the images. AutoCAD 2007 software was used to identify the degree of correction after processing. The lodged and unlodged crop areas behind the shelterbelt were marked, and the distance between the lodged crops on the leeward side of the shelterbelt was collected (Figure 4c). The crop lodging rate is equal to the lodging area divided by the entire farmland area (Figure 4c).
We classified rice plants as lodged where the plants were tilted or broke, or as non-lodged where the crops kept their original vertical state; within the site (Figure 5), the supervised classification method was used to extract the crop lodging areas. The maximum likelihood classification algorithm was used to classify the wind disaster extraction results into three categories: severe lodging, mild lodging, and unlodging, and human−computer interaction was used to correct the classification results. In the visible light range, unlodging corresponded with spectral reflectivity between 0.003–0.010, mild lodging between 0.010–0.021, and severe lodging between 0.021–0.025 (Figure 6).
3. Results
In this section, we evaluate the effects on the ILCD (the starting lodging distance of the crops behind the shelterbelt divided by the height of the trees) of the porosity, configuration, and degradation status of the shelterbelt. As shown in Figure 4, the ILCD was calculated as follows:
where F is the starting lodging distance of crops behind the shelterbelt and h is the average height of the shelterbelt.
ILCD = F/h
3.1. Shelterbelt Porosity
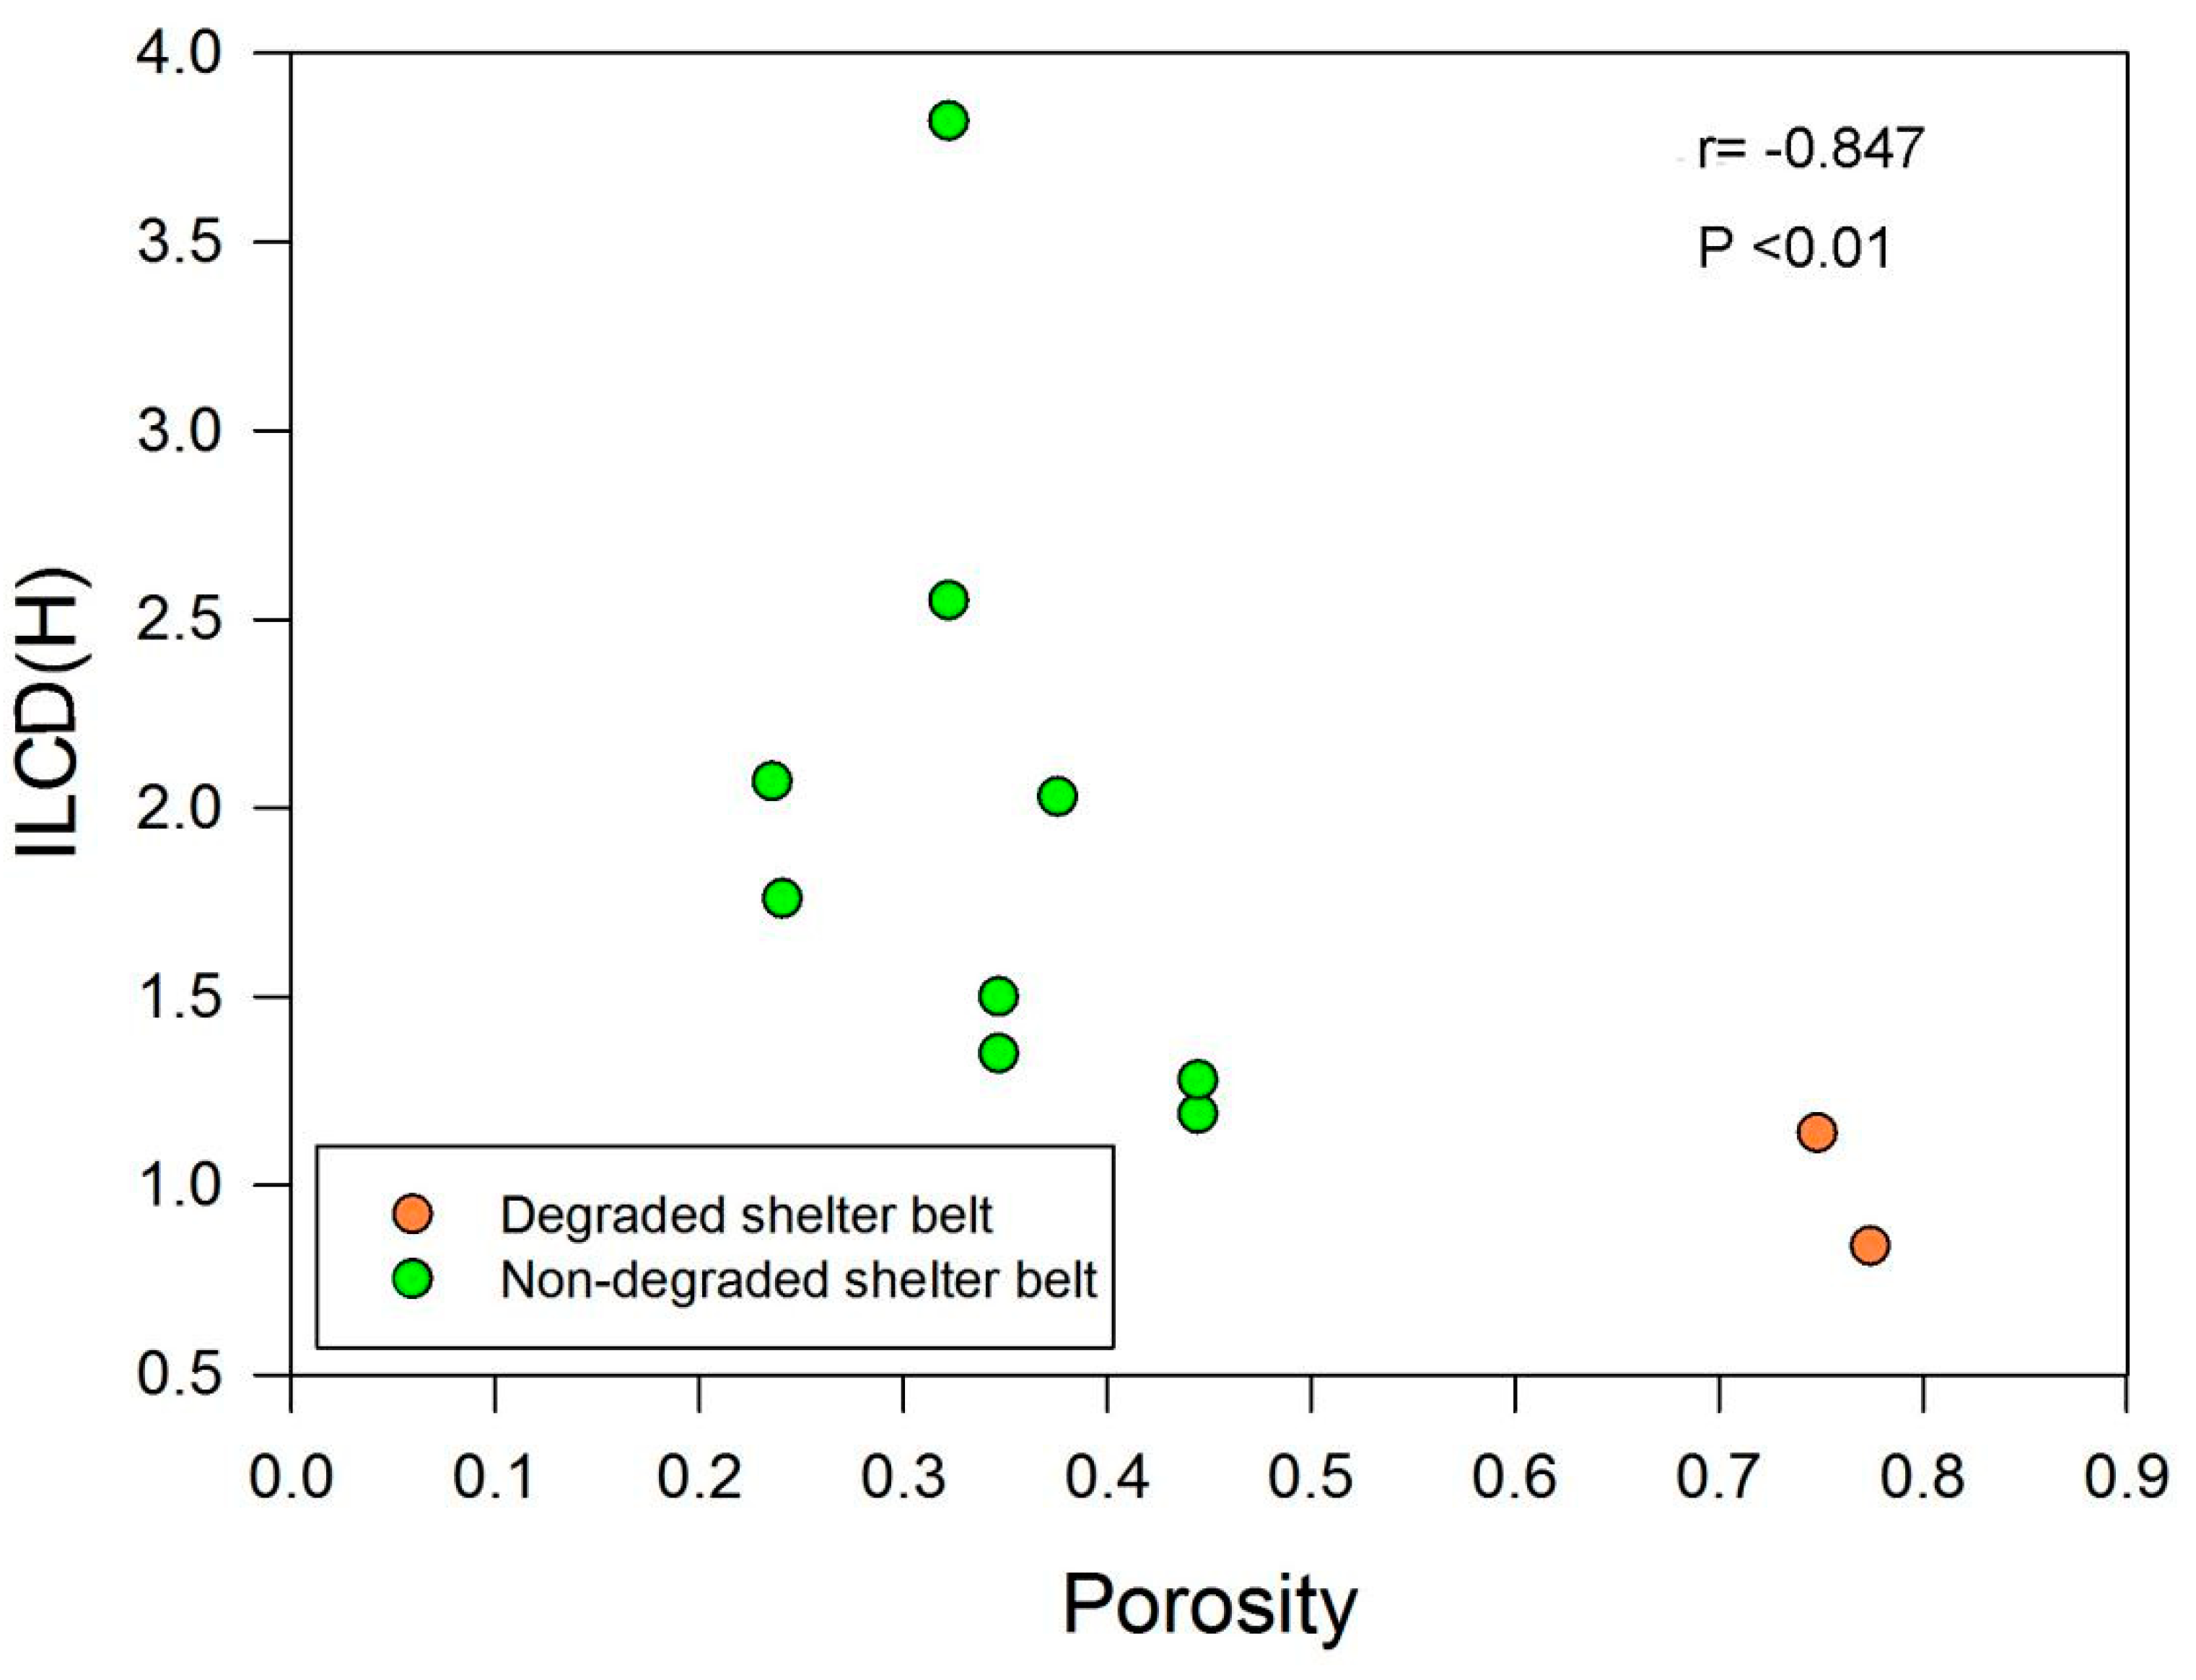
Figure 5 shows the relationship between the post-typhoon ILCD and the porosity of the shelterbelt. ILCD is strongly negatively correlated with shelter belt porosity (correlation coefficient −0.847, p < 0.01). Therefore, shelterbelt porosity alone may be the decisive factor for determining the ILCD. In general, the degraded shelterbelts had a high porosity and a short initial lodging distance, while the non-degraded shelterbelt had a low porosity and a long initial lodging distance. In the non-degraded shelterbelt, the ILCD varied greatly among shelterbelts with a similar porosity, which indicates that the ILCD was also related to some other factors.
3.2. Shelterbelt Configuration
The shelterbelt configuration includes both the spatial structure of the shelterbelt (the number of rows and the distance between shelterbelt rows) and the tree species. We analyzed and compared these three factors individually to understand the influence of shelterbelt configuration on its protective effect. The correlation coefficient between the distance between shelterbelt rows and the ILCD was 0.82 (p < 0.01). It could be seen that the distance between the shelterbelt rows was an important factor for determining the ILCD (Table 1).
In Northeast China, shelterbelts are commonly constructed in networks forming a grid around cropland. We chose a typical network and measured the lodging situation while comparing four individual shelterbelts within the network. Figure 6 shows a small network around a 600 m × 600 m field, enclosed by four Pinus sylvestris var. mongolica shelterbelts. The field is mostly planted with rice, while corn and soybeans occupy a strip about 80 m wide along the southern shelterbelt. The basic properties of the four shelterbelts of Pinus sylvestris var. mongolica are similar.
It can be seen from Figure 6 that the lodging situation of the rice in the shelterbelt network decreases first and then increases in distance from the shelterbelt in the direction of the wind. In combination with field investigations, reflectivity can be used to determine the lodging situation. In Figure 6, blue corresponds with no lodging, yellow corresponds with light lodging, and green corresponds with severe lodging. At the left of Figure 6, near the left shelterbelt, there is with more area shown in green; then, moving from left to right the color changes successively from green to yellow to blue, then to green and blue again, with blue occupying the larger area near the right shelterbelt. So, this suggests that the wind speed changes from decreasing to increasing, then decreasing again near the right of the shelterbelt.
Although the spatial distribution of the wind speed during the typhoon event was not directly measured, the lodging of rice within the shelterbelt network can reflect the distribution of wind damage [38]. The first severe lodging area (at the left in Figure 6) can be attributed to the strong funneling effect of the wind in the shelterbelt. Next, downwind, the mild lodging area reflects the aerodynamic drag force generated by the canopy, which reduces the kinetic energy of the wind passing through the shelterbelt. The center has very little lodging because, as the strong wind encounters the shelterbelt, it loses kinetic energy or experiences turbulence, reducing the direct impact on crops. Still further downwind, the second severe lodging area is due to the wind returning to full speed beyond the shelterbelt’s effective protection distance. The non-lodging area (at the right in Figure 6) can be attributed to the shelter network’s weakening effect on air flow upwind from the north shelterbelt [36].
Table 1 shows the relationship of the tree species, the number of rows in the shelterbelt, and the distance between the shelterbelt rows. We analyzed the protection effect of different tree species, numbers of rows, and distance between the shelterbelt rows behind the shelterbelt by comparing the lodging situation in the crop fields.
We calculated the ILCD from the closest occurrence of crop lodging behind the shelterbelt; however, to provide a more representative measure of the crop damage, following the recommendation of Zhang et al. [32]. we calculated the lodging rate within an area of 36 hm2 (formed by a shelterbelt network of 600 m × 600 m) behind the shelterbelt. The crop lodging rate behind a pure shelterbelt of Pinus sylvestris var. mongolica with a distance between shelterbelt rows of 4.5 m was 56.8%. The crop lodging rate was 11.9% in the mixed shelterbelt of Pinus sylvestris var. mongolica and Populus simonii×P. nigra with a distance between shelterbelt rows of 7.5 m, but it was 69.5% when the distance between shelterbelt rows was 2.5 m and 86.7% with a distance between shelterbelt rows of 1.9 m. We found the lowest crop lodging rate occurred with a 7.5 m distance between shelterbelt rows behind the mixed Pinus sylvestris var. mongolica and Populus simonii×P. nigra shelterbelt. Therefore, we conclude that distance between shelterbelt rows is the dominant factor determining the protective effect of the shelterbelt: the larger the distance between shelterbelt rows, the larger the ILCD under typhoon conditions.
3.3. Tree Gaps
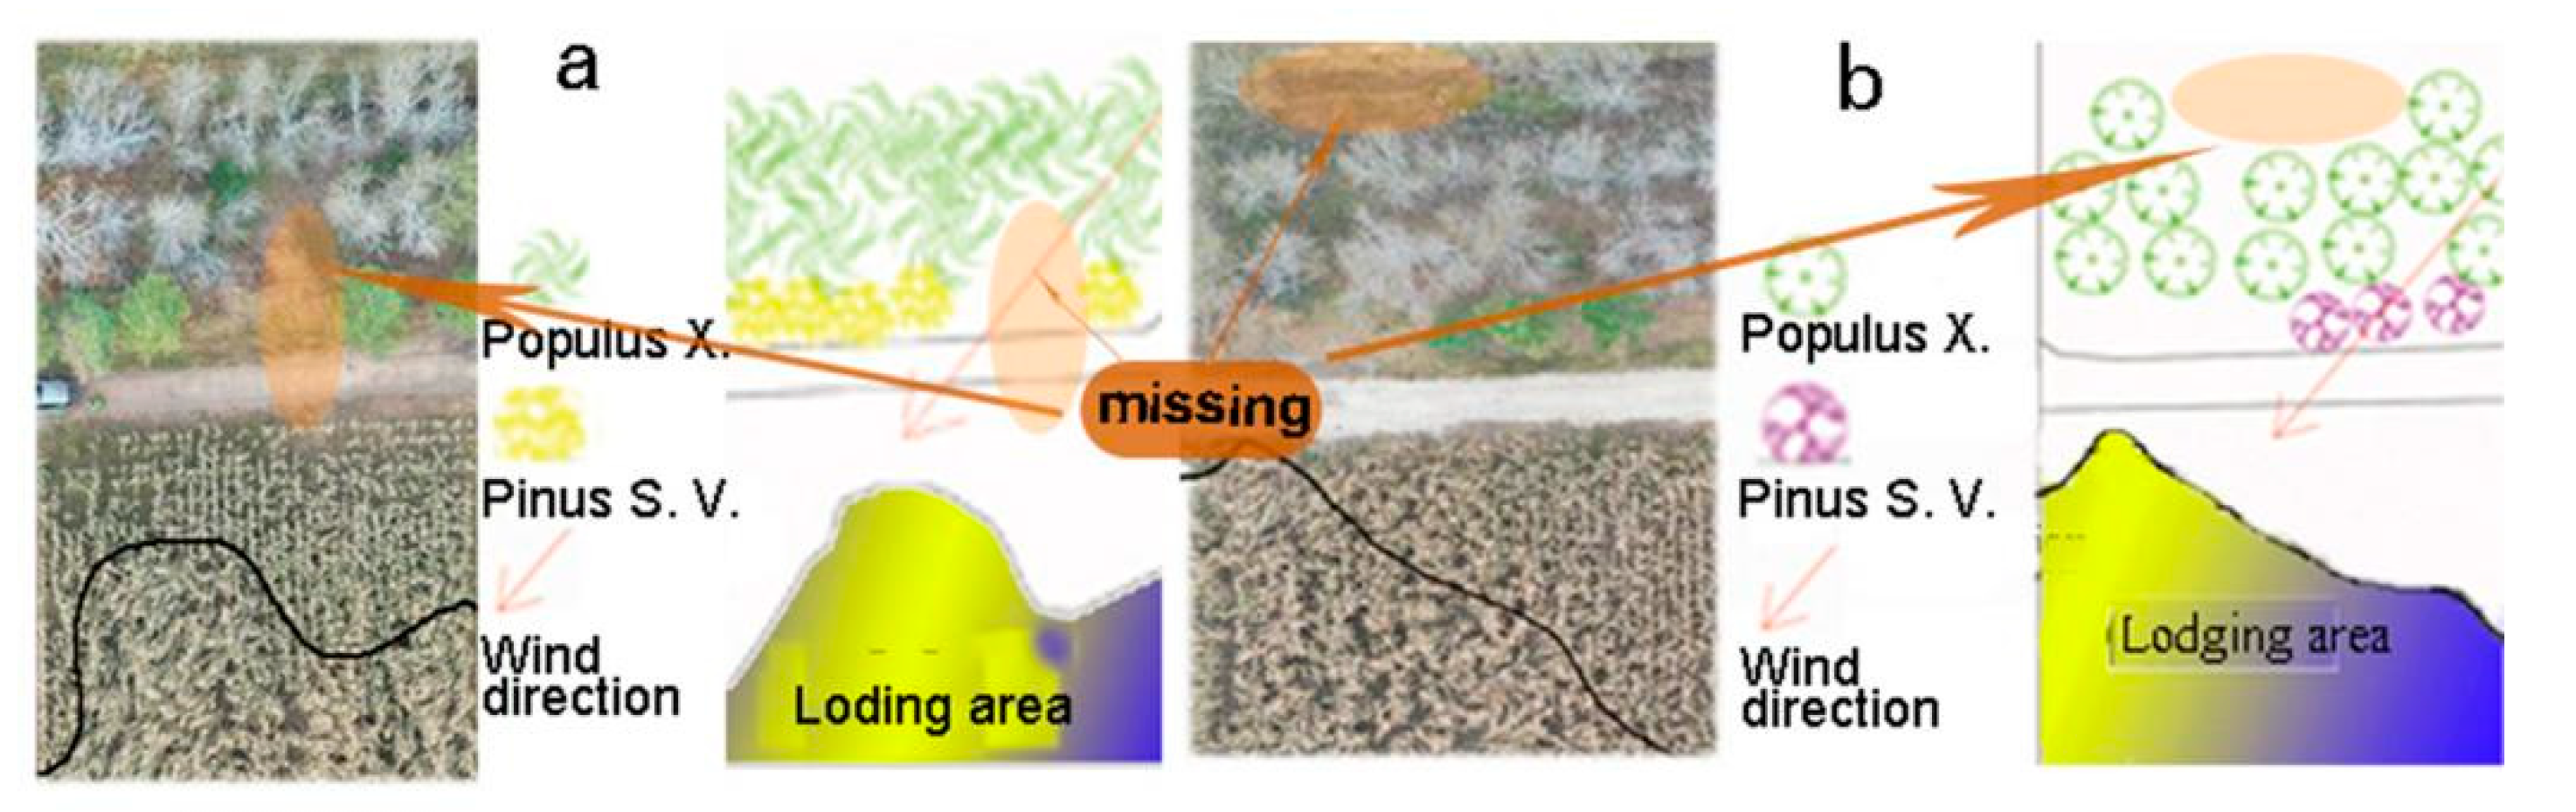
To examine the influence of tree gaps on the protective effect of shelterbelts, we selected two shelterbelts with missing trees for further study. Figure 7a,b show that the ILCD for belts with gaps was shorter compared with that for shelterbelts with no missing trees, indicating that the tree gaps reduced the protective effects of those shelterbelts. Qu [38] called for shelterbelt managers to replace trees immediately in cases where gaps are greater than 7 m long, or 4 m long in areas of strong winds, while Zhang et al. [32], argued that shelterbelts need to be at least 90% complete to maintain their protective effect. Here, we found that the crops closest to the shelterbelt had different lodging characteristics depending on their proximity to gaps, with greater damage near the gaps. In the image, the brown elliptical regions indicate shelterbelts with missing trees, which resulted in more severe lodging than the shelterbelts without missing trees. In the shelterbelts without missing trees, ILCD was longer, and in those with missing trees, the onset of lodging was closer to the gaps in the shelterbelt. Therefore, in the existing shelterbelts, the missing plantings should be repaired in time to achieve a better protective effect.
3.4. Lodging Resistance of Agricultural Crop Species
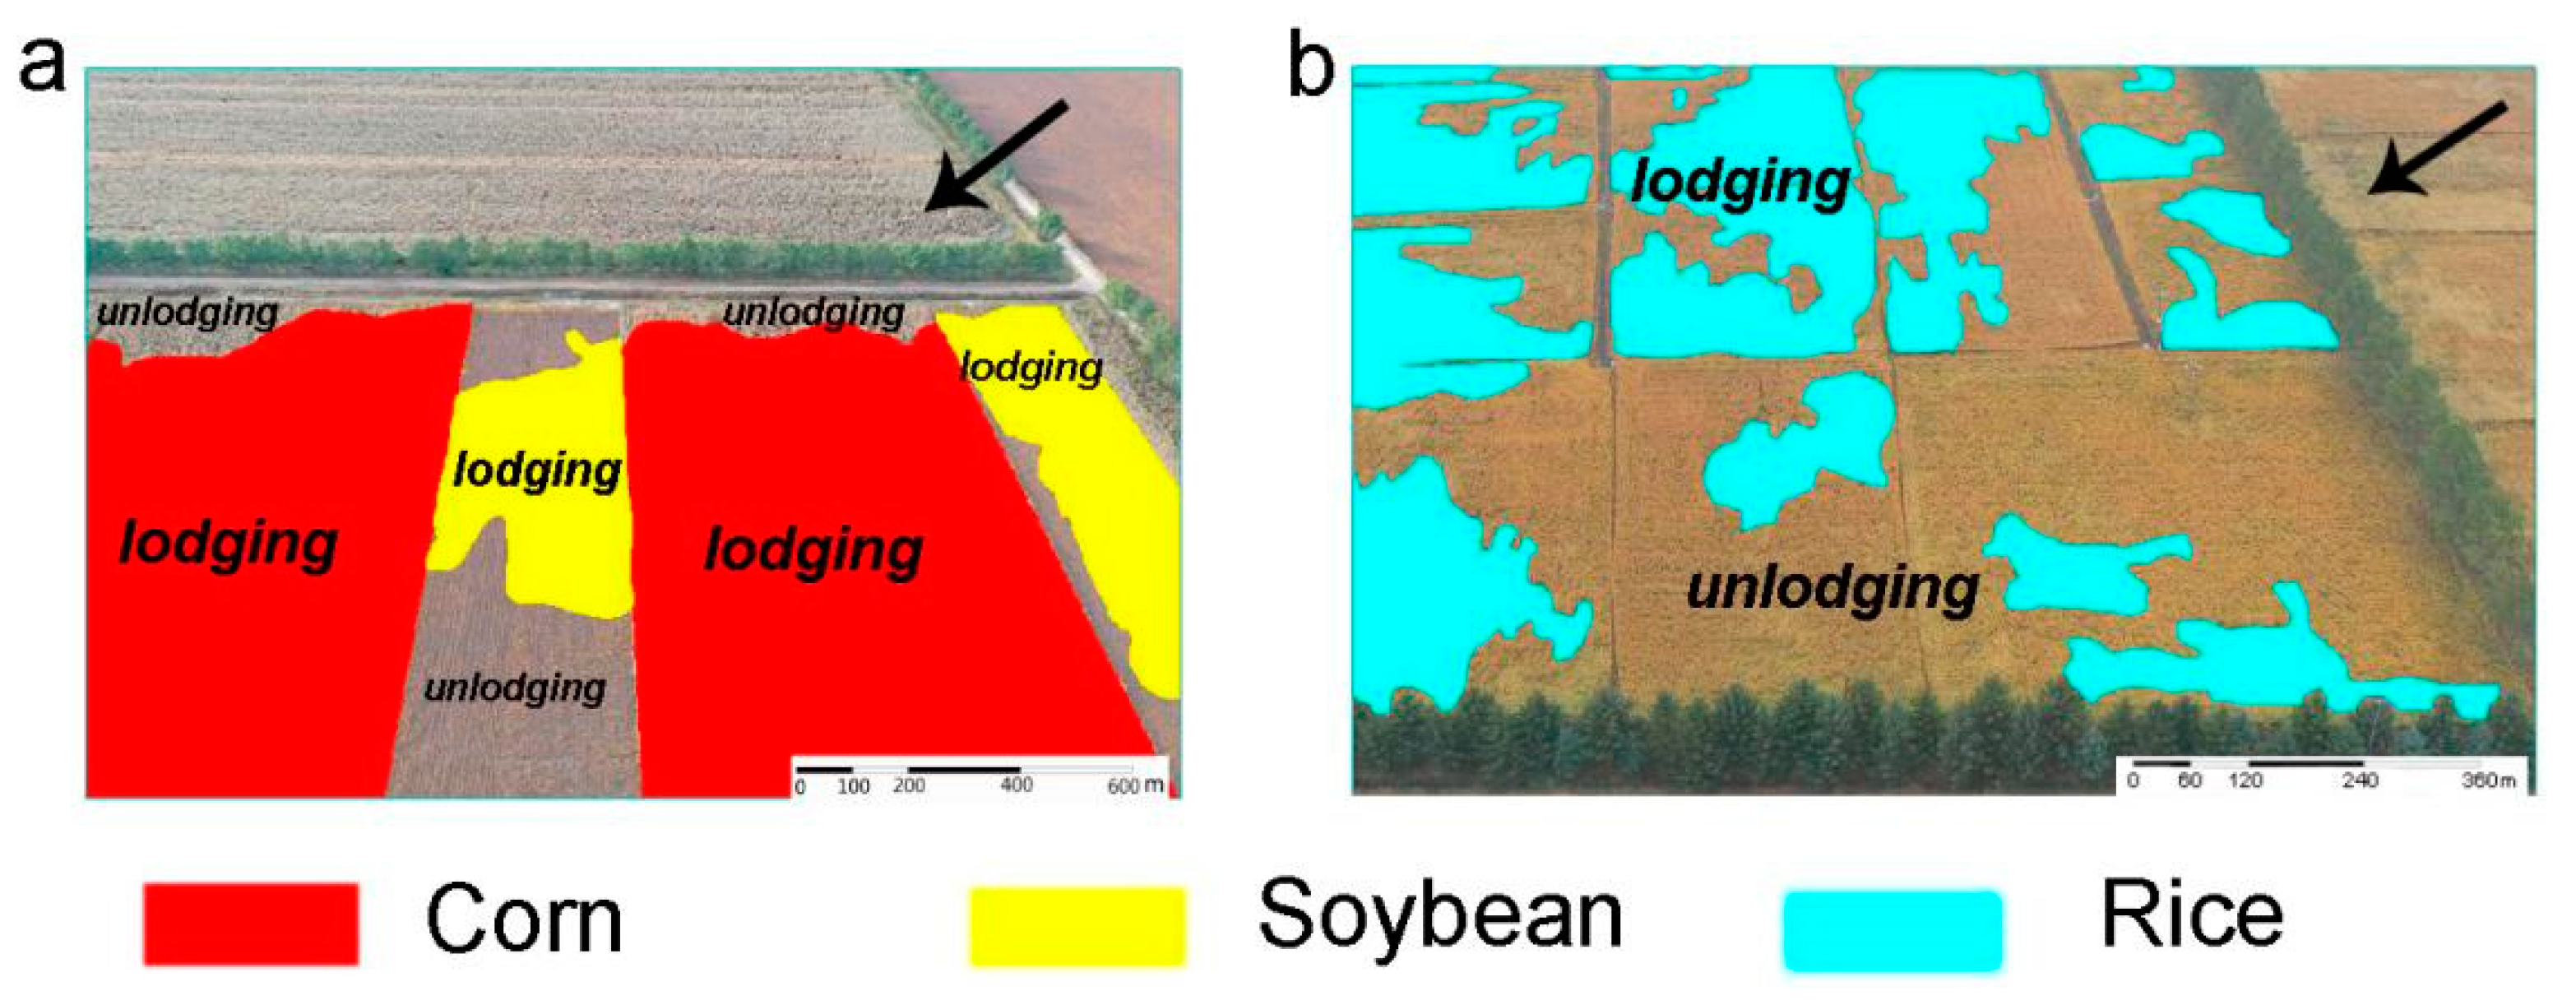
In order to compare the lodging resistance of different crops, we selected plots with different crop types (rice, soybeans, and maize) but similar site conditions, the same shelterbelt structure and tree species, and similar spatial orientations. As before, we extracted the lodging area of these plots by visual interpretation of UAV imagery (see Figure 8a,b). The lodging area of the rice paddy fields, soybean fields, and maize (corn) fields accounted for 36%, 52%, and 94%, respectively, of the total area of each plot. The results show that different crops had a differential resistance to wind stress under similar conditions.
After analyzing the spatial characteristics of the lodging occurrence among the three crops, we found that the rice paddies displayed discontinuous, alternating patterns of lodging downwind from the shelterbelt. This suggests that rice could better reflect the spatial distribution of the wind speed behind the shelterbelt due to its different state of lodging, which is easier to recognize in the image. In contrast, lodging was continuous in the maize and soybean fields, and the lodging area was larger in the maize fields. In general, among the three crops, rice had the strongest lodging resistance, while maize had the weakest lodging resistance, which may be related to the greater height of maize and its larger grain load.
4. Discussion
Although porosity seems to affect the protective effects of shelter belts the most, other factors are also important. For shelterbelts with similar levels of porosity, the distance between shelterbelt rows, number of rows in the shelterbelt, tree species composition, and tree height may create some differences. The distance between shelterbelt rows had the greatest impact on the protection effect, and tree height also had some effect. The width of the belt seemed not to be a dominant factor. Therefore, we will focus our discussion on the distance between shelterbelt rows and porosity.
Among the shelterbelts we investigated, those with the largest distance between shelterbelt rows had the best protective effect, while degraded shelterbelts with dead or missing trees had the worst. Based on these results, the construction of shelterbelts in the black soil farmland region of Northeast China should increase the distance between the shelterbelt rows of the shelterbelt appropriately. The absence of shrubs in most existing shelterbelts weakens their protection effect. The effectiveness of shelterbelts in preventing typhoon-induced crop damage is closely related to the integrity of the main shelterbelt. Therefore, we suggest that the planning and construction of shelterbelt networks in the black soil area should consider these findings: tree gaps should be replanted, the distance between shelterbelt rows of new shelterbelts should be appropriately increased, and the spacing between trees should be appropriately reduced so as to maximize the protective effect.
This study suggests that shelterbelt managers in Northeast China can adapt the lessons of belt design from farther south in China that have been shown to be effective in protecting against crop damage from typhoons [39,40]. In Jiangsu Province, Zhang et al. [41] found that cotton lodging and yield loss was reduced in an area extending 27 h (27 times the height of the trees) leeward of shelterbelts. In the middle and lower reaches of the Yangzi River (Changjiang) basin, Zhang [42] also found that typhoon-induced rice lodging behind shelterbelts was reduced to 16.28%, or half as much damage as that found in our investigation in the black soil area. In that study in South China, the shelterbelt network encompassed farmland cells of 4–6 hm2, while the farmland protective shelterbelt network in the black soil region of Northeast China encompasses farmland cells of 30–36 hm2. The smaller grid size in the southern regions has a better protective effect against typhoons [43,44]. However, due to differences in suitable tree species and soil types between the north and the south, and the continued importance of preventing spring wind erosion in the north, further work is required to evaluate shelterbelt configurations suitable for the northern black soil region.
5. Conclusions
Farmland shelterbelts are mainly used to prevent spring wind erosion in North China. As North China has rarely been affected by typhoons, their effectiveness in preventing crop damage from typhoons has not previously been measured or considered for shelterbelt design. Existing shelterbelts are at least partially effective at reducing crop damage from typhoons. The main findings of this study are as follows:
- Reducing the porosity of shelterbelts can increase the ILCD when in a porosity between 0.25–0.50, thus improving shelterbelt protection.
- The distance between shelterbelt rows has a significant effect on the ILCD. The larger the distance between the shelterbelt rows, the further the ILCD, and the better the protection effect.
- The lodging resistance of maize is lower than that of soybean and rice.
- The protective effect of mixed tree and shrub shelterbelts is better than that of a single tree species shelterbelt.
Our use of UAV remote imagery was effective at identifying the visible characteristics of the shelterbelts and crops, but we also noted limitations in this method’s ability to differentiate the degrees of crop lodging or other less visible aspects of shelterbelt quality. Further research should expand on the use of these methods beyond the 14 shelterbelts examined here. Researchers should also consider employing imagery outside of visible wavelengths to better distinguish crop and shelterbelt characteristics in order to contribute to the sustainable development of agriculture and shelterbelts around the world.
Author Contributions
Conceptualization, X.C. and B.L.; methodology, X.C.; software, X.C.; validation, B.L.; formal analysis, X.C.; investigation, X.C., Y.S. and L.W.; writing—original draft preparation, X.C.; writing—review, M.H. and B.L. All authors have read and agreed to the published version of the manuscript.
Funding
This research was funded by the National Natural Science Foundation of China (41877416), the National Key Research and Development Program of China (2017YFD0601204-01-03, 2018YFC0507003-02), and the Fundamental Research Funds for the Central Universities (2572019CP09).
Acknowledgments
We gratefully acknowledge the National Key Research and Development Program of China (2018YFC0507003-02 and 2017YFD0601204-01-03), the National Natural Science Foundation of China (41877416), and the Fundamental Research Funds for the Central Universities (2572019CP09) for funding this work.
Conflicts of Interest
The authors declare no conflict of interest.
References
- Balaguru, K.; Foltz, G.R.; Leung, L.R.; Emanuel, K.A. Global warming-induced upper-ocean freshening and the intensification of super typhoons. Nat. Commun. 2016, 7, 13670. [Google Scholar] [CrossRef] [PubMed] [Green Version]
- Fumin, R.; Gleason, B.; Easterling, D. Typhoon impacts on china’s precipitation during 1957–1996. Adv. Atmospheric Sci. 2002, 19, 943–952. [Google Scholar] [CrossRef]
- Zhao, X.L. Research advances on spatial and temporal characteristics of tropical cyclones landfalling in China in the past 50 years and their impacts on agriculture. J. Mar. Meteorol. 2019, 39, 1–11. (In Chinese) [Google Scholar]
- Wang, H.P.; Dong, L. Overview of typhoon activities over western North Pacific and the South China Sea in 2019. J. Mar. Meteorol. 2019, 40, 1–9. [Google Scholar]
- Zu, T.; Zhang, W.; Wang, X.; Li, D.; Feng, D. Influence of “Lekima” Super Typhoon on Shenbei New District in 2019 Flood Season. J. Agric. Catastrophol. 2020, 10, 78–79. [Google Scholar]
- Wang, Y.; Wang, T. Numerical Simulation of a Heavy Rainstorm in Northeast China Caused by the Residual Vortex of Typhoon 1909 (Lekima). Atmosphere 2020, 12, 120. [Google Scholar] [CrossRef]
- Murakami, T.; Yui, M.; Amaha, K. Canopy Height Measurement by Photogrammetric Analysis of Aerial Images: Application to Buckwheat (Fagopyrum Esculentum Moench) Lodging Evaluation. Comput. Electron. Agric. 2012, 89, 70–75. [Google Scholar] [CrossRef]
- Tian, B.M.; Yang, G.S. The performance of Lodging and Developing a Standard Test for Lodging Resistance in Crops. Chin. Agric. Sci. Bull. 2005, 21, 111–114. [Google Scholar]
- Erley, G.S.; Auf’m Kaul, H.-P.; Kruse, M.; Aufhammer, W. Yield and nitrogen utilization efficiency of the pseudocereals amaranth, quinoa, and buckwheat under differing nitrogen fertilization. Eur. J. Agron. 2005, 22, 95–100. [Google Scholar] [CrossRef]
- He, X.B.; Wu, X.H.; Ma, Y.H. Effect of Lodging Caused by Typhoon on Grain Yield of Rice in Taizhou. China Rice 2015, 2, 28–29. [Google Scholar]
- Yang, K.; Shi, Z.Q.; Ma, Z.G. Impact of Typhoon “Megi” on Agricultural Production in Fujian Province in 2016. In Proceedings of the 34th Annual Meeting of the Chinese Meteorological Society, Zhengzhou, China, 27–29 September 2017. [Google Scholar]
- Tiehua, C.; Yihe, L.; Gang, L. Yield effects of lodging and straightening in maize. Maize Sci. 2013, 6, 81–90. (In Chinese) [Google Scholar]
- Wang, S.; Toumi, R. Recent migration of tropical cyclones toward coasts. Science 2021, 371, 514–517. [Google Scholar] [CrossRef]
- Chan, J.C.L.; Shi, J.-E.; Liu, K.S. Improvements in the Seasonal Forecasting of Tropical Cyclone Activity over the Western North Pacific. Weather. Forecast. 2001, 16, 491–498. [Google Scholar] [CrossRef]
- Tsognamsrai, D.; Dugarjav, C. Effectiveness of some methods for restoration of degraded pastures in the desert–steppe zone of Mongolia. Arid Ecosyst. 2016, 6, 189–194. [Google Scholar] [CrossRef]
- Pablo, L.P.; Mark, B. Windbreaks in southern Patagonia, Argentina: A review of research on growth models, windspeed reduction, and effects on corps. Agrofor. Syst. 2002, 56, 129–144. [Google Scholar]
- Tang, Y.L.; An, Z.S.; Zhang, K.C.; Tan, L.H. Wind Tunnel Simulation of Windbreak Effect of Single-row Shelter Belts of Different Structure. J. Desert Res. 2012, 32, 647–654. [Google Scholar]
- Brandle, J.R.; Hodges, L.; Zhou, X.H. Windbreaks in North American agricultural systems. Adv. Agrofor. 2004, 61, 65–78. [Google Scholar] [CrossRef] [Green Version]
- Li, X.; Liu, L.; Xie, J.; Wang, Z.; Yang, S.; Zhang, Z.; Qi, S.; Li, Y. Optimizing the quantity and spatial patterns of farmland shelter forests increases cotton productivity in arid lands. Agric. Ecosyst. Environ. 2020, 292, 106832. [Google Scholar] [CrossRef]
- Smith, M.M.; Bentrup, G.; Kellerman, T.; MacFarland, K.; Straight, R.; Ameyaw, L. Windbreaks in the United States: A systematic review of producer-reported benefits, challenges, management activities and drivers of adoption. Agric. Syst. 2021, 187, 103032. [Google Scholar] [CrossRef]
- Jiang, F.Q.; Zhou, X.H.; Fu, M.H. Forest belt porosity model and its application. Chin. J. Appl. Ecol. 1994, 5, 251–255. [Google Scholar]
- Mohammed, A.E.; Stigter, C.J.; Adam, H.S. On shelterbelt design for combating sand invasion. Agric. Ecosyst. Environ. 1996, 57, 81–90. [Google Scholar] [CrossRef]
- Zhu, J.J.; Jiang, F.Q.; Matsuzaki, T. spacing interval between princial tree wind breaks-Based on the telationship between windbreak structure and wind reduction. J. For. Res. 2002, 13, 83–89. [Google Scholar]
- Guan, W.; Li, C.; Li, S.; Fan, Z.; Xie, C. Improvement and application of digitized measure on shelterbelt porosity. Chin. J. Appl. Ecol. 2002, 13, 651–657. [Google Scholar]
- Yang, X.; Li, F.; Fan, W.; Liu, G.; Yu, Y. Evaluating the efficiency of wind protection by windbreaks based on remote sensing and geographic information systems. Agrofor. Syst. 2021, 95, 353–365. [Google Scholar] [CrossRef]
- Menzies, N.K. Forest and Land Management in Imperial China; St. Martin’s Press: New York, NY, USA, 1994. [Google Scholar]
- Songster, E.E. Cultivating the Nation in Fujian’s Forests: Forest Policies and Afforestation Efforts in China, 1911–1937. Environ. Hist. 2003, 8, 452–473. [Google Scholar] [CrossRef]
- Zastrow, M. China’s tree-planting drive could falter in a warming world. Nature 2019, 573, 474–475. [Google Scholar] [CrossRef] [PubMed]
- Wang, H.; Takle, E.S.; Shen, J.M. Shelterbelts and windbreaks: Mathematical modeling and computer simulations and turbulent flows. Adv. Mech. 2003, 33, 119–137. [Google Scholar]
- Perera, M. Shelter behind two-dimensional solid and porous fences. J. Wind. Eng. Ind. Aerodyn. 1981, 8, 93–104. [Google Scholar] [CrossRef]
- Jiang, F.Q.; Zhu, J.J. Phase-directional management of protective plantations Ⅰ. Fundamentals. Chin. J. Appl. Ecol. 2002, 13, 1352–1355. [Google Scholar]
- Zhang, J.L. Research method on the protective effect of farmland, windbreak network to the wind-destroyed crop-yields. J. Nanjing Univ. Nat. Sci. Ed. 1996, 1, 38–42. [Google Scholar]
- Xu, X.; Xu, Y.; Chen, S.-C.; Xu, S.; Zhang, H. Soil loss and conservation in the black soil region of Northeast China: A retrospective study. Environ. Sci. Policy 2010, 13, 793–800. [Google Scholar] [CrossRef]
- Wang, S.L.; Toumi, R. Treasure Force Area Farmland Shelterbelt Meteorological Effect Analysis. Western Northeast China and Eastern Inner Mongolia Shelter Forest Research; Northeast Forestry University Press: Harbin, China, 1989. [Google Scholar]
- Li, Y.P.; Feng, Y.J.; Yang, G.H. Study on windbreak effect of farmland shelterbelts in dry farmlands of North China. J. Northwest A F Univ. Nat. Sci. Ed. 2009, 37, 92–98. [Google Scholar]
- Zhang, H.L. Evaluate and Study on Modification Technology of Degraded Poplar Forest Stand in Zone of Middle Sanggan River Basin of the North of Yanmenguan in Shanxi. Master’s Thesis, Beijing Forestry University, Beijing, China, 2017. [Google Scholar]
- Tian, M.; Ban, S.; Yuan, T.; Ji, Y.; Ma, C.; Li, L. Monitoring of lodged rice using low-altitude UAV based multispectral image. Acta Agric. Shanghai 2018, 34, 88–93. [Google Scholar]
- Qu, M.Z. The Effect of the Shelterbelt Structural Integrity on the Wind Fields of Farmland Shelterbelt Network in the Yellow River Floodplain. Master’s Thesis, Shandong Agricultural University, Shandong, China, 2015. [Google Scholar]
- Fang, F.; Chen, Y.; Liang, J. Construction benefits and evaluation of coastal shelter forest system in Hainan province. J. Cent. South Univ. Sci. Technol. 2013, 33, 115–119. [Google Scholar]
- Li, W.H.; Zhou, H.F.; Shao, X.X.; Wu, M.; Liang, W.; Fang, C.L. Protective Effect of Coastal Protection shelter along South Shore of Hangzhou Bay. Prot. Shelter. Sci. Technol. 2012, 3, 6–8. [Google Scholar]
- Jinn, Z.; Lixin, K.; Yonghua, J. Effect of farmland windbreak on preventing cotton lodging and its yield reduction under violent tropical storm. Chin. J. Appl. Ecol. 1997, 8, 127–133. [Google Scholar]
- Jinn, Z.; Lixin, K.; Yonghua, J. Effect of farmland windbreak on preventing rice lodging and yield reduction under violent tropical storm. Chin. J. Appl. Ecol. 1996, 1, 15–18. [Google Scholar]
- Ji, Y.H.; Zhang, J.L. Research on sustainable management technology of agroforestry system in coastal zone. Dev. For. Sci. Technol. 2008, 4, 5–8. [Google Scholar]
- Lei, Z.; Yi, D.; Mukui, Y. Numerical Simulation on Windbreak Effect of Coastal Shelterbelts Nets. Chin. Agric. Sci. Bull. 2015, 31, 34–39. [Google Scholar]
Figure 1.
Crop lodging after Typhoon Haishen adjacent to a 600 m shelterbelt. The inset shows the lodging areas in white, and unlodging in yellow and green.
Figure 1.
Crop lodging after Typhoon Haishen adjacent to a 600 m shelterbelt. The inset shows the lodging areas in white, and unlodging in yellow and green.

Figure 2.
Five study sites (A, C, D, and E each contain five shelterbelts; B contains four shelterbelts).
Figure 2.
Five study sites (A, C, D, and E each contain five shelterbelts; B contains four shelterbelts).

Figure 3.
Extraction chart of the porosity.

Figure 4.
Extraction steps and drawing: (a) corrected imagery; (b) unlodged crops are shown in green and lodged crops are shown in red; (c) red is the crop lodging area. F is the starting lodging distance of the crops behind the shelterbelt.
Figure 4.
Extraction steps and drawing: (a) corrected imagery; (b) unlodged crops are shown in green and lodged crops are shown in red; (c) red is the crop lodging area. F is the starting lodging distance of the crops behind the shelterbelt.

Figure 5.
Scatterplot of the shelter forest porosity and ILCD (r = −0.847, p < 0.01).

Figure 6.
Spatial distribution of rice lodging in a shelterbelt network. Note: Green represents crop severe lodgings, yellow represents mild lodging, and blue represents no lodging. Black is shadows. Red dots indicate trees. The arrow represents the direction of the wind (25° N by W).
Figure 6.
Spatial distribution of rice lodging in a shelterbelt network. Note: Green represents crop severe lodgings, yellow represents mild lodging, and blue represents no lodging. Black is shadows. Red dots indicate trees. The arrow represents the direction of the wind (25° N by W).

Figure 7.
Crop lodging in relation to tree gaps in shelterbelts. The orange area represents missing tree gaps. Black lines indicate the extent of lodging.
Figure 7.
Crop lodging in relation to tree gaps in shelterbelts. The orange area represents missing tree gaps. Black lines indicate the extent of lodging.

Figure 8.
Lodging of (a) rice and soybean, and (b) maize. Red indicates corn lodging. Yellow indicates soybean lodging. Blue indicates rice lodging. Scale: a = 1:200, b = 1:120. Arrowa indicate the wind direction.
Figure 8.
Lodging of (a) rice and soybean, and (b) maize. Red indicates corn lodging. Yellow indicates soybean lodging. Blue indicates rice lodging. Scale: a = 1:200, b = 1:120. Arrowa indicate the wind direction.


Table 1.
The relationship between initial lodging distance (ILCD) for crops on the leeward side of the shelterbelts with different configurations.
Table 1.
The relationship between initial lodging distance (ILCD) for crops on the leeward side of the shelterbelts with different configurations.
| Tree Species | Number of Rows in Shelterbelt | Distance between Shelterbelt Rows(m) | ILCD (H) | The Correlation Coefficient between the Distance between Shelterbelt Rows and the ILCD (R) |
|---|---|---|---|---|
| P. sylvestix var mongolica and Ulmus pumila | 1 | - | 1.86 × AHSB | R = 0.820 p = 0.007 < 0.01 |
| P. sylvestris var mongolica | 1 | - | 1.19 × AHSB | |
| P. sylvestris var mongolica | 2 | - | 2.55 × AHSB | |
| P. sylvestris var mongolica | 3 | - | 1.28 × AHSB | |
| P.sylvestris var mongolica and Populus simonii×P. nigra | 2 | 4.5 | 2.55 × AHSB | |
| P.sylvestris var mongolica and Populus simonii×P. nigra | 2 | 7.5 | 3.82 × AHSB | |
| P.sylvestris var mongolica and Populus simonii×P. nigra | 3 | 2.5 | 1.19 × AHSB | |
| P.sylvestris var mongolica and Populus simonii×P. nigra | 3 | 5 | 1.28 × AHSB | |
| P.sylvestris var mongolica and Populus simonii×P. nigra | 4 | 1.9 | 1.35 × AHSB | |
| P.sylvestris var mongolica and Populus simonii×P. nigra | 4 | 3.8 | 1.5 × AHSB |
AHSB: average height of the shelterbelt.
Publisher’s Note: MDPI stays neutral with regard to jurisdictional claims in published maps and institutional affiliations. |
© 2021 by the authors. Licensee MDPI, Basel, Switzerland. This article is an open access article distributed under the terms and conditions of the Creative Commons Attribution (CC BY) license (https://creativecommons.org/licenses/by/4.0/).
Share and Cite
MDPI and ACS Style
Cai, X.; Henderson, M.; Wang, L.; Su, Y.; Liu, B. Shelterbelt Structure and Crop Protection from Increased Typhoon Activity in Northeast China. Agriculture 2021, 11, 995. https://0-doi-org.brum.beds.ac.uk/10.3390/agriculture11100995
AMA Style
Cai X, Henderson M, Wang L, Su Y, Liu B. Shelterbelt Structure and Crop Protection from Increased Typhoon Activity in Northeast China. Agriculture. 2021; 11(10):995. https://0-doi-org.brum.beds.ac.uk/10.3390/agriculture11100995
Chicago/Turabian StyleCai, Xuelu, Mark Henderson, Ligang Wang, Yuanhang Su, and Binhui Liu. 2021. "Shelterbelt Structure and Crop Protection from Increased Typhoon Activity in Northeast China" Agriculture 11, no. 10: 995. https://0-doi-org.brum.beds.ac.uk/10.3390/agriculture11100995
Note that from the first issue of 2016, this journal uses article numbers instead of page numbers. See further details here.