
Exploring Climate Disaster Resilience: Insight into City and Zone Levels of Southern Taiwan


1
Department of Geomatics Engineering, National Cheng Kung University, No.1, University Road, Tainan City 701, Taiwan
2
International Program for Sustainable Development, International College of Practice and Education for the Environment, Chang Jung Christian University, No.1, Changda Rd., Gueiren District, Tainan City 71101, Taiwan
3
Graduate Institute of Environmental Engineering, National Taiwan University, No.1, Sec.4, Roosevelt Rd, Taipei 106, Taiwan
4
Water Innovation, Low-Carbon and Environmental Sustainability Research Center, College of Engineering, National Taiwan University, Taipei 106, Taiwan
*
Author to whom correspondence should be addressed.
Agriculture 2021, 11(2), 107; https://0-doi-org.brum.beds.ac.uk/10.3390/agriculture11020107
Submission received: 31 December 2020
/
Revised: 23 January 2021
/
Accepted: 26 January 2021
/
Published: 31 January 2021
(This article belongs to the Special Issue Impact of Climate Change on Agriculture)
Abstract
:While climate change is one of the greatest environmental threats the entire world faces today, rapid urbanization is making both the community and ecosystem more vulnerable to the impacts of climate change. Estimating urban resilience is thus one of the important processes to understanding the current and potential future risks of cities providing practical policies and qualified strategies to cope with climate change effects. This study presents a disaster risk analysis in Southern Taiwan at the municipal and zone levels using the Climate Disaster Resilience Index (CDRI). The index was estimated at both the zone and city scale of three coastal cities, namely Tainan, Kaohsiung, and Pingtung. The CDRI approach consists of five different dimensions (physical, social, economic, institutional, and natural), with several parameters and variables reflecting the abilities, strength, and threats of case study cities to cope with potential climate-related disasters. The findings show that, while the physical dimension has the highest resilience among cities, the lowest average scores and the least resilience belong to the natural dimension. The overall CDRI score for different cites also revealed various capabilities, shortcomings, drawbacks, and potential risks of neighbored cities in the same region. It is expected that the findings of this study shall serve as an urban planning tool to recognize the sectors within an urban context that are more or less resilient, enhance actions at the local level, and support future planning decisions.
1. Introduction
Despite the international efforts on reducing greenhouse gas emissions, as the main causes of global warming, climate change is still projected to continue over the next century [1]. While all cities face risks from a range of natural and human-induced disasters, coastal areas are highly threatened by the consequences of both climate and anthropogenic changes, as over 40% of the global population lives within 100 km from the coast [2]. Moreover, [3] estimated that 100 million people live less than one meter above the sea level. Whereas, between the 1950s and 1990s, there was a 50% increase in extreme weather events associated with global warming at coastal areas [4].
The increasing urban density in many Asian countries is considered to be the epicenter of the current urbanization surge, where about 1.1 billion people are projected to move to cities in the next 20 years [5]. Among different Asian affected areas by climate change, Taiwan is a vulnerable region facing the challenges of intensified typhoon intrusions and steady sea level rise [6]. With a more than 1300-km coastline in Taiwan, there has been a dramatic increase in the population and economic development in the coastal regions over the last few decades [7]. Southern Taiwan is particularly an ideal example of a region with large prospects for growth (population and economy), and it is situated in a coastal area where climate-induced disasters mostly occur. In recent decades, climatic hazards have been intensified by climate change and, consequently, affected the inhabitants of coastal areas on the southern shoreline of Taiwan [8].
Among the prescribed remediation strategies for dealing with climate change effects, the one that is rapidly gaining significance is the concept of “resilience” [9]. Resilience comes from the Latin verb “resilire”, which means rebound or spring back. Derived from material science, resilience is defined as the aptitude to recover the original appearance after a deformation or stress. It, thus, refers to a material’s capacity to return to its original form after being bent, compressed, or stretched [10]. Resilience has a conceptual fuzziness that is beneficial in enabling it to function as a “boundary object,” a common object or concept that appeals to multiple “social worlds” and can, therefore, foster a multidisciplinary scientific collaboration [11]. While the flexible nature of the meaning of resilience makes it more difficult to operationalize, it allows decision-makers and stakeholders to discuss around a common terminology without the necessity of agreement on an exact definition [12]. The concept of resilience addresses complex socioecological systems from a sustainable management perspective [13], particularly with respect to climate change issues [14,15]. Since the socioecological resilience approach considers systems in a dynamic nonlinear format, it is highly useful for estimating future climate uncertainties [16].
Urban Resilience Perception
Integrating resilience thinking into urban planning is an indispensable research subject in human ecology [17]. In particular, resilience has been introduced as an attractive city management perspective that is often theorized as complex, adaptive systems that can cope with the inherent uncertainty of the real world [18]. In disaster studies, urban resilience is often defined as “the capacity of a city to rebound from destruction” [19]. Urban resilience thus refers to the capacity of urban frameworks to function normally in different aspects of city operations (such as public safety, social organizations, and economic construction) through reasonable preparation, buffering, and responses to uncertainty disturbances. Despite being an emerging research topic, urban resilience has not been widely discussed, and there is currently no unified measurement standard. Jabareen [20] proposed concepts and strategies for a planning framework to build a resilient city, including a vulnerability analysis, government regulation prevention, and uncertainty-oriented planning. While the proposed approach provides an adaptable attitude to integrate multiple dimensions (social, economic, cultural, and environmental) into a unified framework, there is a lack of supporting data to analyze and interpret changes in urban resilience. Kim and Lim [21] considered urban resilience as an important measure for climate change adaptation and proposed a conceptual approach to analyzing resilience as a sociopolitical process in the context of climate change.
Qualitative and subjective measures are two separate categories of resilient assessments. While qualitative approaches are mainly adopted to understand the underlying vulnerability, community capacity, and perspectives on resilience factors [22], quantitative approaches attempt to make resilience comparable between geographic location and predominantly result in indices (quantifying variables of selected characteristics) built from survey results [23].
Today, resilience is an important concept and an attractive perspective in academic society, providing insights into complex socioecological systems and their sustainable management [13]. Among different disturbances, measuring disaster risks has been considered a basic principle for developing management strategies and policies that are aimed at building a disaster-resilient community.
Researchers have proposed different methodologies and frameworks for measuring disaster resilience using qualitative and quantitative approaches at the community, regional, and national levels. Indices are known as one of the useful tools to subjectively quantify the qualitative perception of resilience. Indicators are used to assess the relative resilience of geographic units through integrating several parameters into one composite index [24]. However, Marzi et al. [25] discussed that if an index is used only at a higher administrative level, the inherent variability of unit performance at a lower scale or administrative levels will be neglected. Accordingly, Hinkel [26] suggested that the indicator-based assessments are appropriate at the local scale, where systems are narrowly defined. Hence, resilience capacity estimations at lower scales (e.g., municipal or district levels) should be considered in the decision-making process and city planning strategies to avoid inadequately informed policies [25].
The Climate Disaster Resilience Index (CDRI) is one of the useful methods in measuring the resilience level aimed to create awareness of the current and future risks the city may face. The results of this method are used to establish an integrated and more comprehensive climate and disaster management scenarios [27].
This study addresses disaster risks in Southern Taiwan at both the city and zone levels through a CDRI approach. The zones in the current study were selected based on the administrative divisions and population density with slight modifications, where each zone consists of a few districts. An analysis of the urban resilience case studies was conducted using a multicriteria analysis approach in which the study participants ranked the issues presented according to the importance of the issue to them. Moreover, each indicator used in the assessment was assigned an associated set of choices, providing a quantitative rating of that indicator.
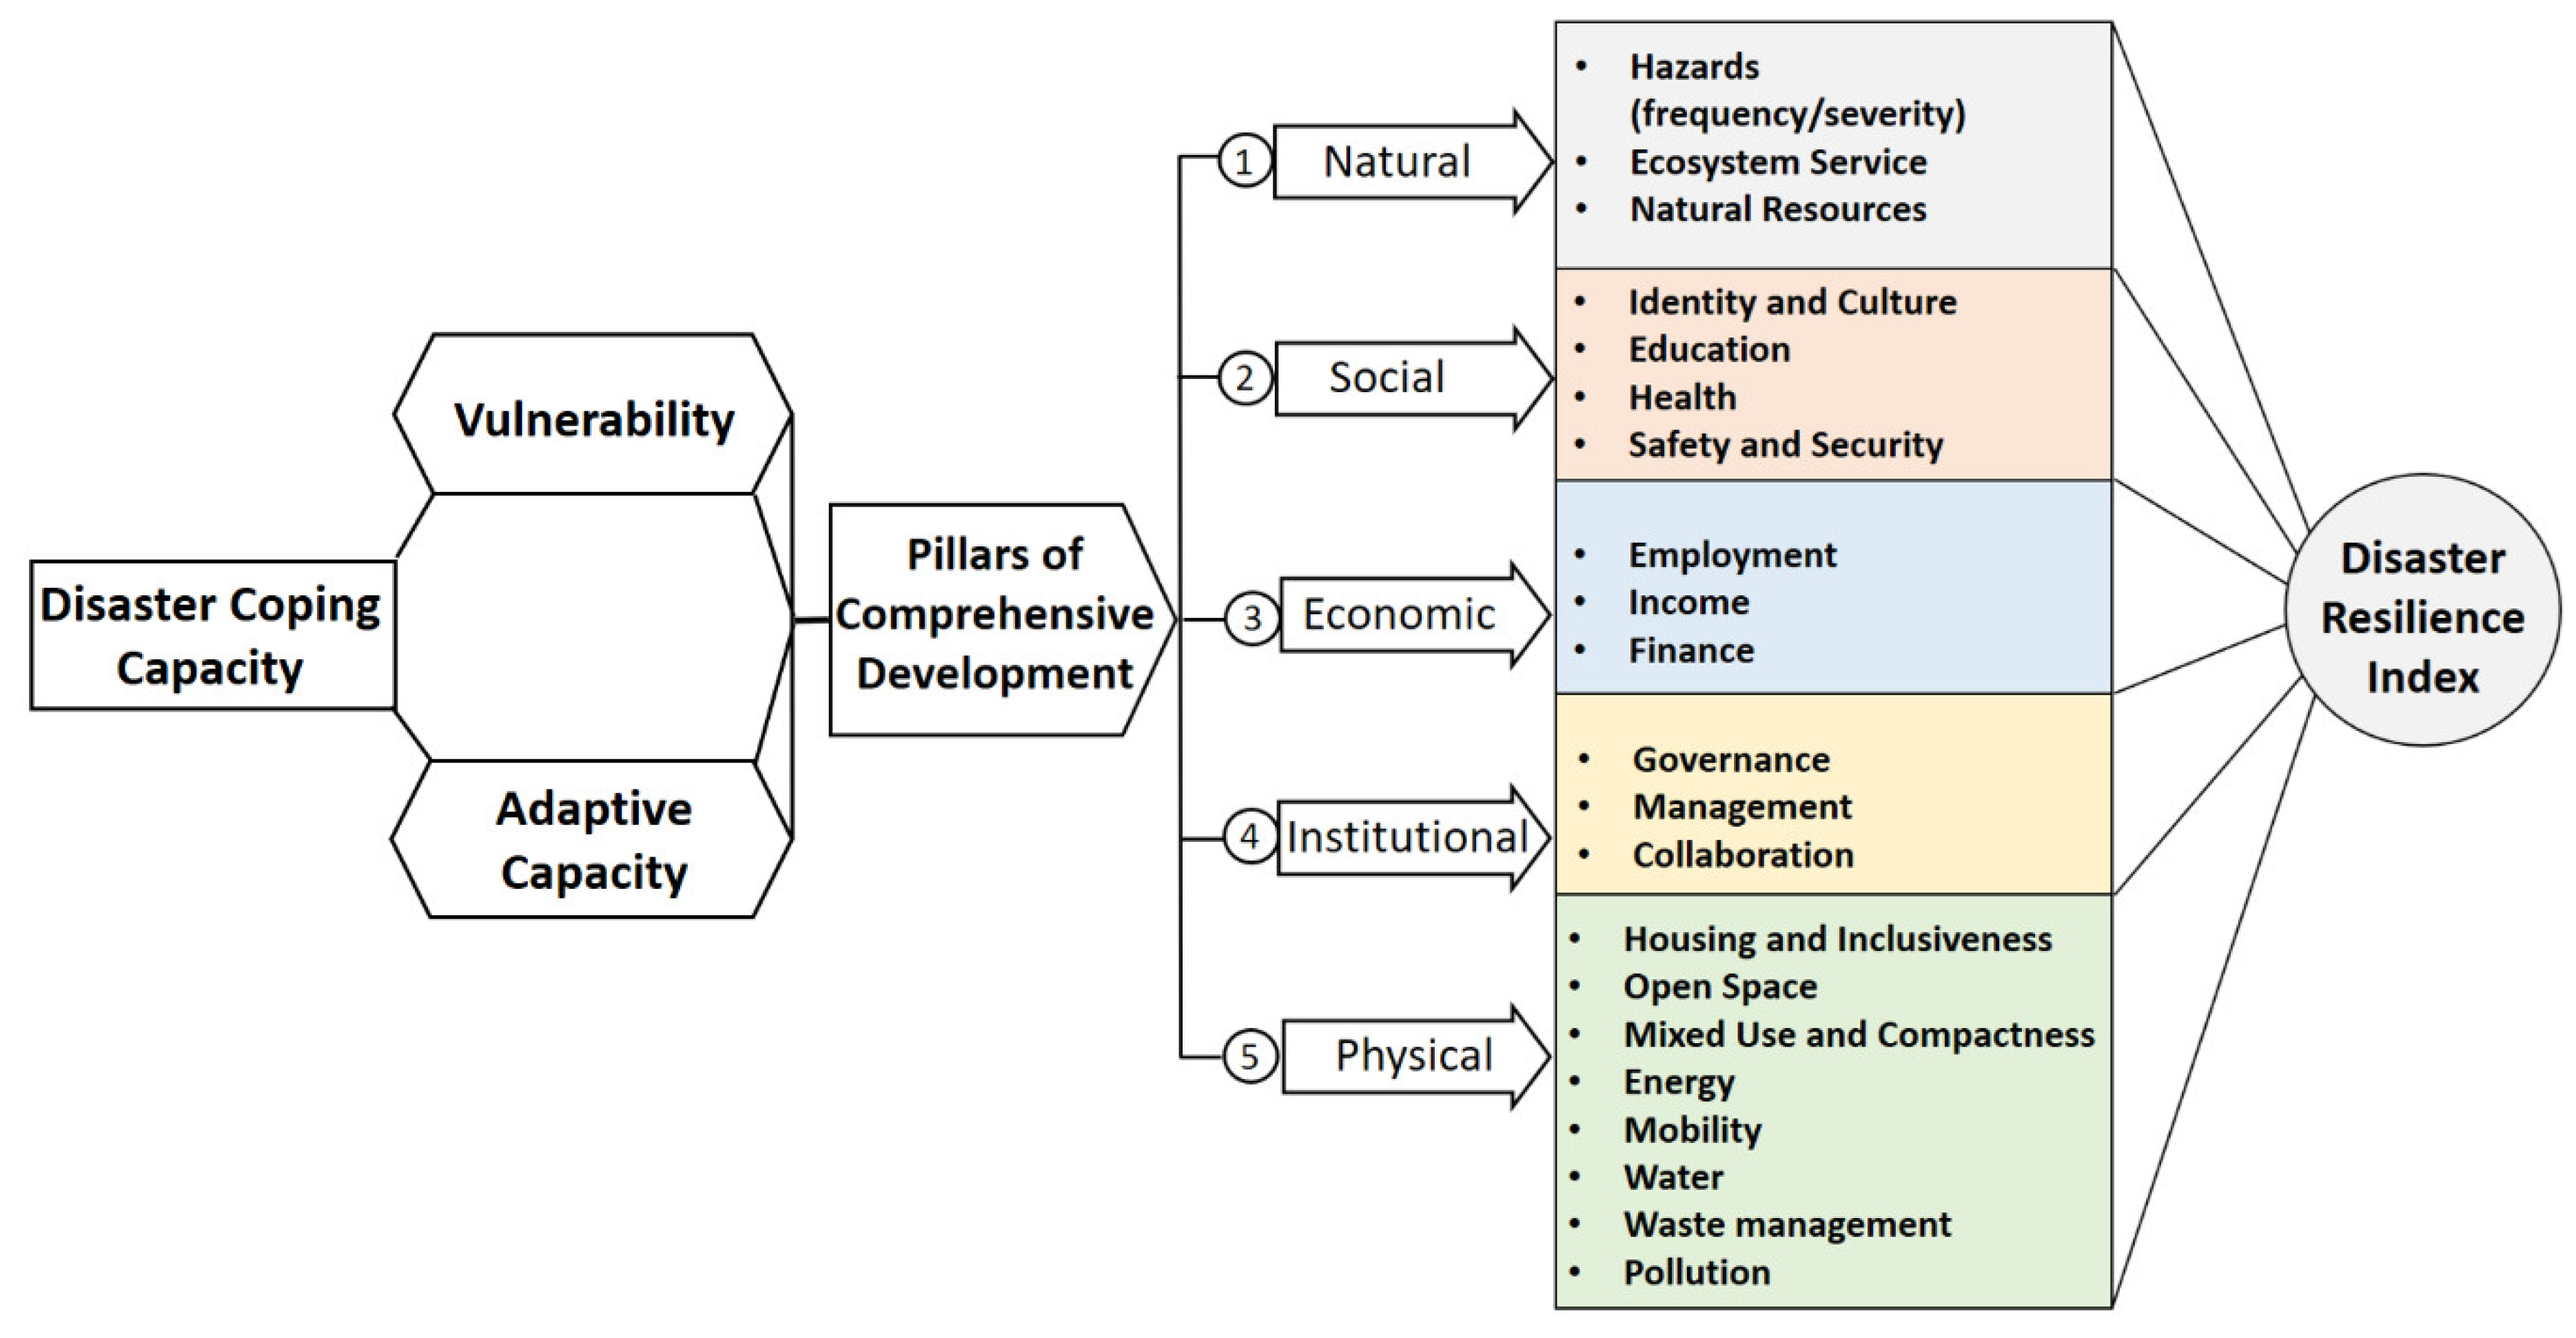
In order to quantitatively assess the city resilience, five dimensions (physical, social. economic, institutional, and natural) were identified in the CDRI, which can provide an appropriate picture of the current condition of a city. This is not only a people-centered approach but also includes institutional dynamics and interactions of the environment with climate-related disasters. Each parameter in the CDRI is evaluated based on five choices between 1 = poor and 5 = best. The respondent is then requested to provide a choice between poor and best. In addition, each variable under a specific parameter is required to be ranked or weighted on a scale of 1 = not important and 5 = very important.
The overall CDRI score of the city is the simple average of the indexes of the five dimensions that are the main pillars of urban comprehensive development (Figure 1). Using the Likert scale, the index value ranges from 1 to 5. Higher CDRI values are equivalent to higher preparedness to cope with climate change disasters.
Such an approach can explore the spatial distribution and relative importance of resilience and patterns of high/low-resilience spots to support future planning decisions and the enhancement of community resilience. The results of the assessment can be used to design a more holistic and comprehensive climate and disaster management plan [28]. Measuring resilience at the zone level also helps to take proper action at the local scales, ranging from the community to the institutional level, both reducing expenses and enhancing the efficiency of the proposed management strategies. An example of a CDRI variable set of questions is shown in Table 1.
2. Materials and Methods
2.1. Study Area
Taiwan is located at the hub of the Western Pacific typhoon track and adjoined on the west by the Taiwan Strait, on the east by the Pacific Ocean, and on the south by the Bashi Channel. Being among the highest frequency of tropical cyclones globally, Taiwan is an ideal region for analyzing the effects of climate factors and extreme events [29]. Recent studies indicated that the frequency of Western Pacific typhoons hitting Taiwan has been gradually increasing in the last 40 years [30].
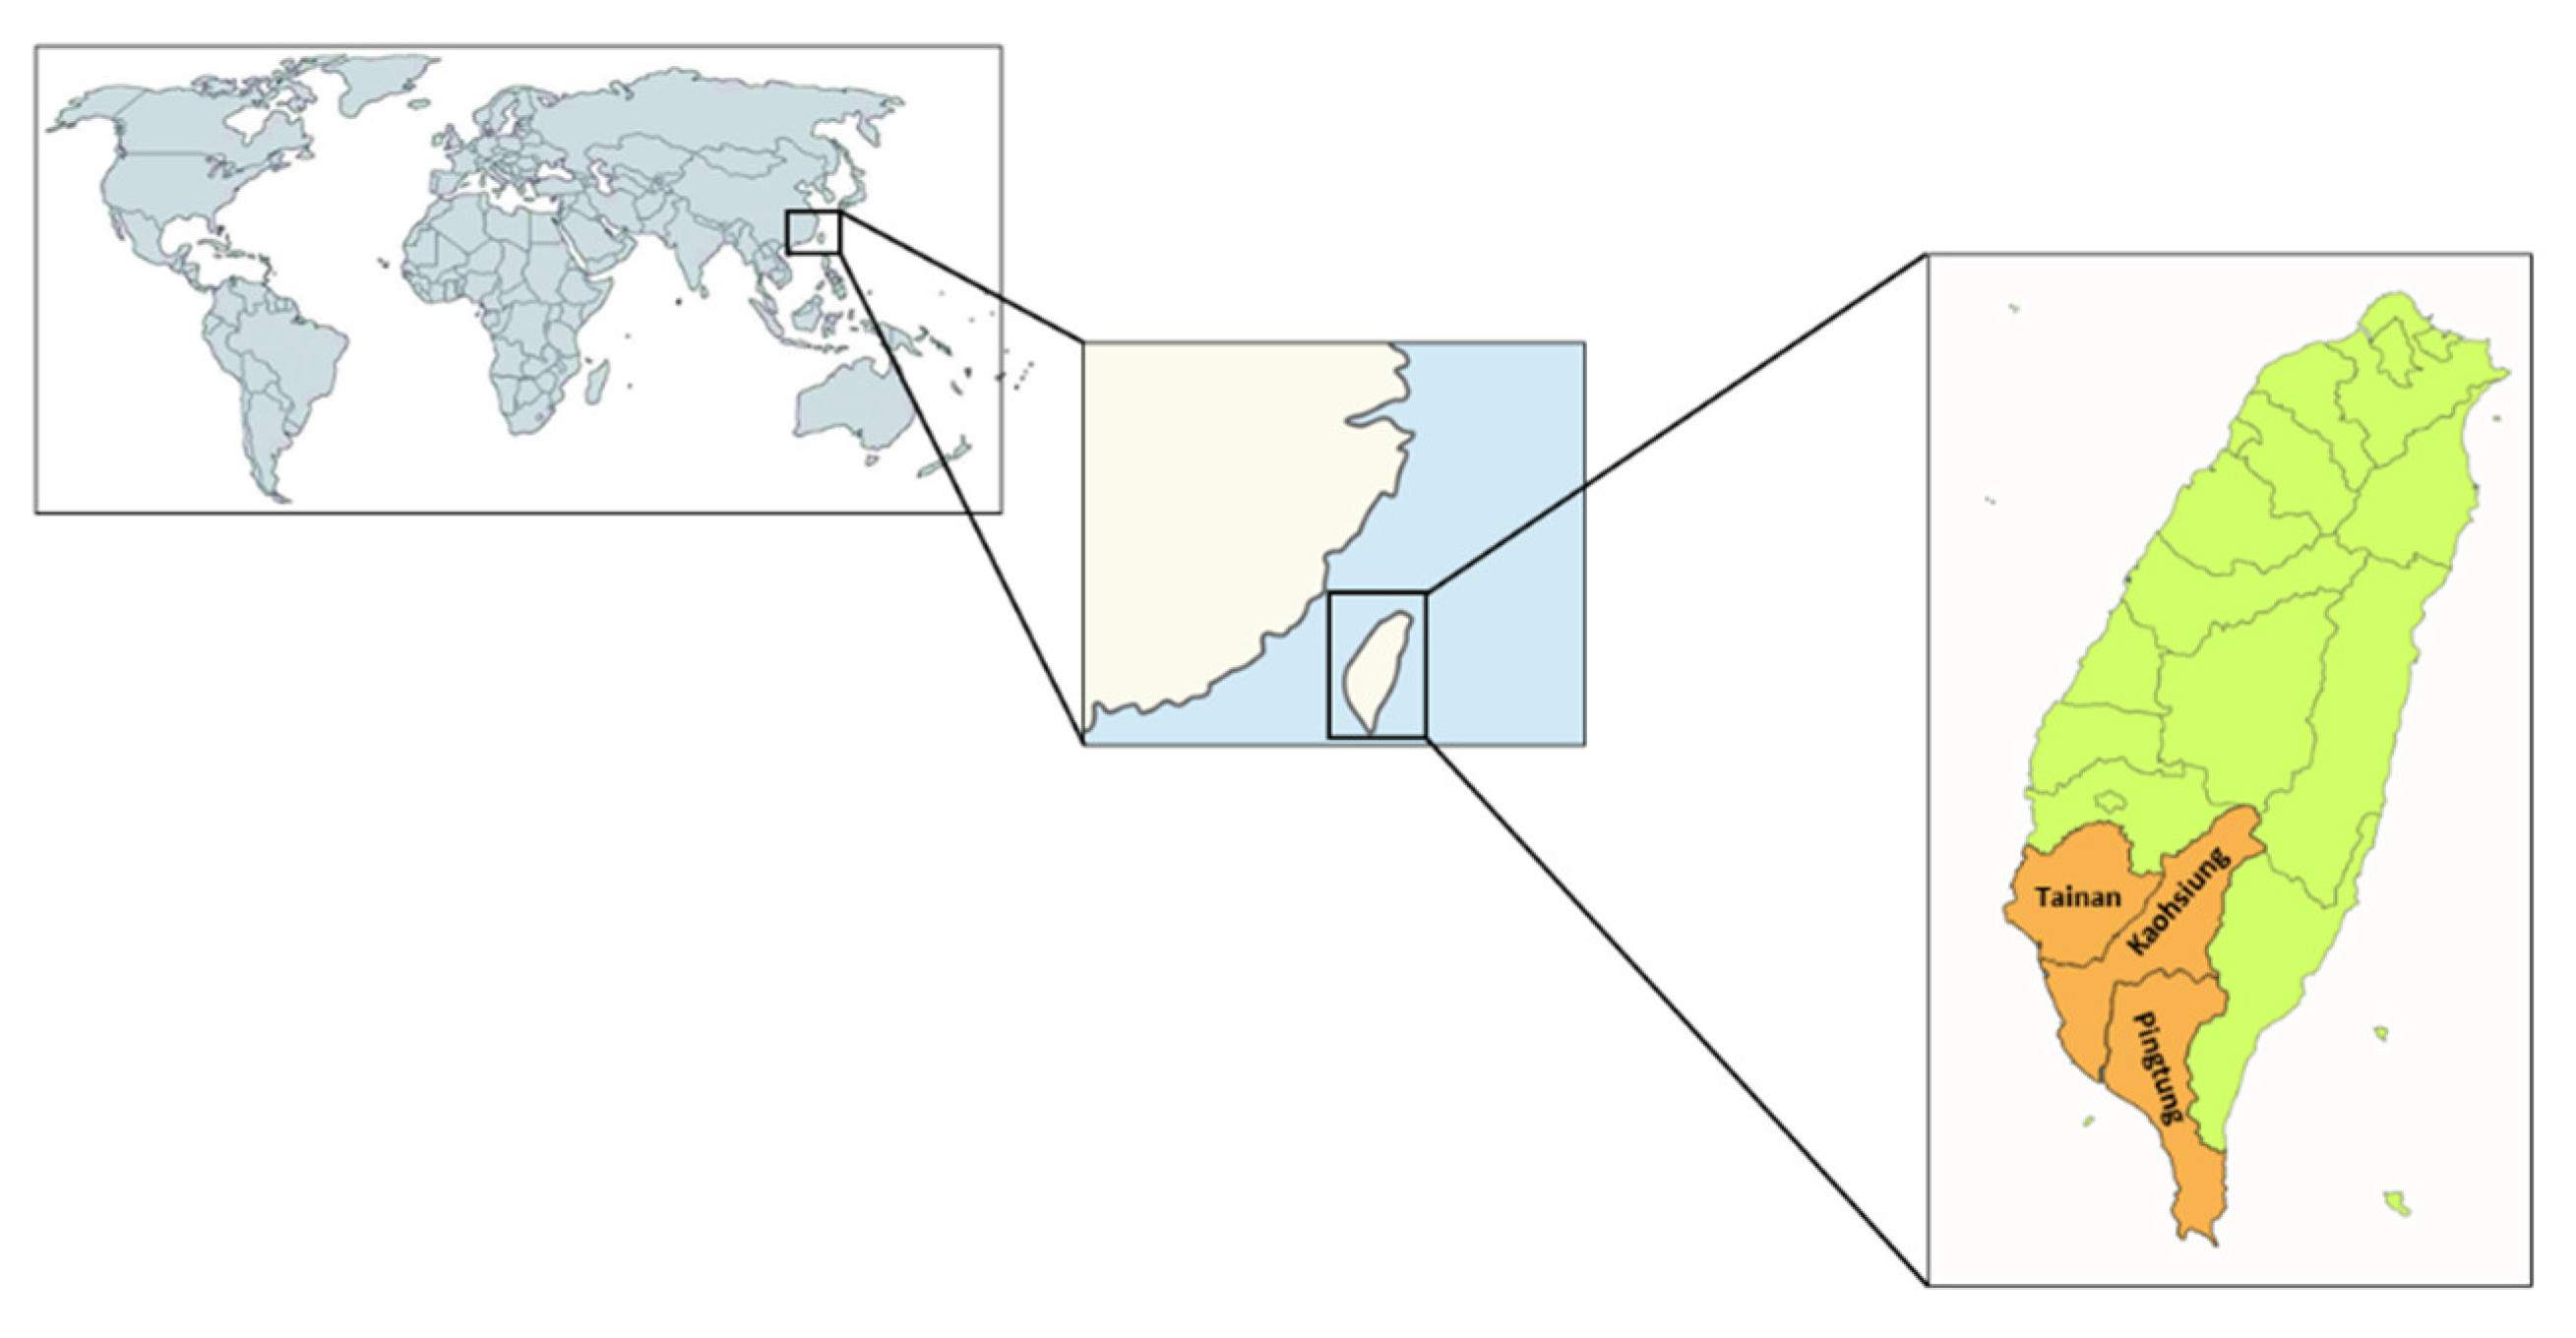
The study covered three cities in Southern Taiwan for the CDRI analysis—namely, Tainan, Kaohsiung, and Pingtung (Figure 2). The selection was based on their potential risk to climate-induced disasters, as well as their different city structures and population densities.
The southern area of Taiwan (7920 km2) has a tropical climate with an annual average temperature of about 24 °C. In the summer, when the southwestern monsoon system is active, Central and Southern Taiwan face thunderstorms, typhoons, and heavy rain, which constitute up to 80 percent of the annual precipitation, often resulting in flooding and landslides [31]. Tainan, Kaohsiung, and Pingtung in Southern Taiwan have historically experienced significant climate change effects, as the largest proportion of rainfall belongs to the South of Taiwan, where the characteristics of the rainfall result in frequent floods and droughts. Moreover, the steep topography and poor reservoir capacity make storing water in the reservoirs even more difficult [32].
2.1.1. Tainan
Tainan City is the oldest city in Southern Taiwan bordered by the Taiwan Strait. Tainan covers an area of 2191.65 km2, with a population size of 1,881,204 inhabitants and an average population density of 860 residents/km2. More than 80% of the population lives in the area located in Southwestern Tainan near the coast [33]. Having an annual average rainfall of about 1823 mm and being close to the sea, with an alluvial plain area, climate-induced disasters including sea level rise, storm waves, and typhoons are significant in the area [34].
2.1.2. Kaohsiung
Kaohsiung is located in a flat plain with a high seasonal variability of rainfall patterns with an annual average rainfall of 1884.9 mm. Kaohsiung has a population of 2,773,533 people, making it the third-largest city after New Taipei and Taichung, and a population density of 939.59 residents/km2. Kaohsiung experienced severe flooding by typhoons and extreme rainfall, in which some areas were even soaked in water for over 30 h due to their lower altitudes. Kaohsiung is also considered an important urban development district, as it is the third most populated city in Taiwan, being the focus of industrial and economic development [35].
2.1.3. Pingtung
Pingtung is located at the southernmost tip of Taiwan, with a population of 839,001 and a population density of 300 residents/km2. The Pingtung plain is one of the most important groundwater resource areas in Southwestern Taiwan. Severe deterioration in the quantity and quality of groundwater resources has been observed in this area due to the overexploitation of groundwater in the last two decades. The climate of the Pingtung region is subtropical, with average precipitation ranges from 2500 mm to 2660 mm. Owing to the favorable climate, water supply, and soils, Pingtung County is one of the most fertile agricultural regions, as well as tourist attractions, in Taiwan [36].
2.2. Climate Disaster Resilience Index (CDRI)
The CDRI was originally developed in 2009 by the Global Center for Education and Research on Human Security Engineering for Asian Megacities, Kyoto University, Japan [37]. It is a practical tool aimed at measuring the city’s level of resilience [28]. The CDRI strategy hoped to recognize different features of risk analysis, including environmental quality, urbanization, urban development and infrastructure, and poverty, while measuring them by various parameters and factors available in different dimensions [38]. It measures climate disaster resilience by considering five dimensions: physical, social, economic, institutional, and natural. Each dimension has different parameters, and each parameter has several variables as well. The existence of institutional and physical dimensions is because communities are rooted in a built environment (physical dimension) and during a disaster, the local government has a critical role to play (institutional dimension) in coping and managing the event [39]. Moreover, the physical dimension is a foundation of a well-functioning or disaster-resilient city, enhancing the capacity of communities (residents) to respond to disasters. The institutional dimension is also the local government functionality benchmark to disclose whether disaster drills are well-conducted and if a disaster management plan or an early warning system is effectively available in situ.
The social dimension indicates the social capital distribution among communities [40] and the level of disaster preparedness (availability of emergency materials and support in relief activities). This can effectively illustrate how well people are connected and how they may support each other in the case of a disaster [41]. The economic dimension not only reflects the income earning ability of people through employment but, also, their financial savings that can be used in a time of disaster. This can reveal whether a system is able to manage financial issues related to disaster risk management before and after an event.
Finally, the natural dimension indicates the fragility of urban ecosystems, recent green space depletion, availability of urban hazard maps, and efficient waste management systems during a disaster event. This is particularly important to know about the capacity of environmental properties and determine whether a potential shock can be absorbed by the city [42].
The questionnaire survey is the commonly used approach for CDRI data collection, where respondents are requested to assign significance to the variables and parameters to reflect the priority issues of the cities and the relevance of the indicators to the local situation. The CDRI of a city is the simple average of the indexes of the five dimensions. As mentioned earlier, the index values range from 1 to 5, where higher CDRI values means higher preparedness to cope with the disasters. However, these results are not absolute values but serve mainly as broad policy guidance, where the quality of the results is dependent on the quality of the input data from the survey respondents. CDRI is a planning tool, which reveals the capacity of sectors that are the least resilient or not capable of responding adequately in the event of a climate-related disaster [43].
In the current study, each dimension has five parameters, in which each parameter has five variables as well. Therefore, the CDRI method consists of 25 parameters and 125 variables to cover the most important perspectives of a city’s resilience to climate-induced disasters (Table 2). These indicators are considered the key elements of urban management services and are expected to construct or enhance the resilience and capacity of an urban system. Using the CDRI approach, the strengths and weaknesses of the cities and their administrative units in each of the five dimensions will be highlighted. Then, policy points and recommendations are suggested to provide an information platform and capacity building for the city officials. While the outputs from the CDRI approach are useful for city governments, they also provide valuable knowledge and information to other stakeholders with a similar target of the enhancement of community resilience.
2.3. Data Collection
A questionnaire survey was the prime means of data collection in this study distributed to key informants of the respective authorities and scholars involved in the planning and development of cities and disaster risk management. Addressing all parameters and variables of the CDRI dimensions, a data template was designed for data collection from each urban community (in each city). The CDRI’s 125 variables (five dimensions × five parameters × five variables) were used to develop a survey questionnaire to assess the resilience of different parts of the study areas (5 × 5 × 5 matrix). To facilitate questionnaire completion, a pre-prepared explanation of the purpose and context of the questionnaire were provided to help convince respondents to participate in the survey, as well as to help avoid misunderstandings and increase the accuracy of the results. Informed consent was also obtained from all participants included in the study. The data collected from the questionnaire surveys were computed using Microsoft Excel and SPSS (version 16.0, SPSS Inc., Chicago, IL, USA) software. Respondents were required to respond to the parameters based on the five-point Likert scale, where 1 referred to the lowest score/value and 5 indicated the highest score/value. In other words, each parameter was evaluated using five choices, between 1 = poor and 5 = best, as x1, x2, …, x5. A further analysis was then performed to understand the resilience of each dimension and parameter and identify the strength and weakness of each administrative zone, as well as the interconnections. Secondary data were also collected to supplement the collected data, where the questionnaires were incomplete. Data on some variables, especially related to the physical and natural aspects, were also collected from secondary sources such as semi-structured interviews, focus group discussions, direct observation, reports of the population census, governmental annual reports, and official authority websites. The 5-point rating scale was also applied to these data to determine the status of a variable in a particular area. Data collected through the questionnaire survey and secondary sources were then used to compute the CDRI of the city and its various zones.
To better describe the concept of the CDRI, a weighting approach was applied. The Aggregate Weighted Mean Index (AWMI) (for each dimension) was then calculated using the Weighted Mean Index (WMI) method. Initially, a rating scale was constructed, and weight was assigned subjectively based on how the city officials perceived the vulnerability of each parameter through a comparison approach, which means each variable under a specific parameter was required to be ranked or weighted. To achieve this, respondents were requested to assign weights to the variables and parameters ranked from less important (1) to high importance (5) through a weighting approach (w1, w2, …, w5) in order to reflect the priorities in the studied zone and the relevance of the indicators to the local situation. The calculated value of the AWMI of one dimension is the CDRI of that dimension.
The final score of each parameter was then formulated accordingly, followed by a standardized and harmonized approach to calculate the ultimate CDRI scores:
where represents variable, and is the assigned weight.
Overall, the CDRI values were obtained after averaging each of the five dimensions’ resilience values [4].
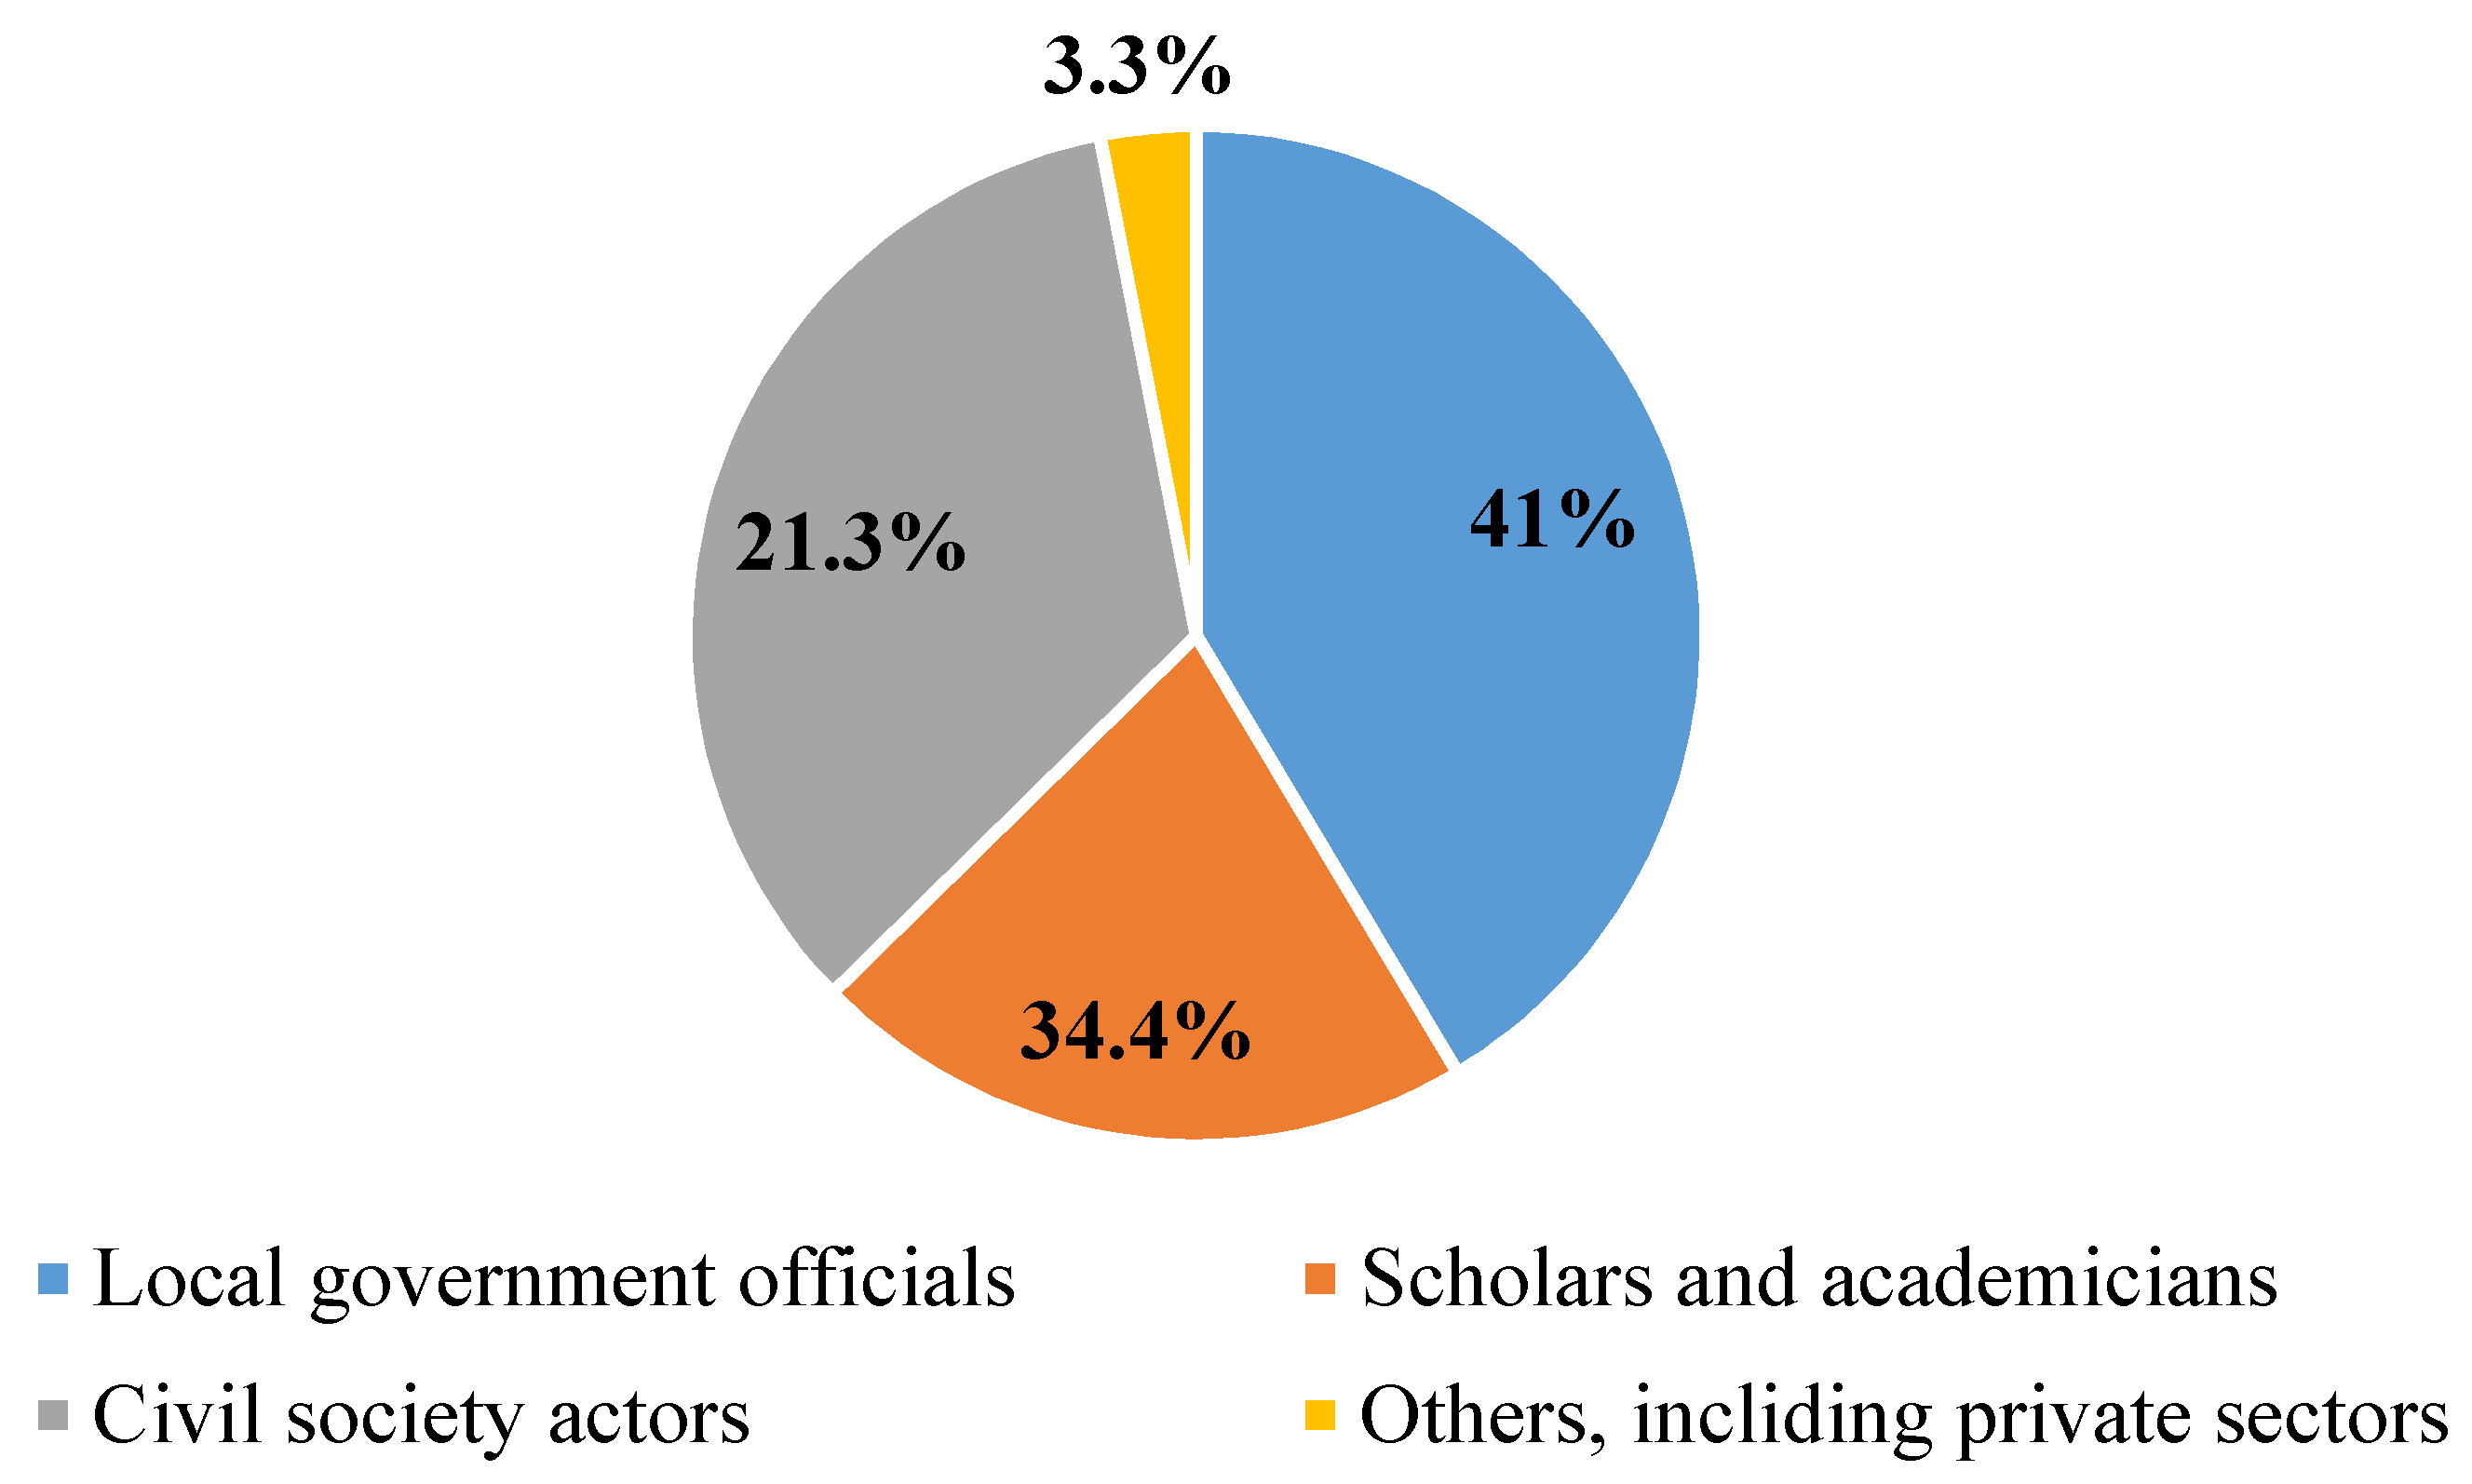
The study was conducted in Southern Taiwan cities, which were divided into different zones based on the administrative authorities. The CDRI questionnaire was mainly answered by the local government officials, civil society actors, scholars, and academicians that were involved in disaster management activities in their respective districts. A total number of 183 questionnaire survey responses was received from different stakeholders and city officials. Figure 3 depicts the diverse backgrounds of all respondents to the survey, in which 41% of respondents consisted of 75 individuals who were local government officials, 34.4% of respondents consisted of 63 individuals who were scholars and academicians working in relevant departments, 21.3% (39 individuals) were considered civil society actors, and the other groups, including the private sector, counted for 3.3%. In general, the sample collection methodology consists of having relevant departments within a local government or university campuses to provide the answers. To obtain evidence-based information, the respondents had three days to fill out the CDRI survey. Depending on the zone, the relevant information was given by single authorities or focused groups of attributed authorities. For each individual city, resilience information is presented as the overall resilience (combination of all five dimensions) and separate physical, social, economic, institutional, and natural resilience.
3. Results
3.1. Overall Estimation of Climate Disaster Resilience
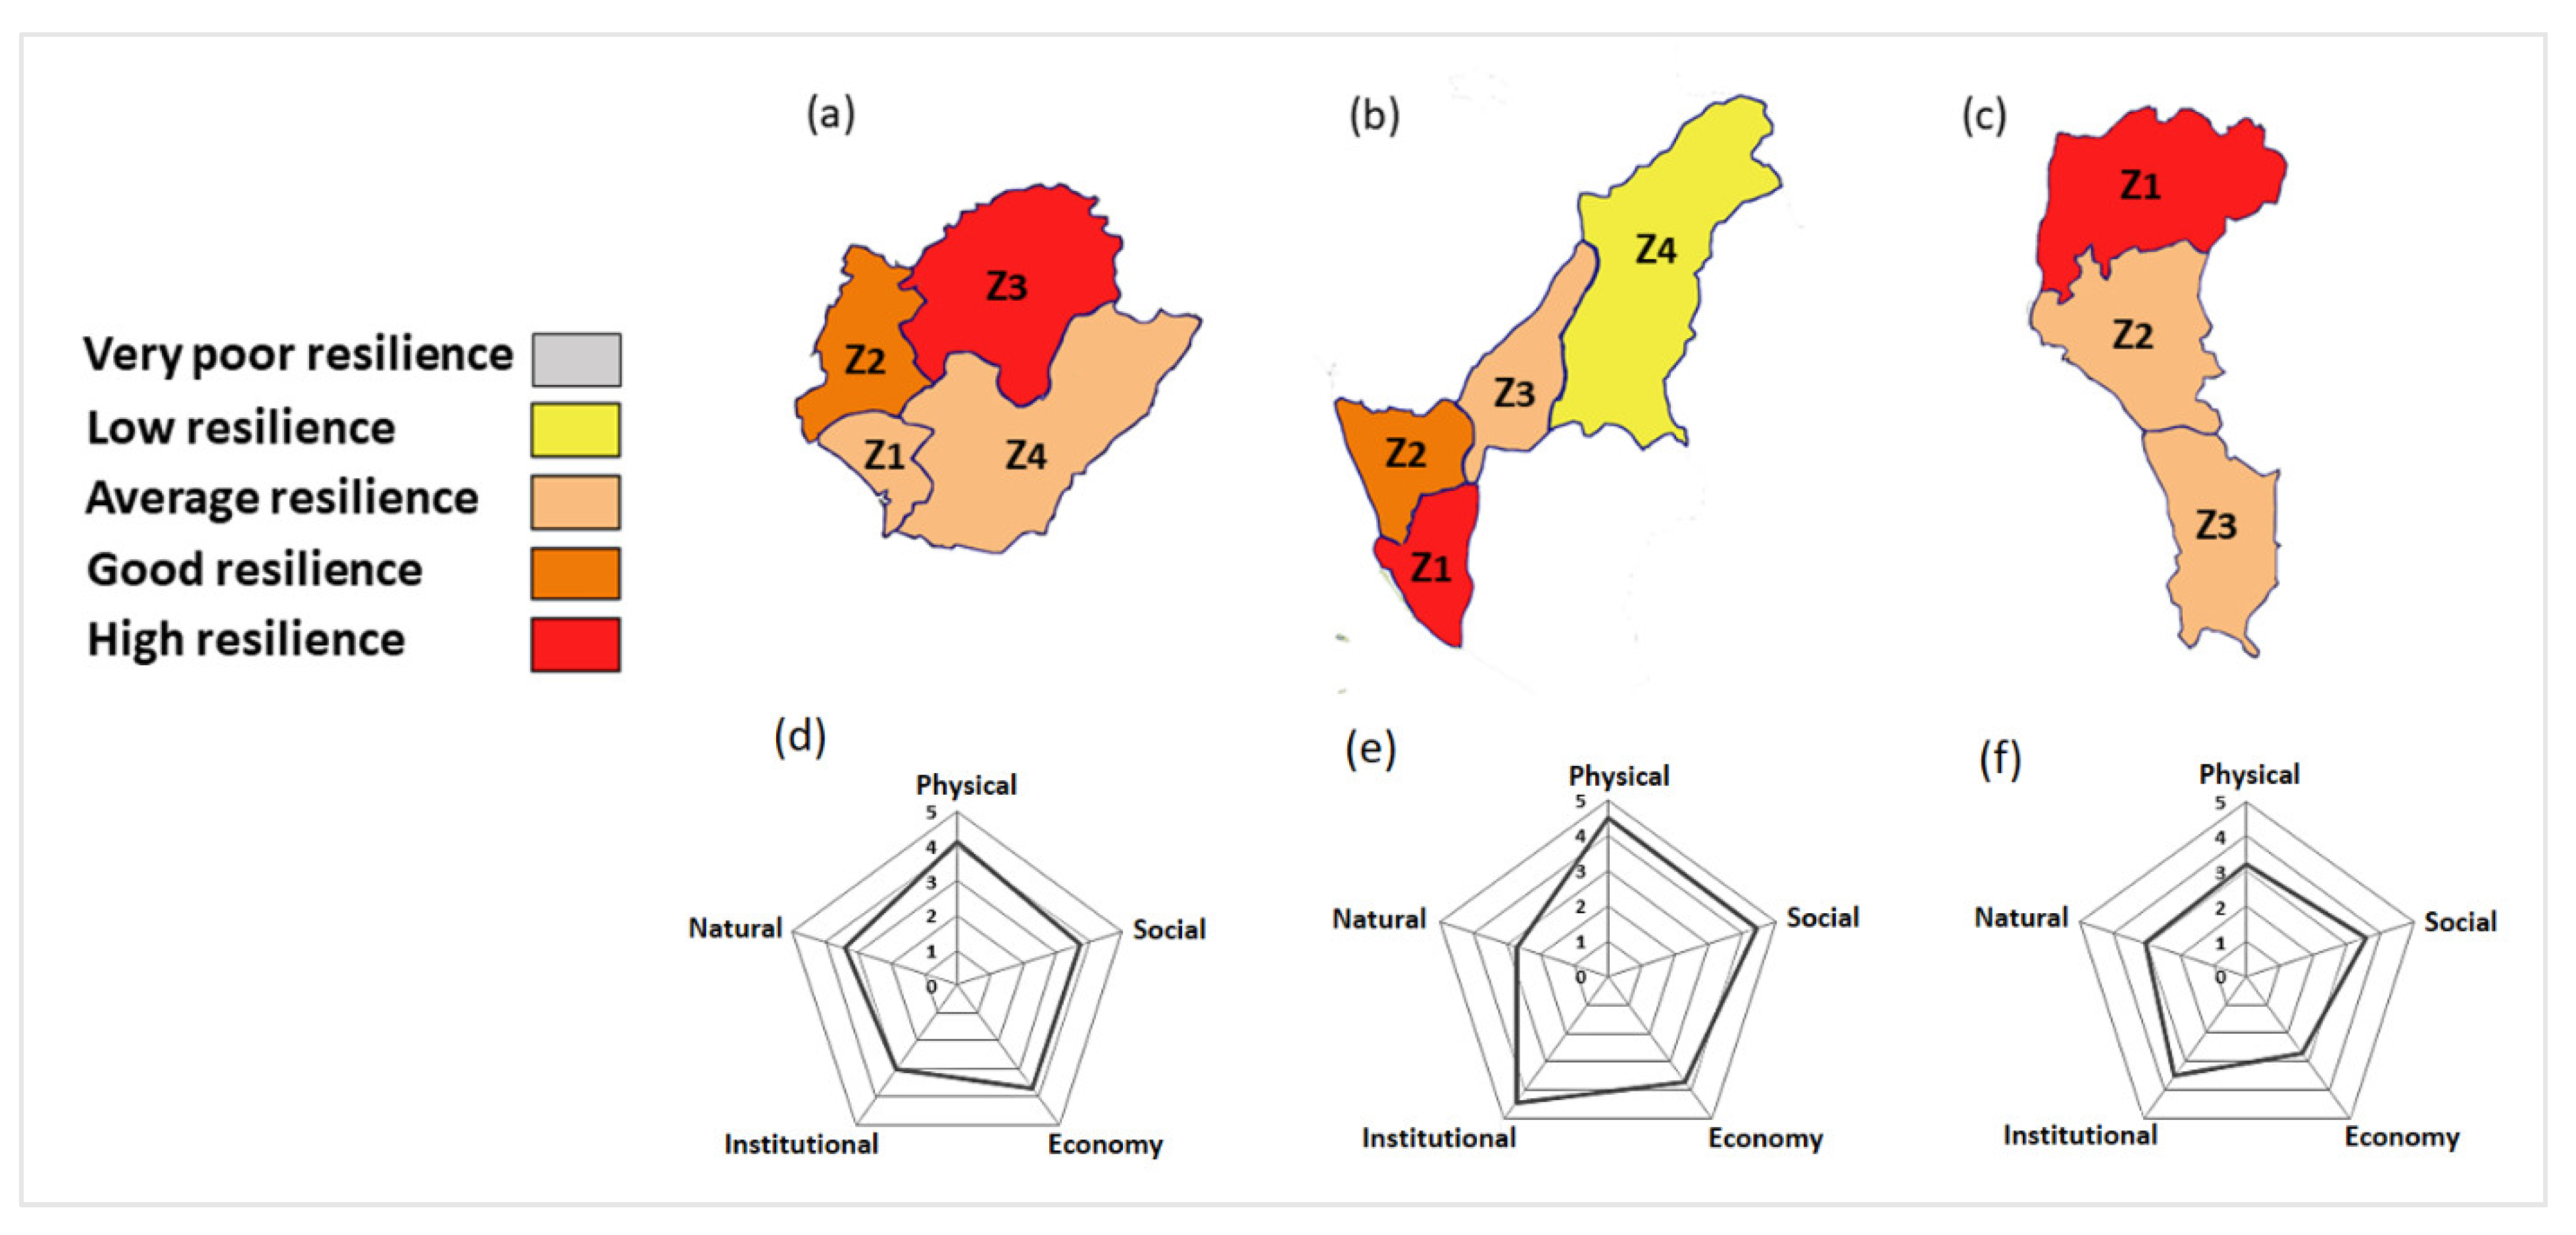
Generally, the three case study cities showed a similar score on the overall CDRI but different scores for the dimensions, from 2.68 for the economy component (Pingtung) to 4.49 for the physical component (Kaohsiung), accordingly (Figure 4.).
Kaohsiung had the highest overall CDRI score, and the average CDRI score for each other city was estimated as 3.57, 3.95, and 3.20 for Tainan, Kaohsiung, and Pingtung, respectively. An analysis and comparison of the different dimensions showed that the CDRI results demonstrated more variations in the institutional, physical, and economic categories, unlike the natural and social dimensions.
3.2. Zone Level Assessment of Climate Disaster Resilience
The CDRI scores of each zone of the different cities are also presented in Figure 4. The zone-based CDRI score is the average score that the zone received in each of the physical, social, economic, institutional, and natural dimensions.
The average zone-based CDRI scores of all three cities ranged from 2.04 to 4.14. Herein, scores of 1–1.5 illustrated very poor resilience, 1.6–2 low resilience, 2.1–3 average resilience, 3.1–4 good resilience, and 4.1–5 high resilience. Regarding the overall CDRI analysis among the three cities, the five zones showed good-to-high levels of resilience to climate-induced disasters.
3.3. Climate Disaster Resilience in Different Dimensions
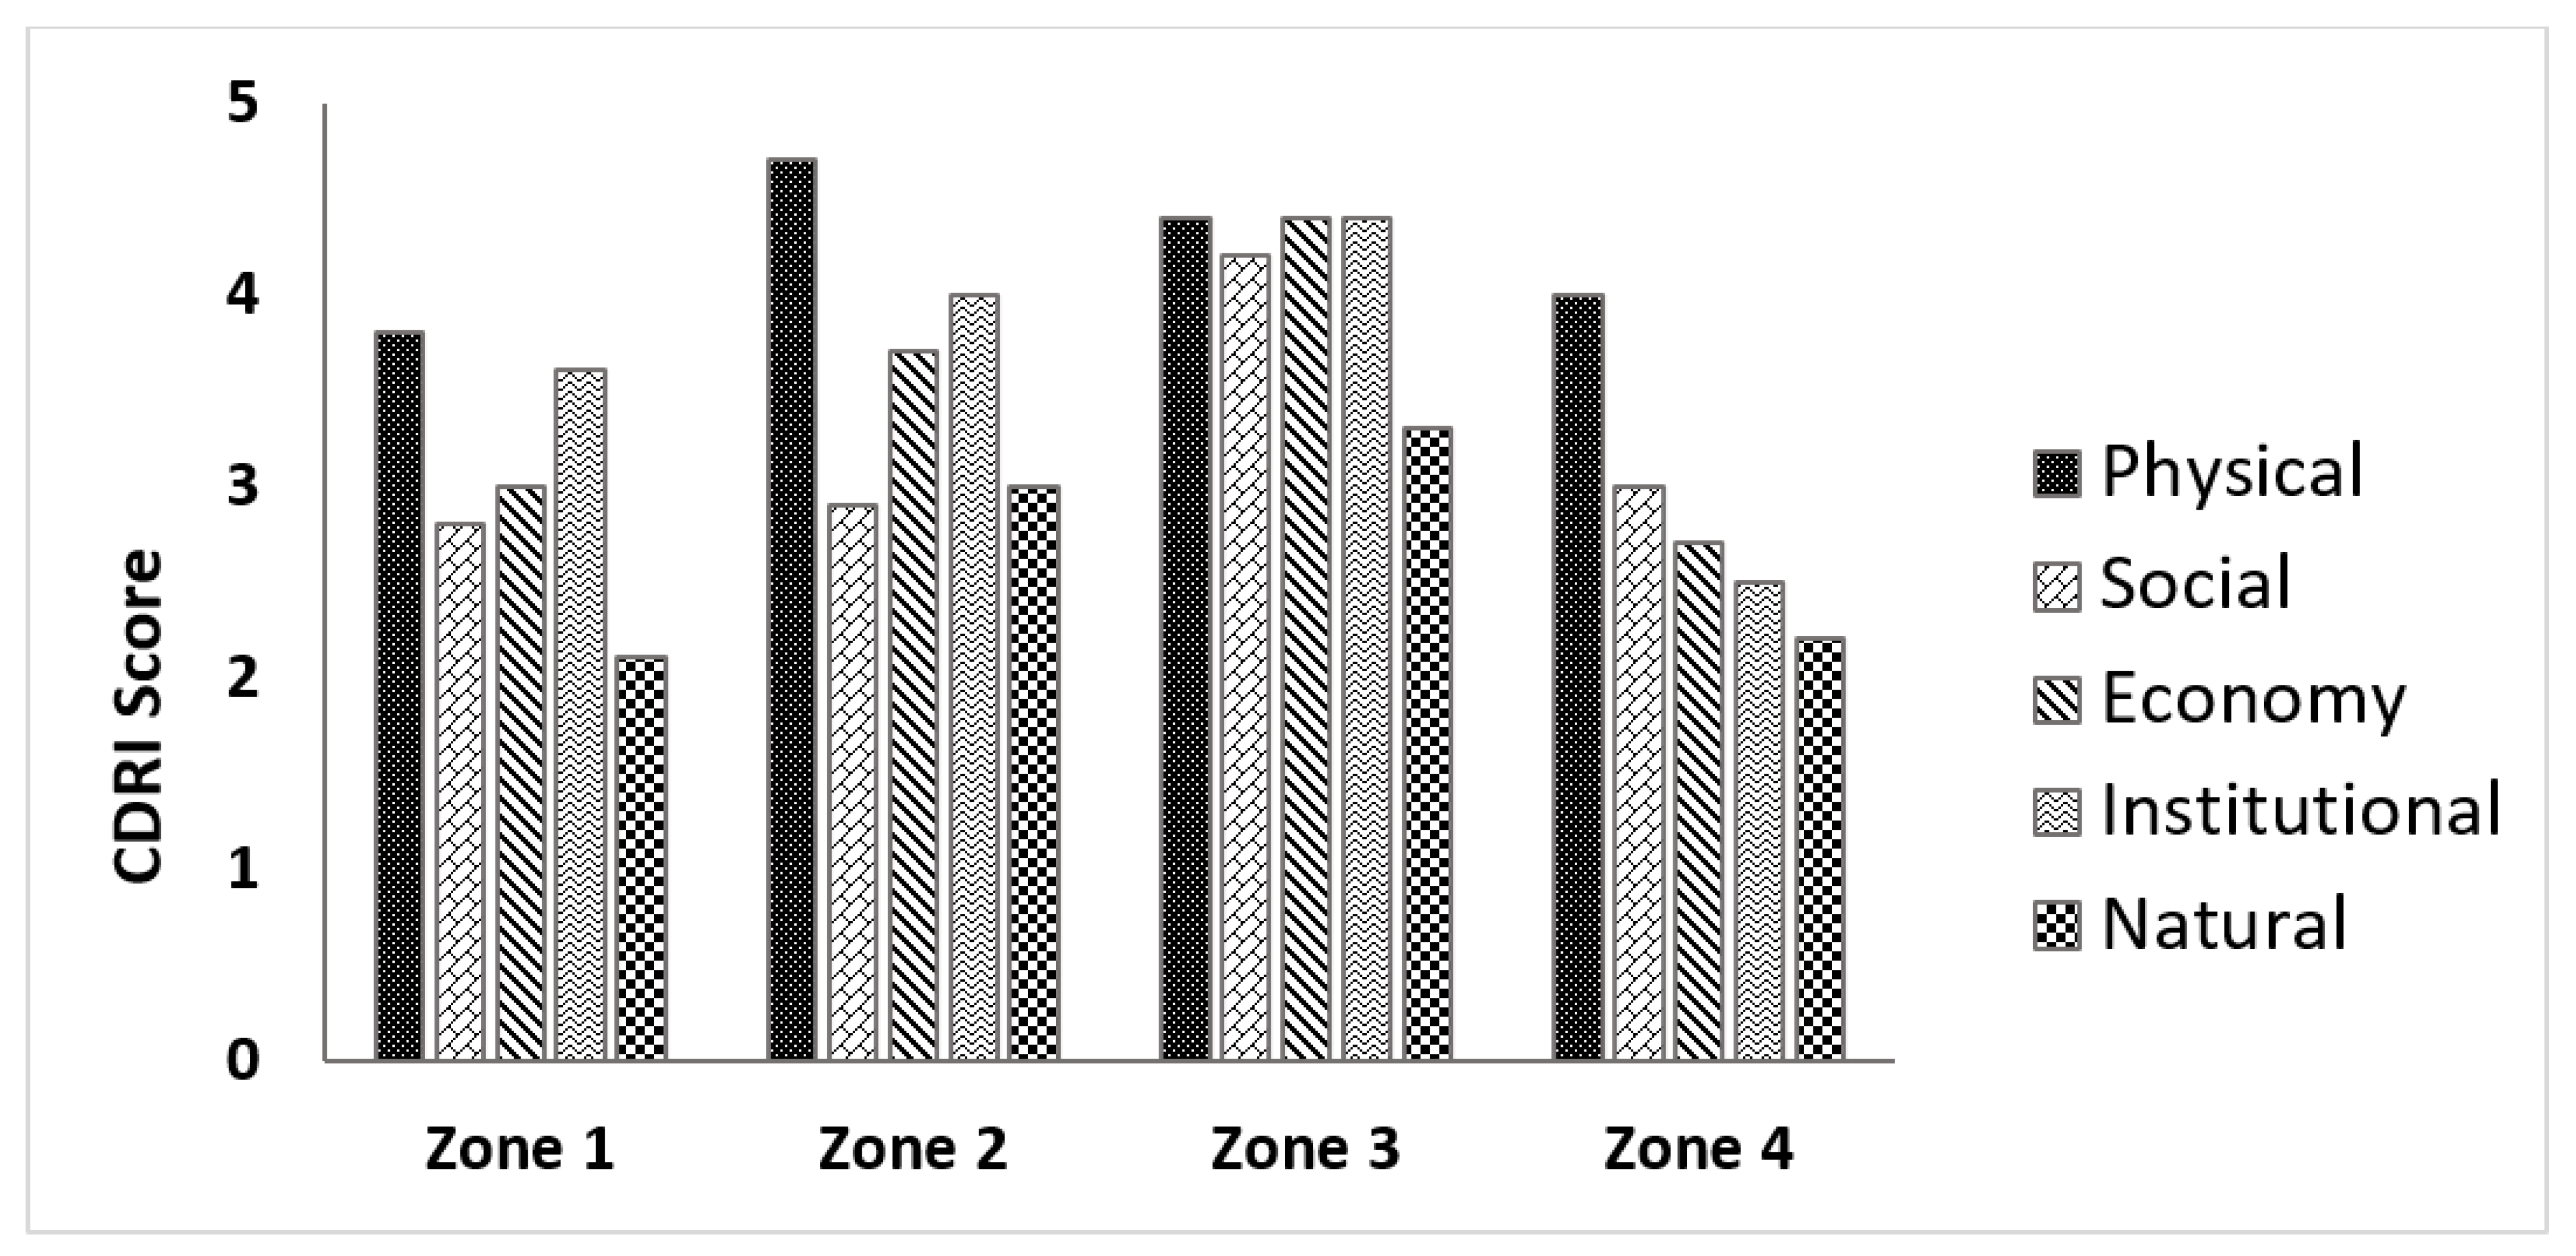
An analysis of the CDRI scores using different dimensions revealed that all zones and cities have higher physical resilience, while they are less resilient in the natural dimension (Figure 5, Figure 6 and Figure 7). Tainan City works almost effectively in terms of accessibility and availability belonging to the physical component, but the city is prone to both extremes—floods, as well as sea level rise and severe typhoons. The quality of the city’s ecosystem (biodiversity, soil, air, and water qualities) is reduced. Moreover, large areas (western zones) of Tainan City are highly susceptible to climate-related hazards. Besides, the old infrastructure of some districts challenges the resilience of the economy and institutional dimensions, making it difficult to fulfill demand in the case of disasters (Figure 5).
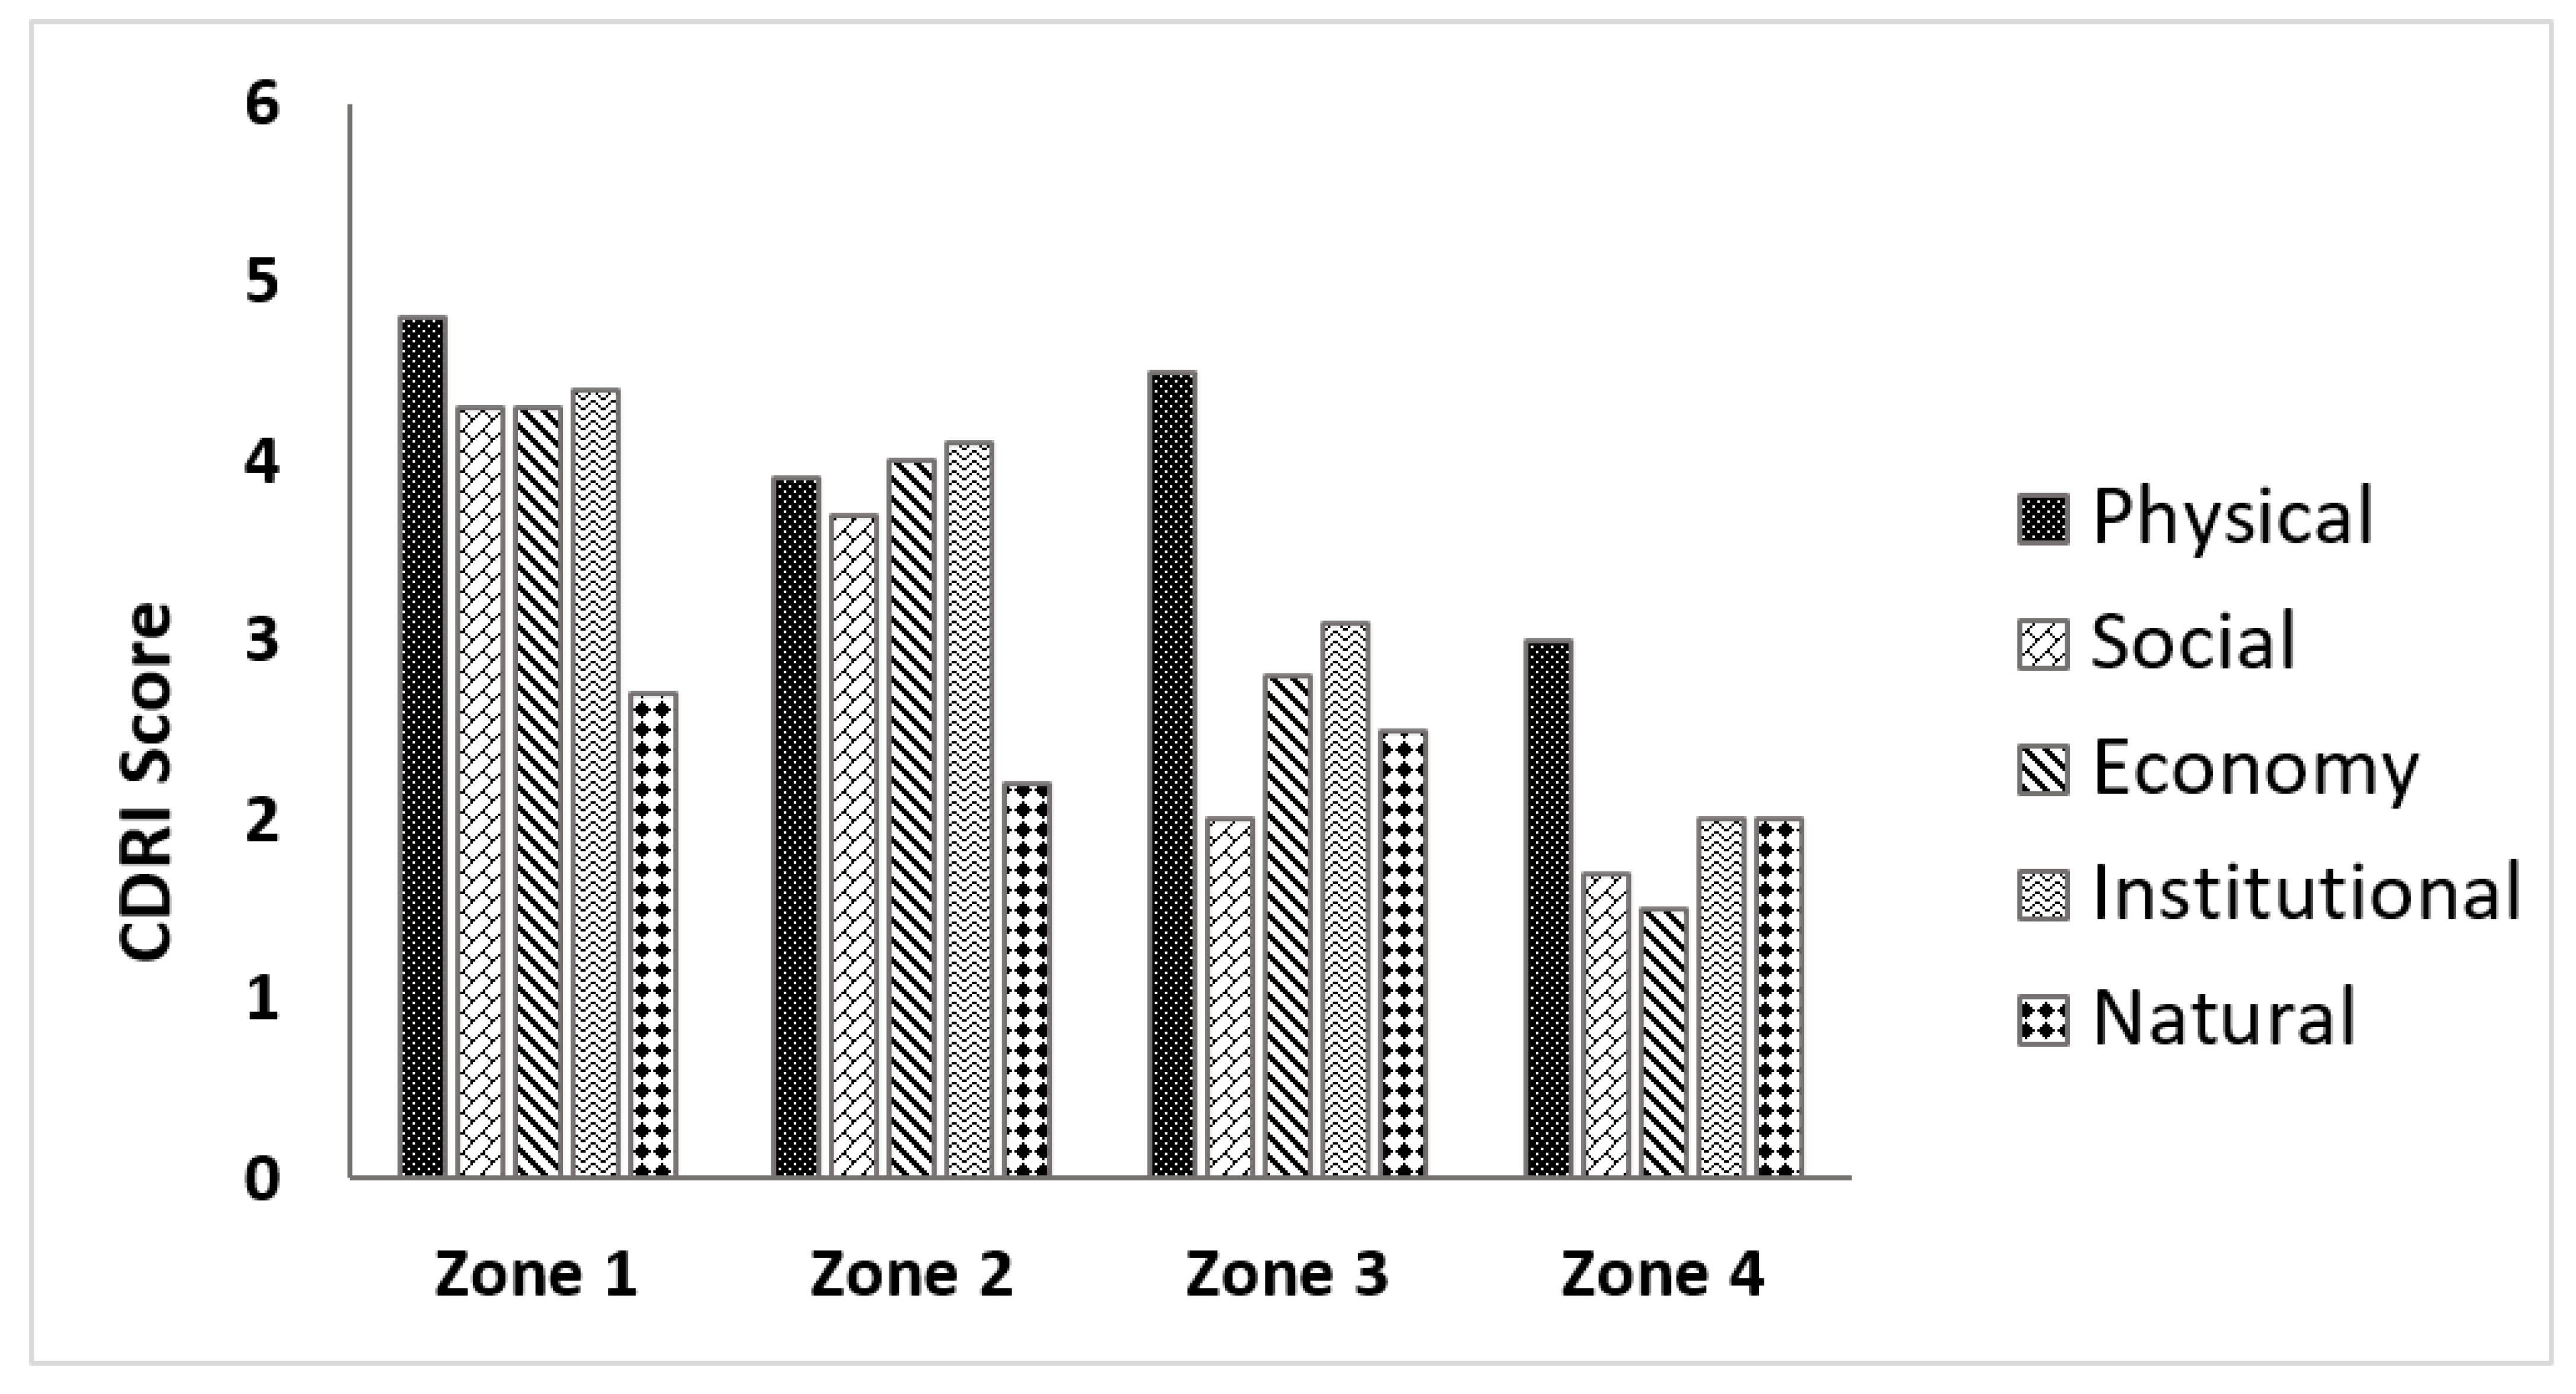
Kaohsiung City suffers from several hazards like floods and extreme weather events (Figure 6). It has one of the lowest ecosystem quality and land use scores, probably due to heavy industrial cluster and air pollution. Although environmental preservation policies exist—for example, a mitigation policy for air and groundwater pollution, which makes the city satisfactory resilient in the institutional dimension—the compliance of residents and authorities to such policies is limited.
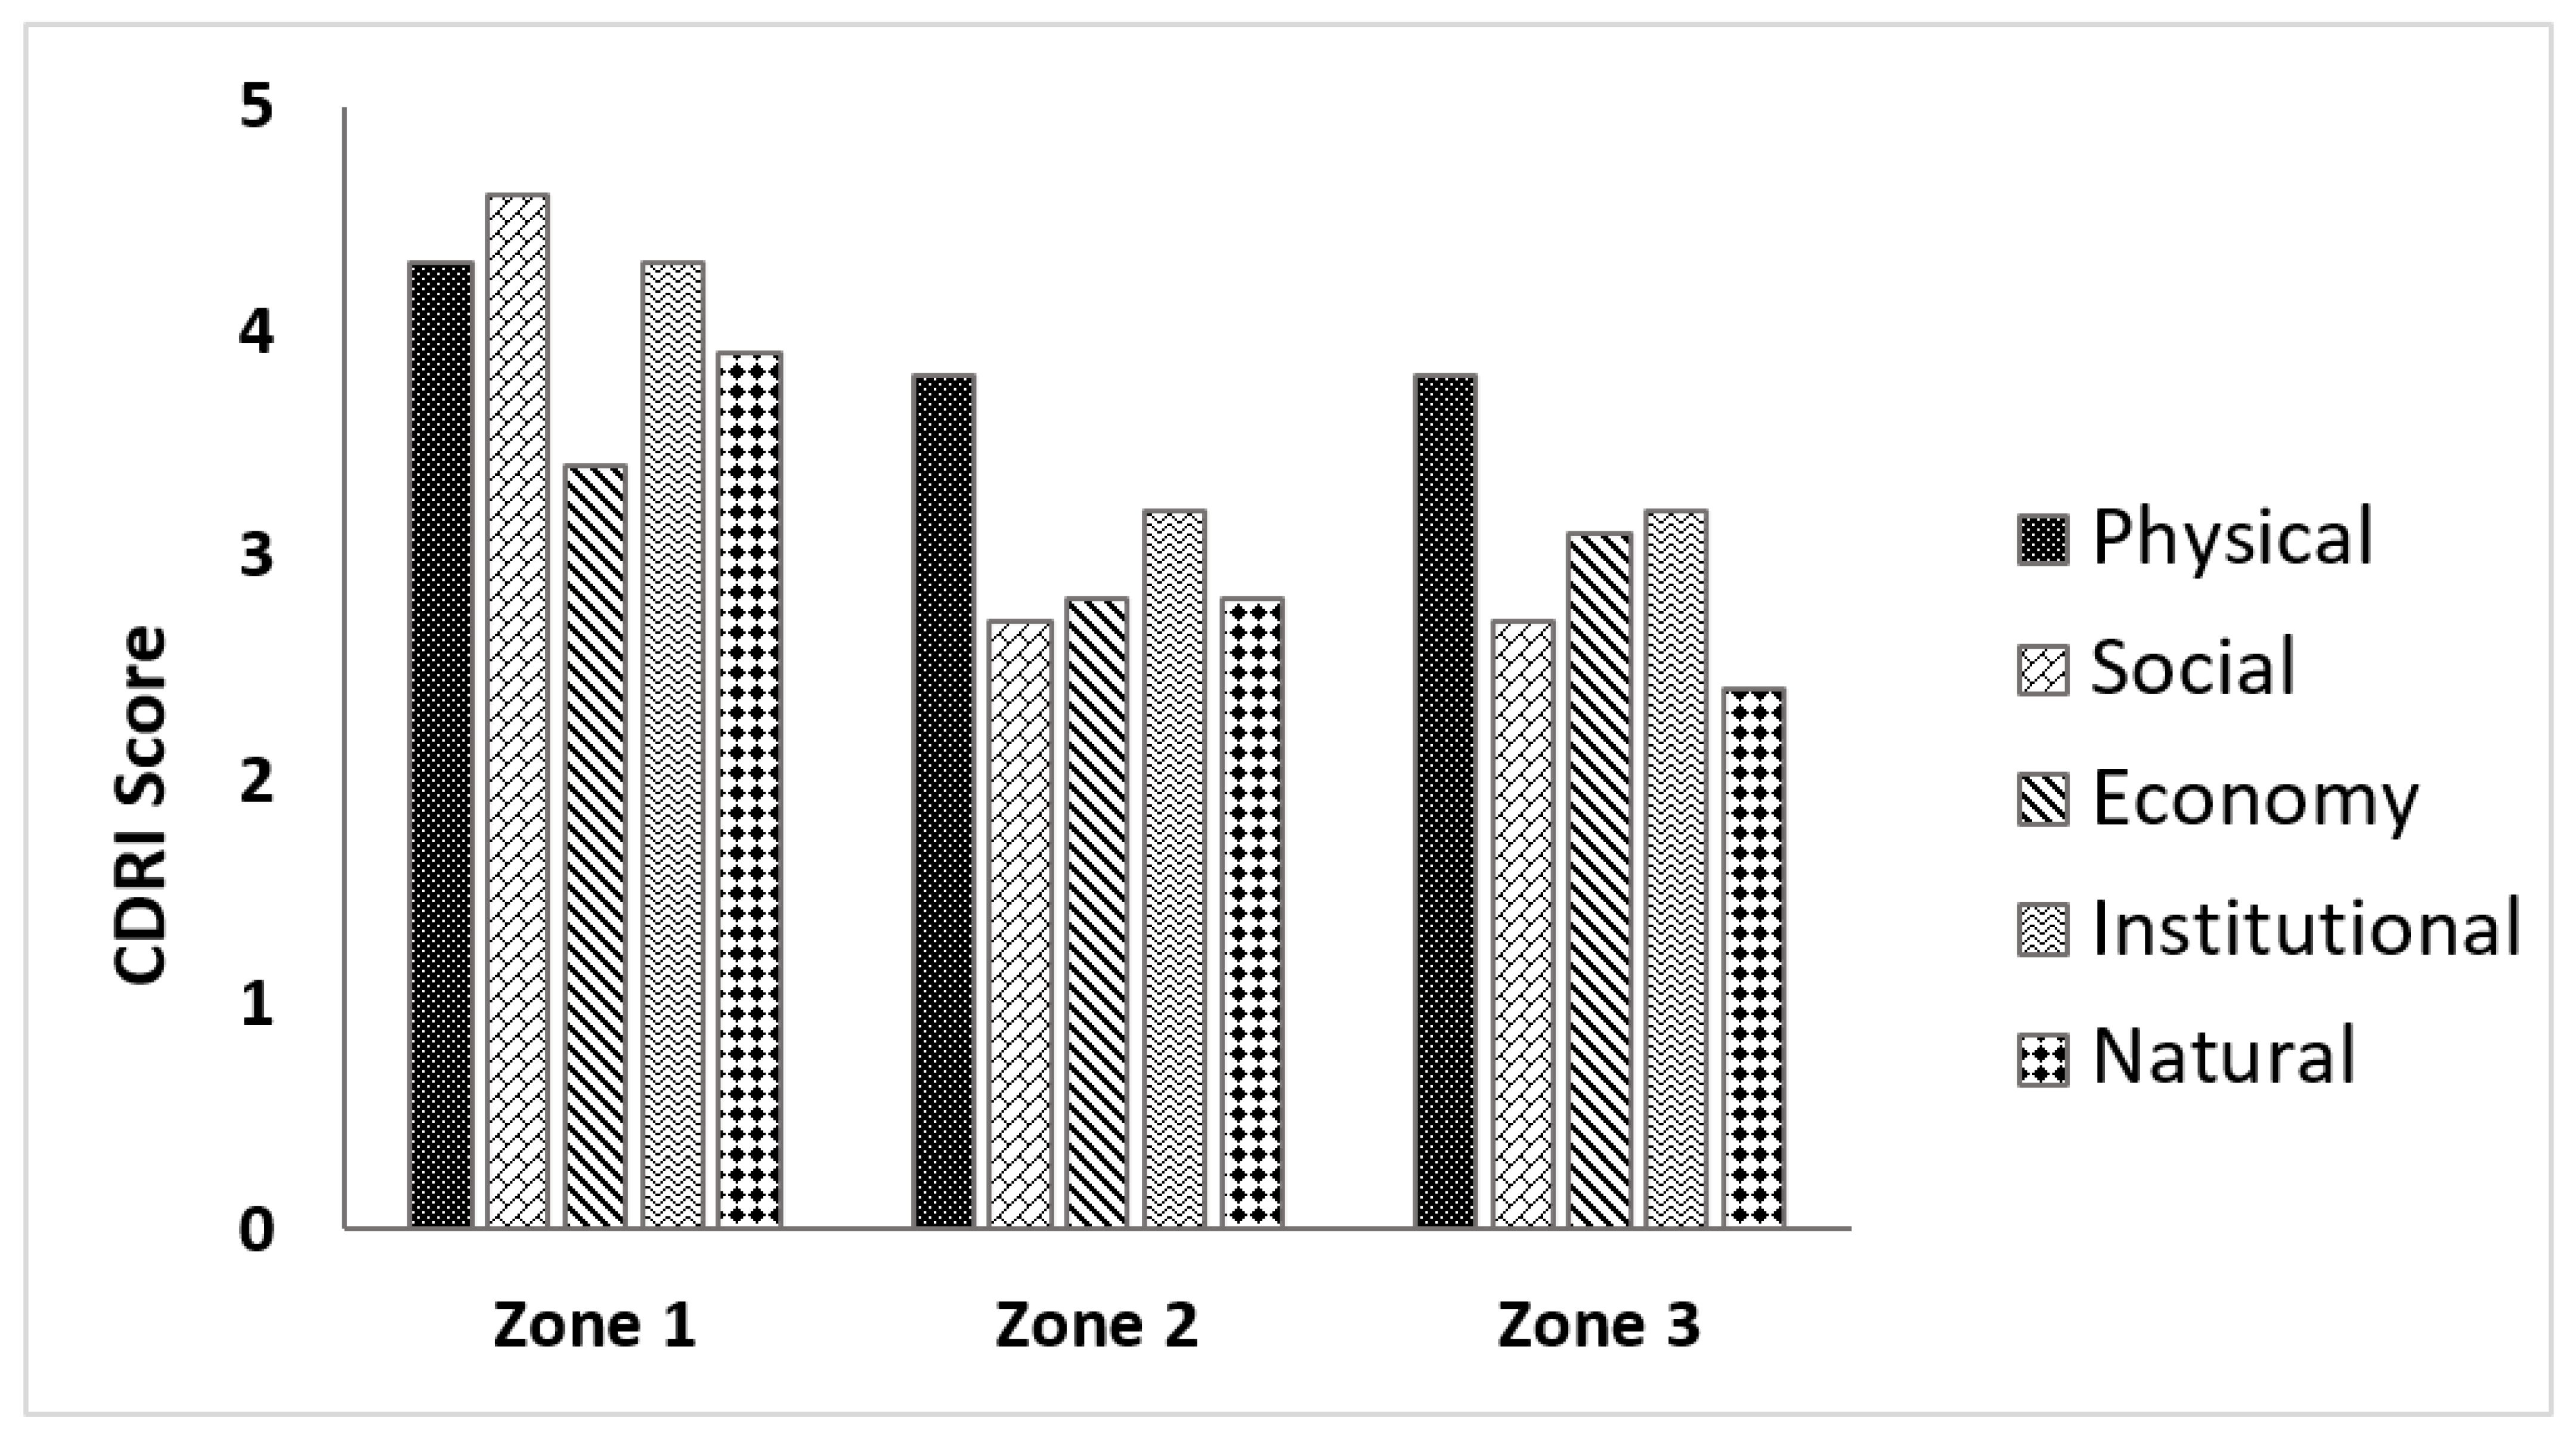
Compared with the other two case study cities, the economy is the most fragile and least-resilient dimension in Pingtung (Figure 7). Pingtung is facing the challenge of an ageing society in Taiwan, with a shrinking population even during the time when Taiwan’s population grew. While the average number of employed persons per household in the county matches the national average, the overall household incomes are lower, which makes the overall resilient scores drop down into the lower capacity levels.
In different dimensions of each city, all zones represent a CDRI score above 2.1, except zone 4 of Kaohsiung, which scored less than 2 in the social and economy dimensions. Furthermore, nearly none of the zones showed the same resilience scores in each dimension within the attributed city.
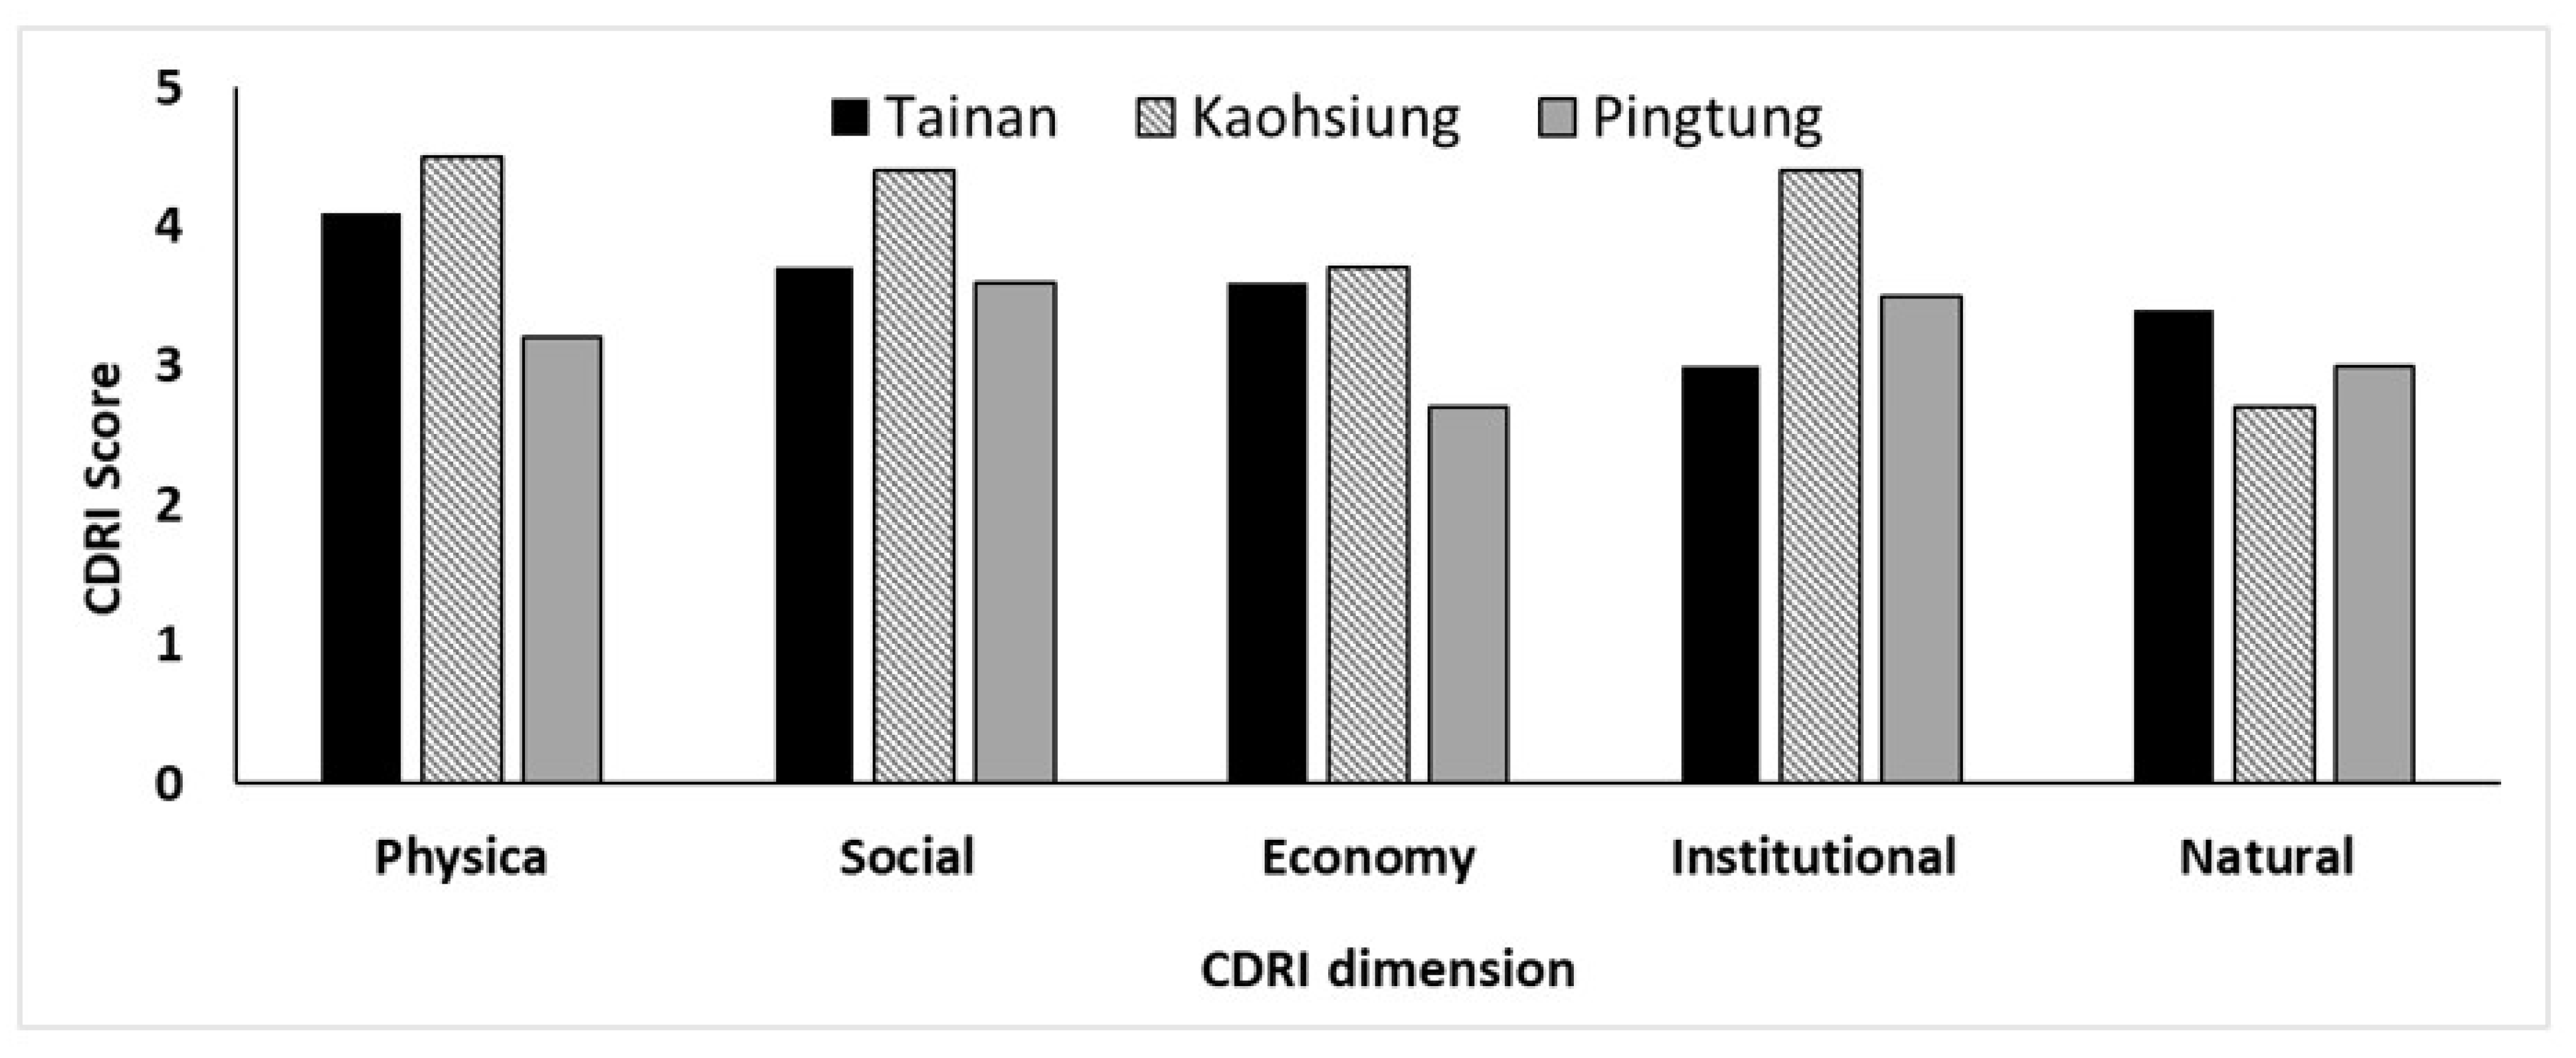
Natural dimension tends to have the lowest overall scores in all three cities, while the physical and social were the highest resilient dimensions (Figure 8). Among three of the case studies, Kaohsiung showed the most institutional resilience, which was also obviously linked to the overall high social and physical resiliency, confirming the important role of good mainstreaming of disaster risk reductions in different plans and policies. Having good knowledge dissemination and institutional collaboration can lead to better community preparedness and, usually, good structures of buildings and roads.
3.4. Extracting the Most Effective Features of CDRI
Each of the local experts and officials was questioned to evaluate the importance of each parameter and variable considered to be the most effective indicator of climate disaster resilience in their attributed zone. Through the assessment of the climate disaster scores for five different dimensions, it was found that, although some parameters and variables were considered as the most important factor in nearly all cases, the experts and zone authorities generally prioritized the parameters and variables differently, which means each city needs to find strategies that are relevant to their overall condition rather than looking for a “fits all” solution. Table 3 shows a few sets of parameters recognized as the most important factors to improve climate disaster resilience in the study area.
3.5. Correlation Between CDRI Features
To elucidate the possible connections between the different dimensions and parameters, a statistical correlation was conducted to reveal any interrelated features of the CDRI, helping in the formulation of efficient strategies to improve the climate disaster resilience (Table 4). The results showed very strong correlations among several parameters in different dimensions, supported by the CDRI analysis. The correlation results highlighted the importance of the respective factors and features that ought to be primarily considered in improving the resilience to climate-induced disasters.
4. Discussion
While the range of scores of the CDRI results is between 1 (low) and 5 (high), a numerical value is not the most critical part of understanding the overall CDRI or dimension-al results. What is more important in interpreting and analyzing the scores is to address which dimensions, parameters, or variables are particularly low or high in order to take proper action in each sector. Since the aim of the CDRI is to reduce the disaster risks and to make cities capable of coping with climate-related disturbances, a qualitative interpretation of the sectors is sufficient for risk reduction by city planners and decision-makers, as a standardization of the CDRI scores is not yet available due to the limited number of case studies [43].
Regarding the overall resilience scores (see Figure 4), each city revealed some zones with lower resilience in contrast to the other regions with moderate-to-good resilience, highlighting the importance of the need for a resilience assessment on a smaller scale and a more local-based level. Moreover, climate-induced hazards are mostly considered geographically dependent [44], and it is suggested to address the disaster risk assessment on a smaller administrative level. The zone-based analysis of the CDRI in Southern Taiwan demonstrated that local authorities are the most effective management team and that their decision-making strategy can help to plan city resilient scenarios adequately.
A lower economic resilience can be attributed to higher unemployment rates and lower job opportunities, producing cumulative effects on the other categories, such as social dimensions. Other economic factors, such as the ability of the zone’s administration to supply funding to prevent potential disasters, are less significant, particularly after the “disaster prevention and relief act” of Taiwan in 2000, which is about major reforms in the nation’s disaster prevention and rescue system [45]. Southern Taiwan also shoulders a heavy burden in providing soil for heavy industries, such as the international port, fasteners, and municipal solid waste landfill (zone 1 of Kaohsiung); Pingtung agricultural biotechnology park (Zone 1 of Pingtung); or Tainan Science Park (between zones 2 and 4 of Tainan). A lower natural resilience score in these areas can be attributed to the described land uses, which weakens the quality of the ecosystem services and lowers the capacity of the region to absorb further disturbances or potential shocks. However, industrial activities and land uses are not the only parameters that lower the natural resilience, as some regions like zone 4 in Kaohsiung with low natural resilience are high potential landslide areas with higher levels of disaster impacts [46]. Pingtung shows an average lower economy resilience score compared with the other two case studies, which can be attributed to comparatively little new development and less job opportunities, as many younger residents of Pingtung are eager to leave in search for better education or job opportunities elsewhere.
An analysis of the overall CDRI showed Kaohsiung as the most resilient city in Southern Taiwan. Although with an overwhelmingly high population density and growing industrial sector in Kaohsiung, it is expected to be the least resilient system in the region, but Kaohsiung management strategies seem to better pursue the sustainable development of land and sea resources and build more livable and resilient environments that can cope with the effects of climate change. Despite the lowest score in social and economy dimensions at the zone level, Kaohsiung showed much better overall CDRI scores at the municipal scale. This is particularly important, as it reveals the ignored less resilient spots within a city territory, which can be further used in urban and sustainable development plans. Recently, the Kaohsiung City government received a score of “A” in the Carbon Disclosure Project (CDP) in the ranking of 596 cities’ actions to cut emissions and set climate strategies. An “A” score through the CDP, which runs the global environmental reporting system for companies and subnational governments, implies that a city demonstrates strong climate adaptation and mitigation strategies, leading action plans to efficiently tackle the climate change and extreme weather events [47].
In addition, the central government supported the establishment of a local environmental database and contributed to the development plans and disaster planning of Kaohsiung City with abundant environmental information. Moreover, in order to strengthen the capability of climate change adaptation, the Kaohsiung City government established administration strategies, listing measures and actions that may be able to be adopted for fulfilling short-term, medium-term, and long-term goals, giving it the highest institutional score among the Southern Taiwan cities. However, due to the heavy industrial cluster, Kaohsiung suffers severely from poor air quality in the autumn and winter, as well as river pollution, groundwater pollution, and overcrowding of buildings [48]. This can be well-confirmed by the lowest CDRI score for ecosystem services in Kaohsiung. The low CDRI of ecosystem services results mainly from environmental degradation, particularly the low quality of air due to the industrial cluster in the region. Kaohsiung ranked as having the worst PM2.5 air pollution of any city in Taiwan in 2018, though it demonstrated a 24% decrease over the previous year. Kaohsiung is Taiwan’s biggest commercial harbor and second largest city, with a population of ≈2.7 million people. It is also the epicenter of Taiwan’s heavy industry, including China Steel Corp, China Shipbuilding Corp, and the petrochemical industry [49]. The ecosystem service score was also the lowest in the natural dimension in Pingtung. The Kaohsiung–Pingtung area is considered the worse polluted area in Taiwan, accounting for about 6% of station days of the Pollutant Standards Index (PSI) > 100 [50]. A lower ecosystem service score in the CDRI analysis was also reported in the study of Joerin et al. [42] on Chennai, India, where land use diminished the quality of the ecosystem services and, therefore, lowered the natural dimension score.
While the overall CDRI analysis revealed the highest resilience in the physical dimension, the natural category received the lowest average scores, showing the least resilience within all zones. In the CDRI assessment conducted by Wan Mohd Rani et al. [28], the physical component also revealed a moderately high score for the case study cities because of the continuous supply even during the flooding events. The resilience of the natural dimension is evaluated in terms of the intensity/severity of natural hazards, frequency of natural hazards, ecosystem services, land use in natural terms, and environmental policies. Taiwan frequently experiences different types of natural disasters due to its geographical conditions, including low topography, land characteristics, severe typhoons, and extreme weather conditions, making it naturally vulnerable to climate-induced disasters [51].
Regarding the zone-based analysis of climate-induced disasters, Tainan and Pingtung showed lower resilient scores in their densely residential areas prone to the negative effects of climate change, possibly due to settlements on hazardous grounds. However, Kaohsiung showed a relatively higher resilience score in densely populated areas. This is in contrast with the study of Prashar et al. [52] on assessing the resilience of Delhi to climate-related disasters, where an inverse relationship was reported between the resilience score and population density, and districts with a higher population density showed low resilience and vice versa. These contradictory results could be due to the fact that highly populated areas in Taiwan are attributed to the adequate resources for responding to disasters and better effectiveness of early warning systems. Furthermore, higher urbanization tends to have a better infrastructure and is more likely to function more efficiently during pre- and post-disasters, compared with less populated regions with lower urban development [42]. Moreover, one of Kaohsiung’s unique features is the ten roads that run from west to east, providing a helpful pathway for navigating the city. On the other hand, a less resilient score for Zone 4 in Kaohsiung might be attributed to the less prepared community during a disaster, as well as the lower capacity of healthcare amenities in the region. This can be confirmed by the relatively low score in the health parameter of the social dimension of Zone 4 in Kaohsiung, which highlights the needs for increasing the capacity of health facilities during a disaster in vulnerable zones.
The social and economy dimensions showed similar scores in different zones of Kaohsiung, highlighting the importance of considering interconnected factors in enhancing the overall city resilience in the decision-making process. This can be also documented by a high correlation coefficient (r = 0.80) among community preparedness during a disaster and budget and subsidy parameters (Table 4).
In some regions like Zone 1 in Pingtung, a relatively high resilience score can be explained by both the geographic and social features of the area. This zone is actually located at a higher altitude, making it less likely to face flooding. Moreover, most local residents are house owners. Therefore, better physical and natural scores have risen the total CDRI score in this zone.
Except Zone 1, the other zones in Pingtung did not receive a high score in the social dimension. Considering the high correlation between “knowledge dissemination and management” and “social capital” (Table 4), the less overall CDRI score in Pingtung compared with Tainan and Kaohsiung could be due to the lower social capital in this region, as Pingtung County has been experiencing population decline for 15 consecutive years due to emigration to other cities [36].
In Tainan, Zone 3 showed the highest resilience, supported by the highest physical and institutional scores. This zone received a higher score in the effectiveness of the zone’s crisis management framework parameter, showing better leadership and more efficient emergency management strategies during a disaster. On the other hand, Zones 1 and 4 similarly suffered mainly in the natural dimension due to the intensity and severity of natural hazards, as they are located in highly risky disaster zones for floods, sea level rises, and damage to assets and livelihoods during the heavy rains [53].
The CDRI analysis not only revealed a different resilience level at the dimensional scales but also highlighted the level of resilience of different parameters within each city. Electricity, for instance, is supplied by bulk power sources and distributed equally to all areas, resulted in a relatively high score; water, on the other hand, is provided equally as well but not yet at the most resilient level, with supply and alternative capacity difficulties during disasters in some areas. Knowing about the sectors with lower resilience may trigger proper action at different scales, ranging from the community to the institutional level, both reducing expenses and enhancing the efficiency of the proposed management strategies.
Another interesting finding of this study is the analysis of the correlation between different parameters at the city scale. Significant correlations not only support the assessment results from the CDRI but also reveal interconnections among the development parameters that may have influenced each other. The high correlation of household assets and income (Table 4) sounds reasonable, as families may tend to have more facilities and material resources if they can afford it. This simple relationship can be efficiently used to enhance education and awareness, as well as the ability of communities to actively participate in decision-making practices in each city through social media platforms, which is expected to increase by the residents’ income levels. This can be further supported by the high correlation among “education and awareness” and “community preparedness during a disaster”, confirming the theory that raising awareness eventually results in a more resilient and well-prepared community and a consequently higher ability to cope with the climate change effects. A relatively high correlation between “social capital” and “community preparedness during a disaster” also demonstrated the importance of how enhancing the communities’ ability to build a consensus and to participate in a city’s decision-making process can subsequently result in better community preparedness during a disaster with the help of community-based organizations.
5. Implications and Conclusions
The main scope of the resilient assessment was to enhance the actions and evaluate the capacity for current and future disturbances at the city level. Addressing city resilience through the application of the CDRI in this study showed various adaptation capacities and coping potentials in different zones of each city to deal with climate-induced hazards. The overall CDRI also showed different capabilities, shortcomings, drawbacks, and potential risks of neighboring cities in the same region. One of the shortcomings observed in the study was the quality of the data. The respondents were equipped with the knowledge of all five dimensions prior to the survey. However, most of the participants were very informed about the institutional and economic dimensions, and some cited their personal experiences. This drawback was improved with the help of secondary data for the quantitative questions or through the evaluation and estimation (best possible answer) of the qualitative questions and for those quantitative questions where no data was available.
The climate disaster resilience in Taiwan requires equal attention to the physical, social, economic, and institutional dimensions, while early warning systems and prediction models in management scenarios are highly recommended for monitoring the parameters in the natural dimension. It is also suggested to consider risk reduction as the highest priority in education to increase awareness, as the social dimension of resilience can affect the overall resilience efforts in the area.
Regarding the last announced governmental plans to extend Taiwan’s High-Speed Rail (HSR) line to Pingtung in 2019, it is recommended to speed up completing a ring of rail networks around the island, enhance the transportation efficiency of the country and increasing the physical and economic resilience in the Pingtung area.
Knowing the key target in the whole process of the CDRI is to identify opportunities for advancement and refinement that will lead to more cohesive, impactful, and policy-relevant decision-making in urban planning, the full involvement of national stakeholders and local authorities in the research findings is required to keep the motivation of the cities when undertaking decisive actions and enhancing resilience. It is thus recommended to have periodic monitoring of the resilience dimensions evaluation by the regional network or academic organizations to be used as an input for strategic decision-making.
Coping with climate change will require each city to improve its capacity to address the deficiencies in different aspects of comprehensive development. This would include institutional strengthening and governance improvement to address the climate change effects. City corporations and local organizations need to actively coordinate and mainstream adaptations and resilience approaches to urban planning processes, making their cities capable of dealing with climatic risks and disasters.
In order to reduce the vulnerability and increase the capacity of a city to efficiently respond to disasters, the information accessibility should be decentralized and improved with communication, decision-making, and the conservation of resources. Thus, urban disaster management capabilities at the local level can be greatly improved by strengthening local bodies through the decentralization of power and authority and the involvement of all the stakeholders at all stages of planning and implementation of disaster management programs.
The presented CDRI approach not only showed the potential of the different categories of resilience at the city scale but also clarified the role of in-depth zone-based analyses, which are useful practically in identifying the needs of a specific area for taking proper action measures during decision-making and policy formulation. It was found that, besides the geographical location, other factors such as education and awareness, social capital, institutional collaboration, and ecosystem services are the key challenges in formulating the resilience abilities of each region. It should be noted that the CDRI assessment results act as a baseline, and it is strongly recommended that they be reviewed every three to five years to monitor the progress and success of the formulated strategies and action plans regarding the original CDRI analysis and suggestions. Moreover, the CDRI should be seen as a functional gadget for sustainable urban planning scenarios where the engagement of local government officials and community-based organizations is critical in achieving the optimum results and advisable actions.
Author Contributions
M.I. conducted the formal analysis and methodology optimization. H.F. performed the conceptualization, investigation, and visualization. S.-L.L. helped supervise the project and contributed to the interpretation of the results. All authors have read and agreed to the published version of the manuscript.
Funding
This research was funded by the Ministry of Science and Technology of Taiwan (MOST), with grant number MOST 108-2621-M-309 -001 -MY2. This work was also partially supported by the National Taiwan University from Excellence Research Program-Core Consortiums (NTUCCP-107L891301 and NTU-108L8806) and the NTU Research Center for Future Earth from The Featured Areas Research Center Program within the framework of the Higher Education Sprout Project by the Ministry of Education (MOE) in Taiwan.
Informed Consent Statement
Informed consent was obtained from all subjects involved in the study.
Data Availability Statement
The data that support the findings of this study are available from the corresponding author upon reasonable request.
Conflicts of Interest
The authors declare that they have no conflicts of interest.
References
- UNFCC. Understanding Climate Change: A Beginner’s Guide to the UN Framework Convention and its Kyoto Protocol. Available online: http://unfccc.int/cop5/convkp/begconkp.html (accessed on 26 January 2020).
- Agardy, T.; Alder, J. Ecosystems and Human Well-Being: Current State & Trends; Hassan, R., Scholes, R., Ash, N., Eds.; Island Press United States: Washington, DC, USA, 2005; Volume 1, pp. 513–549. [Google Scholar]
- UN Habitat Meeting the Urban Challenges. Seville. Available online: http://www.pubmedcentral.nih.gov/articlerender.fcgi?artid=3760319&tool=pmcentrez&rendertype=abstract (accessed on 15 February 2020).
- Shaw, R.; IEDM Team. Climate disaster resilience: Focus on coastal urban cities in Asia. Asian J. Environ. Disaster Manag. 2009, 1, 101–116. [Google Scholar]
- Managing Asian Cities: Sustainable and Inclusive Urban Solutions; Asian Development Bank (ADB): Mandaluyong City, Philippines, 2008; p. 327.
- Wang, H.W.; Kuo, P.H.; Shiau, J.T. Assessment of climate change impacts on flooding vulnerability for lowland management in southwestern Taiwan. Nat. Hazards. 2013, 68, 1001–1019. [Google Scholar] [CrossRef]
- Chang, C.; Lee, H.; Lin, Y.C.; Chien, L.K. Disaster Risk Analysis of Coastal Zones in Taiwan in Responses to Sea Level Rise; Cities at Risk: Building Adaptive Capacities for Managing Climate Risks in Asian Coastal Cities (CAR II); The Academy of Sciences: Taipei, Taiwan, 2011; p. 68. [Google Scholar]
- Ko, T.T.; Chang, Y.C. An integrated spatial planning model for climate change adaptation in coastal areas. Ocean. Coast. Manag. 2012, 66, 36–45. [Google Scholar] [CrossRef]
- Davoudi, S. Climate risk and security: New meanings of ‘the environment’ in the English planning system. Eur Plan. Stud. 2012, 20, 49–69. [Google Scholar] [CrossRef]
- Ashby, M.; Shercliff, H.; Cebon, D. Materials: Engineering, Science, Processing and Design, 1st ed.; Butterworth-Heinemann: Oxford, UK, 2007; ISBN 978-0-7506-8391-3. [Google Scholar]
- Star, S.L.; Griesemer, J.R. Institutional ecology ‘translations’ and boundary objects: Amateurs and professionals in Berkeley’s Museum of Vertebrate Zoology, 1907–1939. Soc. Stud. Sci. 1989, 19, 387–420. [Google Scholar] [CrossRef]
- Brand, F.S.; Jax, K. Focusing the meaning (s) of resilience: Resilience as a descriptive concept and a boundary object. Ecol. Soc. 2007, 12, 23. [Google Scholar] [CrossRef] [Green Version]
- Folke, C. Resilience: The emergence of a perspective for social–ecological systems analyses. Global Environ. Chang. 2006, 16, 253–267. [Google Scholar] [CrossRef]
- Leichenko, R. Climate change and urban resilience. Curr. Opin. Environ. Sustain. 2011, 3, 164–168. [Google Scholar] [CrossRef]
- Tyler, R.; Faris, C. Climate change mitigation and adaptation in North American cities. Curr. Opin. Environ. Sustain. 2011, 3, 181–187. [Google Scholar]
- Tyler, S.; Moench, M. A framework for urban climate resilience. Clim. Dev. 2012, 4, 311–326. [Google Scholar] [CrossRef]
- Shao, Y.; Xu, J. Urban resilience: A conceptual analysis based on international literature review. Int. Urban. Plan. 2015, 30, 48–54. [Google Scholar]
- Batty, M. The size, scale, and shape of cities. Science 2008, 319, 769–771. [Google Scholar] [CrossRef] [PubMed] [Green Version]
- Vale, L.J.; Campanella, T.J. The Resilient City: How Modern Cities Recover from Disaster; Oxford University Press: New York, NY, USA, 2005. [Google Scholar]
- Jabareen, Y. Planning the resilient city: Concepts and strategies for coping with climate change and environmental risk. Cities 2013, 31, 220–229. [Google Scholar] [CrossRef]
- Kim, D.; Lim, U. Urban resilience in climate change adaptation: A conceptual framework. Sustainability 2016, 8, 405. [Google Scholar] [CrossRef] [Green Version]
- Bollettino, V.; Alcayna, T.; Dy, P.; Vinck, P. Introduction to Socio-Ecological Resilience; Oxford University Press: Oxford, UK, 2017. [Google Scholar]
- Kafle, S.K. Measuring disaster-resilient communities: A case study of coastal communities in Indonesia. J. Bus. Contin. Emerg. Plan. 2012, 5, 316–326. [Google Scholar]
- Bakkensen, L.A.; Fox-Lent, C.; Read, L.K.; Linkov, I. Validating Resilience and Vulnerability Indices in the Context of Natural Disasters. Risk Anal. 2017, 37, 982–1004. [Google Scholar] [CrossRef] [Green Version]
- Marzi, S.; Mysiak, J.; Santato, S. Comparing adaptive capacity index across scales: The case of Italy. J. Environ. Manag. 2018, 223, 1023–1036. [Google Scholar] [CrossRef]
- Hinkel, J. Indicators of vulnerability and adaptive capacity: Towards a clarification of the science–policy interface. Glob. Environ. Chang. 2011, 21, 198–208. [Google Scholar] [CrossRef]
- Surjan, A.; Sharma, A.; Shaw, R. Understanding Urban Resilience. In Climate and Disaster Resilience in Cities (Community, Environment and Disaster Risk Management); Shaw, R., Sharma, A., Eds.; Emerald Publishing Limited: Bingley, UK, 2011; Volume 6, pp. 17–45. [Google Scholar]
- Wan Mohd Rani, W.N.M.; Kamarudin, K.H.; Razak, K.A.; Che Hasan, R.; Mohamad, Z. Measuring urban resilience using climate disaster resilience index (CDRI). Int. Arch. Photogramm. Remote Sens. Spatial Inf. Sci. 2018. [Google Scholar] [CrossRef] [Green Version]
- Lin, K.C.; Hamburg, S.P.; Wang, L.; Duh, C.T.; Huang, C.M.; Chang, C.T.; Lin, T.C. Impacts of increasing typhoons on the structure and function of a subtropical forest: Reflections of a changing climate. Sci. Rep. 2017, 7, 4911. [Google Scholar] [CrossRef] [Green Version]
- Lan, Y.J.; Huang, C.J. A study of adaptation capacity of coastal disasters due to climate change in order to strengthen southwest area of Taiwan. Coast. Eng. Proc. 2012. [Google Scholar] [CrossRef] [Green Version]
- Teng, W.H.; Hsu, M.H.; Wu, C.H.; Chen, A.S. Impact of flood disasters on Taiwan in the last quarter century. Nat. Hazards 2006, 37, 191–207. [Google Scholar] [CrossRef] [Green Version]
- Yu, P.S.; Yang, T.C.; Kuo, C.C. Evaluating long-term trends in annual and seasonal precipitation in Taiwan. Water Resour. Manag. 2006, 20, 1007–1023. [Google Scholar] [CrossRef]
- Doong, D.J.; Lo, W.; Vojinovic, Z.; Lee, W.L.; Lee, S.P. Development of a new generation of flood inundation maps—A case study of the coastal city of Tainan, Taiwan. Water 2016, 8, 521. [Google Scholar] [CrossRef] [Green Version]
- Lu, C.H.; Chen, Y.J. A protocol analysis of urban population spatial distribution under rising sea levels: A case example of Tainan City, Taiwan. In Flood Recovery, Innovation and Response II; WIT Press: Southampton, UK, 2010; pp. 155–166. [Google Scholar] [CrossRef] [Green Version]
- Chang, H.S.; Hsieh, H.Y. An exploratory study on land use planning of disaster prevention: A case study of Kaohsiung new town. Procedia Environ. Sci. 2013, 17, 382–391. [Google Scholar] [CrossRef] [Green Version]
- Hsu, K.C.; Wang, C.H.; Chen, K.C.; Chen, C.T.; Ma, K.W. Climate-induced hydrological impacts on the groundwater system of the Pingtung Plain, Taiwan. Hydrogeol. J. 2007, 15, 903–913. [Google Scholar] [CrossRef]
- Almutairi, A.; Mourshed, M.; Mohammed Ameen, R.F. Coastal community resilience frameworks for disaster risk management. Nat. Hazards 2020, 101, 595–630. [Google Scholar] [CrossRef] [Green Version]
- Adger, W.N. Social and ecological resilience: Are they related? Prog. Hum. Geogr. 2000, 24, 347–364. [Google Scholar] [CrossRef]
- Klein, R.J.T.; Nicholls, R.J.; Thomalla, F. Resilience to natural hazards: How useful is this concept? Environ. Hazards 2003, 5, 35–45. [Google Scholar] [CrossRef]
- Kadushin, C. Too much investment in social capital? Soc. Netw. 2004, 26, 75–90. [Google Scholar] [CrossRef]
- Cutter, S.L.; Barnes, L.; Berry, M.; Burton, C.; Evans, E.; Tate, E.; Webb, J. A place-based model for understanding community resilience to natural disasters. Global Environ. Chang. 2008, 18, 598–606. [Google Scholar] [CrossRef]
- Joerin, J.; Shaw, R.; Takeuchi, Y.; Krishnamurthy, R. The adoption of a Climate Disaster Resilience Index in Chennai, India. Disasters 2014, 38, 540–561. [Google Scholar] [CrossRef] [PubMed]
- Shaw, R.; Mulyasari, F.; Thi, T.T.M.; Yuner, L.; Co, R. Urban Disaster Risk Reduction Framework: Assessing Urban Resilience in World Vision Project Sites in Bangladesh, Indonesia and China; World Vision International, Asia Pacific HEA Community Resilience Team: Singapore, 2014. [Google Scholar]
- Shahid, S.; Behrawan, H. Drought risk assessment in the western part of Bangladesh. Nat. Hazards 2008, 46, 391–413. [Google Scholar] [CrossRef]
- Chen, L.C.; Wu, J.Y.; Lai, M.J. The evolution of the natural disaster management system in Taiwan. J. Chin. Inst. Eng. 2006, 29, 633–638. [Google Scholar] [CrossRef] [Green Version]
- Hsien, L.C.; Sheng, C.H. The Use of Spatial Analysis Techniques in Mapping Potential Natural Hazard Areas: A Case Study of Taiwan. Procedia Environ. Sci. 2011, 10, 1092–1097. [Google Scholar] [CrossRef] [Green Version]
- CDP. Disclosure Insight Action. Available online: https://www.cdp.net/en/articles/media/43-cities-score-an-a-grade-in-new-cities-climate-change-ranking (accessed on 4 May 2020).
- Kuo, C.Y.; Pan, H.; Chan, C.K.; Wu, C.Y.; Phan, D.V.; Chan, C.L. Application of a time-stratified case-crossover design to explore the effects of air pollution and season on childhood asthma hospitalization in cities of differing urban patterns: Big data analytics of government open data. Int. J. Environ. Res. Public Health 2018, 15, 647. [Google Scholar] [CrossRef] [Green Version]
- Tsai, S.S.; Goggins, W.B.; Chiu, H.F.; Yang, C.Y. Evidence for an Association Between Air Pollution and Daily Stroke Admissions in Kaohsiung, Taiwan. Stroke 2003, 34, 2612–2616. [Google Scholar] [CrossRef] [Green Version]
- Yen, Y.C.; Yang, C.Y.; Mena, K.D.; Cheng, Y.T.; Chen, P.S. Cooking/Window Opening and Associated Increases of Indoor PM2.5 and NO2 Concentrations of Children’s Houses in Kaohsiung, Taiwan. Appl. Sci. 2019, 9, 4306. [Google Scholar] [CrossRef] [Green Version]
- Climate and Disaster Resilience of Greater Dhaka Area: A Micro Level Analysis; Bangladesh Development Series Paper; The World Bank: Dhaka, Bangladesh, 2015; Volume 32.
- Prashar, S.; Shaw, R.; Takeuchi, Y. Assessing the resilience of Delhi to climate-related disasters: A comprehensive approach. Nat. Hazards 2012, 64, 1609–1624. [Google Scholar] [CrossRef]
- Wang, S.J.; Chen, J.W.; Lee, C.H.; Hsu, K.C. The Hazard potential and impact of subsidence under the climate change in the Tainan Area. Taiwan Water Conserv. 2012, 60, 42–53. [Google Scholar]
Figure 1.
Schematic model to capture the city disaster coping capacity.

Figure 2.
Geographic location of Taiwan and the study area.

Figure 3.
Distribution of respondents to the questionnaire (n =183).

Figure 4.
Overall Climate Disaster Resilience Index (CDRI) analysis of (a) Tainan, (b) Kaohsiung, and (c) Pingtung with their associated dimensional scores (d–f).
Figure 4.
Overall Climate Disaster Resilience Index (CDRI) analysis of (a) Tainan, (b) Kaohsiung, and (c) Pingtung with their associated dimensional scores (d–f).

Figure 5.
Climate disaster resilience scores of all zones in the different dimensions of Tainan City.
Figure 5.
Climate disaster resilience scores of all zones in the different dimensions of Tainan City.

Figure 6.
Climate disaster resilience scores of all zones in the different dimensions of Kaohsiung.

Figure 7.
Climate disaster resilience scores of all zones in different dimensions of Pingtung.

Figure 8.
Climate disaster resilience scores of all dimensions in the different case studies.


Table 1.
A sample of the Climate Disaster Resilience Index (CDRI) questionnaire survey.
| Please Rate how Effective the Following Electricity Indicators are in your Region During A Climate Disaster Event | Very Poor | Poor | Medium | Good | Very Good | ||
|---|---|---|---|---|---|---|---|
| 1.1.1 The access of electricity (percentage of household with electricity) | ① | ② | ③ | ④ | ⑤ | ||
| 1.1.2. The availability of electricity | ① | ② | ③ | ④ | ⑤ | ||
| 1.1.3. The supply capacity of eclectricity | ① | ② | ③ | ④ | ⑤ | ||
| 1.1.4. The dependence on external supply | ① | ② | ③ | ④ | ⑤ | ||
| 1.1.5. The alternative capacity | ① | ② | ③ | ④ | ⑤ | ||
| Weight factor: Please rank the variables between 1 and 5 (5 = most important, 1 = least important) | |||||||
| 1.1.1 | 1.1.2 | 1.1.3 | 1.1.4 | 1.1.5 | |||
Table 2.
Dimensions and parameters of the CDRI.
| Dimension | Parameters | Variables |
|---|---|---|
| Physical | Electricity | access, availability, supply capacity, dependence on external supply, alternative capacity |
| Water | access, availability, supply capacity, dependence on external supply, alternative capacity | |
| Sanitation | access, waste collection, waste treatment, recycling, waste collection after a disaster | |
| Accessibility of roads | percentage of land transportation network, paved roads, accessibility during flooding, interruption status after intense rainfall, roadside-covered drain | |
| Housing | building code, buildings with non-permanent structure, buildings above waterlogging, ownership, population living close to polluted industries | |
| Social | Population | population growth, population under 6, and population above 65 years of age, population of informal settlers, population density |
| Health | population suffering from waterborne/vector-borne diseases, population suffering from waterborne diseases after a disaster, access to primary health facilities, capacity of health facilities during a disaster, preparedness for disaster | |
| Education and awareness | literacy rate, population’s awareness of disasters, availability of public awareness programs/disaster drills, access to the internet, functionality of schools after a disaster) | |
| Social capital | population participating in community activities/clubs, acceptance level of community leader (in the ward), ability of communities to build consensus and to participate in city’s decision-making process (level of democracy), level of ethnic segregation | |
| Community preparedness during a disaster | preparedness (logistics, materials, and management); provision of shelter for affected people; support from nongovernmental organizations (NGOs) and community-based organizations (CBOs); population evacuating voluntarily; population participating in relief works | |
| Economic | Income | population below poverty line, number of income sources per household, income derived from informal sector, income disparity, percentage of households have reduced income due to a disaster) |
| Employment | percentage of unemployed labor, unemployed youth, employed women, employees who come from outside the city, child labor in city | |
| Household assets | households have internet connection, mobile phone, air conditioner, motorized vehicle, basic furniture | |
| Finance and savings | availability of credit facility to prevent disaster, credit access, credit access for urban poor, households saving practice, household’s insured properties | |
| Budget and subsidy | City’s funding of disaster risk management, budget for disaster risk reduction, sufficient availability of subsidies/incentives for residents to rebuild houses, alternative livelihood, post-disaster health care | |
| Institutional | Mainstreaming of disaster risk reduction | in zone’s development plans, ability (manpower), and capacity (technical) to produce development plans, extent of community participation in development plan preparation process, implementation of disaster management plan |
| Effectiveness of crisis management | existence and effectiveness of an emergency team during a disaster, emergency leadership, availability of evacuation centers, efficiency of trained emergency workers during a disaster, existence of alternative decision-making personnel | |
| Knowledge dissemination | effectiveness to learn from previous disasters, availability of disaster training programs for emergency workers, existence of disaster-awareness programs for communities, capacity (app, books, leaflets, etc.) to disseminate disaster awareness raising and education programs (disaster education), extent of community satisfaction with the disaster awareness programs | |
| Institutional collaboration | zone’s dependency on external institutions/support, collaboration and interconnectedness with neighboring zones, zone’s cooperation (support) with central corporation department for emergency management, cooperation of zone’s ward officials for emergency management, zone’s institutional collaboration with NGOs and private organizations | |
| Good governance | effectiveness of early warning systems, existence of disaster drills, promptness of zone management system to disseminate emergency information during a disaster to communities and transparency of zone management system in disseminating accurate emergency information, capability of zone body to lead recovery process, accountability and transparency of city government | |
| Natural | Intensity of natural hazards | floods, typhoons, heat waves, droughts (water scarcity), heavy rainfall |
| Frequency of natural hazards | floods, typhoons, heat waves, droughts (water scarcity), heavy rainfall | |
| Ecosystem services | quality of city’s biodiversity, soils, air, water bodies, urban salinity | |
| Land use | area vulnerable to climate-related hazards, urban morphology, settlements on hazardous ground, amount of urban green space (UGS), loss of UGS | |
| Environmental policies | application of zone-level hazard maps in development activities, extent of environmental conservation regulations reflected in development plans, extent of implementation of environmental conservation policies, implementation of efficient waste management system, implementation of mitigation policies to reduce air pollution |
Table 3.
Prioritizing the CDRI parameters and variables in Southern Taiwan.
| Case Study | |||
|---|---|---|---|
| CDRI Features | Tainan | Kaohsiung | Pingtung |
| Most valued (important) parameters | Education and awareness Institutional collaboration  Ecosystem services | Education and awareness Social capital  Budget and subsidy | Accessibility of roads Community preparedness  Mainstreaming of disaster risk reduction |
| Most valued (important) variables | Population’s awareness of climate change effects Zone’s institutional collaboration with NGOs and private organizations  Quality of city’s biodiversity, | Population’s awareness of climate change effects Indigenous peoples: social and ethnic segregation  Funding of disaster risk management | Land transportation network Preparedness (logistics, materials, and management)  Implementation of disaster management plan |
Table 4.
Correlations between different parameters of the CDRI in Southern Taiwan.
| Parameters | Correlation Coefficient (≥0.8) |
|---|---|
| “Income” and “Household assets” | 0.91 |
| “Education and awareness” and “Community preparedness during a disaster” | 0.88 |
| “Land use” and “Income” | 0.85 |
| “Good governance” and “Effectiveness of crisis management” | 0.84 |
| “Good governance” and “Community preparedness during a disaster” | 0.82 |
| “Knowledge dissemination and management” and “Social capital” | 0.81 |
| “Community preparedness during a disaster” and “social capital” | 0.80 |
Publisher’s Note: MDPI stays neutral with regard to jurisdictional claims in published maps and institutional affiliations. |
© 2021 by the authors. Licensee MDPI, Basel, Switzerland. This article is an open access article distributed under the terms and conditions of the Creative Commons Attribution (CC BY) license (http://creativecommons.org/licenses/by/4.0/).
Share and Cite
MDPI and ACS Style
Imani, M.; Fakour, H.; Lo, S.-L. Exploring Climate Disaster Resilience: Insight into City and Zone Levels of Southern Taiwan. Agriculture 2021, 11, 107. https://0-doi-org.brum.beds.ac.uk/10.3390/agriculture11020107
AMA Style
Imani M, Fakour H, Lo S-L. Exploring Climate Disaster Resilience: Insight into City and Zone Levels of Southern Taiwan. Agriculture. 2021; 11(2):107. https://0-doi-org.brum.beds.ac.uk/10.3390/agriculture11020107
Chicago/Turabian StyleImani, Moslem, Hoda Fakour, and Shang-Lien Lo. 2021. "Exploring Climate Disaster Resilience: Insight into City and Zone Levels of Southern Taiwan" Agriculture 11, no. 2: 107. https://0-doi-org.brum.beds.ac.uk/10.3390/agriculture11020107
Note that from the first issue of 2016, this journal uses article numbers instead of page numbers. See further details here.