
Climate Change Effects on Temperate Grassland and Its Implication for Forage Production: A Case Study from Northern Germany

 , and
, and 
Abstract
:1. Introduction
2. Materials and Methods
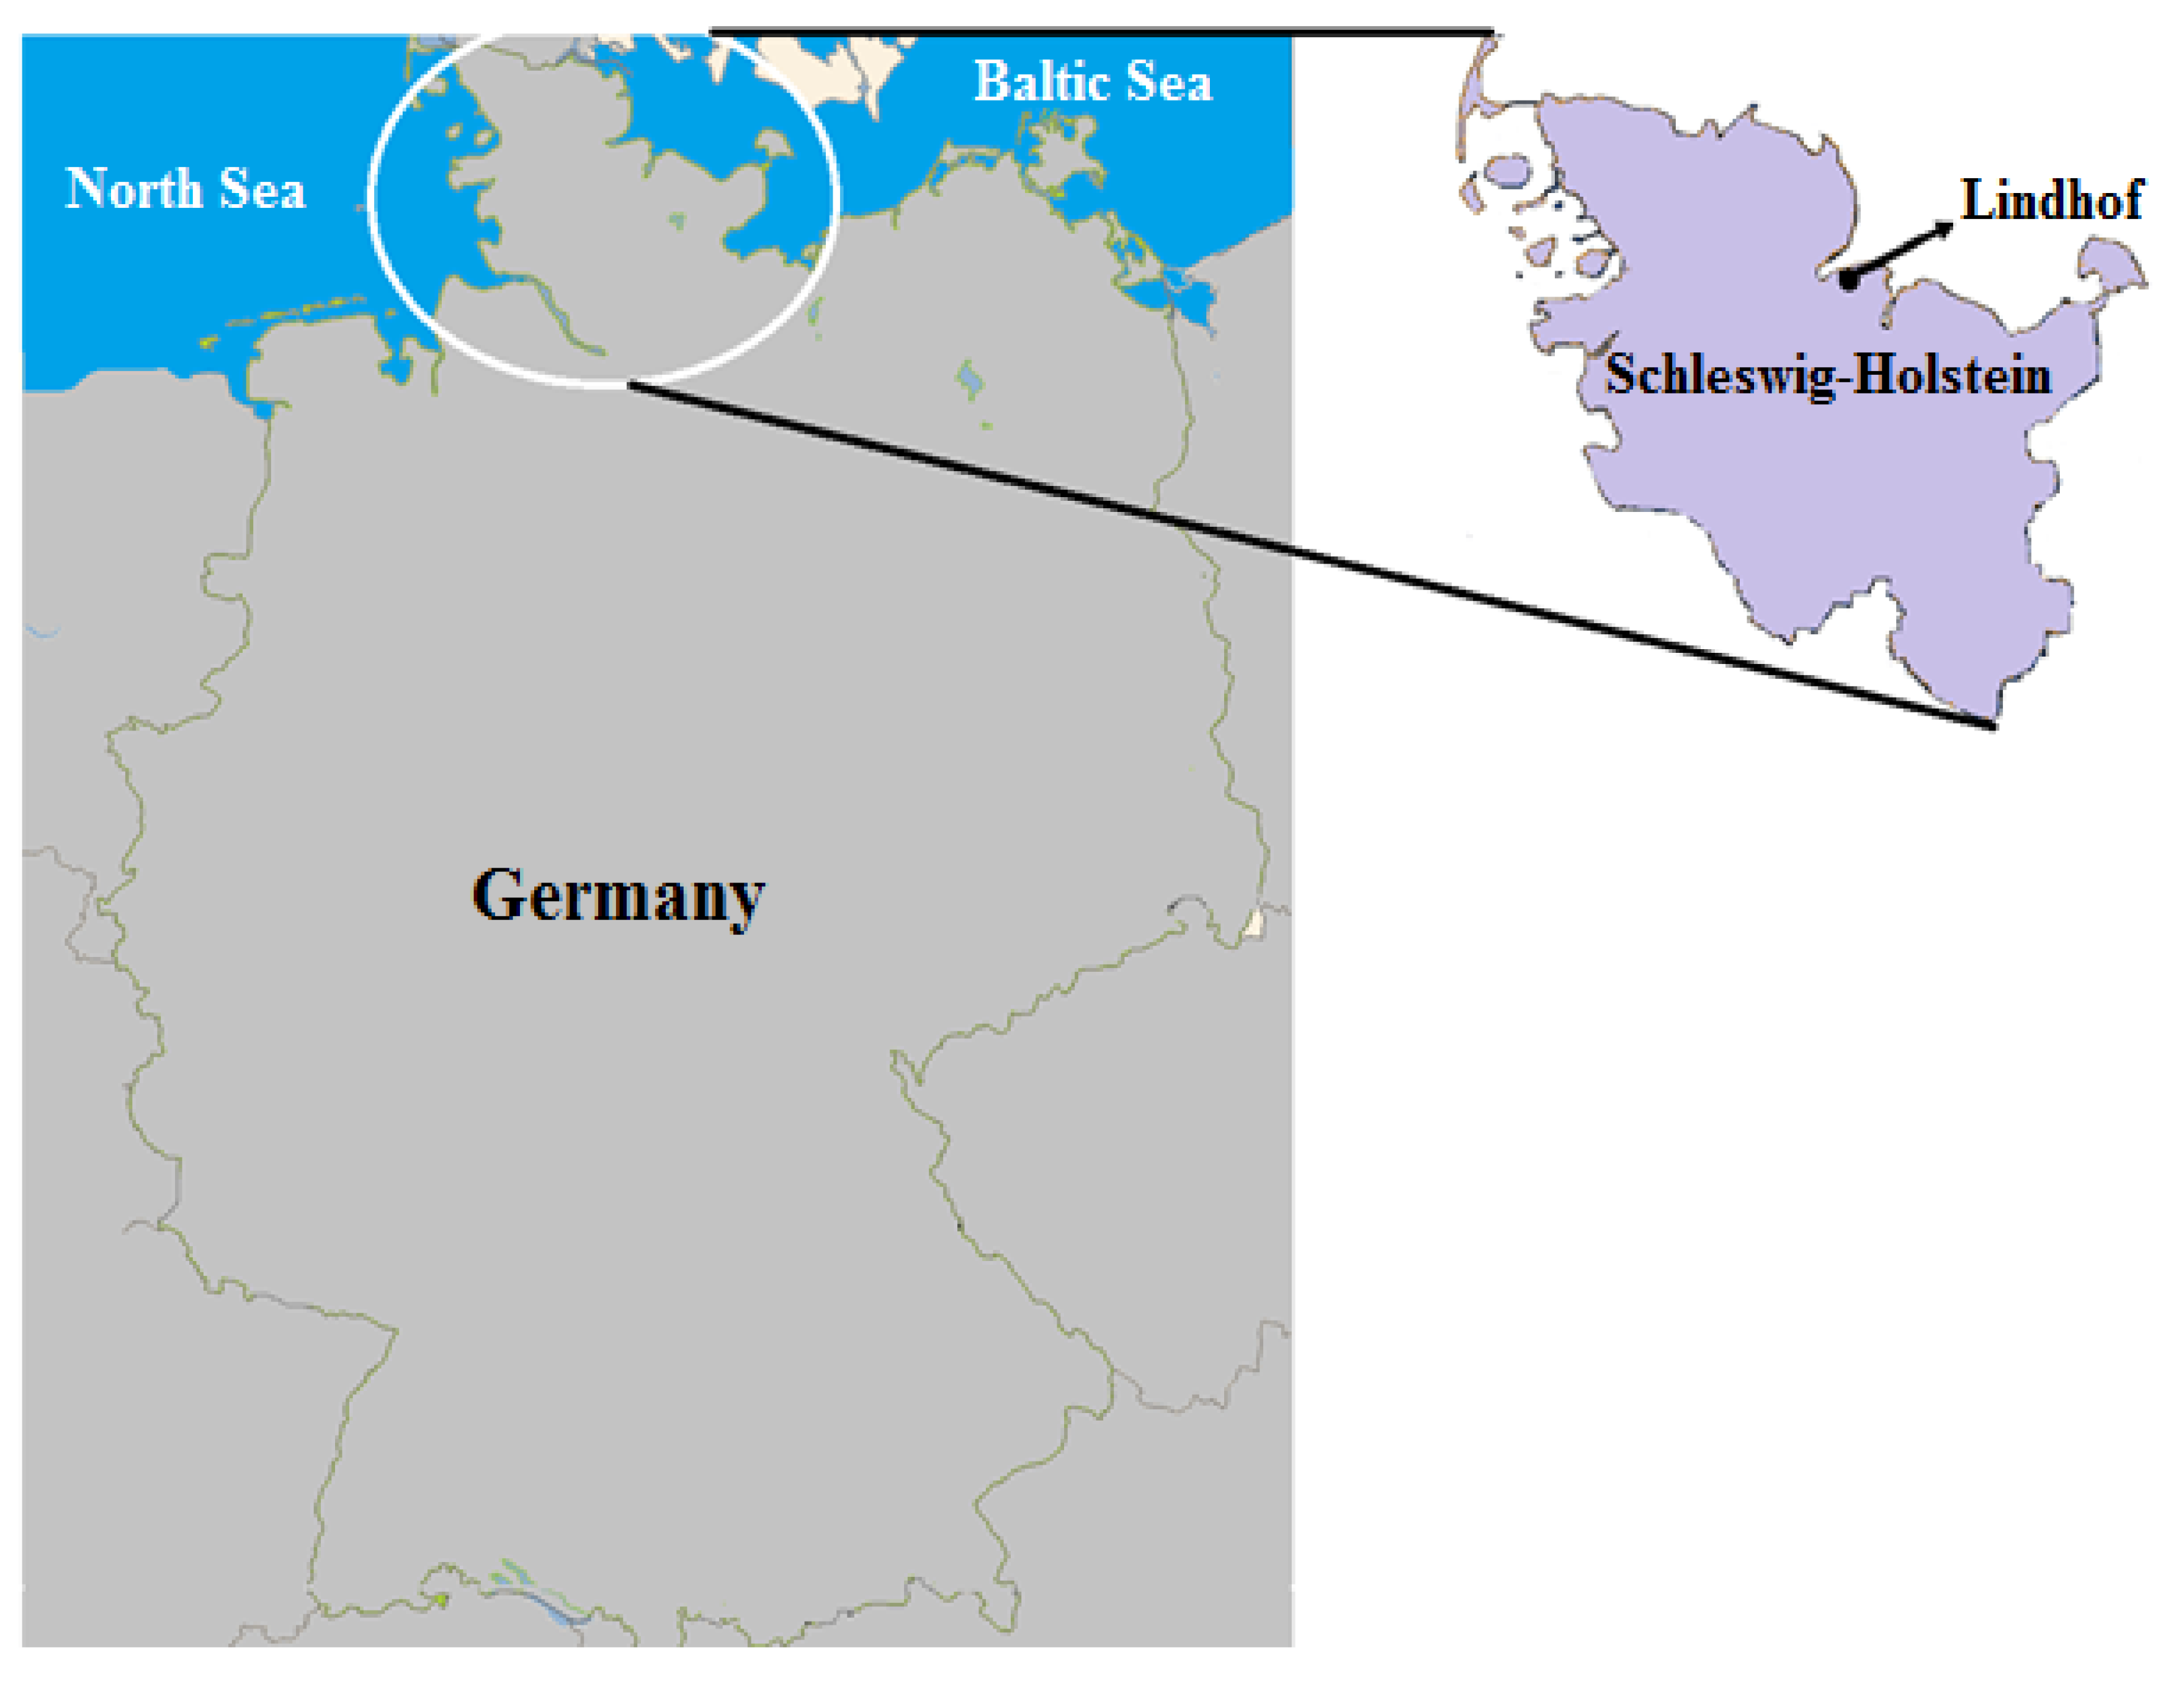
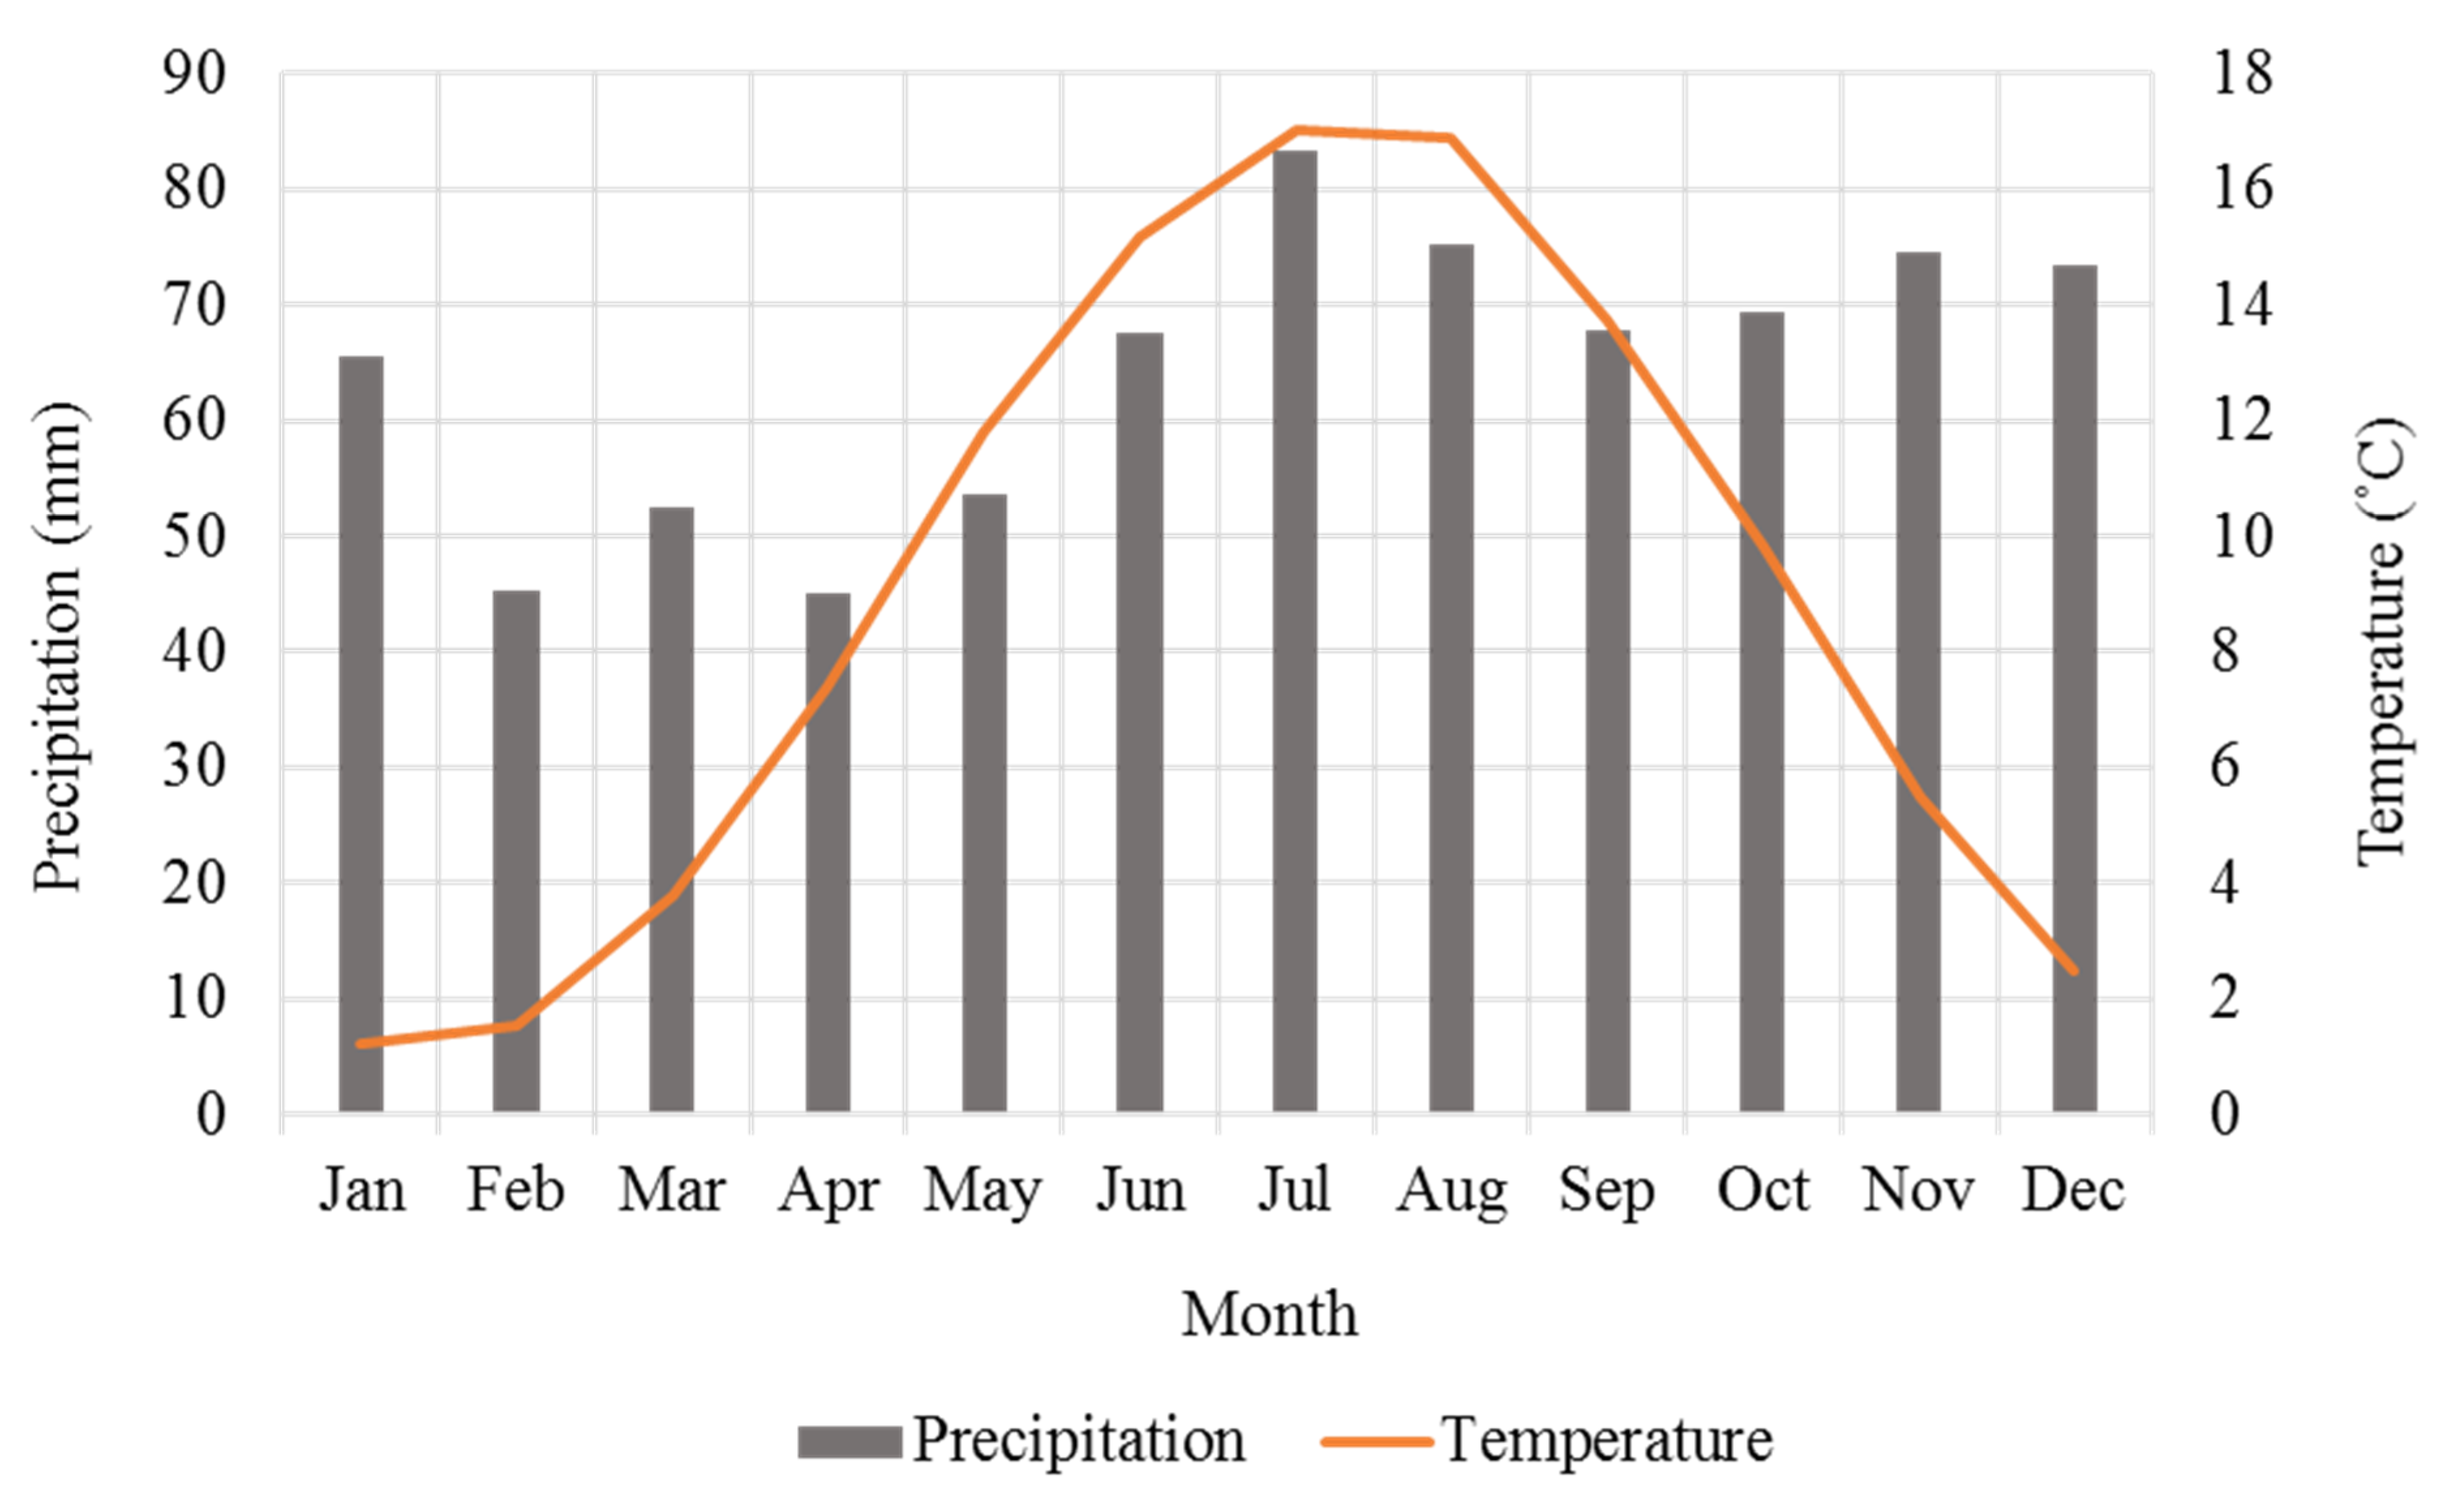
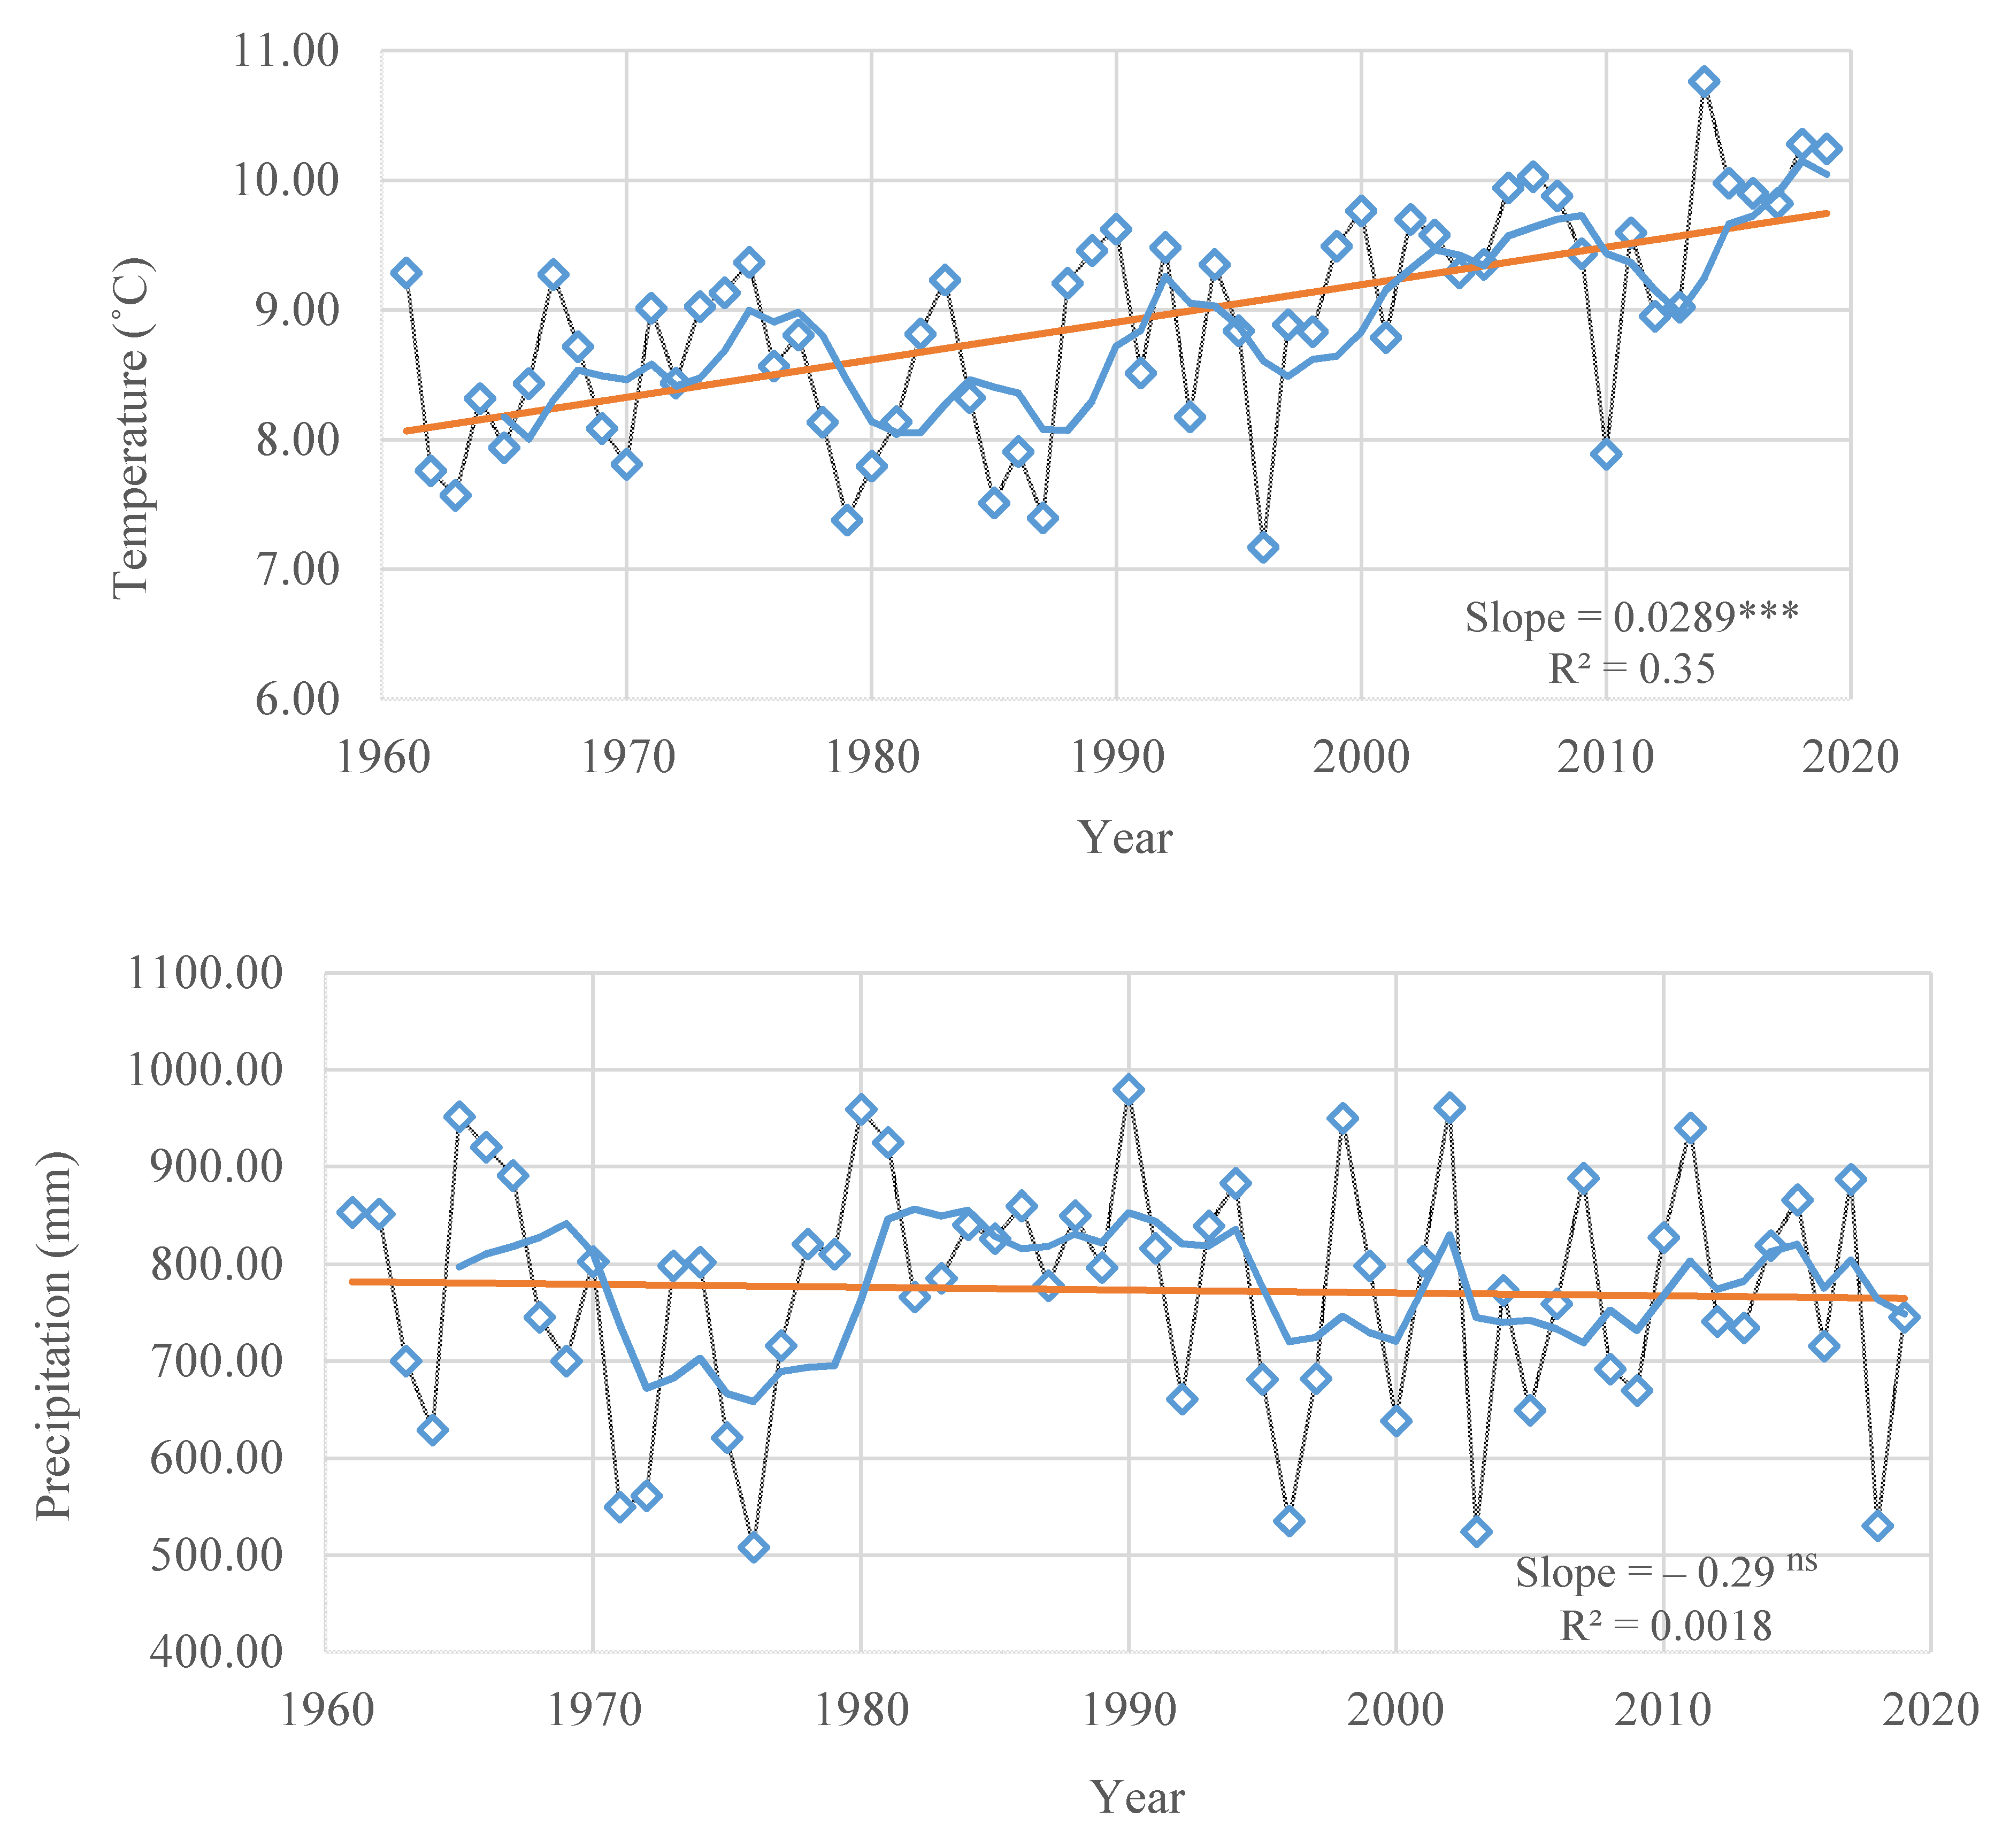
2.1. Study Area
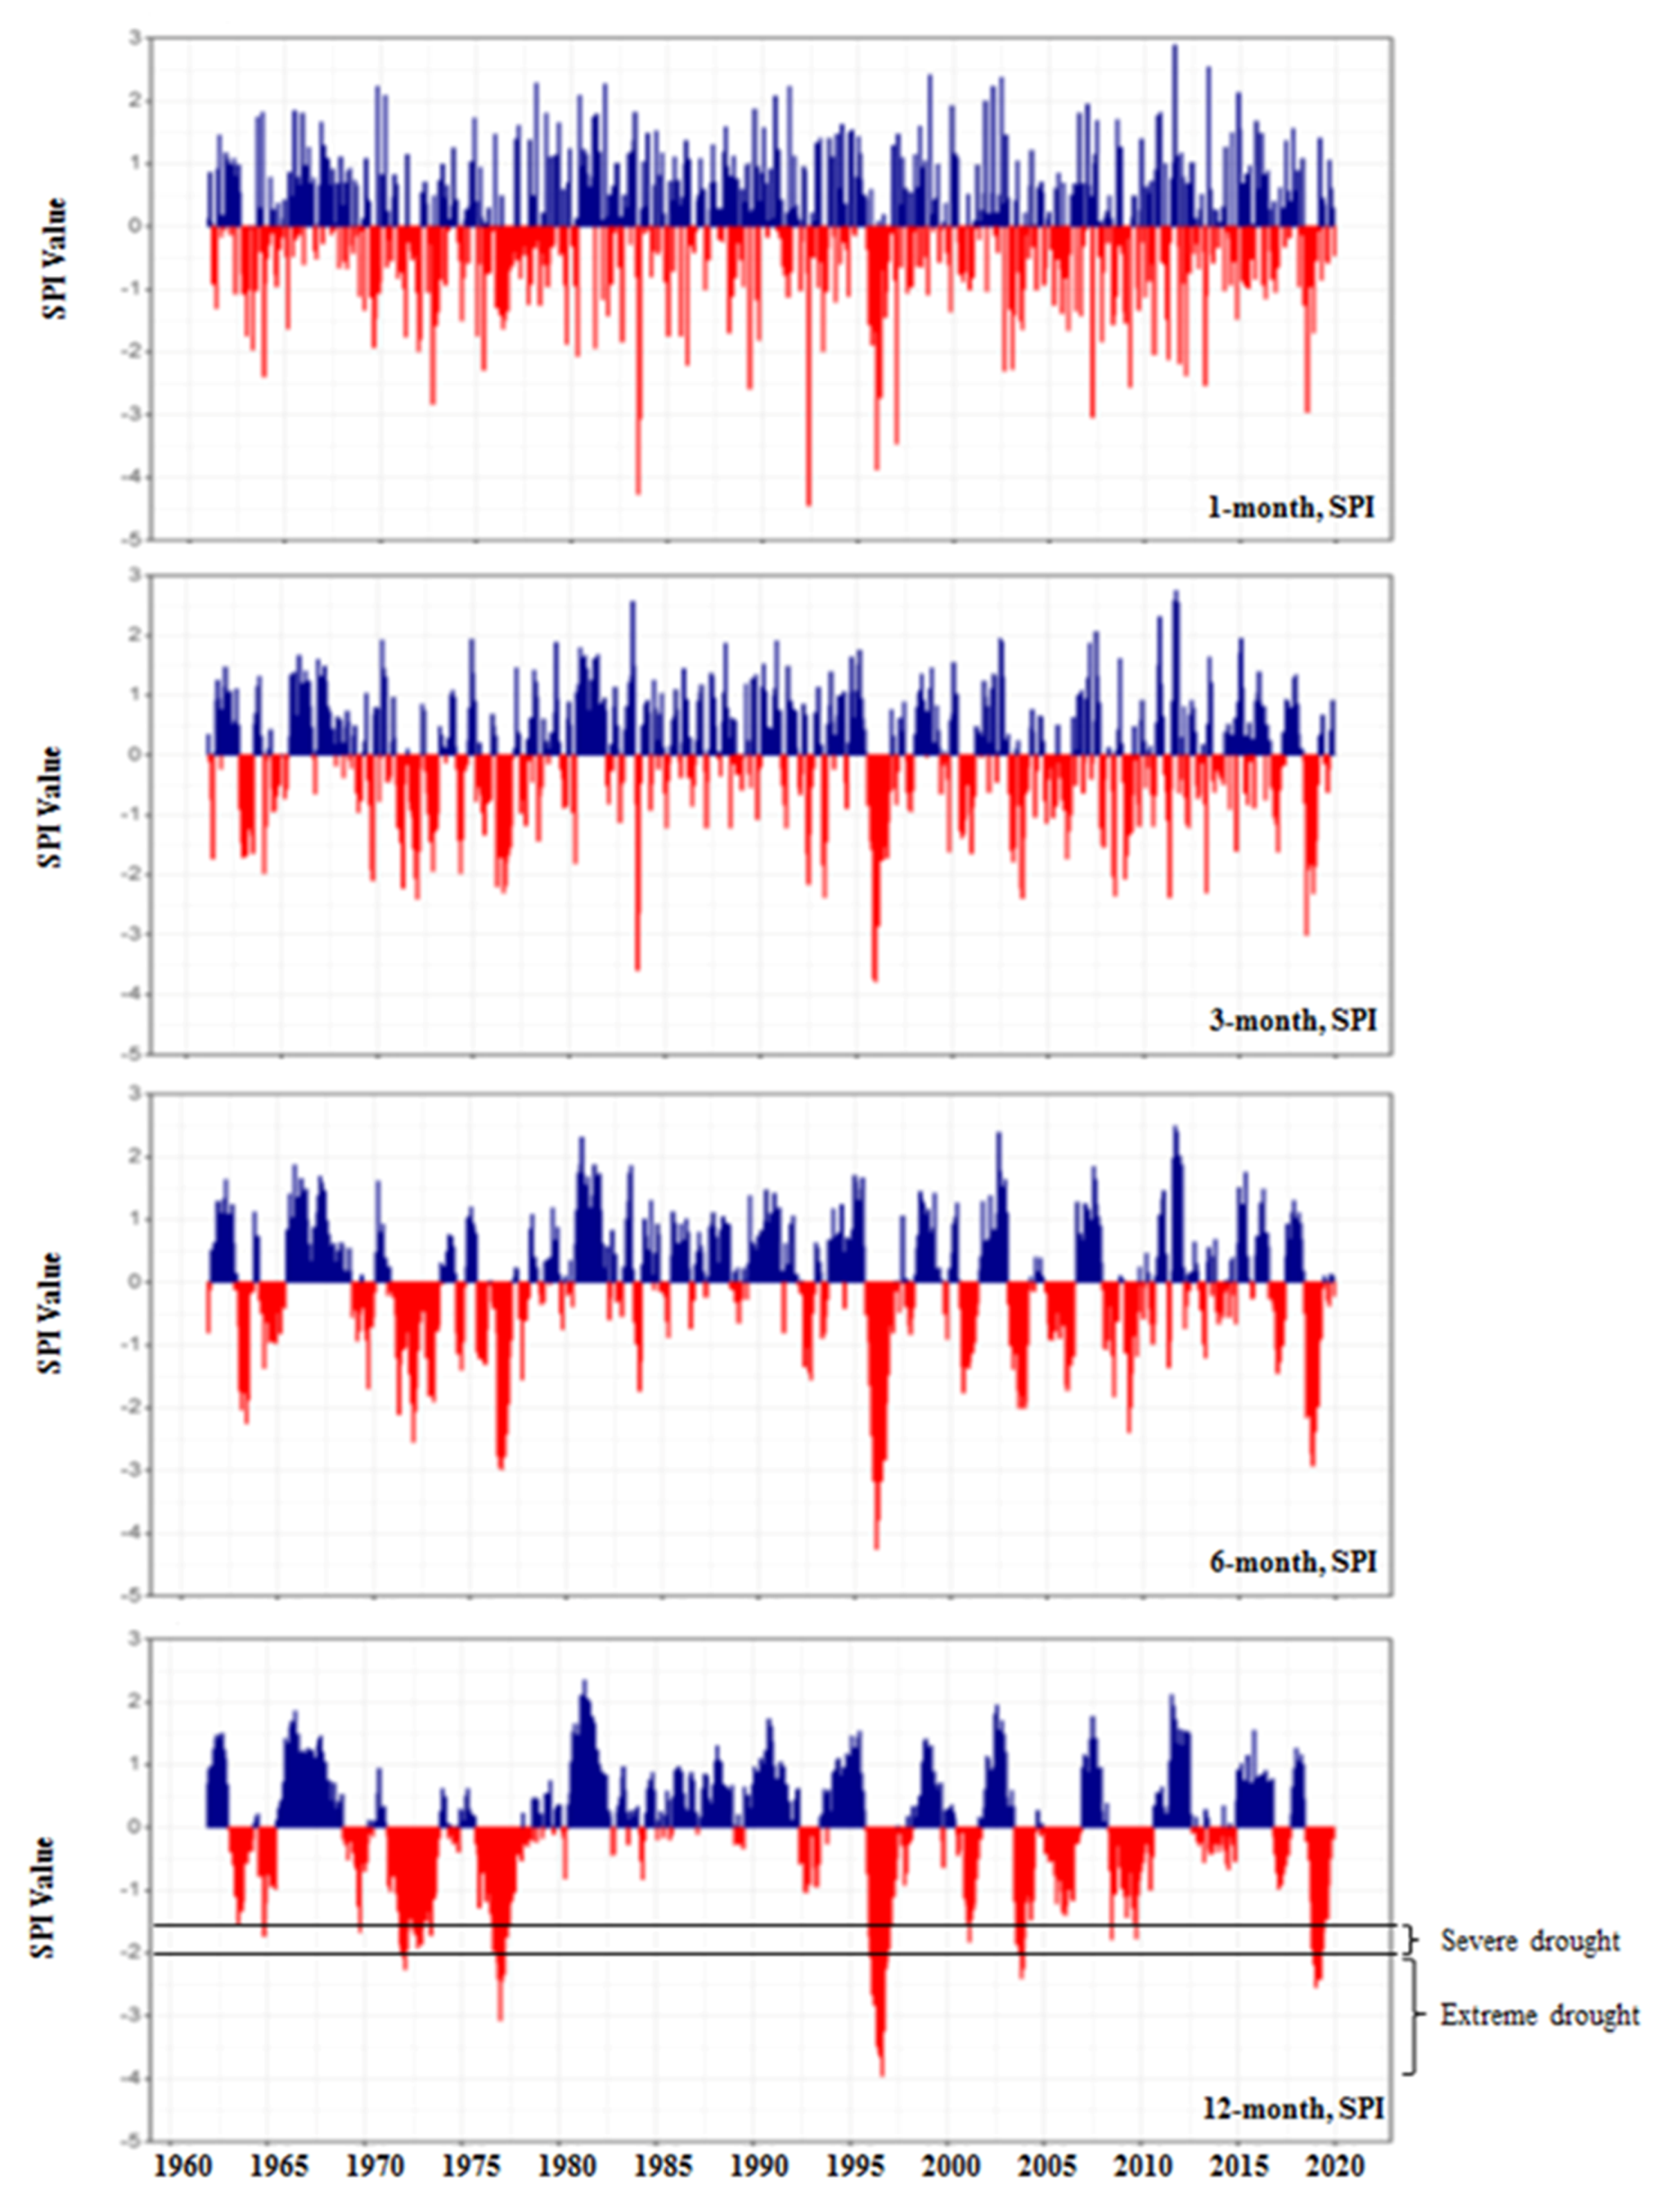
2.2. Drought and Aridity Indices
- It is flexible and it can be calculated for various time scales.
- It has spatial coherence, because it allows comparisons between locations with different climates.
- For short time scales, this index provides early alerts of drought and helps to assess severity.
- The probabilistic origin of the SPI index shows a historical context. This is suitable for decision-making [20].
2.3. Experimental Design and Field Sampling
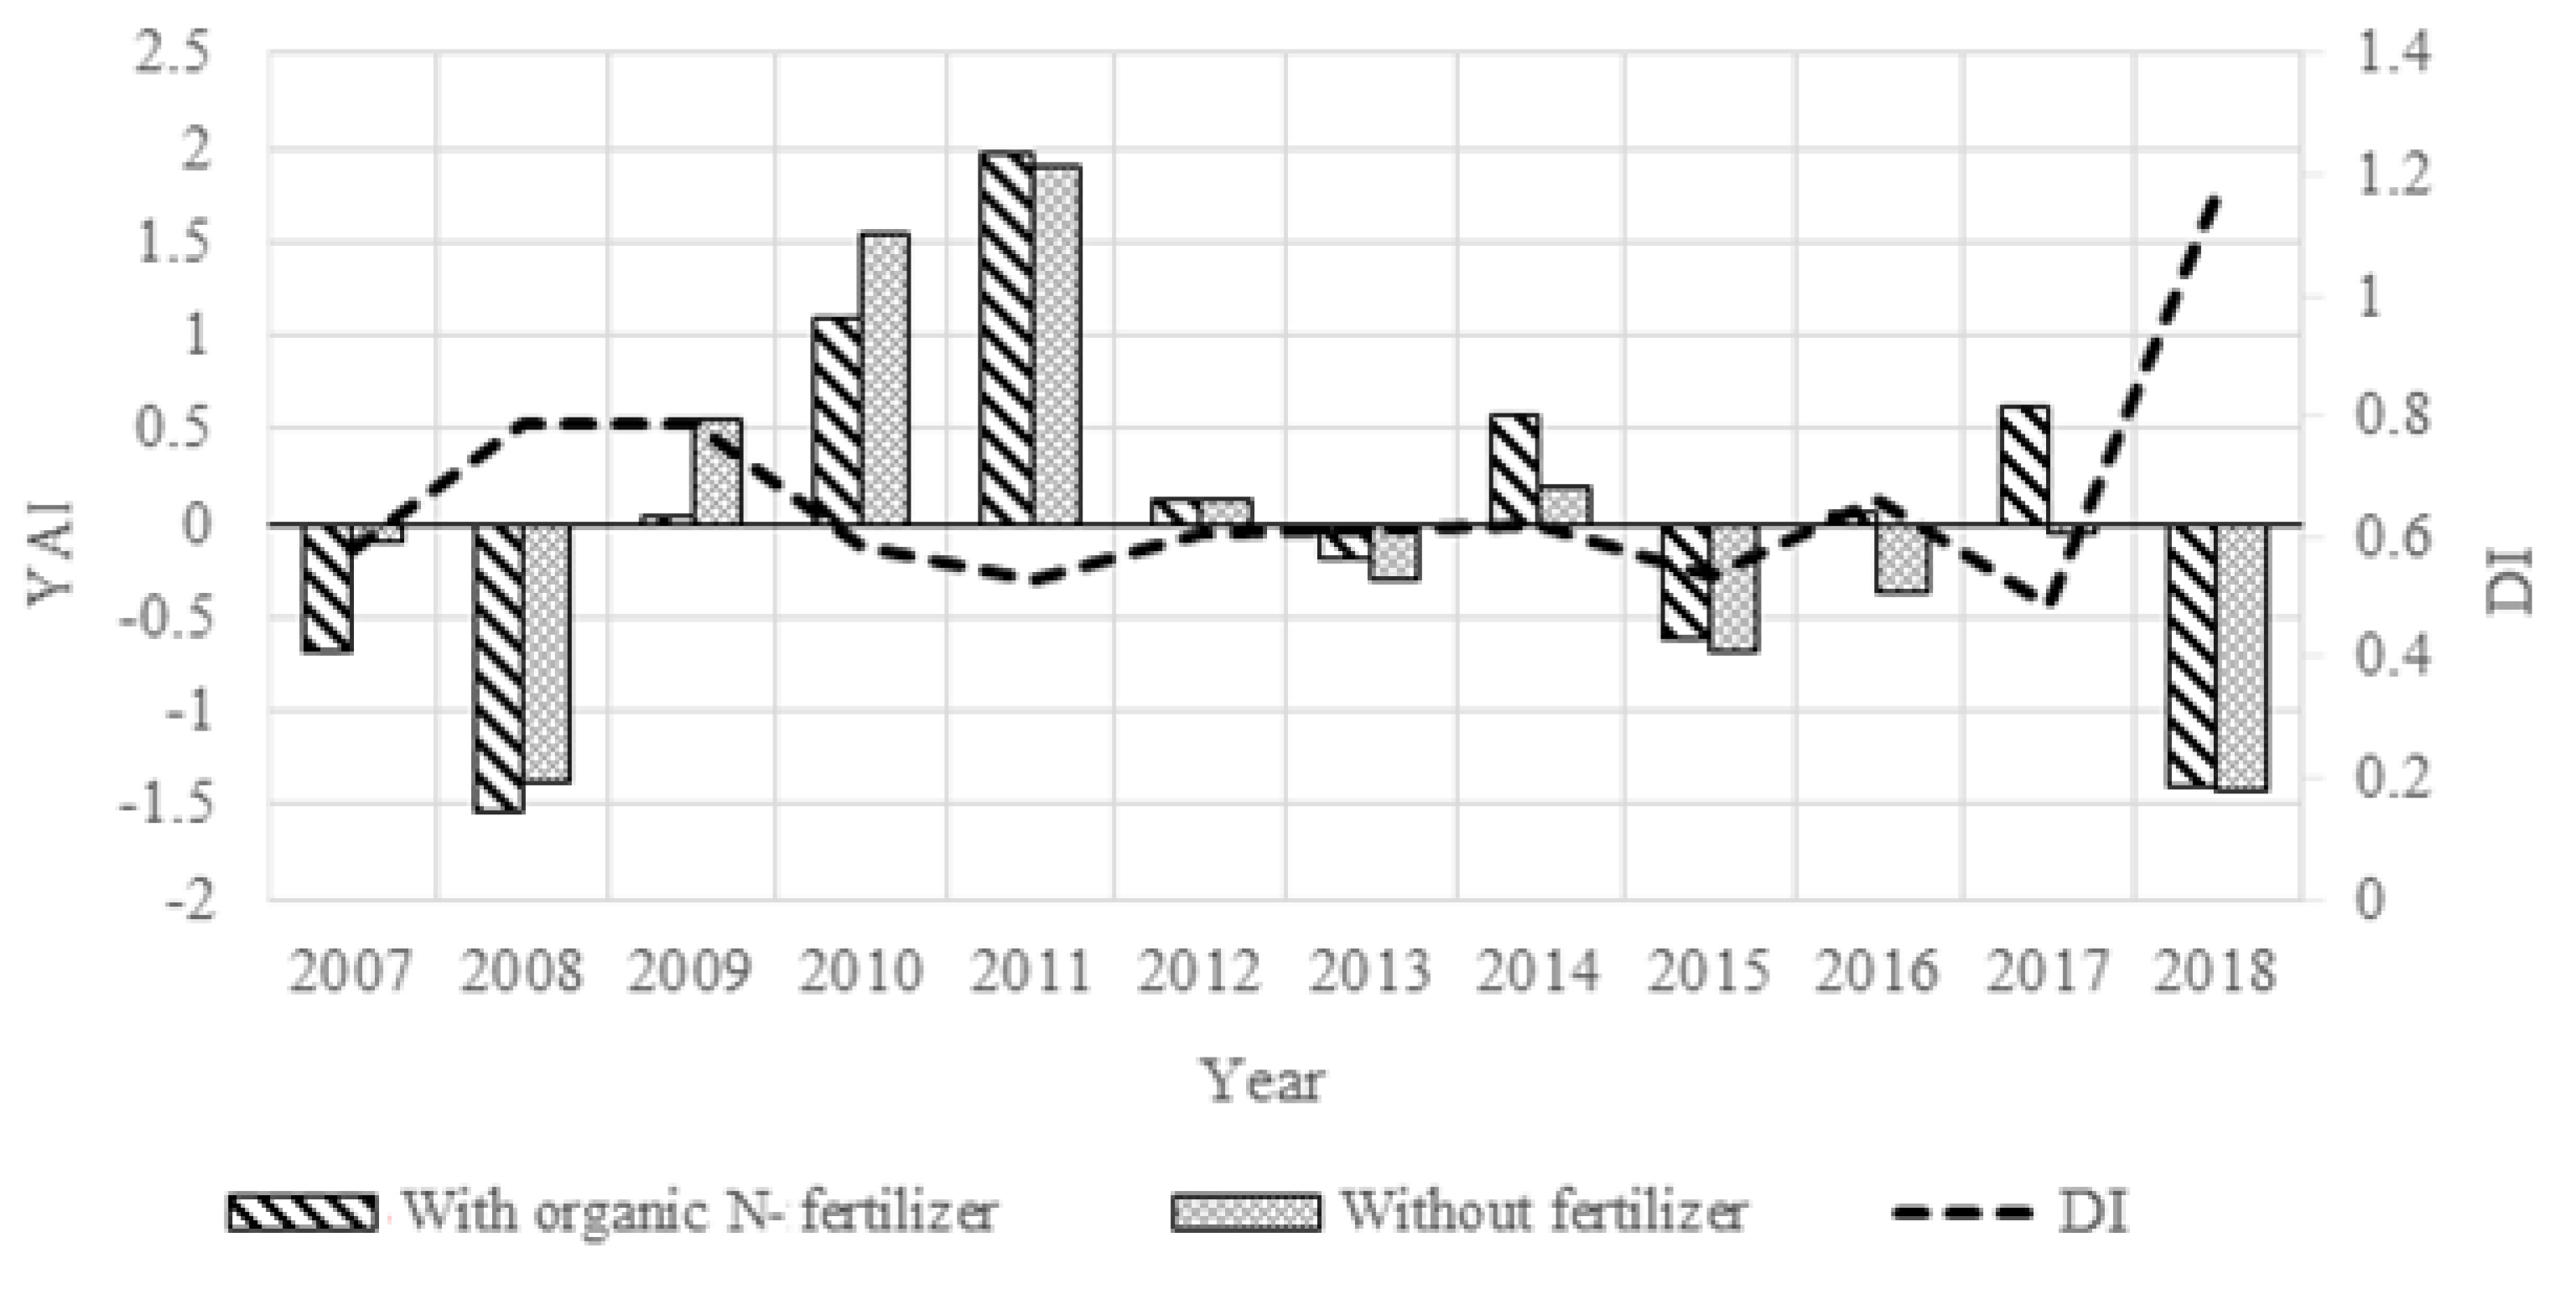
2.4. Yield Anomaly Index (YAI)
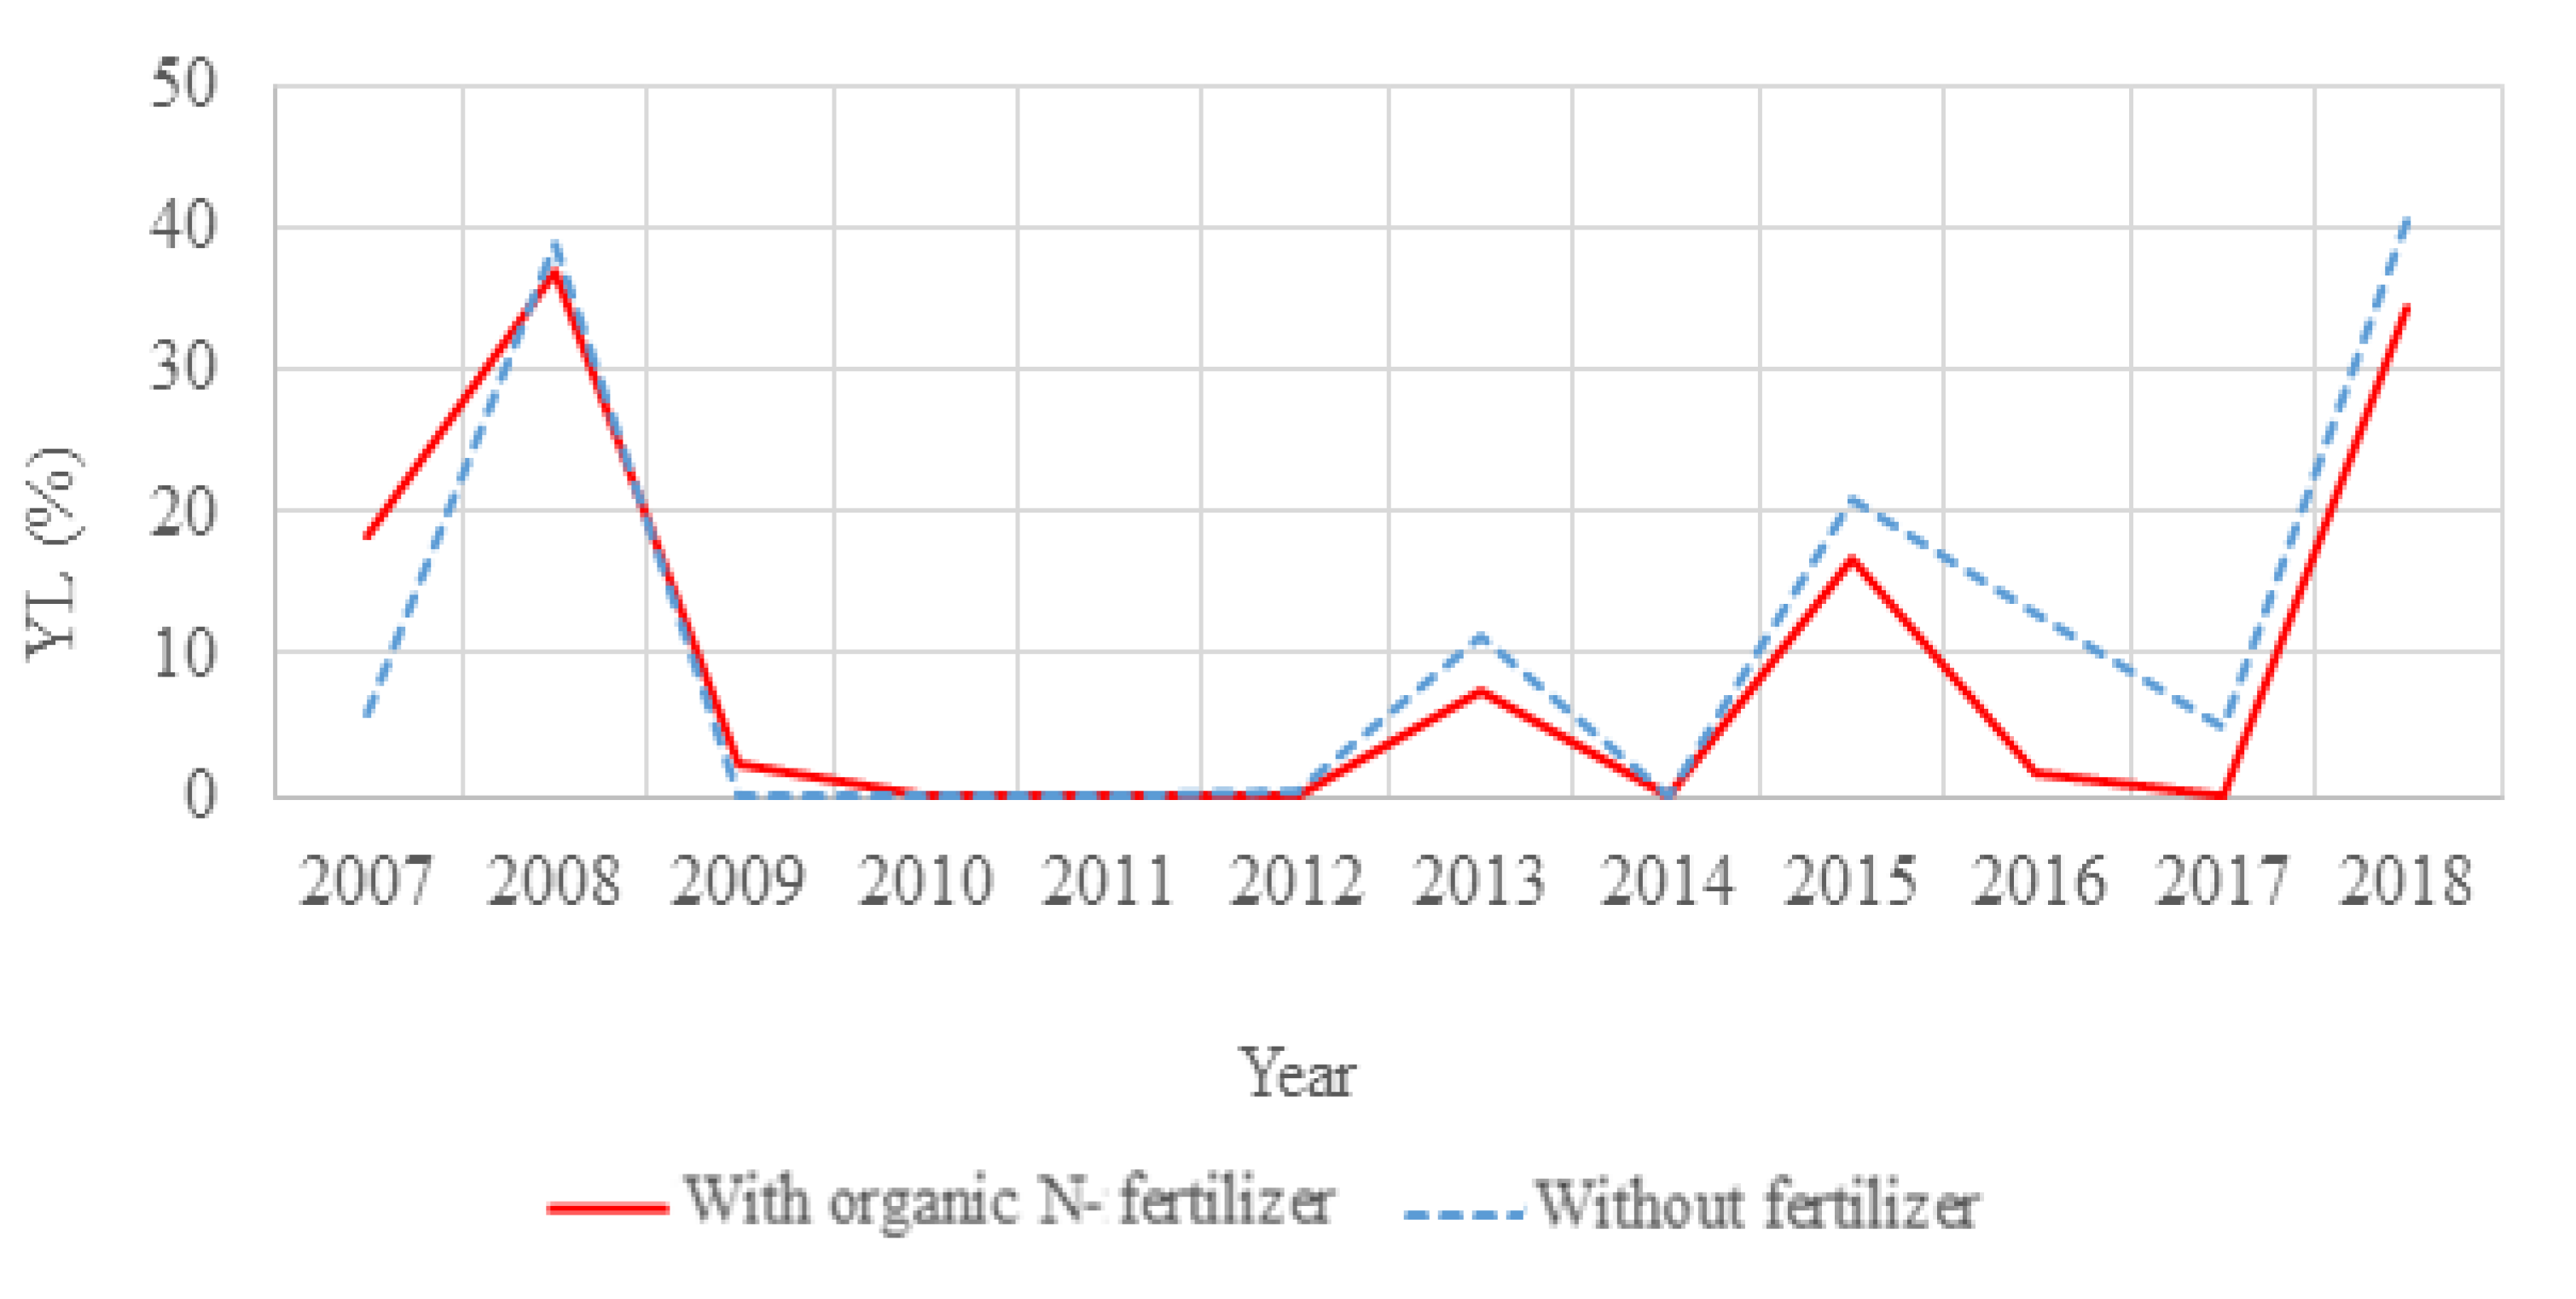
Annual Yield Loss (YL)
2.5. Statistical Methods
3. Results
4. Discussion

| Mildly dry |
|
| Moderately dry |
|
| Severely dry |
|
| Extremely dry |
|
| SPI-1 to SPI-3 | Considered as indicators for short-term impacts such as reduced soil moisture |
| SPI-3 to SPI-12 | Considered as indicators for reduced stream flow and reservoir storage |
| SPI-12 to SPI-48 | Considered as indicators for reduced reservoir and groundwater recharge |
5. Conclusions
Author Contributions
Funding
Institutional Review Board Statement
Informed Consent Statement
Data Availability Statement
Acknowledgments
Conflicts of Interest
References
- Hopkins, A.; del Prado, A. Implications of climate change for grassland management: Impacts, adaptations and mitigation options: A review. Grass Forage Sci. 2007, 62, 118–126. [Google Scholar] [CrossRef]
- Anwar, M.R.; Li Liu, D.; Macadam, I.; Kelly, G. Adapting agriculture to climate change: A review. Theor. Appl. Climatol. 2013, 113, 225–245. [Google Scholar] [CrossRef]
- Kurukulasuriya, P.; Shane, R. Climate Change and Agriculture: A Review of Impacts and Adaptations; Environment department papers; World Bank: Washington, DC, USA, 2013; Available online: https://openknowledge.worldbank.org/handle/10986/16616 (accessed on 8 March 2019).
- Mukherjee, S.; Mishra, A.; Trenberth, K.E. Climate change and drought: A perspective on drought indices. Curr. Clim. Chang. Rep. 2018, 4, 145–163. [Google Scholar] [CrossRef]
- Emadodin, I.; Reinsch, T.; Taube, F. Drought and desertification in Iran. Hydrology 2019, 6, 66. [Google Scholar] [CrossRef] [Green Version]
- Tigkas, D.; Vangelis, H.; Tsakiris, G. Drought characterisation based on an agriculture-oriented standardised precipitation index. Theor. Appl. Climatol. 2019, 135, 1435–1447. [Google Scholar] [CrossRef]
- Raval, A.; Ramanathan, V. Observational determination of the greenhouse effect. Nature 1989, 342, 758–761. [Google Scholar] [CrossRef]
- Kalnay, E.; Cai, M. Impact of urbanization and land-use change on climate. Nature 2003, 423, 528–531. [Google Scholar] [CrossRef]
- Emadodin, I.; Bork, H.R. Degradation of soils as a result of long-term human-induced transformation of the environment in Iran: An overview. J. Land Use Sci. 2012, 7, 203–219. [Google Scholar] [CrossRef]
- Dirmeyer, P.A.; Niyogi, D.; de Noblet-Ducoudré, N.; Dickinson, R.E.; Snyder, P.K. Impacts of land-use change on climate. Int. J. Climatol. 2010, 30, 1905–1907. [Google Scholar] [CrossRef] [Green Version]
- Emadodin, I.; Taravat, A.; Rajaei, M. Effects of urban sprawl on local climate: A case study, north central Iran. J. Urban Clim. 2016, 17, 230–247. [Google Scholar] [CrossRef]
- Emadodin, I.; Reinsch, T. Assessing the impact of land use change on aridification in semi-arid land. Land Degrad. Dev. 2018, 29, 3423–3431. [Google Scholar] [CrossRef]
- Nalbantis, I.; Tsakiris, G. Assessment of hydrological drought revisited. Water Resour. Manag. 2009, 23, 881–897. [Google Scholar] [CrossRef]
- Tsakiris, G. Meteorological Drought Assessment; US Department of Commerce, Weather Bureau: Silver Spring, MD, USA, 2004; pp. 821–833.
- ECA’s, Background Paper: Desertification in the EU. European Court of Auditors. 2018. Available online: https://www.eca.europa.eu/Lists/ECADocuments/SR18_33/SR_DESERTIFICATION_EN.pdf (accessed on 10 October 2019).
- Thurow, T.L.; Taylor, C.A., Jr. The role of drought in range management. J. Range Manag. 1999, 52, 413–419. [Google Scholar] [CrossRef]
- Quiring, S.M.; Ganesh, S. Evaluating the utility of the Vegetation Condition Index (VCI) for monitoring meteorological drought in Texas. Agric. For. Meteorol. 2010, 150, 330–339. [Google Scholar] [CrossRef]
- Quiring, S.M.; Papakryiakou, T.N. An evaluation of agricultural drought indices for the Canadian prairies. Agric. For. Meteorol. 2003, 118, 49–62. [Google Scholar] [CrossRef]
- Kim, T.-W.; Valdes, J.B.; Aparicio, J. Frequency and spatial characteristics of droughts in the Conchos river basin, Mexico. IWRA Water Int. 2002, 27, 420–430. [Google Scholar] [CrossRef]
- Vicario, V.; Díaz, E.; García, C.M.; Rodríguez, A. Identification of pluriannual periodicities in series of drought indexes and its relationship with macroclimatic indicators. Environ. Sustain. Indic. 2019. [Google Scholar] [CrossRef]
- Buras, A.; Rammig, A.; Zang, S.C. Quantifying impacts of the 2018 drought on European ecosystems in comparison to 2003. Biogeosciences 2020, 17, 1655–1672. [Google Scholar] [CrossRef] [Green Version]
- Tsakiris, G.; Pangalou, D. Drought Characterisation in the Mediterranean. In Coping with Drought Risk in Agriculture and Water Supply Systems. Advances in Natural and Technological Hazards Research; Iglesias, A., Cancelliere, A., Wilhite, D.A., Garrote, L., Cubillo, F., Eds.; Springer: Berlin/Heidelberg, Germany, 2009. [Google Scholar] [CrossRef]
- Palmer, W.C. Meteorological Drought; Weather Bureau Paper No. 45 Research; US Department of Commerce, Weather Bureau: Washington, DC, USA, 1965.
- IPCC. Climate Change 2001, the Scientific Basis. In Contribution of Working Group 1 to the Third Assessment Report of the Intergovernmental Panel on Climate Change; Cambridge University Press: Cambridge, UK, 2001. [Google Scholar]
- EEA (European Environment Agency). Global and European Temperatures by the End of the Century. 2020. Available online: https://www.eea.europa.eu/data-and-maps/indicators/global-and-european-temperature-9/assessment (accessed on 30 September 2020).
- Gobin, A.; Jones, R.; Kirkby, M.; Campling, P.; Govers, G.; Kosmas, C.; Gentile, A.R. Indicators for pan-European assessment and monitoring of soil erosion by water. Environ. Sci. Policy 2004, 7, 25–38. [Google Scholar] [CrossRef]
- Lei, T.; Pang, Z.; Wang, X.; Li, L.; Fu, J.; Kan, G.; Zhang, X.; Ding, L.; Li, J.; Huang, S.; et al. Drought and Carbon Cycling of Grassland Ecosystems under Global Change: A Review. Water 2016, 8, 460. [Google Scholar] [CrossRef] [Green Version]
- Lei, T.; Feng, J.; Zheng, C. Review of drought impacts on carbon cycling in grassland ecosystems. Front. Earth Sci. 2020. [Google Scholar] [CrossRef]
- Craine, J.M.; Ocheltree, T.W.; Nippert, J.B.; Towne, E.G.; Skibbe, A.M.; Kembel, S.W.; Fargione, J.E. Global diversity of drought tolerance and grassland climate-change resilience. Nat. Clim. Chang. 2013, 3, 63–67. [Google Scholar] [CrossRef]
- Smit, H.; Metzger, M.; Ewert, F. Spatial distribution of grassland productivity and land use in Europe. Agric. Syst. 2008, 98, 208–219. [Google Scholar] [CrossRef]
- Pecl, G.T.; Araújo, M.B.; Bell, J.D.; Blanchard, J.; Bonebrake, T.C. Biodiversity redistribution under climate change: Impacts on ecosystems and human well-being. Science 2017, 355, 987–997. [Google Scholar] [CrossRef]
- Ciais, P.; Reichstein, M.; Viovy, N.; Granier, A.; Ogée, J.; Allard, V. Europe-wide reduction in primary productivity caused by the heat and drought in 2003. Nature 2005, 437, 529–532. [Google Scholar] [CrossRef]
- EU (European Commission). JRC MARS Bulletin Update on Pasture Condition. 2019. Available online: https://ec.europa.eu/jrc/en/science-update/jrc-mars-bulletin-update-pasture-conditions (accessed on 11 August 2019).
- Soussana, J.F.; Tallec, T.; Blanfort, V. Mitigating the greenhouse gas balance of ruminant production systems through carbon sequestration in grasslands. Animal 2010, 4, 334–350. [Google Scholar] [CrossRef] [PubMed] [Green Version]
- Shepherd, M.; Lucci, G.; Vogeler, I.; Balvert, S. The effect of drought and nitrogen fertiliser addition on nitrate leaching risk from a pasture soil; an assessment from a field experiment and modelling. J. Sci. Food Agric. 2018, 98, 3795–3805. [Google Scholar] [CrossRef]
- Reinsch, T.; Malisch, C.; Loges, R.; Taube, F. Nitrous oxide emissions from grass–clover swards as influenced by sward age and biological nitrogen fixation. Grass Forage Sci. 2020, 75, 372–384. [Google Scholar] [CrossRef]
- Reinsch, T.; Loges, R.; Kluß, C.; Taube, F. Renovation and conversion of permanent grass-clover swards to pasture or crops: Effects on annual N2O emissions in the year after ploughing. Soil Tillage Res. 2018, 175, 119–129. [Google Scholar] [CrossRef]
- Zhang, Y.; Cai, W.; Chen, Q.; Yao, Y.; Liu, K. Analysis of Changes in Precipitation and Drought in Aksu River Basin, Northwest China. Adv. Meteorol. 2015, 4, 1–15. [Google Scholar] [CrossRef] [Green Version]
- Heim, R.R. A review of twentieth-century drought indices used in the United States. Bull. Am. Meteorol. Soc. 2002, 83, 1149–1165. [Google Scholar] [CrossRef] [Green Version]
- Mishra, A.K.; Singh, V.P. A review of drought concepts. J. Hydrol. 2010, 391, 202–216. [Google Scholar] [CrossRef]
- Mustafa, A.; Rahman, G. Assessing the spatio-temporal variability of meteorological drought in Jordan. Earth Syst. Environ. 2018, 2, 247–264. [Google Scholar] [CrossRef]
- Ghadami, M.; Raziei, T.; Amini, M.; Modarres, R. Regionalization of drought severity–duration index across Iran. Nat Hazards. 2020. [Google Scholar] [CrossRef]
- Paulo, A.A.; Pereira, L.S. Stochastic prediction of drought class transitions. Water Resour. Manag. 2008, 22, 1277–1296. [Google Scholar] [CrossRef] [Green Version]
- Tabari, H.; Abghari, H.; Hosseinzadeh Talaee, P. Temporal trends and spatial characteristics of drought and rainfall in arid and semiarid regions of Iran. Hydrol. Process. 2012, 26, 3351–3361. [Google Scholar] [CrossRef]
- Tsakiris, G.; Pangalou, D.; Vangelis, H. Regional drought assessment based on the Reconnaissance Drought Index (RDI). Water Resour. Manag. 2007, 21, 821–833. [Google Scholar] [CrossRef]
- McKee, T.B.; Doesken, N.J.; Kleist, J. The relationship of drought frequency and duration to time scales. In Proceedings of the 8th Conference on Applied Climatology, Anaheim, CA, USA, 17–22 January 1993; pp. 179–184. [Google Scholar]
- WMO, World Meteorological Organization. Standardized Precipitation Index; World Meteorological Organization: Geneva, Switzerland, 2012. [Google Scholar]
- Tallaksen, L.M. Streamflow drought frequency analysis. In Drought and Drought Mitigation in Europe; Springer: Berlin/Heidelberg, Germany, 2000; pp. 103–117. [Google Scholar]
- Espinosa, L.A.; Portela, M.M.; Filho, J.D.P.; Carballo Studart, T.M.; Santos, J.F.; Rodrigues, R. Jointly modeling drought characteristics with smoothed regionalized SPI series for a small island. Water 2019, 11, 2489. [Google Scholar] [CrossRef] [Green Version]
- Lloyd-Hughes, B.; Saunders, M. A drought climatology for Europe. Int. J. Climatol. 2002, 22, 1571–1592. [Google Scholar] [CrossRef]
- Box-Steffensmeier, J.M.; Bradford, S.J. Event History Modeling: A Guide for Social Scientists. In Analytical Methods for Social Research Series; Cambridge University Press: Cambridge, UK, 2004. [Google Scholar]
- Dutta, D.; Kundu, A.; Patel, N.R.; Saha, S.K.; Siddiqui, A.R. Assessment of agricultural drought in Rajasthan (India) using remote sensing derived vegetation condition index (VCI) and standardized precipitation index (SPI). Egypt. J. Remote Sens. Space Sci. 2015, 18, 53–63. [Google Scholar] [CrossRef] [Green Version]
- Tigkas, D. Drought characterization and monitoring in regions of Greece. Eur Water. 2008, 23–24, 29–39. [Google Scholar]
- Deniz, A.; Toros, H.; Incecik, S. Spatial variations of climate indices in Turkey. Int. J. Climatol. 2011, 31, 394–403. [Google Scholar] [CrossRef]
- Vicente-Serrano, S.M.; Beguería, S.; López-Moreno, J.I. A Multiscalar Drought Index Sensitive to Global Warming: The Standardized Precipitation Evapotranspiration Index. J. Clim. 2010, 23, 1696–1718. [Google Scholar] [CrossRef] [Green Version]
- De Martonne, E. Aréisme et Indice Artidite; Comptes Rendus de l’Académie Des Sciences: Paris, France, 1926; pp. 1395–1398. [Google Scholar]
- Feng, G.; Cobb, S.; Abdo, Z.; Fisher, D.K.; Ouyang, Y.; Adeli, A.; Jenkins, J.N. Trend analysis and forecast of precipitation, reference evapotranspiration, and rainfall deficit in the Blackland Prairie of Eastern Mississippi. J. Appl. Meteor. Climatol. 2016, 55, 1425–1439. [Google Scholar] [CrossRef]
- Reinsch, T.; Loges, R.; Kluß, C.; Taube, F. Effect of grassland ploughing and reseeding on CO2 emissions and soil carbon stocks. Agric. Ecosyst. Environ. 2018, 265, 374–383. [Google Scholar] [CrossRef]
- Loges, R.; Bunne, I.; Reinsch, T.; Malisch, C.; Kluß, C.; Herrmann, A.; Taube, F. Forage production in rotational systems generates similar yields compared to maize monocultures but improves soil carbon stocks. Eur. J. Agron. 2018, 97, 11–19. [Google Scholar] [CrossRef]
- Klapp, E.; Stählin, A. Standorte, Pflanzengesellschaften und Leistung des Grünlandes; Verlag Eugen Ulmer: Stuttgart, Germany, 1936. [Google Scholar]
- Ooi, M.K.J.; Auld, T.D.; Denham, A.J. Projected soil temperature increase and seed dormancy response along an altitudinal gradient: Implications for seed bank persistence under climate change. Plant Soil 2012, 353, 289–303. [Google Scholar] [CrossRef]
- Adams, R.M.; Hurd, B.H.; Lenhart, S.; Leary, N. Effects of global climate change on agriculture: An interpretative review. Clim. Res. 1998, 11, 19–30. [Google Scholar] [CrossRef] [Green Version]
- Foster, T.; Brozović, N.; Butler, A.P. Why well yield matters for managing agricultural drought risk. Weather Clim. Extrem. 2015, 10, 11–19. [Google Scholar] [CrossRef]
- Mohmmed, A.; Zhang, K.; Kabenge, M.; Keesstra, S.; Cerda, A.; Reuben, M.; Elbashier, M.M.A.; Dalson, T.; Ali, A.A.S. Analysis of drought and vulnerability in the North Darfur region of Sudan. Land Degrad. Dev. 2018, 29, 4424–4438. [Google Scholar] [CrossRef]
- Izaurralde, R.C.; Thomson, A.M.; Morgan, J.A.; Fay, P.A.; Polley, H.W.; Hatfield, J.L. Climate impacts on agriculture: Implications for forage and rangeland production. Agron. J. 2011, 103, 370–381. [Google Scholar] [CrossRef] [Green Version]
- Bollig, C.; Feller, U. Impacts of drought stress on water relations and carbon assimilation in grassland species at different altitudes. Agric. Ecosyst. Environ. 2014, 188, 212–220. [Google Scholar] [CrossRef]
- Durand, J.L.; Gonzalez-Dugo, V.; Gastal, F. How much do water deficits alter the nitrogen nutrition status of forage crops? Nutr. Cycl. Agroecosyst. 2010, 88, 231–243. [Google Scholar] [CrossRef]
- NDMC (National Drought Mitigation Center). Types of Droughts. University of Nebraska-Lincoln. Available online: https://drought.unl.edu/Education/DroughtIn-depth/TypesofDrought.aspx (accessed on 15 September 2020).
- EDO (European Drought Observatory). Standardized Precipitation Index (SPI). 2020. Available online: https://edo.jrc.ec.europa.eu/documents/factsheets/factsheet_spi.pdf (accessed on 9 May 2020).


| Category | SPI Value | Probabilities (%) |
|---|---|---|
| Extremely wet | ≥2 | 2.3 |
| Very wet | 1.5 to 1.99 | 4.4 |
| Moderately wet | 1.0 to 1.49 | 9.2 |
| Near normal | −0.99 to 0.99 | 68.2 |
| Moderately dry | −1.0 to −1.49 | 9.2 |
| Severely dry | −1.5 to −1.99 | 4.4 |
| Extremely dry | ≤−2 | 2.3 |
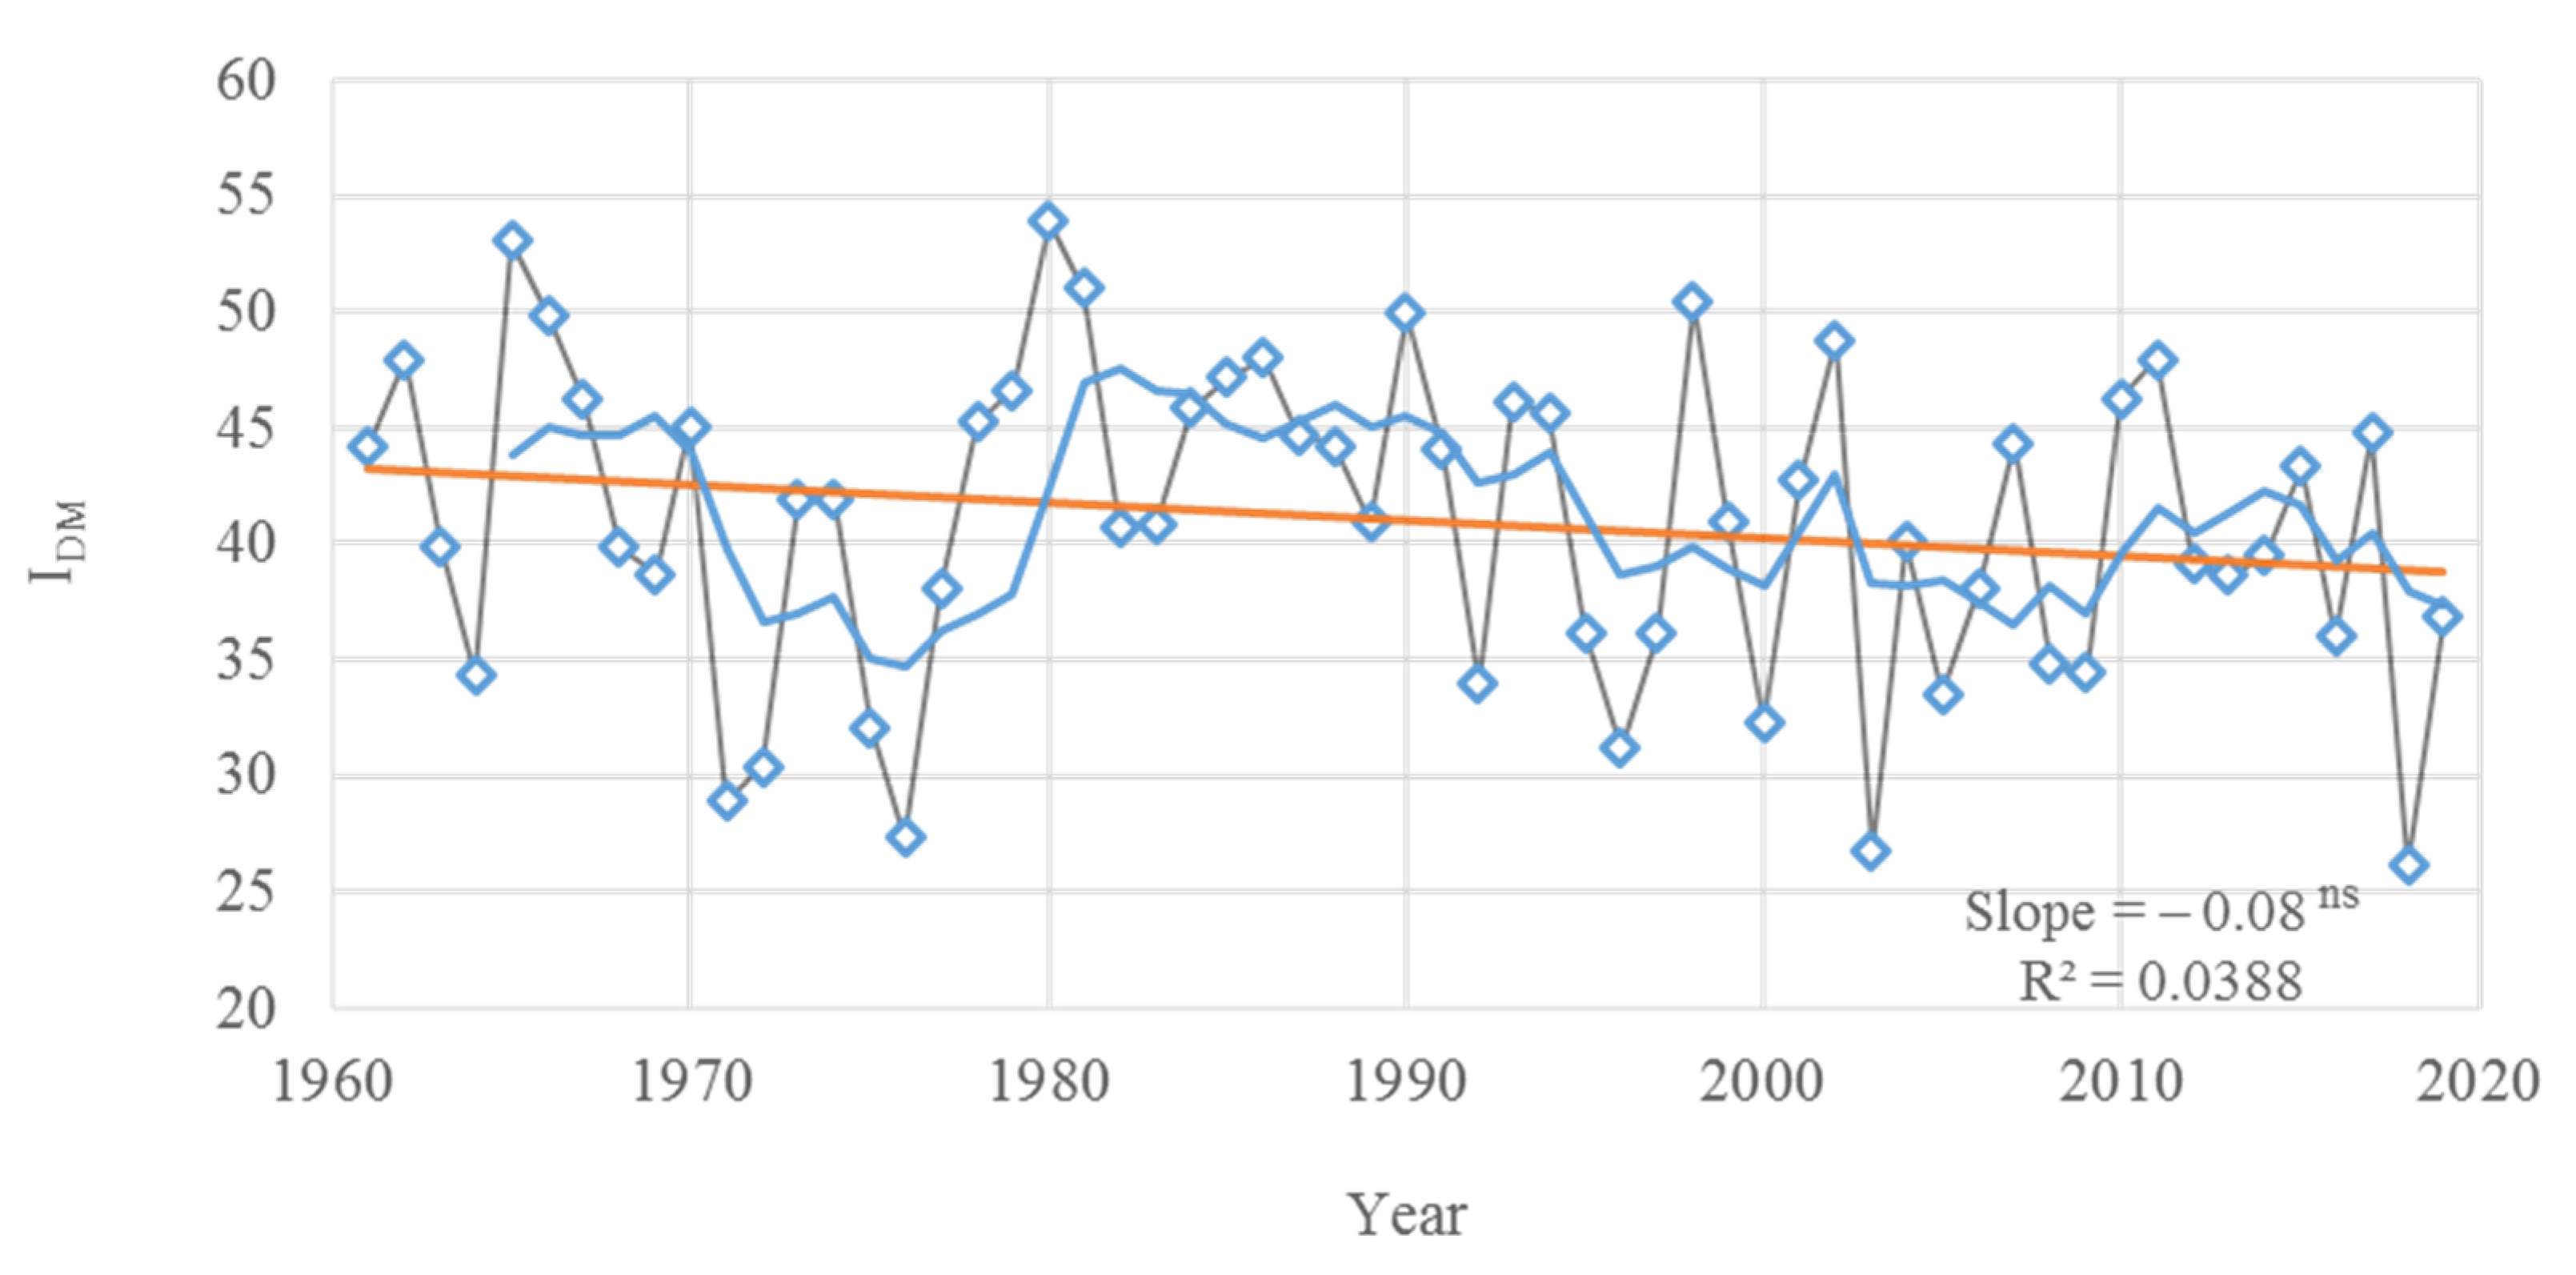
| Climate Type | IDM Values |
|---|---|
| Arid | IDM < 10 |
| Semi-arid | 10 ≤ IDM < 20 |
| Mediterranean | 20 ≤ IDM < 24 |
| Semi-humid | 24 ≤ IDM < 28 |
| Humid | 28 ≤ IDM < 35 |
| Very humid | 35 ≤ IDM < 55 |
| Extremely humid | IDM > 55 |
Publisher’s Note: MDPI stays neutral with regard to jurisdictional claims in published maps and institutional affiliations. |
© 2021 by the authors. Licensee MDPI, Basel, Switzerland. This article is an open access article distributed under the terms and conditions of the Creative Commons Attribution (CC BY) license (http://creativecommons.org/licenses/by/4.0/).
Share and Cite
Emadodin, I.; Corral, D.E.F.; Reinsch, T.; Kluß, C.; Taube, F. Climate Change Effects on Temperate Grassland and Its Implication for Forage Production: A Case Study from Northern Germany. Agriculture 2021, 11, 232. https://0-doi-org.brum.beds.ac.uk/10.3390/agriculture11030232
Emadodin I, Corral DEF, Reinsch T, Kluß C, Taube F. Climate Change Effects on Temperate Grassland and Its Implication for Forage Production: A Case Study from Northern Germany. Agriculture. 2021; 11(3):232. https://0-doi-org.brum.beds.ac.uk/10.3390/agriculture11030232
Chicago/Turabian StyleEmadodin, Iraj, Daniel Ernesto Flores Corral, Thorsten Reinsch, Christof Kluß, and Friedhelm Taube. 2021. "Climate Change Effects on Temperate Grassland and Its Implication for Forage Production: A Case Study from Northern Germany" Agriculture 11, no. 3: 232. https://0-doi-org.brum.beds.ac.uk/10.3390/agriculture11030232