Article

Optimizing Grain Yield and Water Use Efficiency Based on the Relationship between Leaf Area Index and Evapotranspiration

Key Laboratory of Crop Physiology and Ecology, Ministry of Agriculture and Rural Affairs, Institute of Crop Sciences, Chinese Academy of Agricultural Sciences, Beijing 100081, China
*
Author to whom correspondence should be addressed.
Submission received: 21 February 2021 / Revised: 26 March 2021 / Accepted: 2 April 2021 / Published: 3 April 2021
(This article belongs to the Section Agricultural Water Management)

Abstract

:
Achieving optimal balance between maize yield and water use efficiency is an important challenge for irrigation maize production in arid areas. In this study, we conducted an experiment in Xinjiang China in 2016 and 2017 to quantify the response of maize yield and water use to plant density and irrigation schedules. The treatments included four irrigation levels: 360 (W1), 480 (W2), 600 (W3), and 720 mm (W4), and five plant densities: 7.5 (D1), 9.0 (D2), 10.5 (D3), 12.0 (D4), and 13.5 plants m−2 (D5). The results showed that increasing the plant density and the irrigation level could both significantly increase the leaf area index (LAI). However, LAI expansion significantly increased evapotranspiration (ETa) under irrigation. The combination of irrigation level 600 mm (W3) and plant density 12.0 plants m−2 (D4) produced the highest maize yield (21.0–21.2 t ha−1), ETa (784.1–797.8 mm), and water use efficiency (WUE) (2.64–2.70 kg m−3), with an LAI of 8.5–8.7 at the silking stage. The relationship between LAI and grain yield and evapotranspiration were quantified, and, based on this, the relationship between water use and maize productivity was analyzed. Moreover, the optimal LAI was established to determine the reasonable irrigation level and coordinate the relationship between the increase in grain yield and the decrease in water use efficiency.

1. Introduction

Global demand for grain crops is expected to grow rapidly in the coming decades. Maize (Zea mays L.) is the most widely cultivated crop in the global and plays an important role in ensuring food security [1]. Increasing maize production has become more urgent, driven by increased food production, livestock raising, and biofuel production. Many studies have shown that increasing plant densities to optimal levels can simply and effectively increase maize yields [2,3,4]. Typically, the highest maize yields are obtained under optimal plant density or optimal leaf area index (LAI) [5,6,7]. However, the sensitivity of maize grain yield to changes in plant density is greatly depends on water availability during the growth season [8], especially in arid areas, where water scarcity is a major factor limiting crop growth and yield. However, high water use efficiency is the key to the sustainable and stable development of agriculture in arid areas [9].
The LAI is an important indicator in agronomic and environmental studies and can be used for growth monitoring, management optimization, and yield forecasting in crop production [10]. The LAI is a key structural parameter that is closely related to the size of the crop population and grain yield [11,12]. Many studies have attempted to clarify the relationship between the LAI and plant density, grain yield, and canopy structure [6,7,13]. These studies showed that the LAI increases with the increasing of plant density. The optimal plant density can be used to establish an optimum canopy structure and improve maize yield [7]. However, excessive plant density can lead to a high LAI, which can cause self-shading, competition for soil water, fertilizer, and radiation, and possibly yield loss [7,11,14,15]. Additionally, some previous studies have showed that the evapotranspiration differences among different plant densities may result from the LAI differences [16,17]. Crop yield and evapotranspiration determine water use efficiency. Therefore, the optimal LAI may be related to maize yield and water use efficiency.
Water use efficiency (WUE) is defined as the grain yield achieved per unit water consumption. WUE is an important indicator of the water-saving efficiency of irrigated field crops [18,19,20]. WUE can be improved by either reducing the amount of water consumed per unit of grain produced or by increasing the grain yield per unit of water consumed. Some studies have focused on adopting drought-tolerant cultivars [21], mulching techniques such as mulching with different materials (e.g., plastic film, straw) [22,23] and conservation tillage technology [24], and water saving irrigation techniques (e.g., deficit irrigation, drip irrigation under mulch film, optimizing irrigation regime) [25,26,27,28] to improve the grain yield and WUE. However, previous studies have shown that, when WUE reaches a certain level, more water resources are required to further improve grain yield, which makes it difficult to further improve WUE [29,30]. Conversely, efforts to improve the efficient use of water resources make it difficult to maintain high crop yields [31,32]. Overall, it is difficult to simultaneously achieve high yields and high WUE in crops.
Increasing the plant density is an important agronomic measure to increase maize yield [3,28]. However, the response of maize yield to plant density greatly depends on water availability [8,33]. Increasing the plant density has been found to increase the interception of canopy light radiation [7,34]. However, increasing the radiation absorbed by the plant canopy can increase soil water consumption [35], transpiration, and evapotranspiration [36]. Furthermore, it is possible that plant density affects the WUE [15]. However, few studies have systematically reported the effects of different maize plant densities on evapotranspiration or WUE.
Water resource scarcity is a main factor limiting crop production in arid regions of the world [37,38]. At present, irrigation remains an important way to ensure food production, with 40% of the world’s food supply grown on irrigated land [39]. Therefore, it is an important problem to simultaneously improve the yield and WUE of crops in arid regions. As is known to all, increasing plant densities to optimal levels can effectively increase maize yields; however, the ETa of different maize density population is different [40,41,42]. Therefore, the amount of irrigation required may vary for different plant densities. Thus, determining how to obtain the optimal yield and improve WUE is the key to increasing maize yield and water saving in arid areas. Therefore, the objectives of this study were (1) to quantitatively determine the relationships among population LAI, grain yield, and evapotranspiration under different plant densities and irrigation levels and (2) to establish a method for determining the optimal irrigation level and planting density by quantifying the response of maize populations to these parameters in order to achieve a trade-off between maize yield increase and WUE decrease. Our findings provide a theoretical basis and effective measures for improving maize production and WUE in arid regions with different levels of irrigation and also for coping with future water shortages.

2. Materials and Methods

2.1. Experimental Region and Site

A field experiment was conducted at Qitai Farm (Xinjiang, China; 89°46′ E, 43°50′ N; altitude: 1020 m) from April to September in 2016 and 2017. The soil at the experimental site is sandy loam (sand 47.2%, silt 39.2%, and clay 13.6%). In the 0–120 cm soil profile, average bulk density was 1.32 g cm−3, average field capacity was 30.2% (cm3 cm−3), and wilting point was 11.3% (cm3 cm−3). The soil profile contained 14.9 g kg−1 total organic matter, 72.5 mg kg−1 alkaline N, 49.7 mg kg−1 Olsen P, and 99.7 mg kg−1 available K. Soil physical and chemical properties were measured at the beginning of the field experiment.
The region has a temperate arid climate characterized by abundant sunshine during the maize growing season. From 2008 to 2017, the annual mean accumulated solar radiation was 1648 MJ m−2, frost-free duration was 181.6 days, and evaporation was 2176 mm. Meteorological data for the 2016 and 2017 maize growing seasons were obtained from meteorological stations located near the experimental station (Table 1).

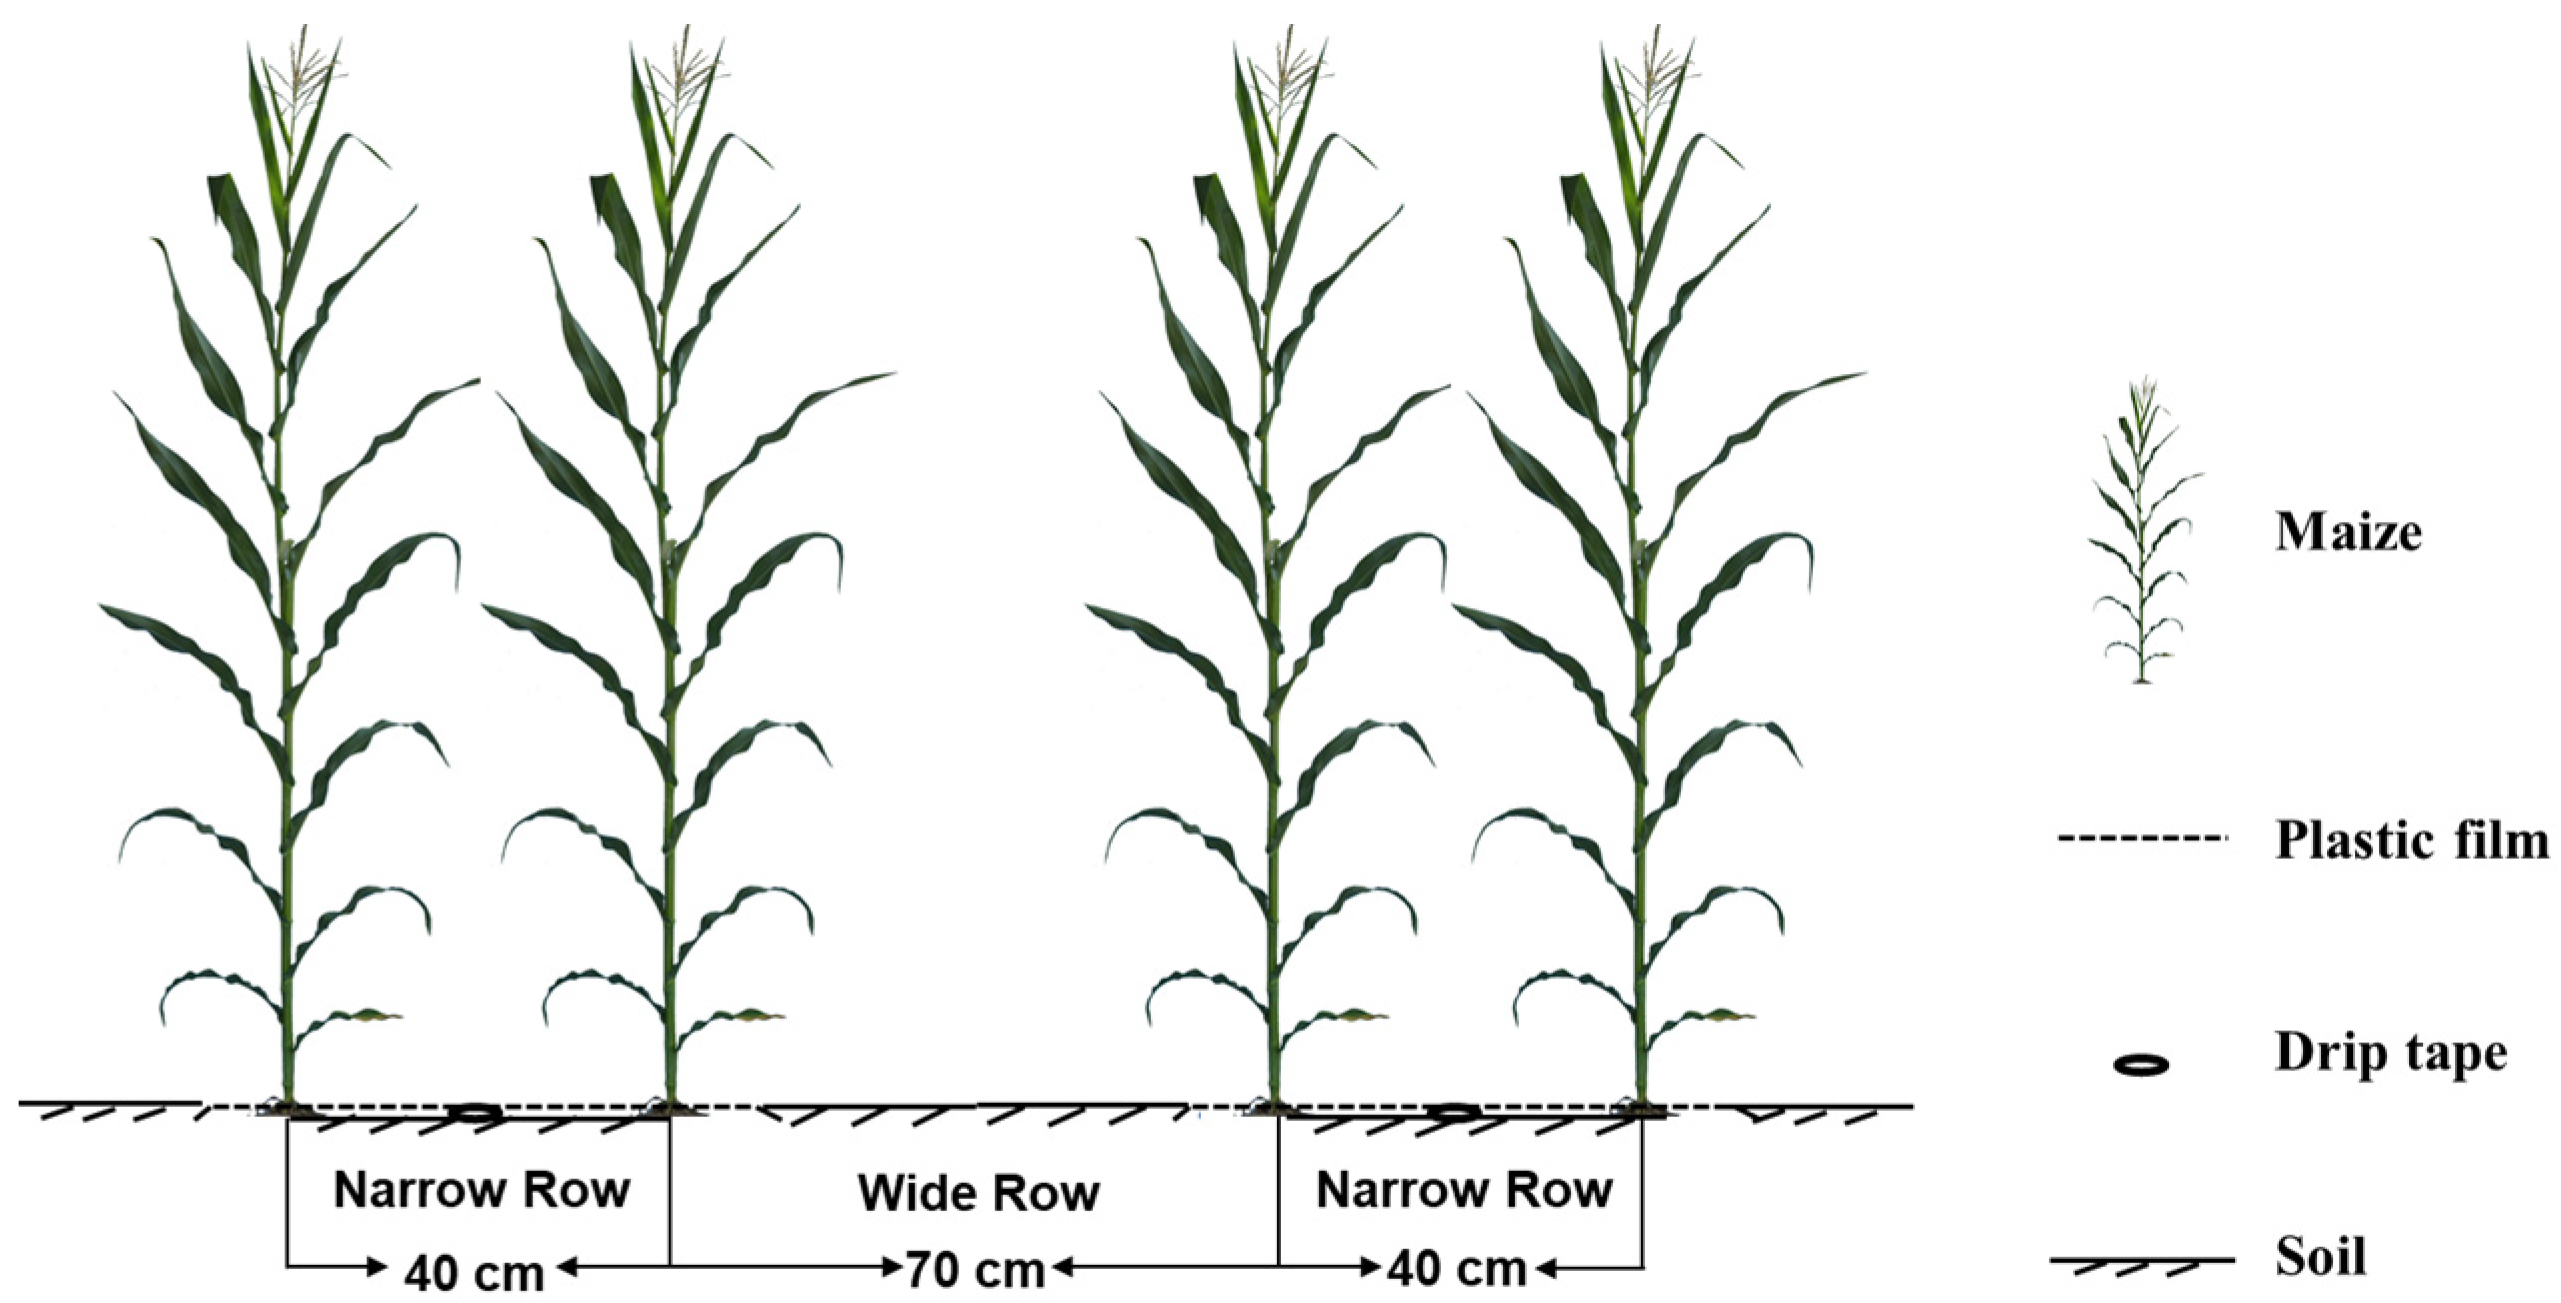
2.2. Experimental Design

Xianyu335 (XY335) is a widely planted maize hybrid grown in China and was used in both years of the experiment. A split-plot experimental design included irrigation level as the main plot factor and plant density as the sub-plot factor. The experiment included three irrigation levels in 2016: 360 mm (W1), 480 mm (W2), and 600 mm (W3) (W3 as farmers’ main irrigation level); and four irrigation levels in 2017: 360 mm (W1), 480 mm (W2), 600 mm (W3), and 720 mm (W4). Four plant densities were included in 2016: 7.5, 10.5, 12.0, and 13.5 plants m−2 (labeled D1, D3, D4 and D5), D1 as farmers’ plant density; and five plant densities were included in 2017: 7.5, 9.0, 10.5, 12.0, and 13.5 plants m−2 (labeled D1, D2, D3, D4, and D5).

2.3. Irrigation System and Agronomic Practices

Maize was sown on 18, 21 April in 2016 and 2017, respectively, and harvested on 18 October in both 2016 and 2017. Plants were seeded in alternating wide and narrow rows patterns (70 + 40 cm) (Figure 1). Before sowing, a joint planter was used to lay drip tapes and plastic film. According to the plants spacing of different planting densities, maize precision seeders (ACME-BZQ, ACME, China) were used to manually sow the seeds to an average depth of 5.0 cm. Seeds were planted along each row and covered with 2.0 cm thin soil. The plastic film was transparent (70 cm wide and 0.01 mm thick; Tianye Inc., Xinjiang, China) was used in both years. The area of each plot was 66 m2 (10 × 6.6 m) and each plot was replicated 3 times. Water movement between plots was prevented by 1.5 m deep water-proof film sheets and 1.0 m wide buffer zones.
Maize was irrigated and fertilized using a drip irrigation system, with irrigation water pumped from groundwater [28]. The drip irrigation system included single wing labyrinth drip tape (Tianye Inc., Xinjiang, China) placed in the middle of each narrow row (Figure 1). Dripper spacing was 30 cm and the flow rate was 3.2 L h−1 at an operating pressure of 0.1 MPa. The system before each irrigation was checked, and, the pressure was kept at 0.1 MPa during the irrigation process to ensure that the irrigation pressure and discharge were stable. The irrigation amount of each plot was controlled by a high-precision water meter (LXS–32F, Ningbo Water Meter Inc., Ningbo, China) and control valve. One day after sowing, the surface soil moisture content (0–20 cm) was 20.3–21.4% before sowing in both years, and 15 mm of water was applied to assure uniform, rapid germination. The rainfall in the growing period was mainly concentrated in the seedling stage, and the rainfall from sowing to irrigation in 2016 and 2017 was 100.2 mm and 89.8 mm, respectively. To hardened seedlings, no irrigation was applied for the first 60 days after sowing. Subsequently, single water applications (38.33, 51.67, 65.0 and 78.33 mm in the W1, W2, W3, and W4 treatments, respectively) were delivered at 9–10 d intervals throughout the whole irrigation period for a total of nine applications.
In the two-year field experiment, fertilizer containing 69 kg N ha−1, 99 kg P ha−1, and 37.5 kg K ha−1 were applied before sowing. An additional 276 kg N ha−1 was applied during the whole irrigation period. All weeds, diseases, and pests in the experimental plots were controlled. Chemical weed (Aiyuyou, Bayer Inc., Leverkusen, Germany) was applied in the V3 period of maize. Pyraclostrobin (BASF Inc., Lutherstadt Wittenberg, Germany) and CORAGEN (Dupont China Inc., Shenzhen, China) were used to control the diseases and pests in the V12 period of maize, respectively.

2.4. Sampling and Measurements

Soil water in 0–120 cm depth was measured with a time-domain reflector (TDR, TRIME-T3, Ettlingen, Germany) with a layer of 20 cm. Three 150-cm-long tubes were deployed under the drip tape in all treatments after sowing. Before sowing and physiological maturity, soil water was measured using the oven-drying method. Samples were collected one day before and after each precipitation and irrigation event.
Maize evapotranspiration (ETa, mm) was calculated during the growing season using the soil water balance equation [28]:
ETa = I + P + Cr − Rf − Dp ± ΔS
where I (mm) was irrigation, P (mm) was precipitation, Cr (mm) was capillary rise, Dp (mm) was percolation, Rf (mm) was runoff, and ΔS (mm) was the change in soil water storage. Cr was zero because the groundwater table was 80 m below the soil surface; Rf was also assumed to be insignificant because the field was flat, and Dp was considered negligible because the soil water content below 120–140 cm did not reach field capacity on any sampling date.
WUE (kg m−3) was represented as grain yield (kg ha−1) per unit of ETa (mm) [29]:
WUE = GY/ETa
where GY is grain yield (kg ha−1) and ETa is total evapotranspiration (mm) calculated from Equation (1).
Leaf area (LA) was measured for five consecutive plants selected from the middle four rows in each plot at the silking stage. The length (L) and maximum leaf width (W) were measured and then LA was calculated according to the formula [11]: LA = 0.75 × L × W; LAI was calculated as the ratio of LA (m2) to land area (m2) using the following formula [11]: LAI = LA/Ground area.
At physiological maturity, the total number of plants and ears were counted. Twenty ears were collected from the middle four rows in each plot and the number of kernels was counted on each ear. Grain yield and grain moisture content of each plot were measured. Grain yield and kernel weight were expressed at 14% moisture, which was measured using a portable moisture meter (PM8188, Kett Electric Lab., Tokyo, Japan).

2.5. Statistical Analysis

Analysis of variance (ANOVA) was used to test for differences in grain yield, kernel number, kernel weight, WUE, ETa, and LAI as a function of irrigation level using SPSS ver. 21.0 (SPSS Inc., Chicago, IL, USA). Graphs were plotted in SigmaPlot (Systat Software, San Jose, CA, USA). Means were compared using Fisher’s least significant difference tests with p < 0.05 (LSD 0.05).

3. Results

3.1. Grain Yield, Kernel Number, Kernel Weight, ETa, and WUE

Grain yield was higher in 2017 than in 2016. This difference in yield may reflect the more numerous rainy days in 2016 and reduced sunshine time during the grain-filling stage (Table 1). Grain yield increased with increasing irrigation level (Table 2). There was no significant difference in grain yield between W3 and W4. For W4, the kernel number per unit area and kernel weight per unit area were maximum for D4, namely 6.3 × 10³ kernels m−2 and 2.31 kg m−2, respectively. For W3, the kernel number per unit area and kernel weight per unit area were also maximum for D4, namely 6.3 × 10³ kernels m−2 and 2.22–2.32 kg m−2, respectively. For W2, the kernel number per unit area and kernel weight per unit area were maximum for D3, namely 5.5 × 10³–5.9 × 10³ kernels m−2 and 2.04–2.13 kg m−2, respectively. For W1, the kernel weight per unit area was also maximum for D3, namely 1.76–1.95 kg m−2. The ETa and LAI (silking) increased significantly as the irrigation level increased and increased significantly as the planting density increased from D1 to D5; for W4, the ETa and LAI were maximum for D5, namely 831.3 mm and 9.6, respectively. WUE increased as irrigation level decreased; WUE first increased and then decreased with plant density. WUE was highest at D3. The combination of W3 and D4 produced the highest maize yield (21.0–21.2 t ha−1), WUE (2.64–2.70 kg m−3), and ETa (784.1–797.8 mm), with a LAI of 8.5–8.7 at silking. Grain yield was significantly affected by year (p < 0.01), irrigation level (p < 0.01), and plant density (p < 0.01) (Table 3). Kernel number and kernel weight per unit area were significantly affected by irrigation (p < 0.01), and plant density (p < 0.01). Significant interactions occurred between ETa and various factors (year, irrigation, plant density) (p < 0.01). WUE and LAI were significantly affected by irrigation (p < 0.01) and plant density (p < 0.01). There was a significant correlation between LAI and kernel number per unit area and kernel weight per unit area, as well as grain yield, whether under irrigation level or plant density (Table 4 and Table 5).

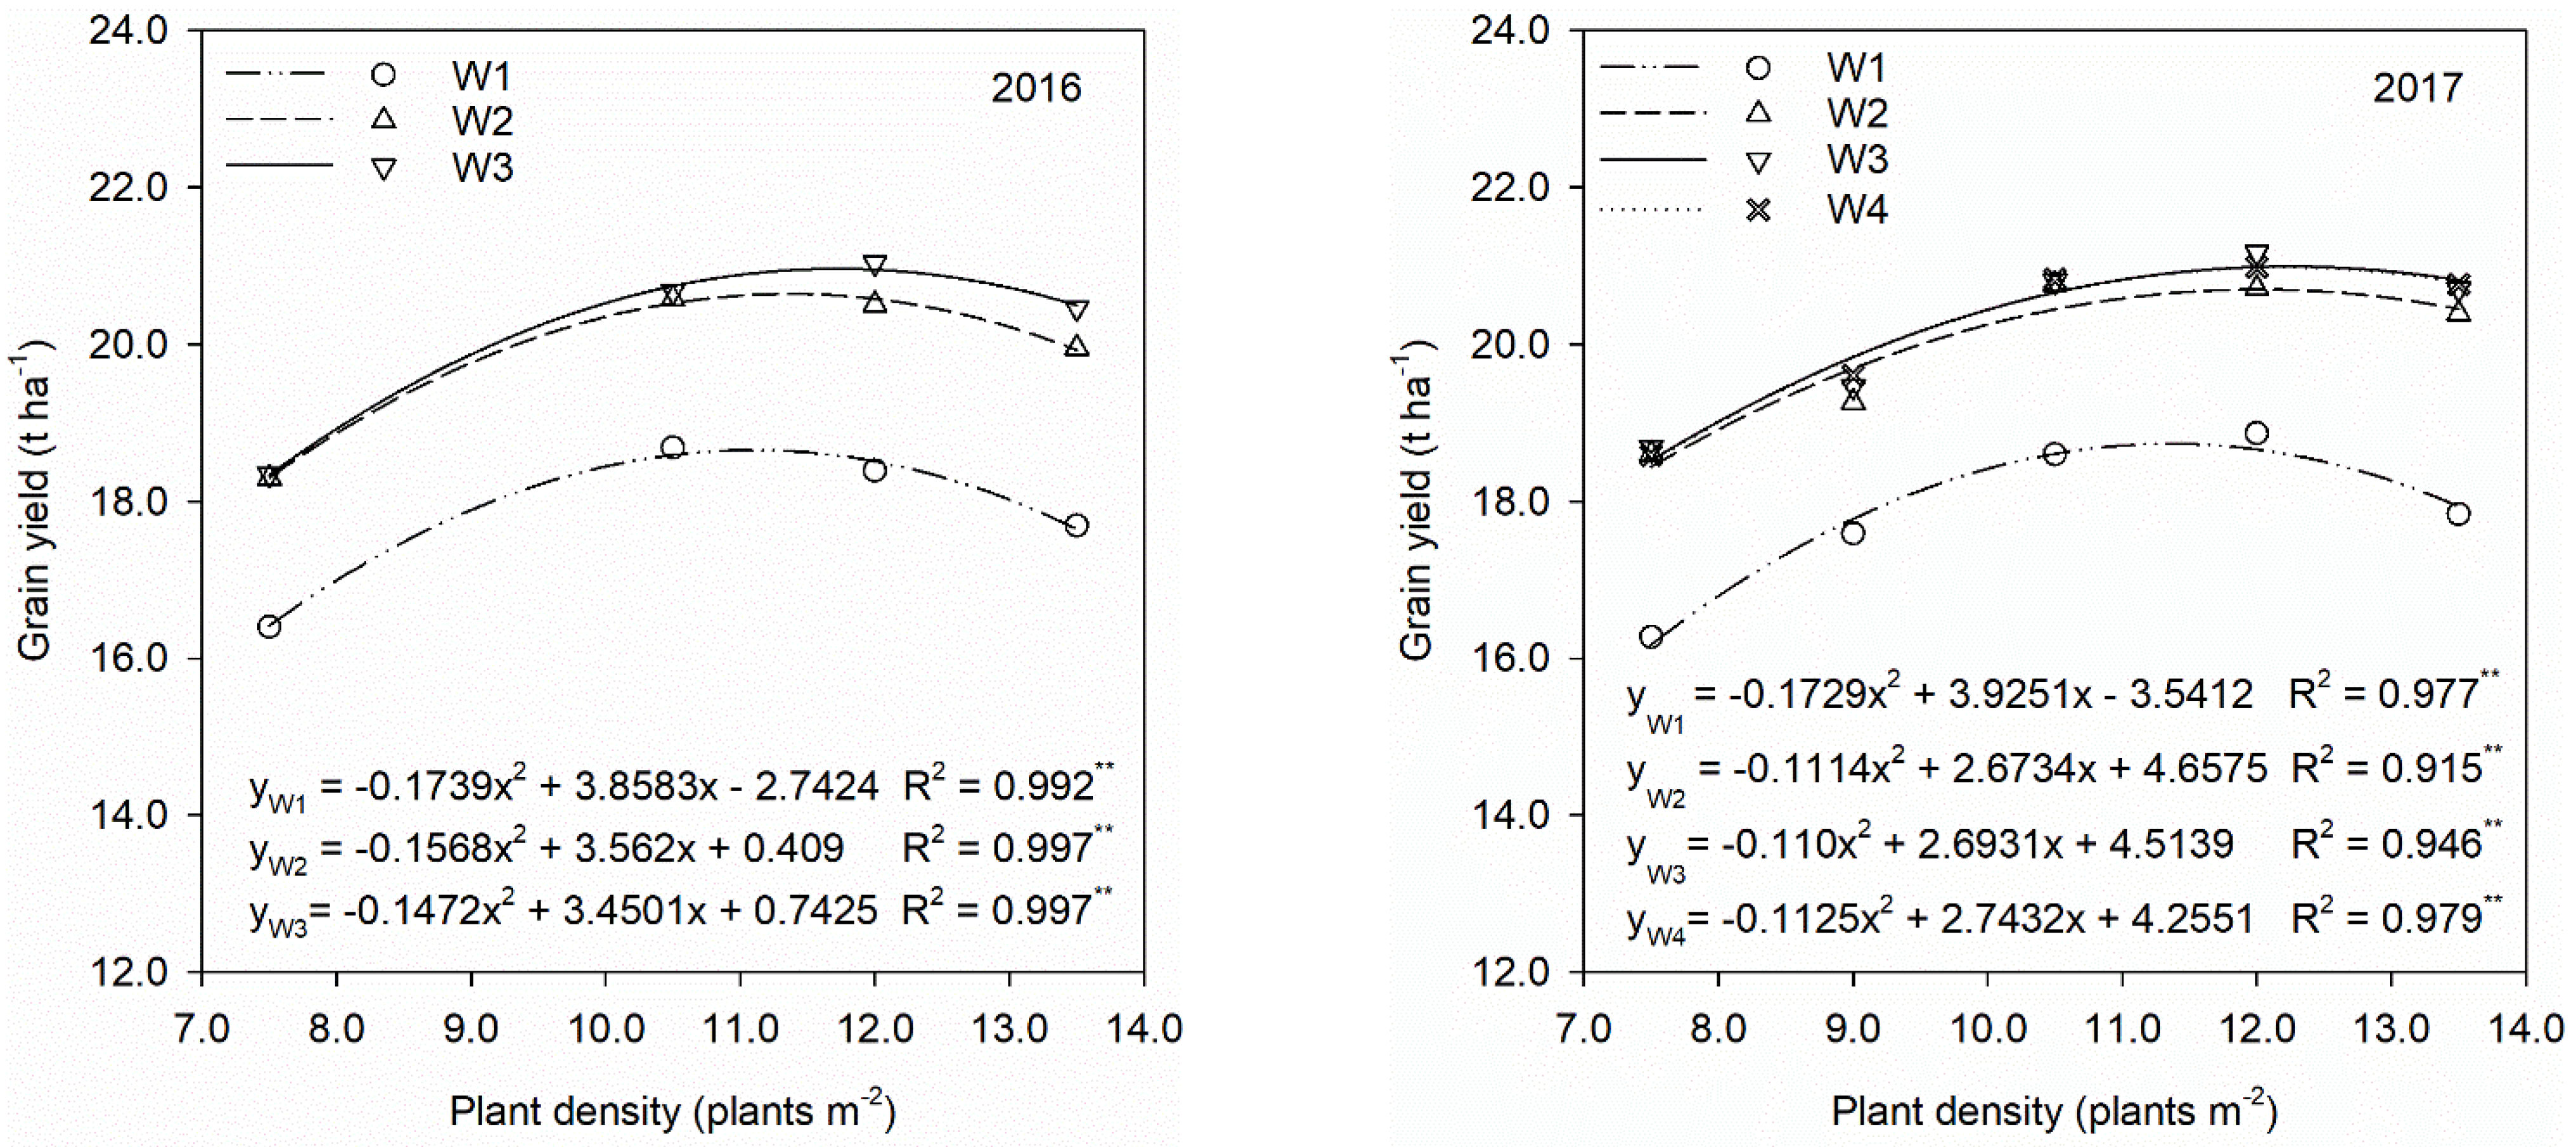
3.2. Relationship between Grain Yield and Plant Density

The relationship between plant density and grain yield under different irrigation levels can be described with a quadratic curve (Figure 2). The optimum density and the density range were determined for different irrigation levels (Table 6). The optimum yield (21.0 t ha−1) occurred in the W3 treatment and corresponded with an optimum density of 12.2 plants m−2. The density range for obtaining the theoretical optimum yield was 11.1–13.3 plants m−2.

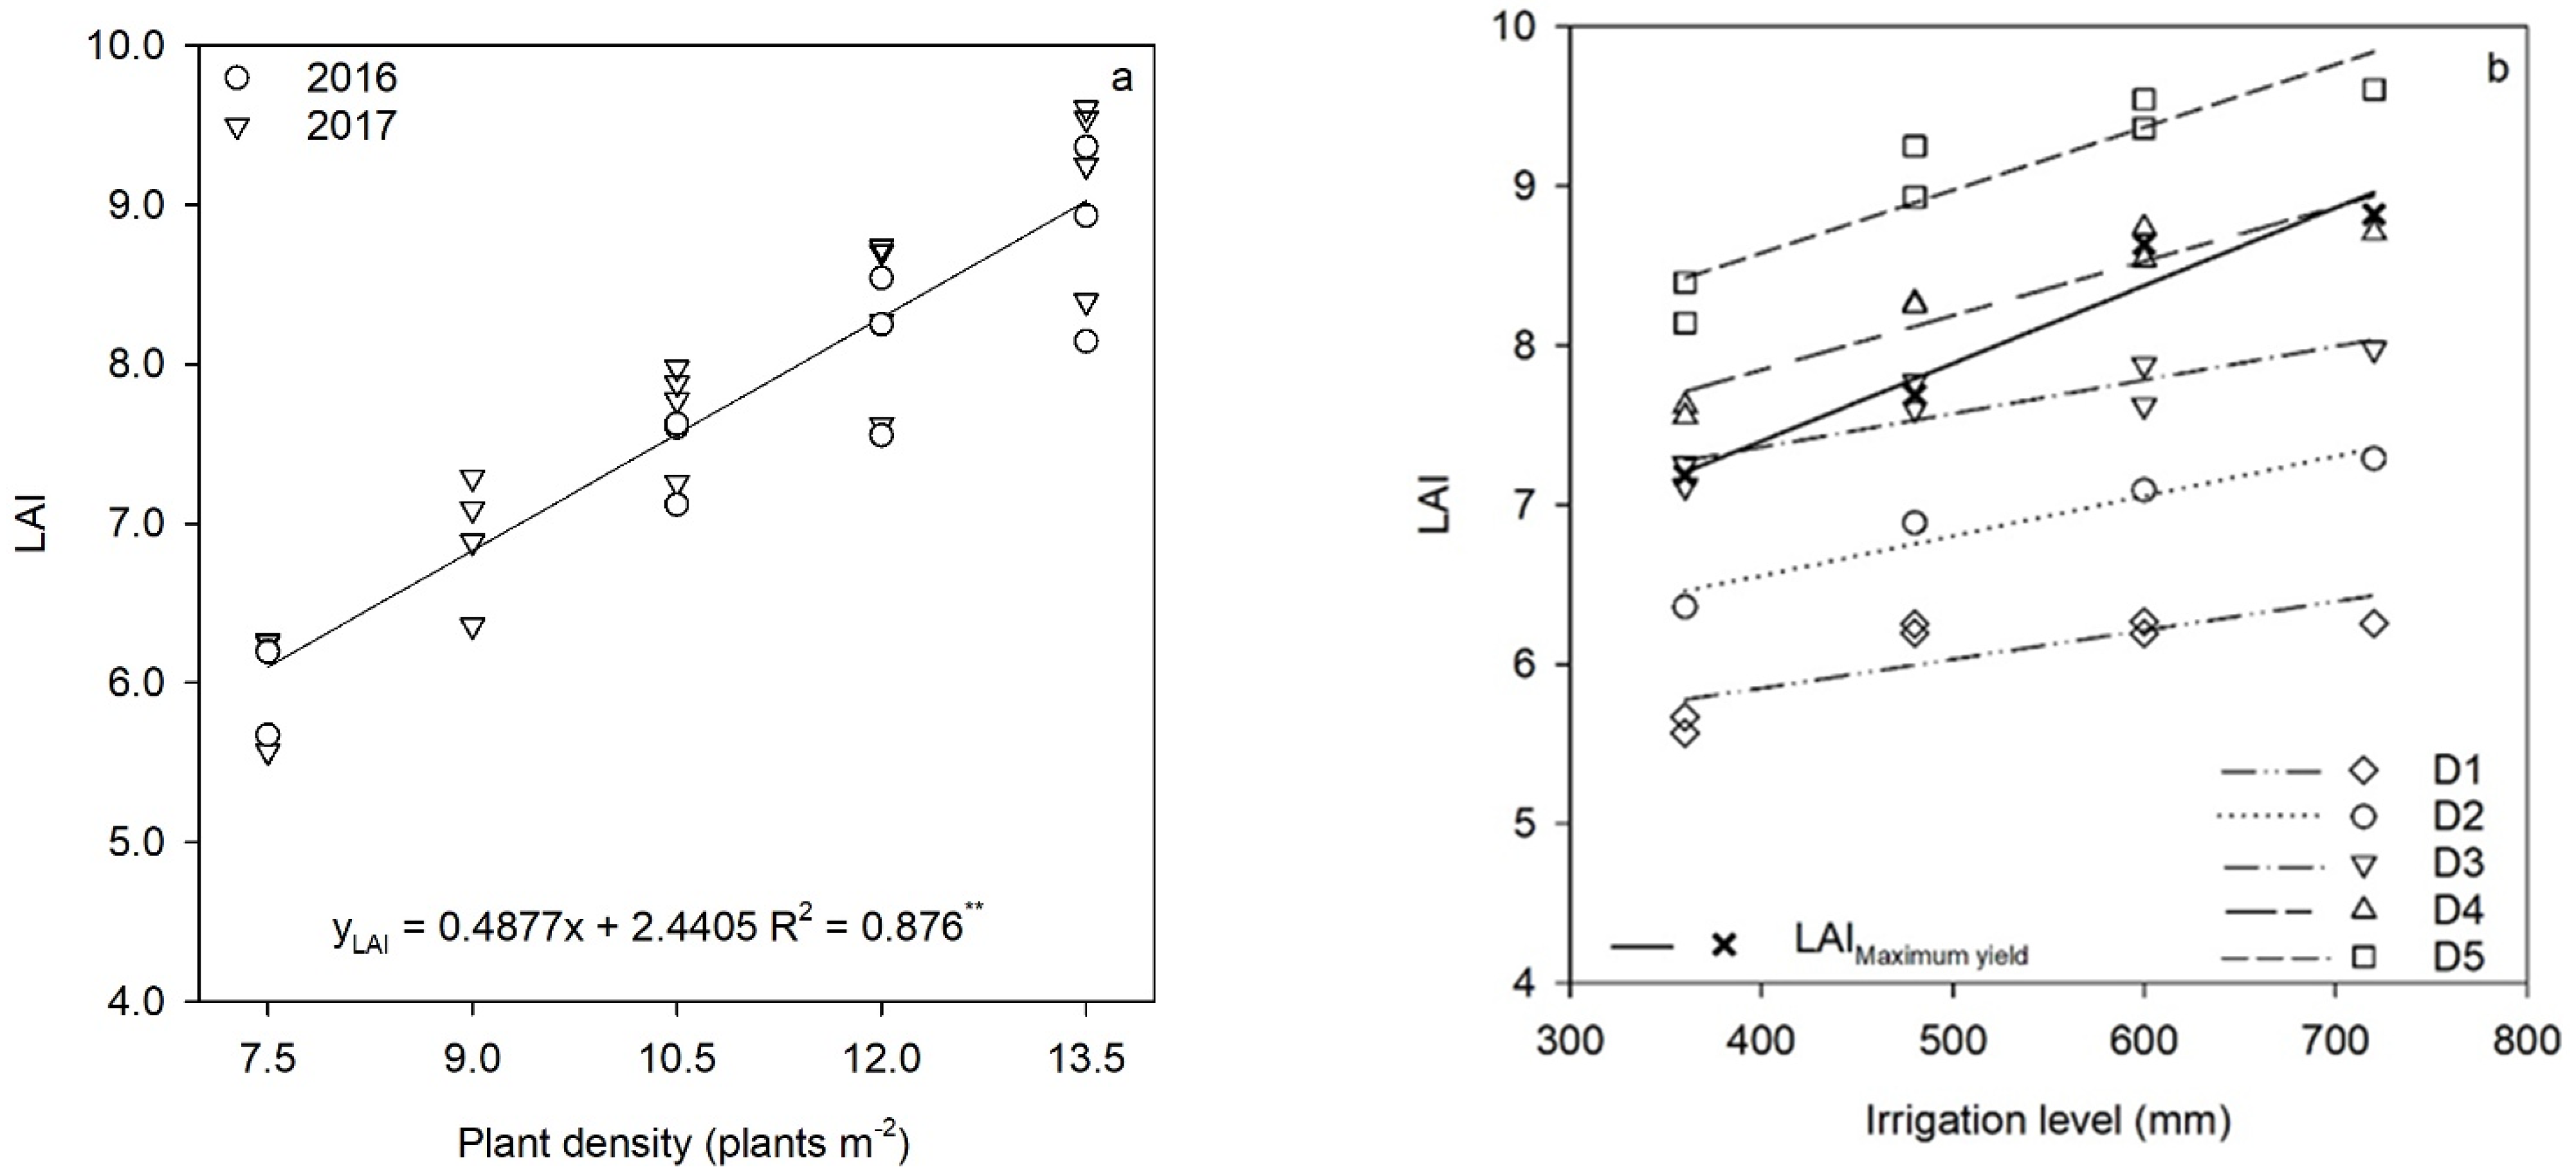
3.3. Relationships between LAI and Plant Density, and LAI and Irrigation Level

The LAI of maize increased with increasing plant density at the silking stage (Figure 3a). LAI also increased with increasing irrigation level. The relationship between LAI and irrigation level can be described by a linear equation (Figure 3b). We found that the LAI that achieved maximum yield and irrigation level could be calculated from a linear equation yMaximum yield-LAI = 0.0046x + 5.584; R2 = 0.916 **. The LAI of the high-density plant (D5) treatment was significantly higher than that of the low-density treatment (D1) and increased significantly with irrigation level.

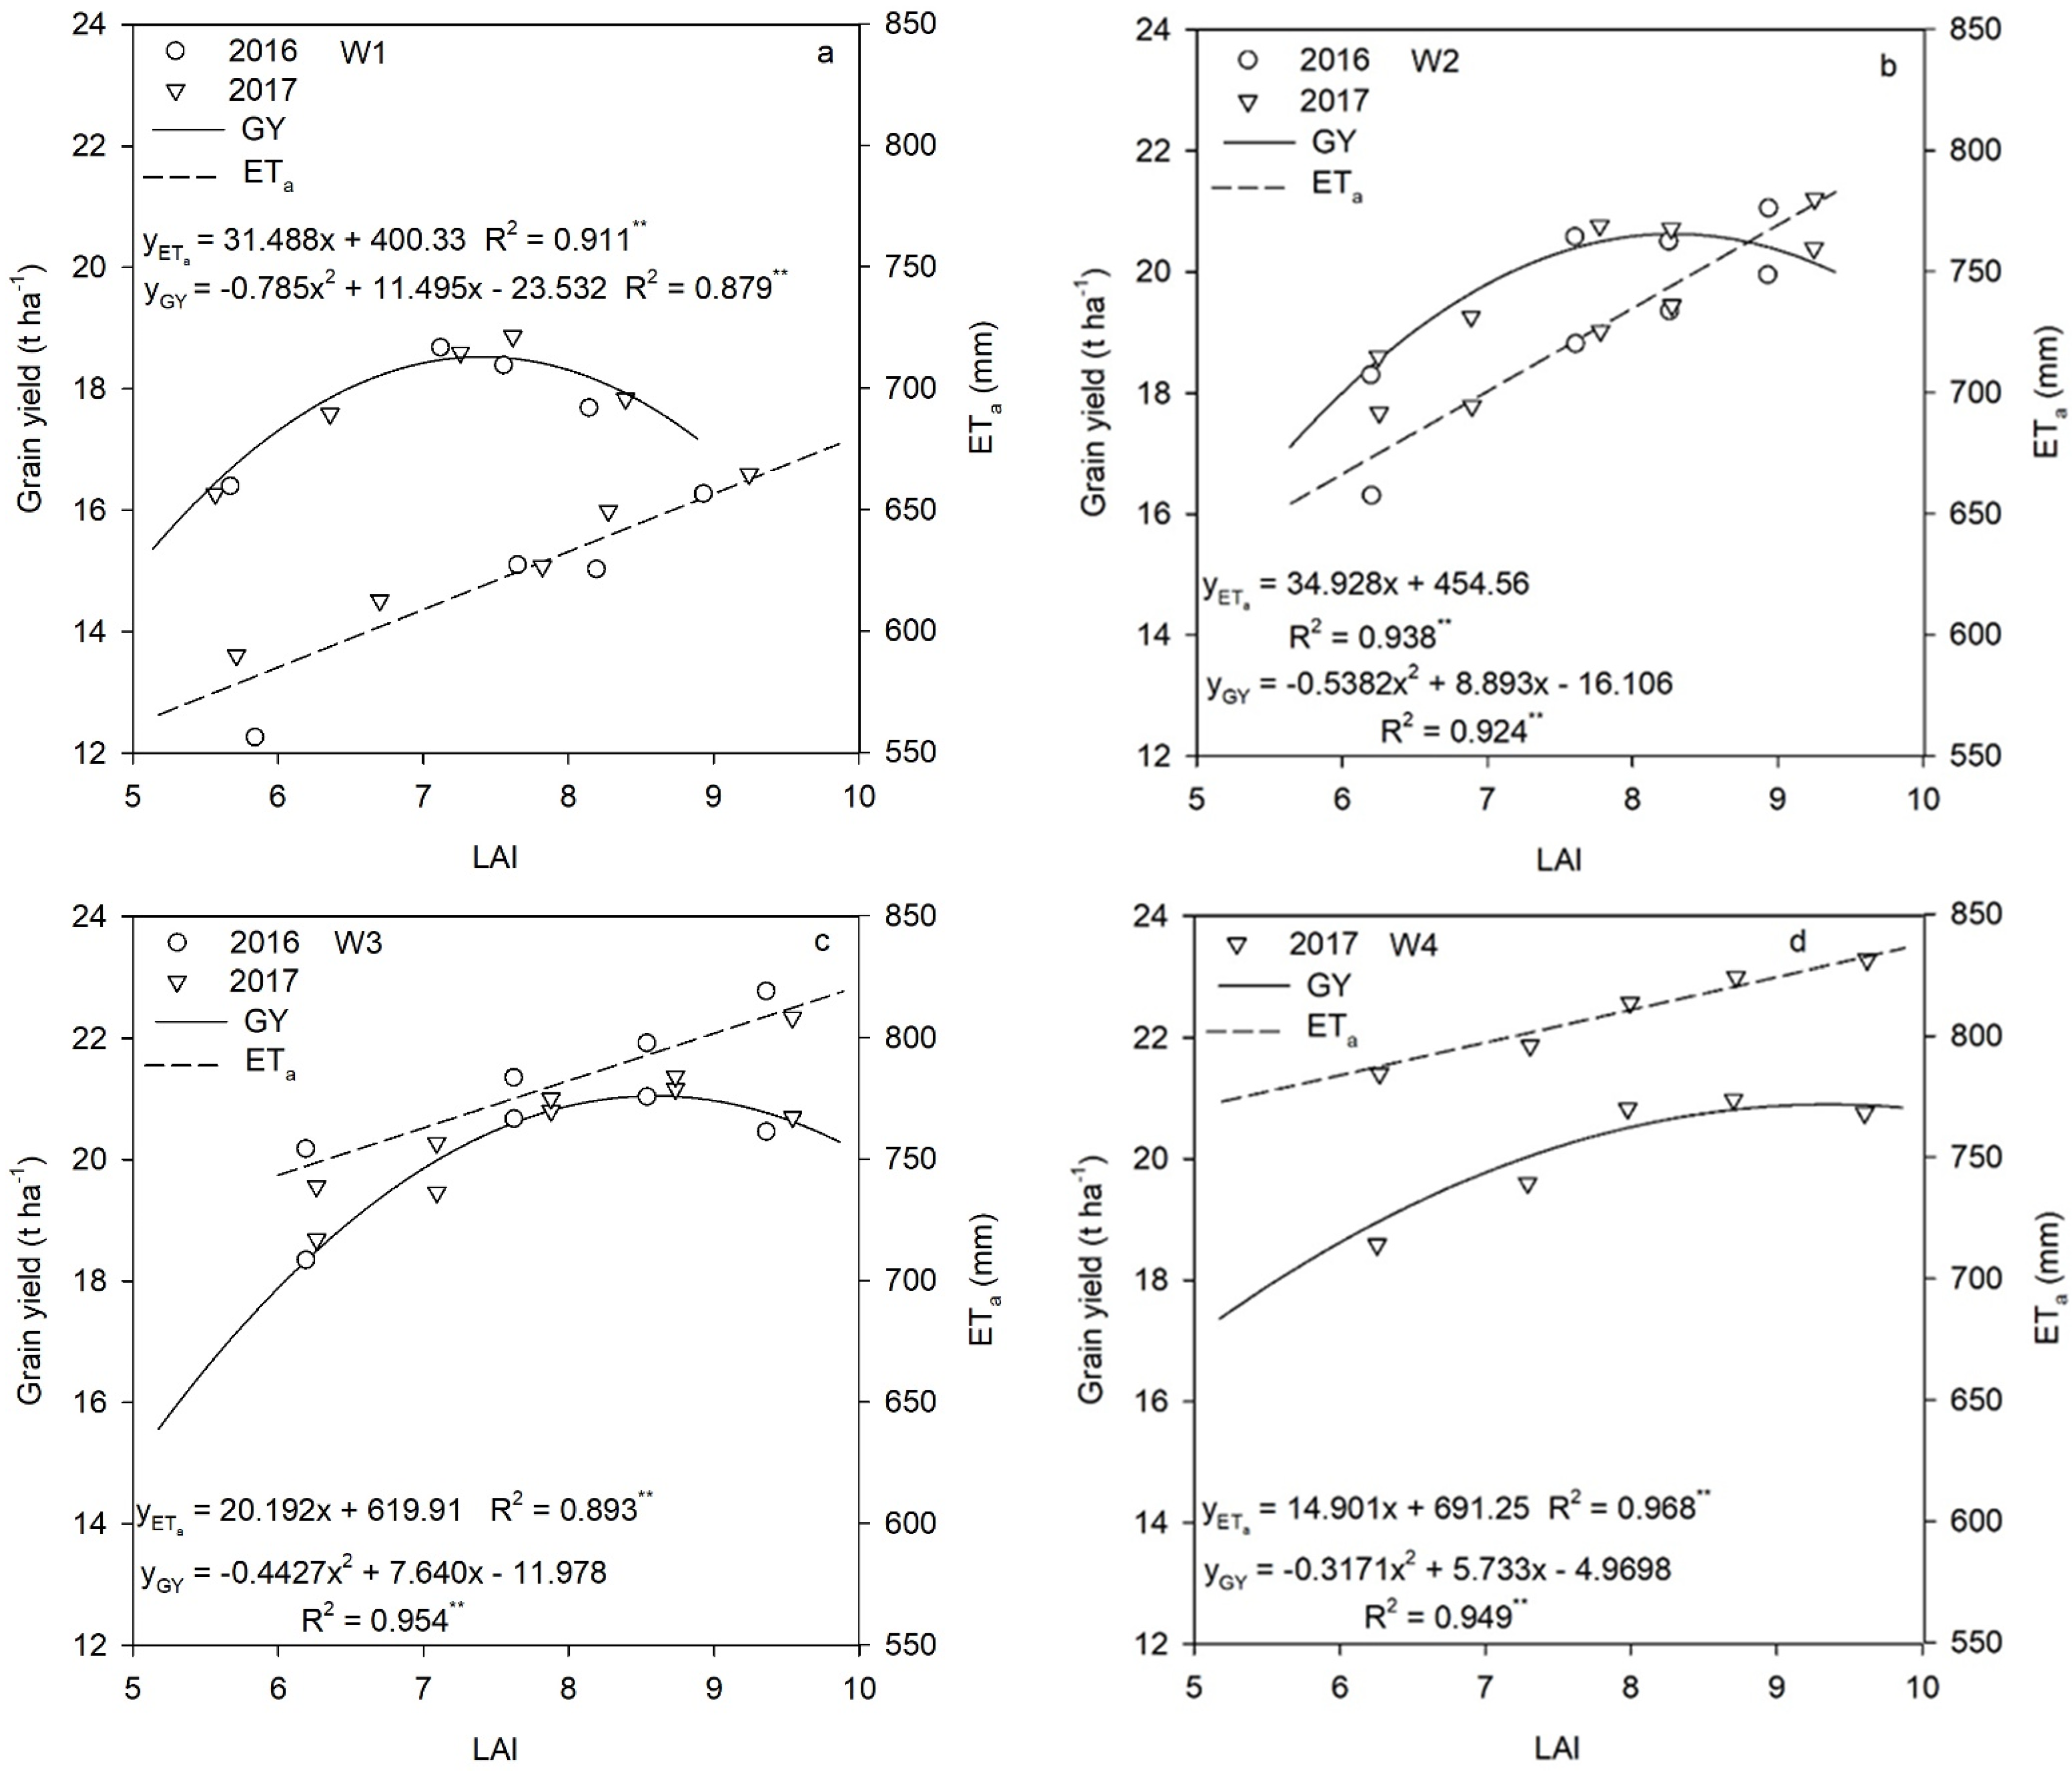
3.4. LAI, Grain Yield, and ETa

The relationship between the grain yield and LAI (at silking) was quadratic and the relationship between LAI and ETa was linear under different levels of irrigation (Figure 4). As irrigation level increased, grain yield and ETa increased with increasing LAI. Optimum LAI and ETa were defined as the point when grain yield was highest. At W1, optimum LAI was 7.33 and optimum ETa was 631.1 mm when the grain yield was 18.6 t ha−1 (Figure 4a); at W2, LAI was 8.26 and ETa was 743.7 mm when the grain yield was 20.6 t ha−1 (Figure 4b); at W3, LAI was 8.63 and ETa was 794.2 mm when the grain yield was 21.0 t ha−1 (Figure 4c); and at W4, LAI was 9.04 and ETa was 826.0 mm when the grain yield was 20.9 t ha−1 (Figure 4d). The optimum WUE was obtained by comparing optimum yield and ETa under different irrigation levels. The results revealed that grain yield decreased when LAI exceeded the optimal value and the corresponding ETa was invalid.

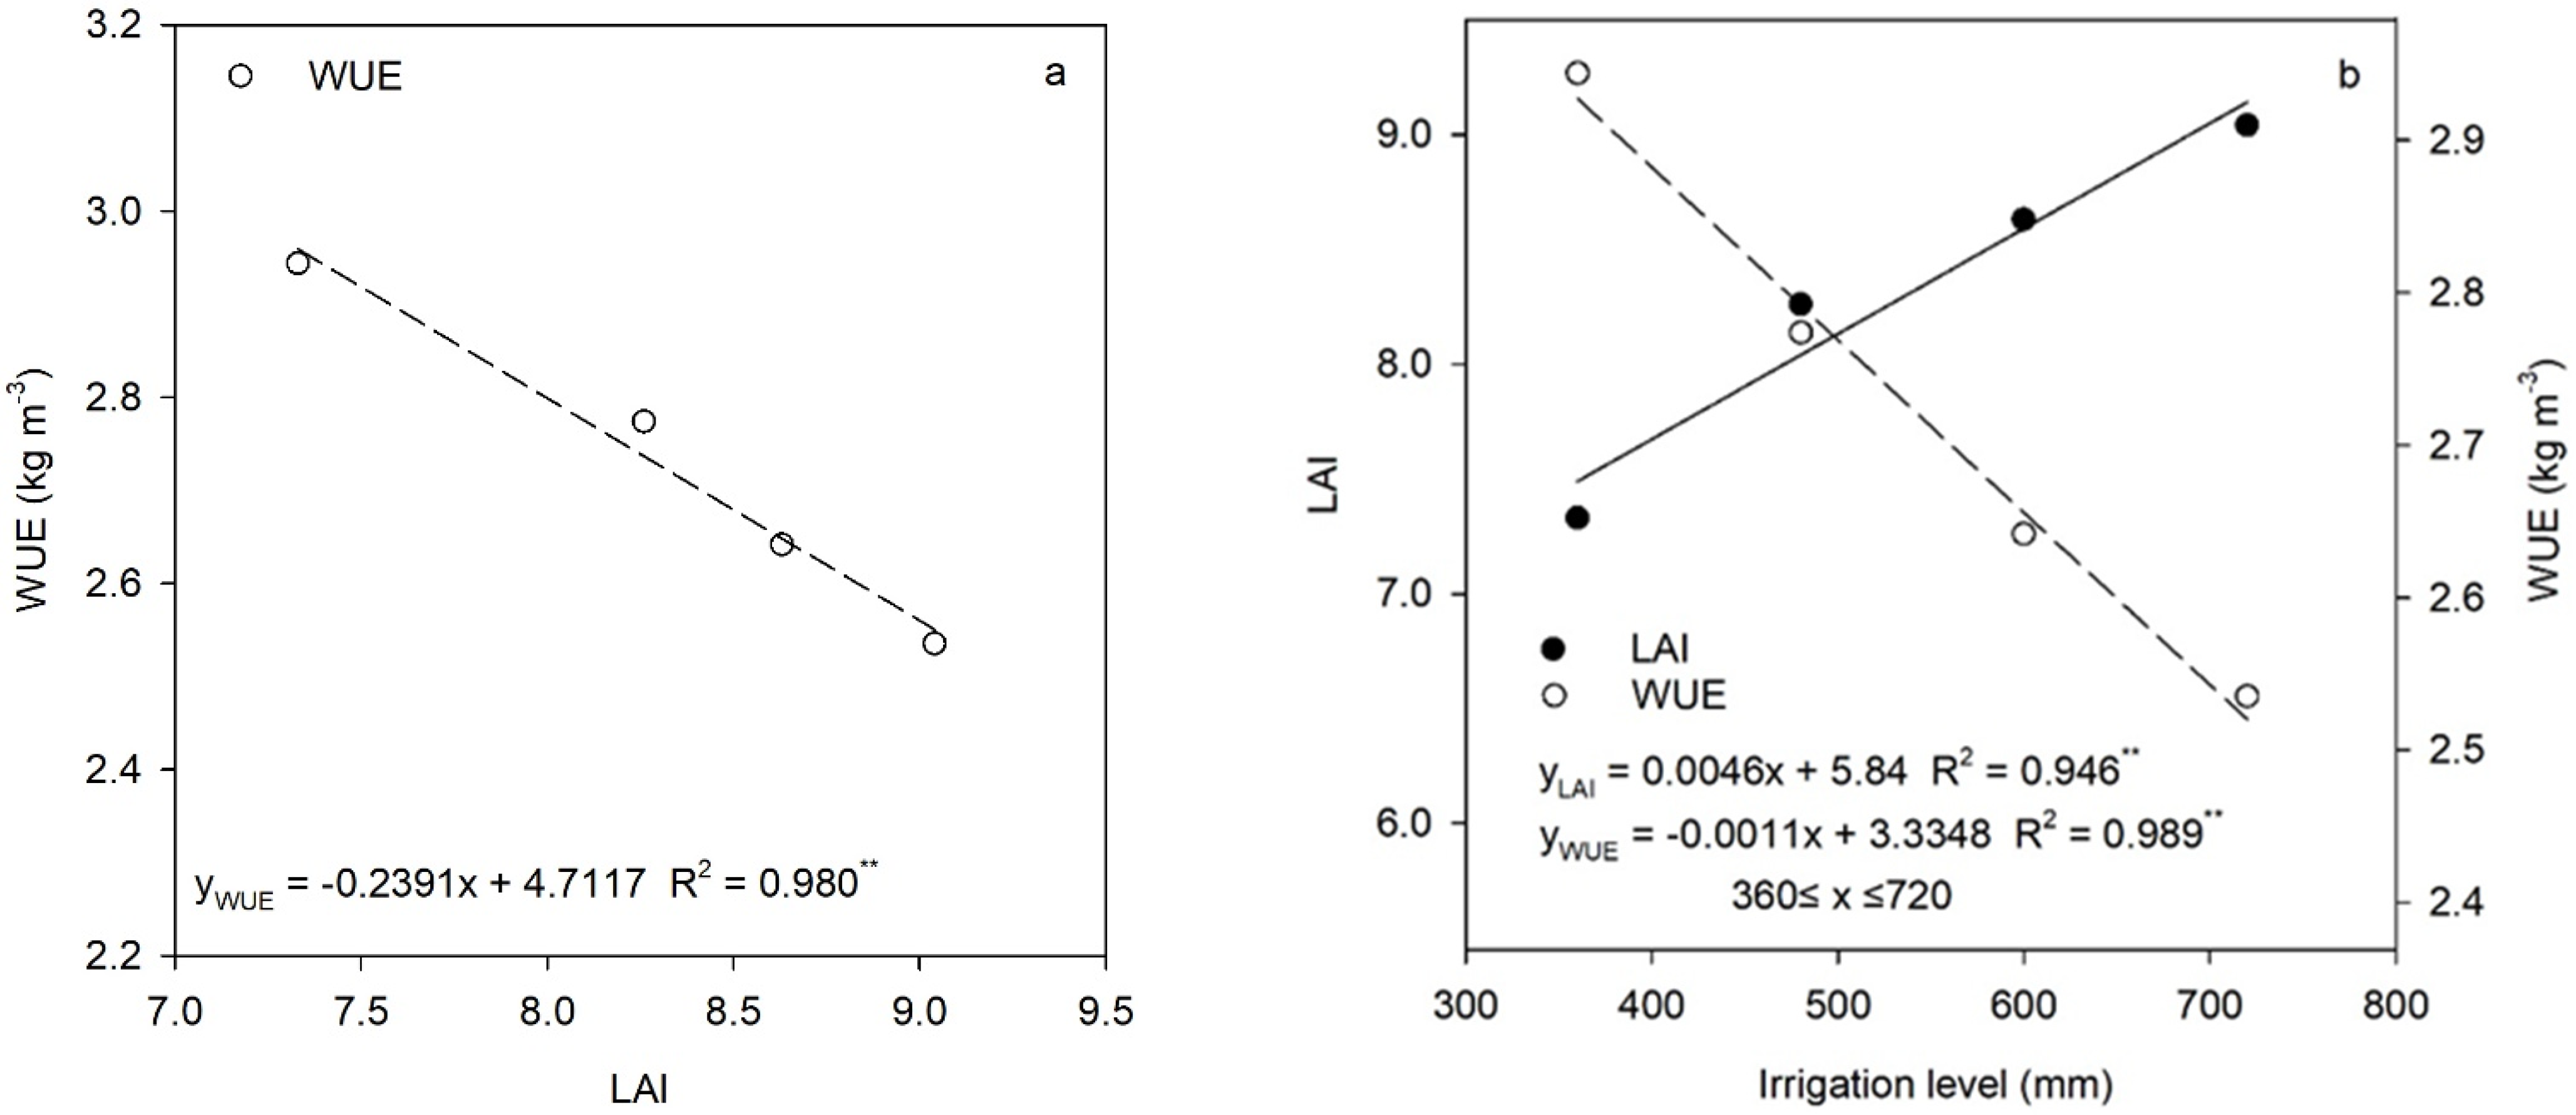
3.5. Theoretical Optimal Irrigation Level, LAI, and WUE

From Figure 5, we obtained WUE corresponding to the optimal LAI under different irrigation levels. We observed a significant linear relationship between optimal LAI and WUE (Figure 5a). Irrigation level displayed a linear relationship with optimal LAI and WUE in the range of 360 mm to 720 mm (Figure 5b). Optimal LAI increased significantly with increasing irrigation level, whereas WUE decreased. The intersection point of the optimal LAI and WUE is the equilibrium point (8.17, 2.77 kg m−3), and the corresponding irrigation level can be used as a reference value for the appropriate irrigation amount.

4. Discussion

4.1. The Balance between Agricultural Production and Its Environmental Impacts

In order to increase maize production, plant densities are usually increased, but this requires an increase in irrigation water inputs. In arid areas, water resources are scarce and the minimal rainfall, high evaporation, but abundant sunshine could be conductive to high yields. Farmers compensate for crop water shortage by using high levels of irrigation to achieve higher yields. However, these practices can cause incalculable environmental harm. Therefore, the balance between irrigation inputs and an increased density and yield of maize crops needs to be analyzed quantitatively. LAI is an important indicator of crop population productivity because it connects yield potential and evapotranspiration [7,43] and correlates positively with ETa in the absence of water stress [44,45]. In this study, we used LAI to characterize the size of the maize population. To an extent, LAI can reflect the total leaf area and the number of stomata in a crop [46]. Studies have shown that the amount of solar radiation intercepted by the plant canopy increases with increasing LAI [47], solar radiation drives energy balance, thereby affecting crop transpiration and evapotranspiration, LAI is closely related to solar radiation and evapotranspiration [48]. In this study, we found that ETa increased with rising LAI, similar to the findings of Liu et al. [41] and Wang et al. [40]. In addition, we found that ETa increased as irrigation levels increased (Figure 4), which was similar to the results of previous study [49]. In this study, maize with a large LAI exhibited high ETa under high irrigation levels (Figure 4d). The main reasons may be that ETa is closely related to LAI. From sowing to the seedling stage, most ETa comprises evaporation from the bare soil surface, while at full crop cover more than 90% of ETa comes from crop transpiration [50,51]. In addition, as LAI increases, the ability of crops to transfer water from soil to leaves increases and thus transpiration and ETa increase [36]. However, excessive LAI causes excessive transpiration and ETa [35]. Therefore, the optimum LAI of maize was obtained by matching plant density with irrigation level in this ecological environment, it can effectively use light radiation, reduce ETa, save irrigation water, protect water resources, and increase grain yield and WUE.

4.2. Effects of Density and Irrigation on Grain Yield

Optimum plant density is the most effective measures for establishing an optimum canopy structure and attaining high yield [7,50,52]. An optimum LAI is the basis for increasing light utilization efficiency and for obtaining high grain yield [11]. Furthermore, LAI reflects the water conveying capacity of vegetation or canopy structure [53]. Previous reports found that an optimum LAI at the silking stage determined grain yield [11,54]. The current study shows that LAI increased with increasing plant density and irrigation level (Figure 3) and that grain yield and LAI displayed a quadratic relationship (Figure 4). These results are consistent with previous studies [6,7,12,41,55,56]. However, the relationship between LAI and ETa was linear, increasing LAI also increases evapotranspiration (ETa) [40,57,58]. That is to say, a small LAI will intercept low levels of solar radiation that are not conducive to improving crop photosynthetic capacity and grain yield. A large crop LAI improves the amount of solar radiation intercepted, increases photosynthetic area, increases grain yield, and reduces soil water evaporation [40], but an LAI that is too large leads to excessive ETa [59] and causes self-shading and reduced the photosynthesis of leaves, resulting in the loss of yield and the decrease of WUE [14]. Therefore, an optimal plant density and LAI can simultaneously improve WUE and grain yield. Our experiments were carried out using drip irrigation under plastic film mulch in Xinjiang. The region experiences low rainfall, a dry climate, and relatively abundant light and heat resources. Therefore, maize has the potential for high yields, but the demand for water is higher than in other regions. Our results apply to this region of study and other regions with similar cultivation and climate conditions as conditions of plant density and irrigation in other regions may vary.

4.3. Ways to Increase Grain Yield and Production Efficiency in the Future

This study provides guidance for improving crop yields and optimizing resource utilization efficiency in irrigated agricultural areas. Achieving an optimal LAI depends on implementing an optimal plant density. Optimal plant densities are those that match local solar radiation availability and can improve grain yields [2,5,60]. In addition, high grain yields require optimal irrigation levels, which display a quadratic relationship with each other [26,31,45]. Moreover, grain yields sometimes vary at different irrigation levels within the same plant density. In other words, different irrigation levels have different optimum plant densities. Improvements in WUE are closely related to achieving optimal plant density (LAI) and irrigation level (ETa). In our study, at different irrigation levels, the LAI corresponding to the highest yielding plant density was the optimal LAI and the optimal ETa. The ratio of the highest yield to the optimal ETa is the theoretical optimal WUE. Therefore, the determination of maize irrigation level can be based on the LAI of the target population. Optimizing crop productivity (LAI) and ETa can further improve WUE. Under conditions of limited irrigation, it is necessary to select drought resistant and high-yield maize varieties suited to the local environment, implement reasonably close plant densities, construct an ideal population structure, and improve the utilization rate of light energy. In addition to efficient water-saving irrigation technologies (e.g., drip irrigation, drip irrigation under plastic film mulch, water and fertilizer integration), irrigation systems should be optimized to deliver the precise amount of water that a crop demands, to reduce water consumption, and to improve crop yield and WUE. As climate change brings warmer and drier climates and increasingly uneven precipitation distribution, the problems faced in rain fed agriculture become more prominent. Studying changes in crop yields under varying conditions of plant densities and irrigation in different regions can be used to conserve water use, optimize plant technologies, and improve resource utilization efficiency.
A shortcoming of the current study is that we used a single maize hybrid for only two seasons and with a fixed amount of irrigation in a single region. Different maize hybrids have different plant density tolerances and may respond differently in different regions. However, this study focused on improving maize yields and WUE by optimizing crop productivity (LAI) and ETa. This idea and method can be applied to crops or regions universally. In future studies, in order to reduce evaporation and further improve WUE, we will explore water requirement regulation in maize, combining irrigation with a crop population’s demand for water, and distinguishing between soil evaporation and transpiration in total ETa during growth.

5. Conclusions

Through the analysis of the relationship between planting density and LAI, grain yield, and evapotranspiration under different irrigation levels, it was found that increasing the planting density and the irrigation level could both significantly increase the LAI and that both had a linear relationship with the LAI. However, LAI expansion significantly increased evapotranspiration, which was the key factor behind the increase in the water consumption of maize under irrigation. However, the effects of increasing the planting density and irrigation level on yield were not linear. Therefore, the irrigation level and planting density have a reasonable range of optimization. The relationships between the LAI and grain yield and evapotranspiration were quantified for different planting densities, and, based on this, the relationship between water use and maize productivity was analyzed. The optimal LAI was established to determine the reasonable irrigation level and coordinate the relationship between the increase in grain yield and the decrease in water use efficiency.

Author Contributions

Conceptualization, G.Z., K.W., R.X., and S.L.; methodology, B.M. and J.X.; software, G.Z. and D.S.; validation, B.M., R.X., and P.H.; formal analysis, B.M.; investigation, G.Z. and D.S.; resources, S.L.; data curation, G.Z. and D.S.; writing—original draft preparation, G.Z.; writing—review and editing, G.Z. and B.M.; visualization, G.Z.; supervision, B.M.; project administration, J.X., P.H., and S.L.; funding acquisition, J.X., P.H., and S.L. All authors have read and agreed to the published version of the manuscript.

Funding

This research was supported by the National Key Research and Development Program of China (Grant Nos. 2018YFD0100206, 2016YFD0300110, 2016YFD0300101), the China Agriculture Research System (CARS-02-25), and the Agricultural Science and Technology Innovation Project of Chinese Academy of Agricultural Sciences.

Data Availability Statement

The data presented in this study are available on request from the corresponding author.

Acknowledgments

The authors are also grateful to Jianglu Chen and Zhewen Liu for help with data investigation.

Conflicts of Interest

The authors declare no conflict of interest.

References

  1. Li, S.K.; Zhao, J.R.; Dong, S.T.; Zhao, M.; Li, C.H.; Cui, Y.H.; Liu, Y.H.; Gao, J.L.; Xue, J.Q.; Wang, L.C.; et al. Advances and Prospects of Maize Cultivation in China. Sci. Agric. Sin. 2017, 50, 1941–1959. [Google Scholar]
  2. Tollenaar, M.; Lee, E.A. Yield potential, yield stability and stress tolerance in maize. Field Crops Res. 2002, 75, 161–169. [Google Scholar] [CrossRef]
  3. Grassini, P.; Thorburn, J.; Burr, C.; Cassman, K.G. High–yield irrigated maize in the Western U.S. Corn Belt: I. On–farm yield, yield potential, and impact of agronomic practices. Field Crops Res. 2011, 120, 142–150. [Google Scholar] [CrossRef] [Green Version]
  4. Brekke, B.; Edwards, J.; Knapp, A. Selection and adaptation to high plant density in the Iowa Stiff Stalk Synthetic maize (Zea mays L.) population. Crop Sci. 2011, 51, 1965–1967. [Google Scholar] [CrossRef]
  5. Sangoi, L.; Gracietti, M.A.; Rampazzo, C.; Bianchetti, P. Response of Brazilian maize hybrids from different ears to changes in plant density. Field Crops Res. 2002, 79, 39–51. [Google Scholar] [CrossRef]
  6. Li, J.; Xie, R.Z.; Wang, K.R.; Ming, B.; Guo, Y.Q.; Zhang, G.Q.; Li, S.K. Variations in maize dry matter, harvest index, and grain yield with plant density. Agron. J. 2015, 107, 829–834. [Google Scholar] [CrossRef]
  7. Li, J.; Xie, R.Z.; Wang, K.R.; Hou, P.; Ming, B.; Zhang, G.Q.; Liu, G.Z.; Wu, M.; Yang, Z.S.; Li, S.K. Response of canopy structure, light interception and grain yield to plant density in maize. J. Agr. Sci. 2018, 156, 785–794. [Google Scholar] [CrossRef]
  8. Hammer, G.L.; Dong, Z.; McLean, G.; Doherty, A.; Messina, C.; Schussler, J.; Zinselmeier, C.; Paszkiewicz, S.; Cooper, M. Can changes in canopy and/or root system architecture explain historical maize yield trends in the U.S. Corn Belt? Crop Sci. 2009, 49, 299–312. [Google Scholar] [CrossRef]
  9. Kang, S.Z.; Hao, X.M.; Du, T.S.; Tong, L.; Su, X.L.; Lu, H.N.; Li, X.L.; Huo, Z.L.; Li, S.E.; Ding, R.S. Improving agricultural water productivity to ensure food security in China under changing environment: From research to practice. Agric. Water Manag. 2017, 179, 5–17. [Google Scholar] [CrossRef]
  10. Ata-Ul-Karim, S.T.; Zhu, Y.; Yao, X.; Cao, W. Determination of critical nitrogen dilution curve based on leaf area index in rice. Field Crops Rese. 2014, 167, 76–85. [Google Scholar] [CrossRef]
  11. Xu, W.J.; Liu, C.W.; Wang, K.R.; Xie, R.Z.; Ming, B.; Wang, Y.H.; Zhang, G.Q.; Liu, G.Z.; Zhao, R.L.; Fan, P.P.; et al. Adjusting maize plant density to different climatic conditions across a large longitudinal distance in China. Field Crops Res. 2017, 212, 126–134. [Google Scholar] [CrossRef]
  12. Eldaw Elwadie, M.; Pierce, F.J.; Qi, J. Remote sensing of canopy dynamics and biophysical variables estimation of corn in Michigan. Agron. J. 2005, 97, 99–105. [Google Scholar] [CrossRef]
  13. Tetio–Kagho, F.; Gardner, F.P. Responses of maize to plant population density. I. Canopy development, light relationships, and vegetative growth. Agron. J. 1988, 80, 930–935. [Google Scholar] [CrossRef]
  14. Srinivasan, V.; Kumar, P.; Long, S.P. Decreasing, not increasing, leaf area will raise crop yields under global atmospheric change. Glob. Change Biol. 2017, 23, 1626–1635. [Google Scholar] [CrossRef] [Green Version]
  15. Jia, Q.M.; Sun, L.F.; Wang, J.J.; Li, J.; Ali, S.; Liu, T.N.; Zhang, P.; Lian, Y.H.; Ding, R.X.; Ren, X.L.; et al. Effect of plant density and pattern on maize yield and rainwater use efficiency in the Loess Plateau in China. Agric. Water Manag. 2018, 202, 19–32. [Google Scholar] [CrossRef]
  16. Yan, H.; Wang, S.Q.; Billesbach, D.; Oechel, W.; Zhang, J.H.; Meyers, T.; Martin, T.A.; Matamala, R.; Baldocchi, D.; Bohrer, G.; et al. Global estimation of evapotranspiration using a leaf area index-based surface energy and water balance model. Remote Sens Environ. 2012, 124, 581–595. [Google Scholar] [CrossRef] [Green Version]
  17. Jiang, X.L.; Kang, S.Z.; Tong, L.; Li, F.S.; Li, D.H.; Ding, R.S.; Qiu, R.J. Crop coefficient and evapotranspiration of grain maize modified by plant density in an arid region of northwest China. Agric. Water Manag. 2014, 142, 135–143. [Google Scholar] [CrossRef]
  18. Wallace, J.S. Increasing agricultural water use efficiency to meet future food production. Agric. Ecosyst. Environ. 2002, 82, 105–119. [Google Scholar] [CrossRef]
  19. Howell, T.A. Enhancing Water Use Efficiency in Irrigated Agriculture. Agron. J. 2001, 93, 281–289. [Google Scholar] [CrossRef] [Green Version]
  20. Zhang, G.Q.; Shen, D.P.; Ming, B.; Xie, R.Z.; Jin, X.L.; Liu, C.W.; Hou, P.; Xue, J.; Chen, J.L.; Zhang, W.X.; et al. Using irrigation intervals to optimize water-use efficiency and maize yield in Xinjiang, northwest China. Crop J. 2019, 7, 322–334. [Google Scholar] [CrossRef]
  21. Zhao, J.; Xue, Q.; Jessup, K.E.; Hao, B.; Hou, X.; Marek, T.H.; Xu, W.; Evett, S.R.; O’Shaughnessy, S.A.; Brauer, D.K. Yield and water use of drought–tolerant maize hybrids in a semiarid environment. Field Crops Res. 2018, 216, 1–9. [Google Scholar] [CrossRef]
  22. Sun, D.B.; Li, H.G.; Wang, E.L.; He, W.Q.; Hao, W.P.; Yan, C.R.; Li, Y.Z.; Mei, X.R.; Zhang, Y.Q.; Sun, Z.X.; et al. An overview of the use of plastic–film mulching in China to increase crop yield and water–use efficiency. Natl. Sci. Rev. 2020, 7, 1523–1526. [Google Scholar] [CrossRef]
  23. Zheng, J.; Fan, J.L.; Zhang, F.C.; Zhuang, Q.L. Evapotranspiration partitioning and water productivity of rainfed maize under contrasting mulching conditions in Northwest China. Agric. Water Manag. 2021, 243, 106473. [Google Scholar] [CrossRef]
  24. Sun, L.; Wang, S.L.; Zhang, Y.J.; Li, J.; Wang, X.L.; Wang, R.; Lyu, W.; Chen, N.N.; Wang, Q. Conservation agriculture based on crop rotation and tillage in the semi-arid Loess Plateau, China: Effects on crop yield and soil water use. Agric. Ecosyst. Environ. 2018, 251, 67–77. [Google Scholar] [CrossRef]
  25. Stepanovic, S.; Rudnick, D.; Kruger, G. Impact of maize hybrid selection on water productivity under deficit irrigation in semiarid western Nebraska. Agric. Water Manag. 2021, 244, 106610. [Google Scholar] [CrossRef]
  26. Irmak, S.; Djaman, K.; Rudnick, D.R. Effect of full and limited irrigation amount and frequency on subsurface drip–irrigated maize evapotranspiration, yield, water use efficiency and yield response factors. Irrig. Sci. 2016, 34, 271–286. [Google Scholar] [CrossRef]
  27. Qin, S.Q.; Li, S.E.; Kang, S.Z.; Du, T.S.; Tong, L.; Ding, R.S. Can the drip irrigation under film mulch reduce crop evapotranspiration and save water under the sufficient irrigation condition? Agric. Water Manag. 2016, 177, 128–137. [Google Scholar] [CrossRef]
  28. Zhang, G.Q.; Liu, C.W.; Xiao, C.H.; Xie, R.Z.; Ming, B.; Hou, P.; Liu, G.Z.; Xu, W.J.; Shen, D.P.; Wang, K.R.; et al. Optimizing water use efficiency and economic return of super high yield spring maize under drip irrigation and plastic mulching in arid areas of China. Field Crops Res. 2017, 211, 137–146. [Google Scholar] [CrossRef]
  29. Payero, J.O.; Tarkalson, D.D.; Irmak, S.; Davison, D.; Petersen, J.L. Effect of irrigation amounts applied with subsurface drip irrigation on corn evapotranspiration, yield, water use efficiency, and dry matter production in a semiarid climate. Agric. Water Manag. 2008, 95, 895–908. [Google Scholar] [CrossRef] [Green Version]
  30. Bozkurt, S.; Yazar, A.; Mansurolu, G.S. Effects of different drip irrigation levels on yield and some agronomic characteristics of raised bed planted corn. Afr. J. Agric. Res. 2011, 6, 5291–5300. [Google Scholar]
  31. Yazar, A.; Howell, T.A.; Dusek, D.A.; Copeland, K.S. Evaluation of crop water stress index for LEPA irrigated corn. Irrig. Sci. 1999, 18, 171–180. [Google Scholar] [CrossRef]
  32. Zhai, C.; Zhou, H.P.; Zhao, J. Experimental Study on Inter-Annual Water Requirement and Water Consumption of Drip Irrigation Maize in North of Xinjiang. Sci. Agric. Sin. 2017, 50, 2769–2780. [Google Scholar]
  33. Ren, X.M.; Sun, D.B.; Wang, Q.S. Modeling the effects of plant density on maize productivity and water balance in the Loess Plateau of China. Agric. Water Manag. 2016, 171, 40–48. [Google Scholar] [CrossRef]
  34. Yang, Y.S.; Xu, W.; Hou, P.; Liu, G.Z.; Liu, W.M.; Wang, Y.H.; Zhao, R.L.; Ming, B.; Xie, R.Z.; Wang, K.R.; et al. Improving maize grain yield by matching maize growth and solar radiation. Sci Rep. 2019, 9, 3635. [Google Scholar] [CrossRef] [PubMed] [Green Version]
  35. Reicosky, D.C.; Warnes, D.D.; Evans, S.D. Soybean evapotranspiration, leaf water potential and foliage temperature as affected by row spacing and irrigation. Field Crop Res. 1985, 10, 37–48. [Google Scholar] [CrossRef] [Green Version]
  36. Gong, D.Z.; Kang, S.Z.; Yao, L.M.; Zhang, L. Estimation of evapotranspiration and its components from an apple orchard in northwest China using sap flow and water balance methods. Hydrol. Process. 2007, 21, 931–938. [Google Scholar] [CrossRef]
  37. Deng, X.P.; Shan, L.; Zhang, H.; Turner, N.C. Improving agricultural water use efficiency in arid and semi–arid areas of China. Agric. Water Manag. 2006, 80, 23–40. [Google Scholar] [CrossRef]
  38. Piao, S.L.; Ciais, P.; Huang, Y.; Shen, Z.H.; Peng, S.S.; Li, J.S.; Zhou, L.P.; Liu, H.Y.; Ma, Y.C.; Ding, Y.H.; et al. The impacts of climate change on water resources and agriculture in China. Nature 2010, 467, 43–51. [Google Scholar] [CrossRef]
  39. Ertek, A.; Yilmaz, H. The agricultural perspective on water conservation in Turkey. Agric. Water Manag. 2014, 143, 151–158. [Google Scholar] [CrossRef]
  40. Wang, Q.M.; Fan, Z.L.; Zhao, Y.H.; Yin, W.; Chai, Q. Effect of Plant Density on Water Consumption Characteristics of Maize in Oasis Irrigation Area. Acta. Agron. Sin. 2017, 43, 1347–1356. [Google Scholar] [CrossRef]
  41. Liu, Z.D.; Xiao, J.F.; Yu, J.C.; Liu, Z.G.; Nan, J.Q. Effects of varieties and plant density on plant traits and water consumption characteristics of spring maize. Trans. CSAE. 2012, 28, 125–131. [Google Scholar]
  42. Jiang, X.L.; Kang, S.Z.; Tong, L.; Li, F.S.; Li, D.H.; Ding, R.S.; Qiu, R.J. Planting density affected biomass and grain yield of maize for seed production in an arid region of Northwest China. J. Arid Land. 2018, 10, 292–303. [Google Scholar] [CrossRef] [Green Version]
  43. Casal, J.J.; Deregibus, V.A.; Sanchez, R.A. Variations in tiller dynamics and morphology in Lolium multiflorum Lam: Vegetative and reproductive plants as affected by differences in red/far–red Irradiation. Ann. Bot. 1985, 56, 553–559. [Google Scholar] [CrossRef]
  44. Howell, T.A.; Tolk, J.A.; Schneider, A.D.; Evett, S.R. Evapotranspiration, Yield, and Water Use Efficiency of Corn Hybrids Differing in Maturity. Agron. J. 1998, 90, 1–9. [Google Scholar] [CrossRef]
  45. Wang, X.Q.; Ma, L.Y.; Jia, Z.K.; Xu, C.Y. Research and application advances in leaf area index. Chin. J. Ecol. 2005, 25, 537–541. [Google Scholar]
  46. Wang, J.; Li, X.G.; Liu, E.M.; Yu, Q. The relationship between relative evapotranspiration and leaf area index and surface soil water content in winter wheat field of North China Plain. Chin. J. Eco–Agric. 2003, 11, 32–34. [Google Scholar]
  47. Papadopoulos, A.P.; Pararajasingham, S. The influence of plant spacing on light interception and use in greenhouse tomato (Lycopersicon esculentum Mill.): A review. Sci. Hortic. 1997, 69, 1–29. [Google Scholar] [CrossRef]
  48. Pieruschka, R.; Huber, G.; Berry, J.A. Control of transpiration by radiation. Proc. Natl. Acad. Sci. USA 2010, 107, 13372–13377. [Google Scholar] [CrossRef] [Green Version]
  49. Kuscu, H.; Karasu, A.; Oz, M.; Demir, A.O.; Turgut, I. Effect of irrigation amounts applied with drip irrigation on maize evapotranspiration, yield, water use efficiency, and net return in a sub–humid climate. Turk. J. Field Crops. 2013, 18, 13–19. [Google Scholar]
  50. Allen, R.G.; Pereira, L.S.; Raes, D.; Smith, M. Crop Evapotranspiration: Guidelines for Computing Crop Water Requirements; FAO Irrigation and Drainage Paper No. 56; FAO: Rome, Italy, 1998. [Google Scholar]
  51. Waller, P.; Yitayew, M. Crop Evapotranspiration. FAO–Irrigation and Drainage Engineering; Springer International Publishing: Berlin, Germany, 2016; pp. 89–104. [Google Scholar]
  52. Wang, J.; Cai, H.J.; Kang, Y.X. Ratio of soil evaporation to the evapotranspiration for summer maize field. Trans. CSAE. 2007, 23, 17–22. [Google Scholar]
  53. Bucci, S.J.; Scholz, F.G.; Goldstein, G.; Hoffmann, W.A.; Meinzer, F.C.; Franco, A.C.; Giambelluca, T.; Miralles-Wilhelm, F. Controls on stand transpiration and soil water utilization along a tree density gradient in a Neotropical savanna. Agric. For. Meteorol. 2008, 148, 839–849. [Google Scholar] [CrossRef]
  54. Versteeg, M.; Van Keulen, H. Potential crop production prediction by some simple calculation methods, as compared with computer simulations. Agric. Syst. 1986, 19, 249–272. [Google Scholar] [CrossRef]
  55. Dwyer, L.M.; Stewart, D.W. Leaf Area Development in Field–Grown Maize. Agron. J. 1986, 78, 334–343. [Google Scholar] [CrossRef]
  56. Maddonni, G.A.; Otegui, M.E. Leaf area light interception, and crop development in maize. Field Crops Res. 1996, 48, 81–87. [Google Scholar] [CrossRef]
  57. Allen, R.G.; Pereira, L.S. Estimating crop coefficients from fraction of ground cover and height. Irrig. Sci. 2009, 28, 17–34. [Google Scholar] [CrossRef] [Green Version]
  58. Jia, Q.M.; Sun, L.F.; Wang, J.J.; Li, J.; Ali, S.; Liu, T.N.; Zhang, P.; Lian, Y.H.; Ding, R.X.; Ren, X.L.; et al. Limited irrigation and plant densities for enhanced water productivity and economic returns under the ridge–furrow system in semi–arid regions of China. Field Crops Res. 2018, 221, 207–218. [Google Scholar] [CrossRef]
  59. Ren, X.M.; Sun, D.B.; Wang, Q.S. Effects of Plastic Film Mulching and Plant Density on Yield and Evapotranspiration of Rainfed Spring Maize. Trans. CSAM. 2017, 48, 206–212. [Google Scholar]
  60. Assefa, Y.; Carter, P.; Hinds, M.; Bhalla, G.; Schon, R.; Jeschke, M.; Paszkiewicz, S.; Smith, S.; Ciampitti, A.I. Analysis of Long–Term Study Indicates Both Agronomic Optimal Plant Density and Increase Maize Yield per Plant Contributed to Yield Gain. Sci. Rep. 2017, 8, 1–10. [Google Scholar] [CrossRef] [PubMed] [Green Version]
Figure 1. Schematic diagram showing the planting patterns in the experimental field.
Agriculture 11 00313 g001
Figure 2. Relationships between grain yield and plant density under different irrigation levels in 2016 and 2017. ** denotes significance at the 0.01 level.
Agriculture 11 00313 g002
Figure 3. Relationships between the leaf area index (LAI) (silking) and planting density (a), LAI and irrigation level (b) in 2016 and 2017. D1, D2, D3, D4, and D5 represent 7.5, 9.0, 10.5, 12.0, and 13.5 plants m−2, respectively. ** denotes significance at the 0.01 level.
Agriculture 11 00313 g003
Figure 4. Relationships between LAI (silking), grain yield, and ETa at W1 (a), W2 (b), W3 (c), and W4 (d). GY, grain yield; ETa, evapotranspiration. ** denotes significance at the 0.01 level.
Agriculture 11 00313 g004
Figure 5. Relationships between optimal LAI and optimal water use efficiency (WUE) (a), and between irrigation level and optimal LAI and WUE (b). ** denotes significance at the 0.01 level.
Agriculture 11 00313 g005
Table 1. Precipitation, air temperature, and sunshine hours during maize growing seasons of 2016 and 2017.
MonthPrecipitation (mm)Average Temperature (°C)Sunshine Hours (h)
201620172008–2017 Average201620172008–2017 Average201620172008–2017 Average
April20.529.923.114.813.011.16.96.28.9
May31.742.724.815.016.917.17.99.29.9
June75.672.228.222.621.121.88.47.39.7
July42.10.925.823.324.123.57.89.89.7
August36.518.925.021.820.921.77.18.99.4
September4.613.517.719.615.715.88.98.39.0
Total/average211178.1144.519.518.618.57.88.39.4
Table 2. The grain yield, kernel number, kernel weight, evapotranspiration, water use efficiency, and LAI of maize under different treatments in 2016 and 2017.
YearIrrigation LevelPlant Density Kernel Number (103 Kernels m−2)Kernel Weight (kg m−2)Grain Yield (t ha−1)ETa (mm)WUE (kg m−3)LAI
2016W1D14.3c1.61b16.4d556.2c2.95b5.7d
D35.0b1.76a18.7a627.2b2.98a7.1c
D45.0b1.74a18.4b625.4b2.94b7.6b
D55.1a1.58b17.7c656.5a2.69c8.1a
W2D14.7d1.79d18.3c657.5d2.79b6.2d
D35.5a2.04a20.6a720.2c2.86a7.6c
D45.4b1.97b20.5a733.7b2.79b8.3b
D55.3c1.87c20.0b776.2a2.57c8.9a
W3D15.1d1.88c18.4d754.3d2.43c6.2d
D35.6c2.14b20.7b783.6c2.63a7.6c
D46.3a2.22a21.0a797.8b2.64a8.5b
D56.2b2.12b20.5c819.1a2.50b9.4a
2017W1D14.7e1.67d16.3c589.9e2.76c5.6e
D25.1d1.76c17.6b612.5d2.87b6.4d
D35.7a1.95a18.6a626.6c2.97a7.3c
D45.5b1.85b18.9a649.4b2.90b7.6b
D55.4c1.74c17.8b664.5a2.69d8.4a
W2D15.0d1.90c18.6d691.7e2.69c6.3e
D25.4c2.04b19.3c694.5d2.77b6.9d
D35.9a2.13a20.8a725.5c2.86a7.8c
D45.9a2.14a20.7ab736.0b2.81ab8.3b
D55.7b2.03b20.4b780.0a2.61d9.2a
W3D15.1d1.90d18.7d738.8e2.53b6.3e
D25.7c2.08c19.5c756.7d2.57b7.1d
D36.2b2.16b20.8ab774.9c2.69a7.9c
D46.3a2.32a21.2a784.1b2.70a8.7b
D56.1b2.13b20.7b808.2a2.56b9.5a
W4D15.0e1.91d18.6c784.5e2.37d6.3e
D25.6d2.03c19.6b796.0d2.46c7.3d
D36.1c2.16b20.8a813.7c2.56a8.0c
D46.3a2.31a21.0a824.3b2.55ab8.7b
D56.2b2.14b20.8a831.3a2.50bc9.6a
Note: W1, W2, W3, and W4 represent irrigation levels of 360 mm, 480 mm, 600 mm and 720 mm, respectively. D1, D2, D3, D4, and D5 represent planting densities of 7.5, 9.0, 10.5, 12.0, and 13.5 plants m−2, respectively. Means within a column and for the same site followed by different letters are significantly different at p < 0.05.
Table 3. Analysis of variance significance levels for the main factors, irrigation level, and planting density, and the two-way interactions for grain yield, kernel number, kernel weight, evapotranspiration, water use efficiency, and LAI in 2016 and 2017.
Sources of VariationKernel Number (103 kernels m−2)Kernel Weight (kg m−2)Grain Yield (t ha−1)ETa (mm)WUE (kg m−3)LAI
2016
Irrigation level (W)************
Plant density (D)************
W × D************
2017
W************
D************
W × D**********
Year (Y)********ns**
Y × W***ns****ns
Y × D****ns******
Y × W × D*********ns
Note: WUE, water use efficiency; ETa, evapotranspiration; LAI, leaf area index at silking. * Significant at p < 0.05. ** Significant at p < 0.01. ns, not significant.
Table 4. Correlation among plant density, LAI, kernel number, kernel weight, and grain yield of maize under irrigation level in 2016 and 2017.
Control Variable Plant DensityLAIKernel NumberKernel WeightGrain Yield
Irrigation levelPlant density1
LAI0.984 **1
Kernel number0.736 **0.782 **1
Kernel weight0.443 *0.539 **0.849 **1
Grain yield0.670 **0.744 **0.803 **0.861 **1
Note: LAI, Leaf area index at silking; * and ** indicate significant differences at the 0.05 and 0.01 probability levels, respectively.
Table 5. Correlation among irrigation level, LAI, kernel number, kernel weight, and grain yield of maize under plant density in 2016 and 2017.
Control Variable Irrigation LevelLAIKernel Number Kernel Weight Grain Yield
Plant densityIrrigation level1
LAI0.872 **1
Kernel number0.772 **0.790 **1
Kernel weight0.761 **0.867 **0.936 **1
Grain yield0.734 **0.849 **0.819 **0.932 **1
Note: LAI, Leaf area index at silking; ** indicate significant differences at the 0.05 and 0.01 probability levels, respectively.
Table 6. The plant densities that were predicted to achieve the optimal yield for each irrigation levels and plant year.
YearIrrigation LevelOptimal Density (Plants m−2)Optimum Yield (t ha–1)95% Confidential Interval
2016W111.118.71.3
W211.420.61.4
W311.721.01.3
2017W111.418.71.3
W212.020.70.9
W312.221.01.1
W412.220.91.1
Publisher’s Note: MDPI stays neutral with regard to jurisdictional claims in published maps and institutional affiliations.

