Article

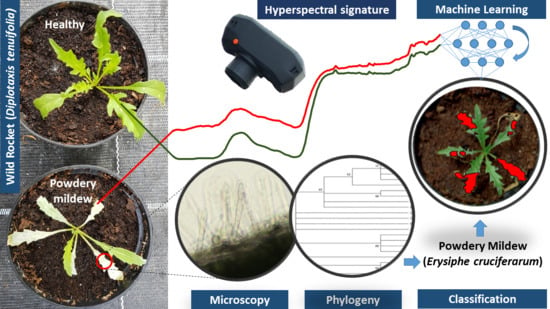
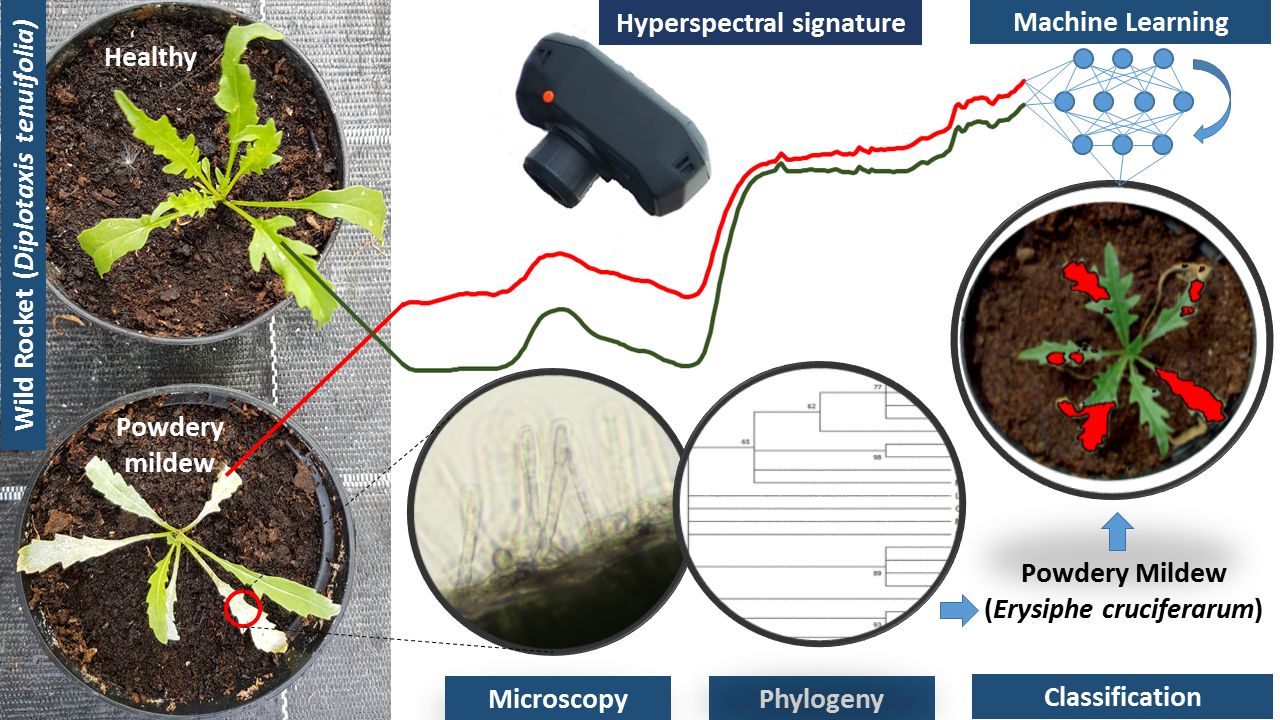
Powdery Mildew Caused by Erysiphe cruciferarum on Wild Rocket (Diplotaxis tenuifolia): Hyperspectral Imaging and Machine Learning Modeling for Non-Destructive Disease Detection

1
Consiglio per la Ricerca in Agricoltura e l’Analisi dell’Economia Agraria, Centro di Ricerca Orticoltura e Florovivaismo, Via Cavalleggeri, 25, 84098 Pontecagnano Faiano, Italy
2
Dipartimento di Scienze della Terra, dell’Ambiente e delle Risorse, Università degli Studi di Napoli Federico II, Monte Sant’Angelo, Via Cinthia, 21, 80126 Napoli, Italy
*
Author to whom correspondence should be addressed.
Submission received: 18 March 2021 / Revised: 3 April 2021 / Accepted: 8 April 2021 / Published: 9 April 2021
(This article belongs to the Section Crop Protection, Diseases, Pests and Weeds)

Abstract

:
Wild rocket is a widely cultivated salad crop. Typical signs and symptoms of powdery mildew were observed on leaves of Diplotaxis tenuifolia, likely favored by climatic conditions occurring in a greenhouse. Based on morphological features and molecular analysis, the disease agent was identified as the fungal pathogen Erysiphe cruciferarum. To the best of our knowledge, this is the first report of E. cruciferarum on D. tenuifolia. Moreover, the present study provides a non-destructive high performing digital approach to efficiently detect the disease. Hyperspectral image analysis allowed to characterize the spectral response of wild rocket affected by powdery mildew and the adopted machine-learning approach (a trained Random Forest model with the four most contributory wavelengths falling in the range 403–446 nm) proved to be able to accurately discriminate between healthy and diseased wild rocket leaves. Shifts in the irradiance absorption by chlorophyll a of diseased leaves in the spectrum blue range seems to be at the base of the hyperspectral imaging detection of wild rocket powdery mildew.

Graphical Abstract

1. Introduction

Powdery mildew is among the most common diseases of vegetables favored by warm and dry climates, though it does require high relative humidity to spread [1]. It is caused by different species of fungi belonging to the order Erysiphales (Ascomycota) [2]. By means of appressorium, fungus directly enters the host cells. After an endophytic progression, it emerges with conidiophores on the leaf surface, forming small powdery white spots, which expand on the whole upper side of leaves, consisting of a layer of mildew made up of many spores looking like flour. Conidia dispersal by the wind may spread disease, causing secondary infections. Plants severely affected by powdery mildew reduce growth and production due to losses of the net photosynthetic area, subtraction of nutrients, and bud damage: attacked leafy vegetables become completely unmarketable [3,4]. The development of powdery mildews on plant surfaces is strongly affected by climatic factors such as temperature and rainfall [5,6,7], which implicate that effects of the pathogen will vary across habitats and seasons [8]. Early detection of powdery mildew is a critical point to prompt targeted control intervention to effectively avoid infection bursting [9,10]. To date, in the EU, the disease management of foliar pathogens as Erysiphe spp. is based on the use of resistant varieties, when available, sulfur-based fungicides, and Integrated Pest Management (IPM) strategies including the application of essential oils, biofumigant seed meals, and biopesticides [11].
The high-throughput hyperspectral imaging (HSI) may help make up optical-based digital tools for large scale monitoring, rapid and non-destructive plant disease detection providing useful information about both the timing and spacing of antifungal treatments [12,13]. It couples the concept of spectroscopy with that of imaging by analyzing reflectance data captured by hyperspectral sensors, considering its spatial distribution. The spectral signature of the canopy related to chemical and physiological features of plant surface can be modulated by external stimuli and/or stress factors as well as the nutritional and health status at different growth stages [14,15,16]. Thereby, hyperspectral predictors, such as vegetation indices, optimal wavelengths, scattering band-regions, etc., may be usefully tailored in remote sensing, with the aim to classify a precise plant state, including disease occurrence [17]. Moreover, advances in processing techniques such as Machine Learning Algorithms (MLA) can allow to retrieve very fine spectral features describing plant biological phenomena (such as disease) selecting few elements from the high-spectral dimensional datasets such as HSI data cubes [18]. Some very recent papers displayed the great potentiality of HSI applications in scouting powdery mildew on wheat [19], squash [20], cucumber [21], and grapevine [22], making the extension of this innovative technology on other crops promising and advisable.
In this study, we examined a wild rocket experimental cultivation as a model system to train a machine learning algorithm in discovering powdery mildew signs appearing under the natural pressure of the pathogen. Diplotaxis tenuifolia L. (D.C.) is a perennial herbaceous species belonging to the Brassicaceae family reported with the common name of ‘wild rocket’ or ‘perennial wall-rocket’ (Syn.). Wild rocket is widely cultivated on soil in polyethylene greenhouses, but it is also cultivated in soilless plant, such as using the floating or nutrient film technique [23,24,25,26]. The plant is spontaneous in the Mediterranean basin (genetic diversification center), though its cultivation became more specialized and economically important in Europe and marginally in other worldwide areas, to provide minimally processed salads with baby-leaf wild rocket to the ready-to-eat fresh vegetables supply chain. In Italy, greenhouse cultivation of this crop covers a surface of more than 4000 ha [27]. The aim of research was to assess the first reported occurrence of powdery mildew on wild rocket by using high-resolution hyperspectral imaging and machine learning-based classification methods to discriminate healthy from infected plants.

2. Materials and Methods

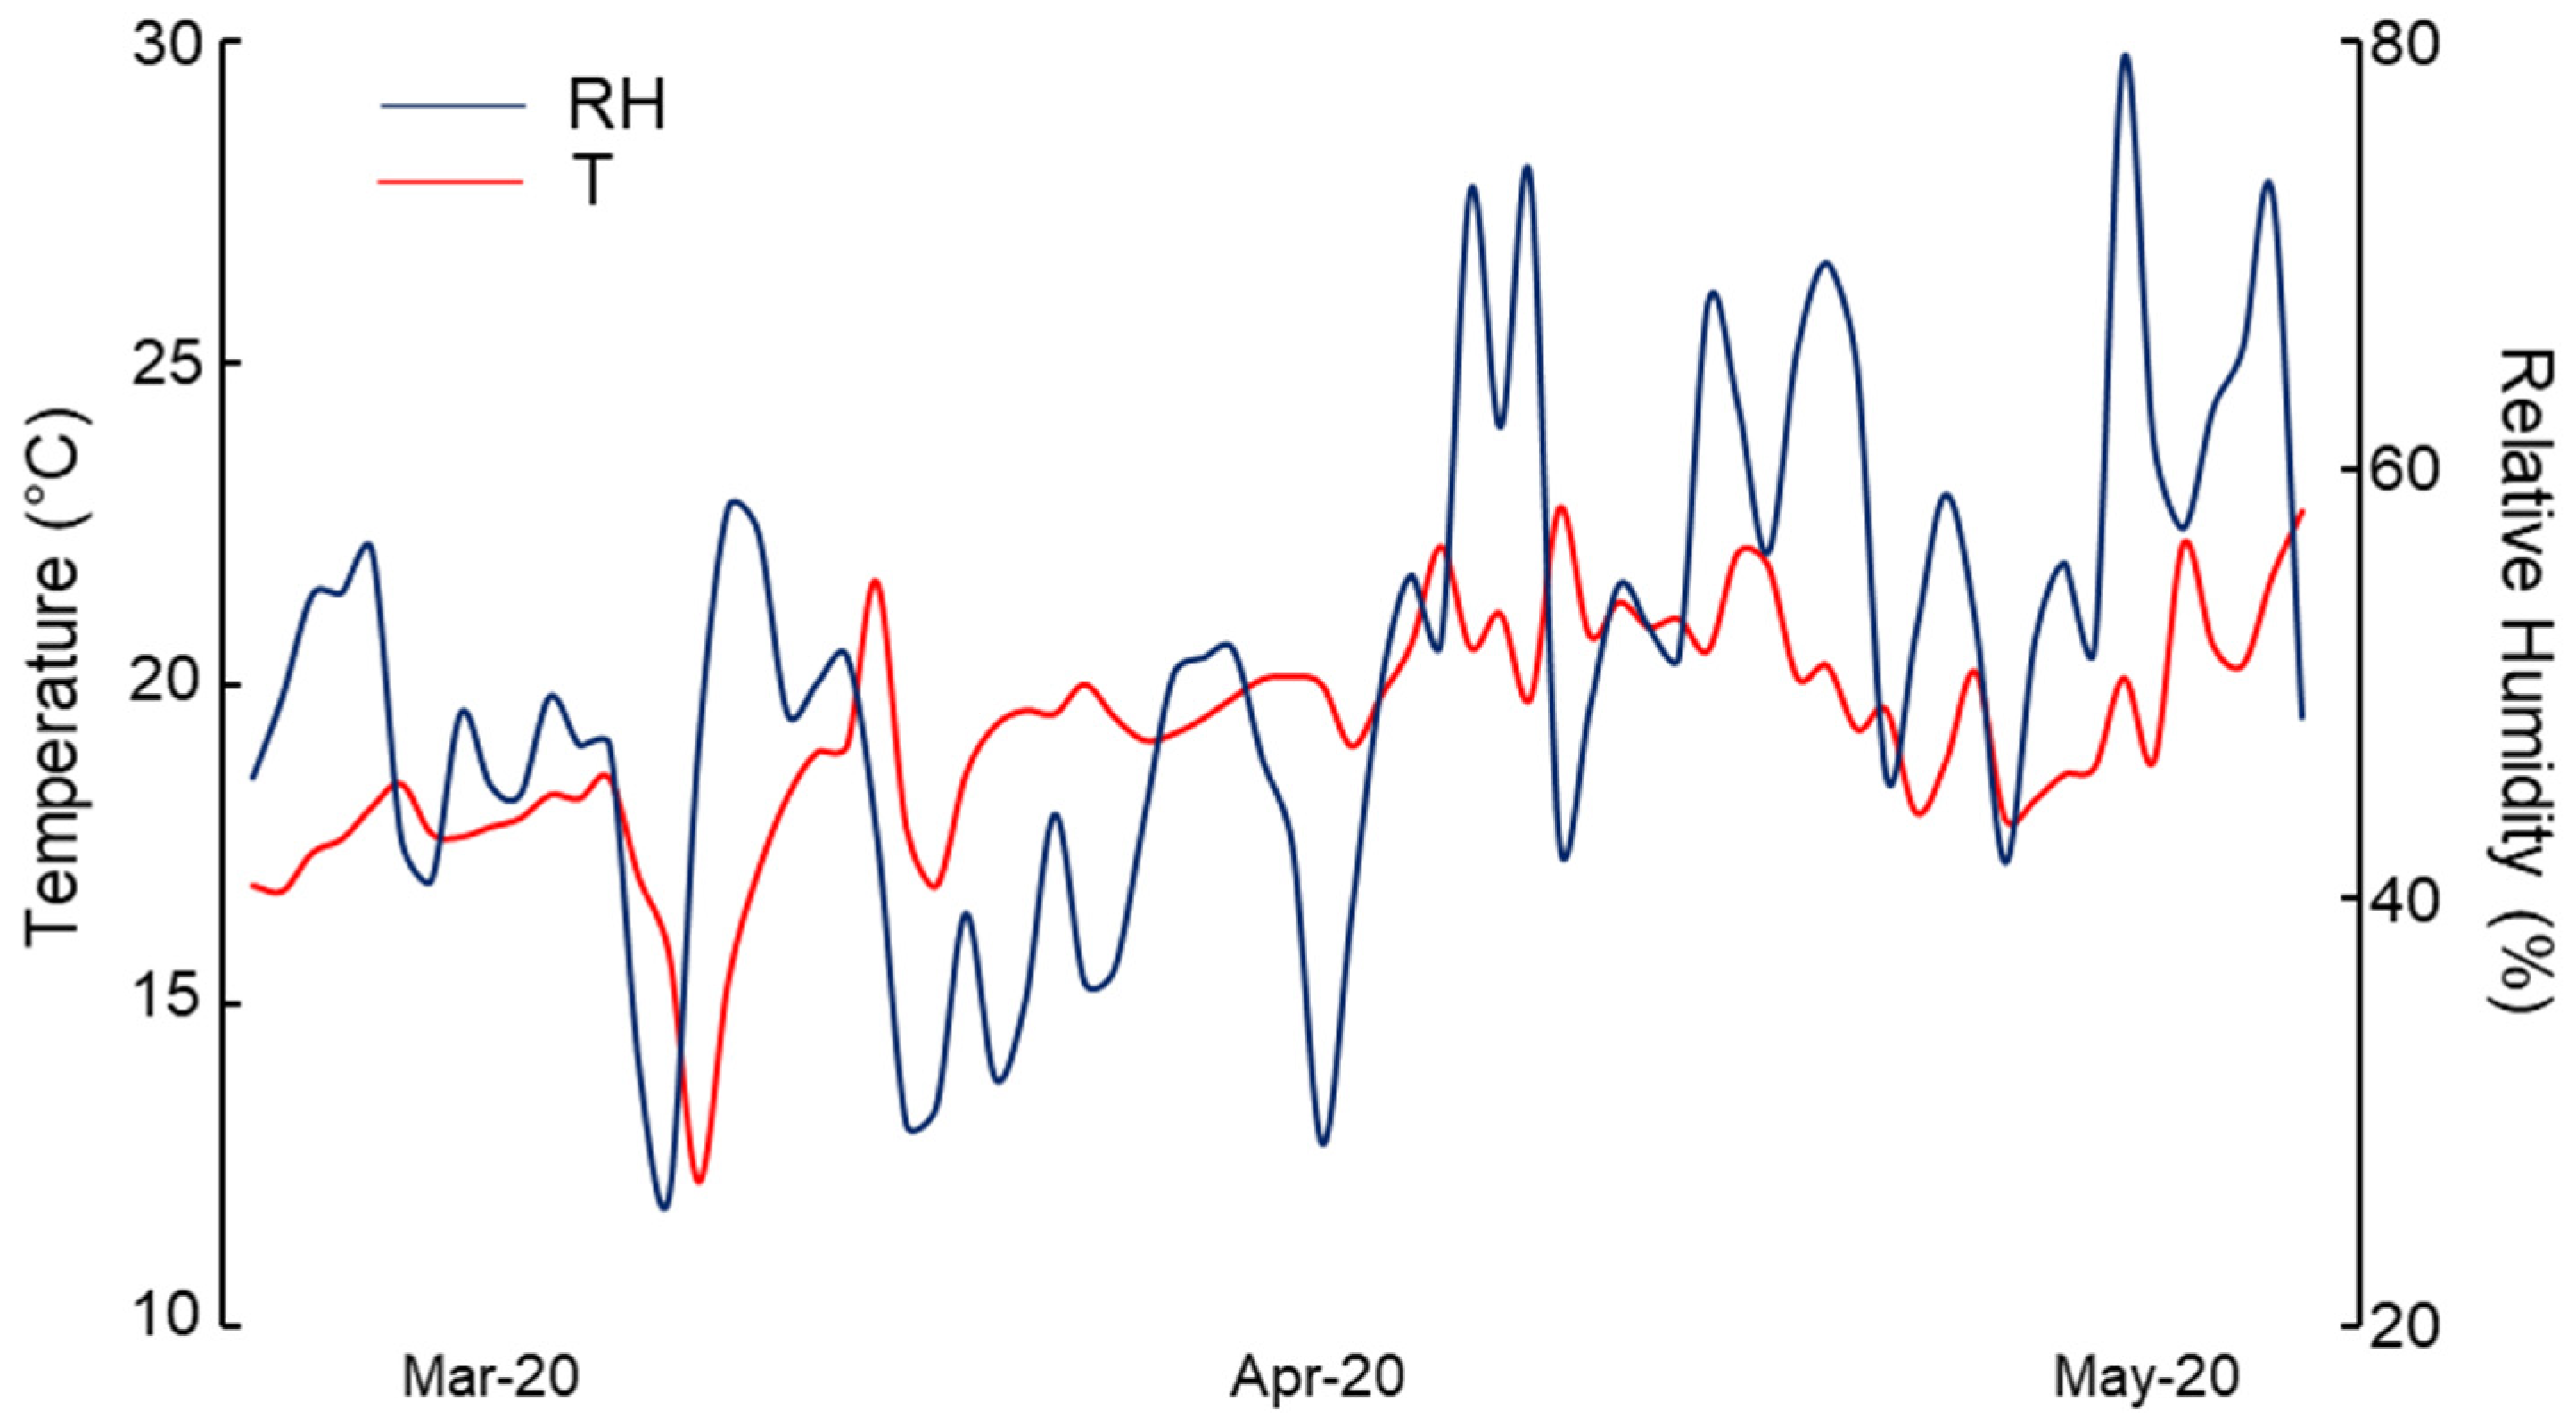
2.1. Greenhouse Experiment

A greenhouse experimental trial was carried out growing D. tenuifolia cv Tricia (Enza Zaden, Tarquinia, Italy) under an ebb-and-flow cultivation system (Pontecagnano Faiano, Italy). A total of 110 plants were grown in 10-cm diameter sized pots, one plant per pot, filled with peat-soil substrate, and arranged on the benches.
Disease surveys conducted between March and May 2020 revealed a consistent number of plants showing foliar symptoms and signs of powdery mildew infection. Some diseased leaves were collected and used for the following microscopic observations and polymerase chain reaction (PCR)-based identification. In particular, mycelium and conidia were gently scraped from infected leaves and the pathogen conidial morphology was observed by using light microscopy (Nikon Eclipse 80i, Nikon, Melville, NY, USA) equipped with a digital camera (Nikon DS-Ri2) at 40× magnification. The length and the width of 35 conidia were measured.
Diseased plant tissue was frozen in liquid nitrogen, ground to a fine powder and immediately processed. Total genomic DNA was extracted from 100 mg of powdered tissue using the PureLink® Plant Total DNA Purification Kit (Invitrogen™, ThermoFisher Scientific, Waltham, MA, USA) according to the manufacturer’s protocol. PCR amplification of the ribosomal internal transcribed spacer (ITS) 1 was conducted by using oligonucleotides EryF (5′TACAGAGTGCGAGGCTCAGTCG3′) and EryR (5′GGTCAACCTGTGATCCATGTGACTGG3′) [28]. Amplifications were performed by Biorad C1000 Thermal Cycler (Bio-Rad, Hercules, CA, USA). PCR reaction was carried out in 50 µL volume and subjected to the following temperature parameters: initial denaturation at 92 °C for 10 min, 35 cycles of denaturation at 94 °C for 1 min, annealing at 52 °C for 30 s, extension at 72 °C for 2 min, and a final extension at 72 °C for 10 min. Gel electrophoresis in 1% w/v agarose supplemented with SYBR Safe DNA Gel Stain (Invitrogen, Paisley, UK) was carried out in order to separate the DNA fragment and its size was determined against a 100 bp DNA ladder (Invitrogen™, ThermoFisher Scientific, Waltham, MA, USA). PCR products were purified by PureLink™ PCR Purification Kit (Invitrogen™, ThermoFisher Scientific, Waltham, MA, USA) following the manufacturer’s instructions. After quantification by NanoDrop™ (NanoDrop Technologies Inc., Wilmington, DE, USA), samples were submitted to Sanger sequencing.

2.2. Pathogen Analysis

The resulting sequence was compared to entries in the National Centre for Biotechnology Information (NCBI) database using the BLAST program. Entries from NCBI were aligned by MEGA X using ClustalW alignment. The phylogenetic analysis was carried out in presence of the most related Erysiphe specie sequences. The ITS sequence of Erysiphe glycines (AB015934) served as an outgroup [29]. The evolutionary history was inferred by using the Maximum Likelihood method and Tamura-Nei model [30]. The bootstrap consensus tree inferred from 1000 replicates was taken to represent the evolutionary history of the taxa analyzed [31]. Branches corresponding to partitions reproduced in less than 60% of the bootstrap replicates were collapsed. Initial tree(s) for the heuristic search were obtained automatically by applying Neighbor-Join and BioNJ algorithms to a matrix of pairwise distances estimated using the Tamura-Nei model, and then selecting the topology with a superior log likelihood value. This analysis involved 22 nucleotide sequences. Codon positions included were 1st + 2nd + 3rd + Noncoding. There were a total of 769 positions in the final dataset.
To test the fungus pathogenicity, five healthy potted six-week-old wild rocket plants were inoculated by pressing diseased leaves onto leaves, while three non-inoculated plants were used as controls [32]. Plants were maintained in a growth chamber at 20 °C with a 12-h photoperiod and 85% relative humidity and the disease progression was monitored until clear symptoms appeared.

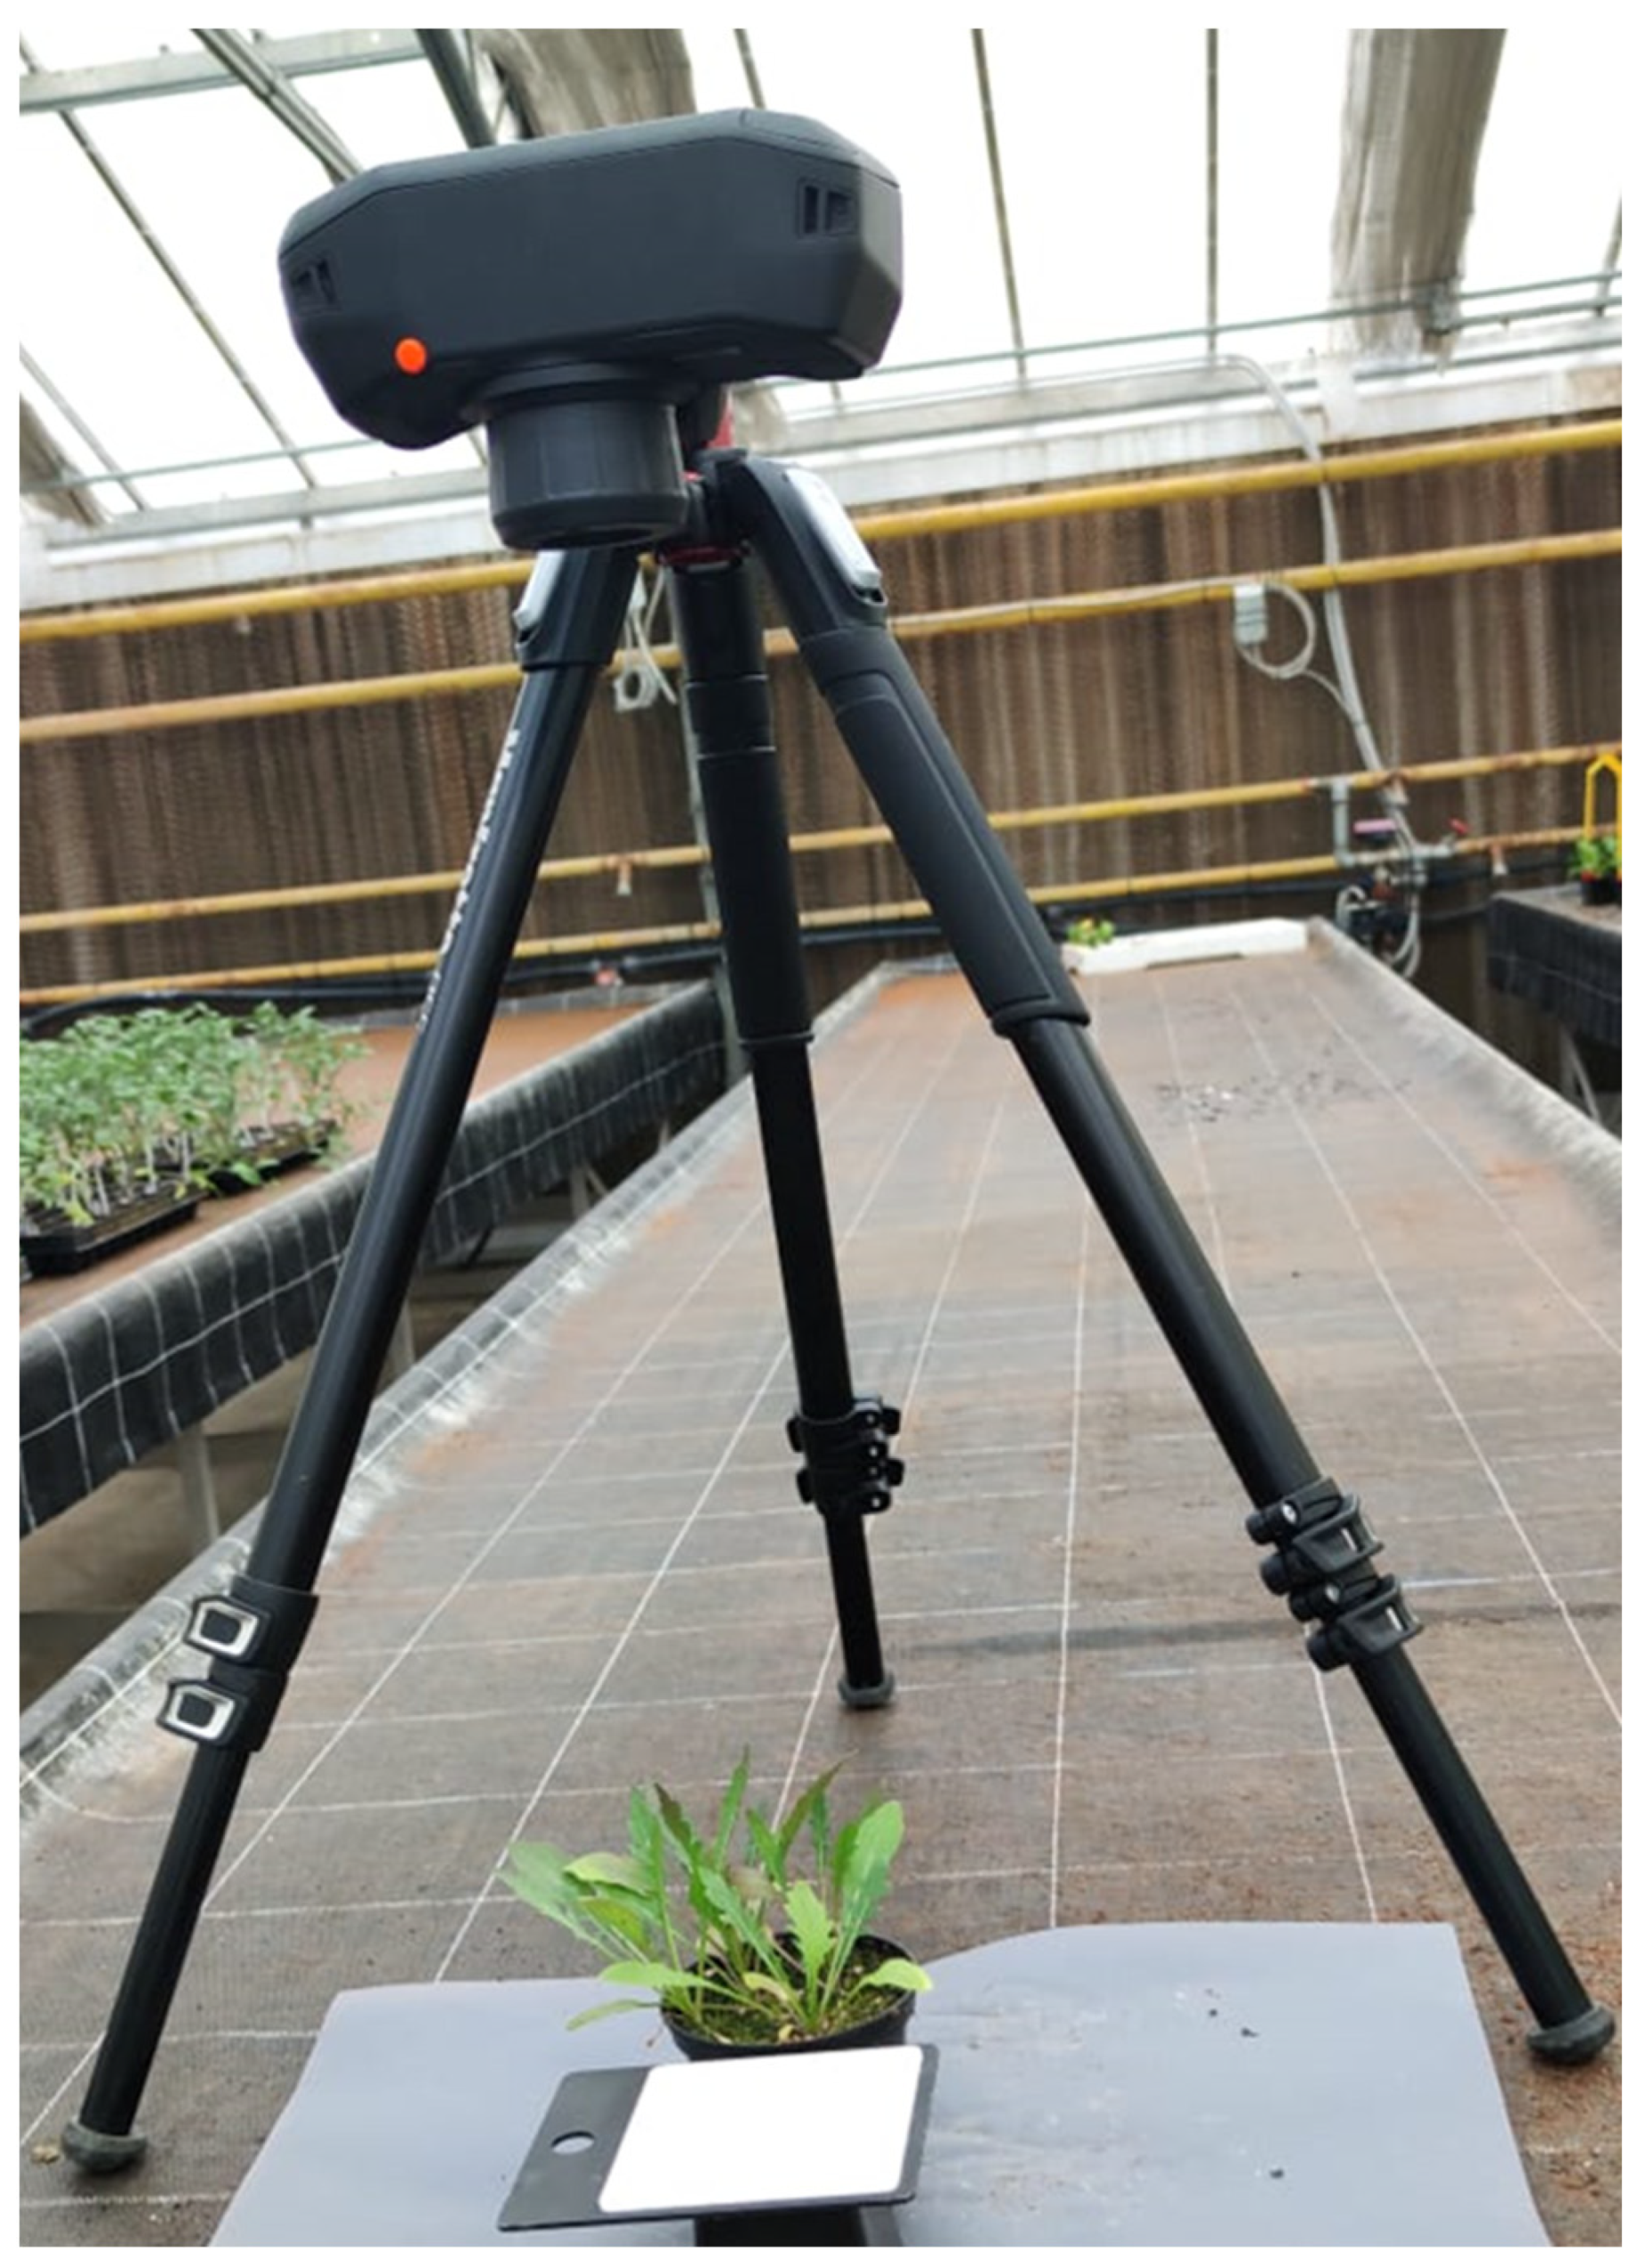
2.3. Acquisiton and Preprocessing of Hyperspectral Images

Hyperspectral images were acquired using SPECIM IQ hyperspectral camera (Specim Ltd., Oulu, Finland), working in the range of 400–1000 nm with a spectral resolution of 7 nm (204 bands). The spectral camera carries a CMOS technology sensor with a spatial sampling of 512 pixels and an image resolution of 512 × 512 pixel. The pixel size is 17.58 × 17.58 μm. Reflectance value was calculated automatically by the camera software. The images were captured in the greenhouse, on 6 May 2020, at 2:00 p.m., under natural light conditions (sun position at maximum elevation angle, with internal solar irradiance of 396 W m−2) (Figure 1). Each image contains a single plant, at foliar maturation stage, on which different Regions of Interest (ROI) were made according to the number of diseased or healthy leaves. Healthy and infected plants were separated before image acquisition by assigning 57 plants to the infected category and 53 plants to the healthy one. For each plant, different leaves were analyzed according to extension, in terms of affected leaf surface of the disease. Hyperspectral images were acquired on healthy and powdery mildew-affected plants at the fungal evasion (conidiation) stage of infection.
Hyperspectral images were processed using the raster package [33] in R software [34]. The first step was to upload images in R environment, and subsequently, the ROIs of healthy and infected leaves (128 each, respectively) were created. The extension of each ROI was variable according to the extension of the disease symptoms. The spectrum consisted of 204 bands values extracted from each pixel of each ROI. Subsequently, a mean spectrum for each ROI was elaborated. The last step was the creation of a dataset including the mean spectrum value for each ROI, separately for healthy and infected leaves, to be used for subsequent data analysis.

2.4. Variable Pre-Processing and Machine Learning Algorithm

In order to avoid variable variance inflation and collinearity, the variable number was reduced by performing a recursive feature elimination (RFE) algorithm. This procedure runs many iteratively Random Forest (RF) algorithms in order to rank variables according to their importance in the model’s prediction. More specifically, in this RFE strategy, many RF algorithms are run 100 times. Each one of these iterations, hereafter “root iteration,” includes several other iterations, hereafter “branch iteration.” In each parent iteration, the original dataset is divided into five folds, four of which were used to train an RF model, while the remaining fold was used for the model testing. This last step makes just one branch iteration, since it is repeated five times in order to use all the combinations of folds, in which the original dataset was divided into. If N is the total number of predictor variables, each branch iteration starts by training an RF model by using N predictors. Then, the predictors are ranked according to their importance and this provides a vector of ordered predictors variables S, in which S1 has a higher importance than S2 and so on.
A second step of this branch iteration generates many “leaf iterations,” which consist of performing different RF models, trained by using an ever-increasing number of predictor variables by accounting for the ranking vector S. Thereby, many models are trained by Si variables (with i from 1 to N), i.e., the first model considers variables from S1 to S2, the second model from S1 to S3,… up to S1 to SN. At the end, all these models’ performances were measured at predicting testing data by means of the coefficient of determination. These operations are repeated for each root iteration. After performing all the root iterations, the algorithm provides a table with the average coefficients of determination of the several models build upon all the Si nested combinations of predictor variables. The final number of Si variables to be used in all the following MLAs is the one provided by the model with the higher coefficient of determination. We performed this pre-processing algorithm by means of a five-fold cross validation procedure with 100 iterations. The RFE algorithm was performed by using the RFE function in the caret [35] package of the R software [34].
The selected most contributing variables were used as the input dataset to train and test an MLA, in order to create a predictive model able to automatically detect the infected sectors of any single leaf. The original dataset was divided into 80% of observations for the model training, while the remaining 20% was allocated for the model testing. The MLA employed in this research is XGBoost (XGB, Extremely Gradient Boosting) [36], one of the most powerful algorithms that recently won the Kaggle competition, in which many methods compete to predict a posteriori the features of the Titanic’s disaster survivors. Within all the gradient boosting algorithms, XGBoost stands out since it has many parameters that allow the method to avoid overfitting (i.e., the side effect of a model perfectly trained on observation data and unable to properly predict new data). Indeed, it is able to deal with sparse data and is structured to require low computational resources. In the XGBoost algorithm, a predictive model is built by combining iteratively the best randomly generated regression trees that improve the model performance by means of a specific loss function. The loss function [L(∅)] is expressed by the following formula:
L ( ) = i l ( y ^ i ,   y i ) + k Ω ( f k )
This formula is made by two different parts: the leftmost part is the loss term (l), which measures the differences between the predicted ( y ^ i ) and the measured ( y i ) values; the rightmost part is the regularization them Ω, which denotes the complexity the model reaches when progressively including new k trees that improve the model’s performance. The loss function chooses the ensemble of those regression trees that at the same time improve the model’s prediction and minimize the model’s complexity [36]. We used the functions provided by the caret package [35] of the R software for both the model’s training and the parameters’ tuning (see the Supplementary Information for a summary of the parameters’ setting). The model’s performance was evaluated by measuring the true skill statistic (TSS) [37], which is the sum of true positives (i.e., right detected true infected pixels) and true negatives (i.e., right detected true healthy pixels) proportions minus 1.
In order to produce the best predictive model with the minimum number of predictors, we trained a first model by using all variables yielded by the RFE algorithm and named it XGB1. Then, the most important variables in discriminating infected from healthy samples in XGB1 were applied to train a second model named XGB2. In the case XGB2 showed a comparable or better predictive performance than XGB1, it would have been used for sample image disease identification. For the experimental reproducibility, we provided all the parameters’ settings and their definition in Table S1 of the Supplementary Materials.

3. Results

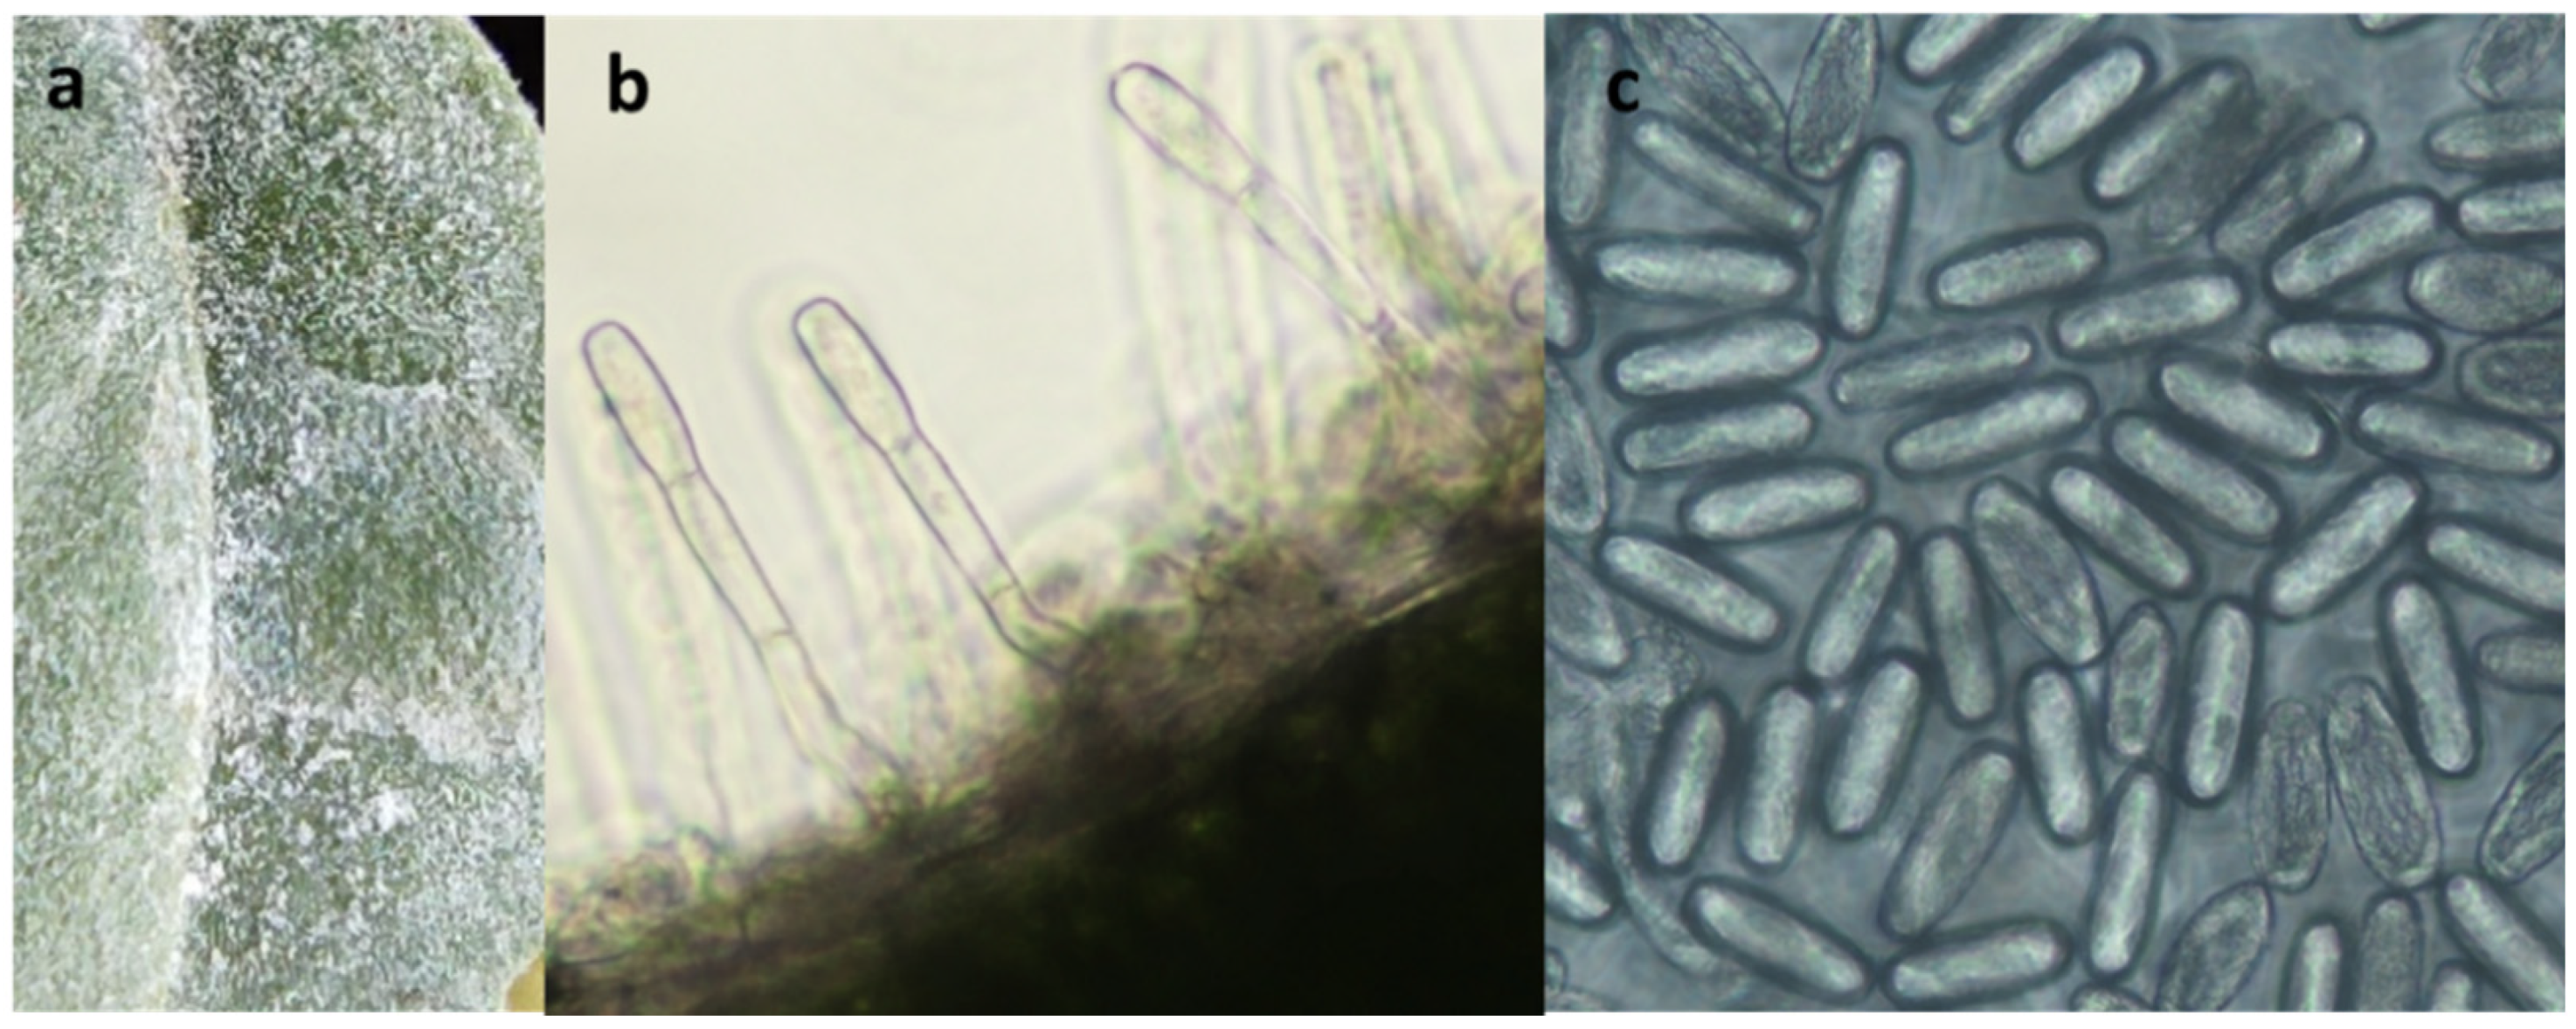
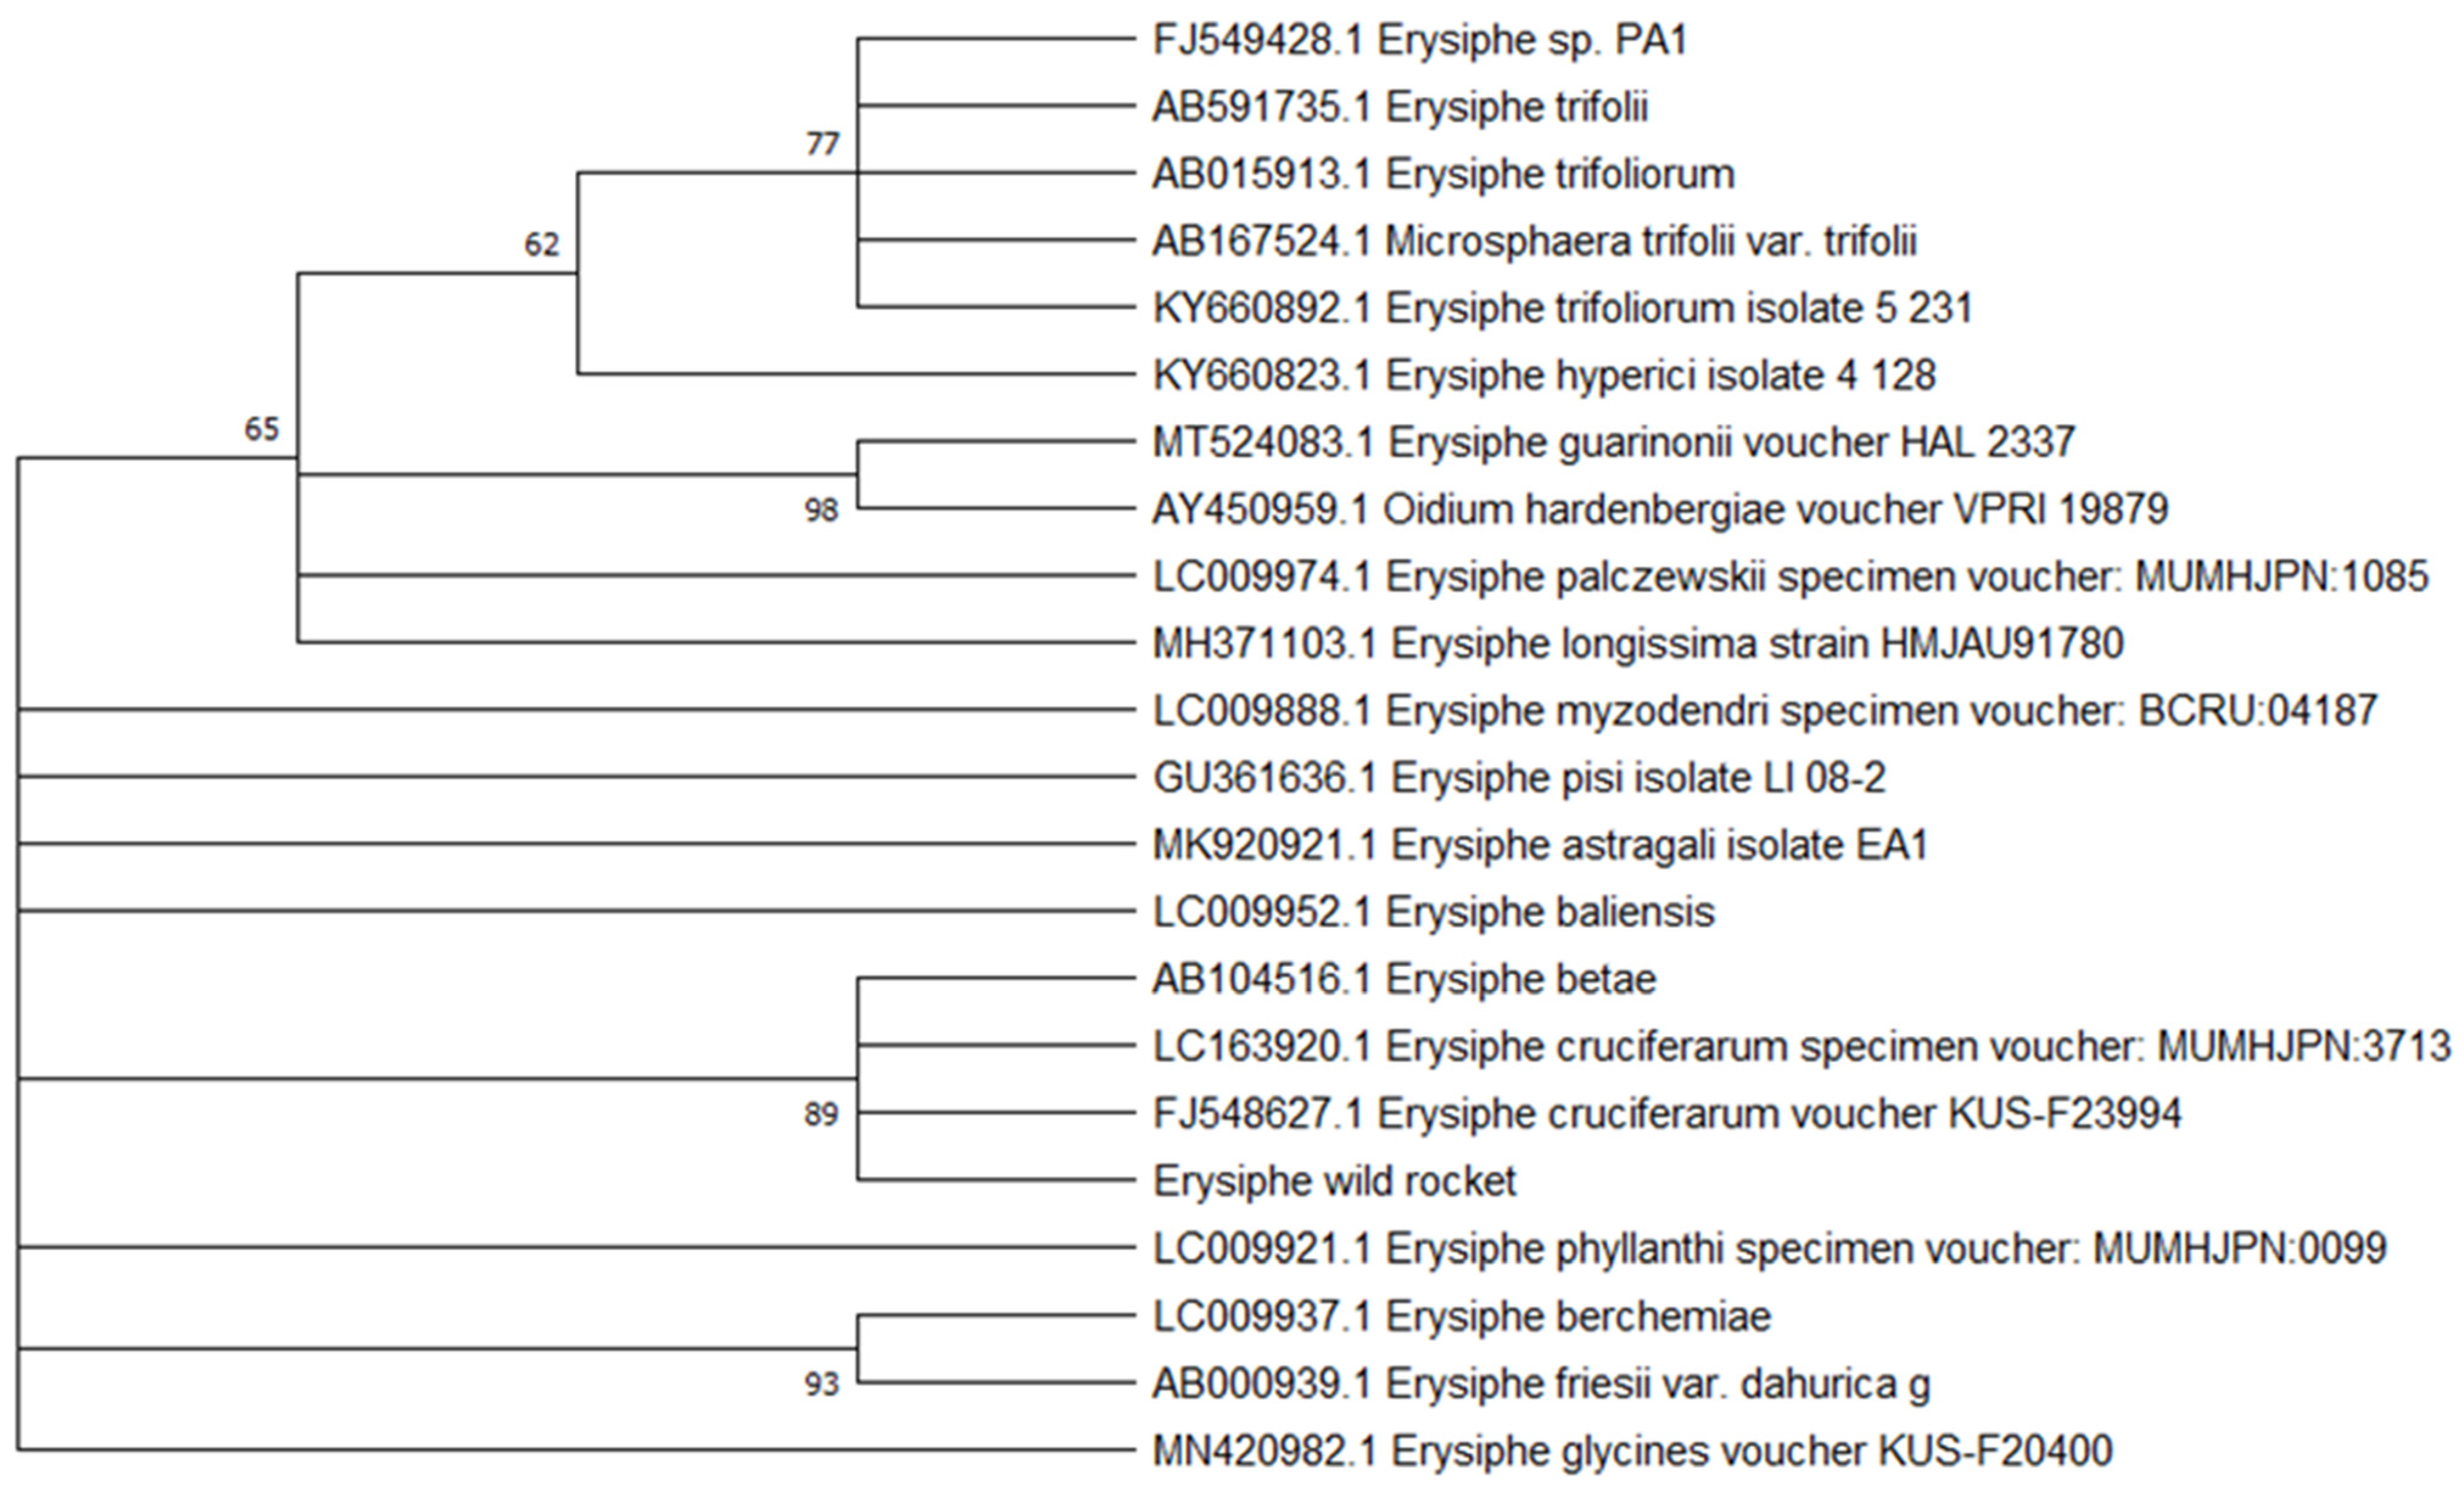
3.1. First Report of Powdery Mildew on Wild Rocket

Greenhouse cultivation occurred from March to May 2020, under the average daily air temperature and relative humidity patterns showed in Figure 2. In the reference period, the measured temperature ranged between 12.2–22.8 °C, with an average of 19.2 °C, while relative humidity varied from 26.0 to 79.2%, with an average of 50.5%.
Disease surveying revealed the appearance of powdery mildew typical signs on some leaves of the cultivated wild rocket plants. White colonies, forming a dense layer of white powder, were observed on the leaves, which senesced prematurely (Figure 3).
The pathogenic agent was identified by morphological and phylogenetic characterizations. Mycelium of the causal fungus appeared colorless and smooth. Hyaline conidia appeared oblong to cylindrical in shape and measured 22.3 to 39.5 × 8.2 to 17.9 μm (average 30.9 × 13.05 μm) with a length-to-width ratio ranging between 1.8 to 3.9 (Figure 4). No chasmothecia were found. The observed morphological features were attributable to those found for Erysiphe cruciferarum Opiz. ex. Junell in previous records [32,38,39,40].
To confirm the identification, the ITS region was amplified using specific primers, helpful in avoiding the amplification of ITS regions of the host plant or other contaminating organisms [41]. The 521 bp-long sequence was blasted against NCBI nucleotide collection (non-redundant nucleotide database), producing comparable identity and query cover value percentages (99% both) between our isolates, E. betae and E. cruciferarum.
The E. cruciferarum ITS sequence was deposited in GenBank (ncbi.nlm.nih.gov (accessed on 14 February 2021)) under the accession number MW599723. The phylogenetic analysis carried out in presence of the most related Erysiphe species sequences revealed that our isolate belongs to E. cruciferarum. As reported in Figure 5, our identification resulted strongly related to E. cruciferarum FJ548627.1 and LC163920.1, detected on Arabidopsis thaliana and Brassica parachinensis, respectively [42,43]. The pathogenicity assay showed that artificial inoculations on wild rocket leaves produced symptoms similar to those seen in the greenhouse, confirming Koch’s postulate. The fungus present on the inoculated plants was morphologically identical to those observed originally. The control plants did not develop the powdery mildew disease.

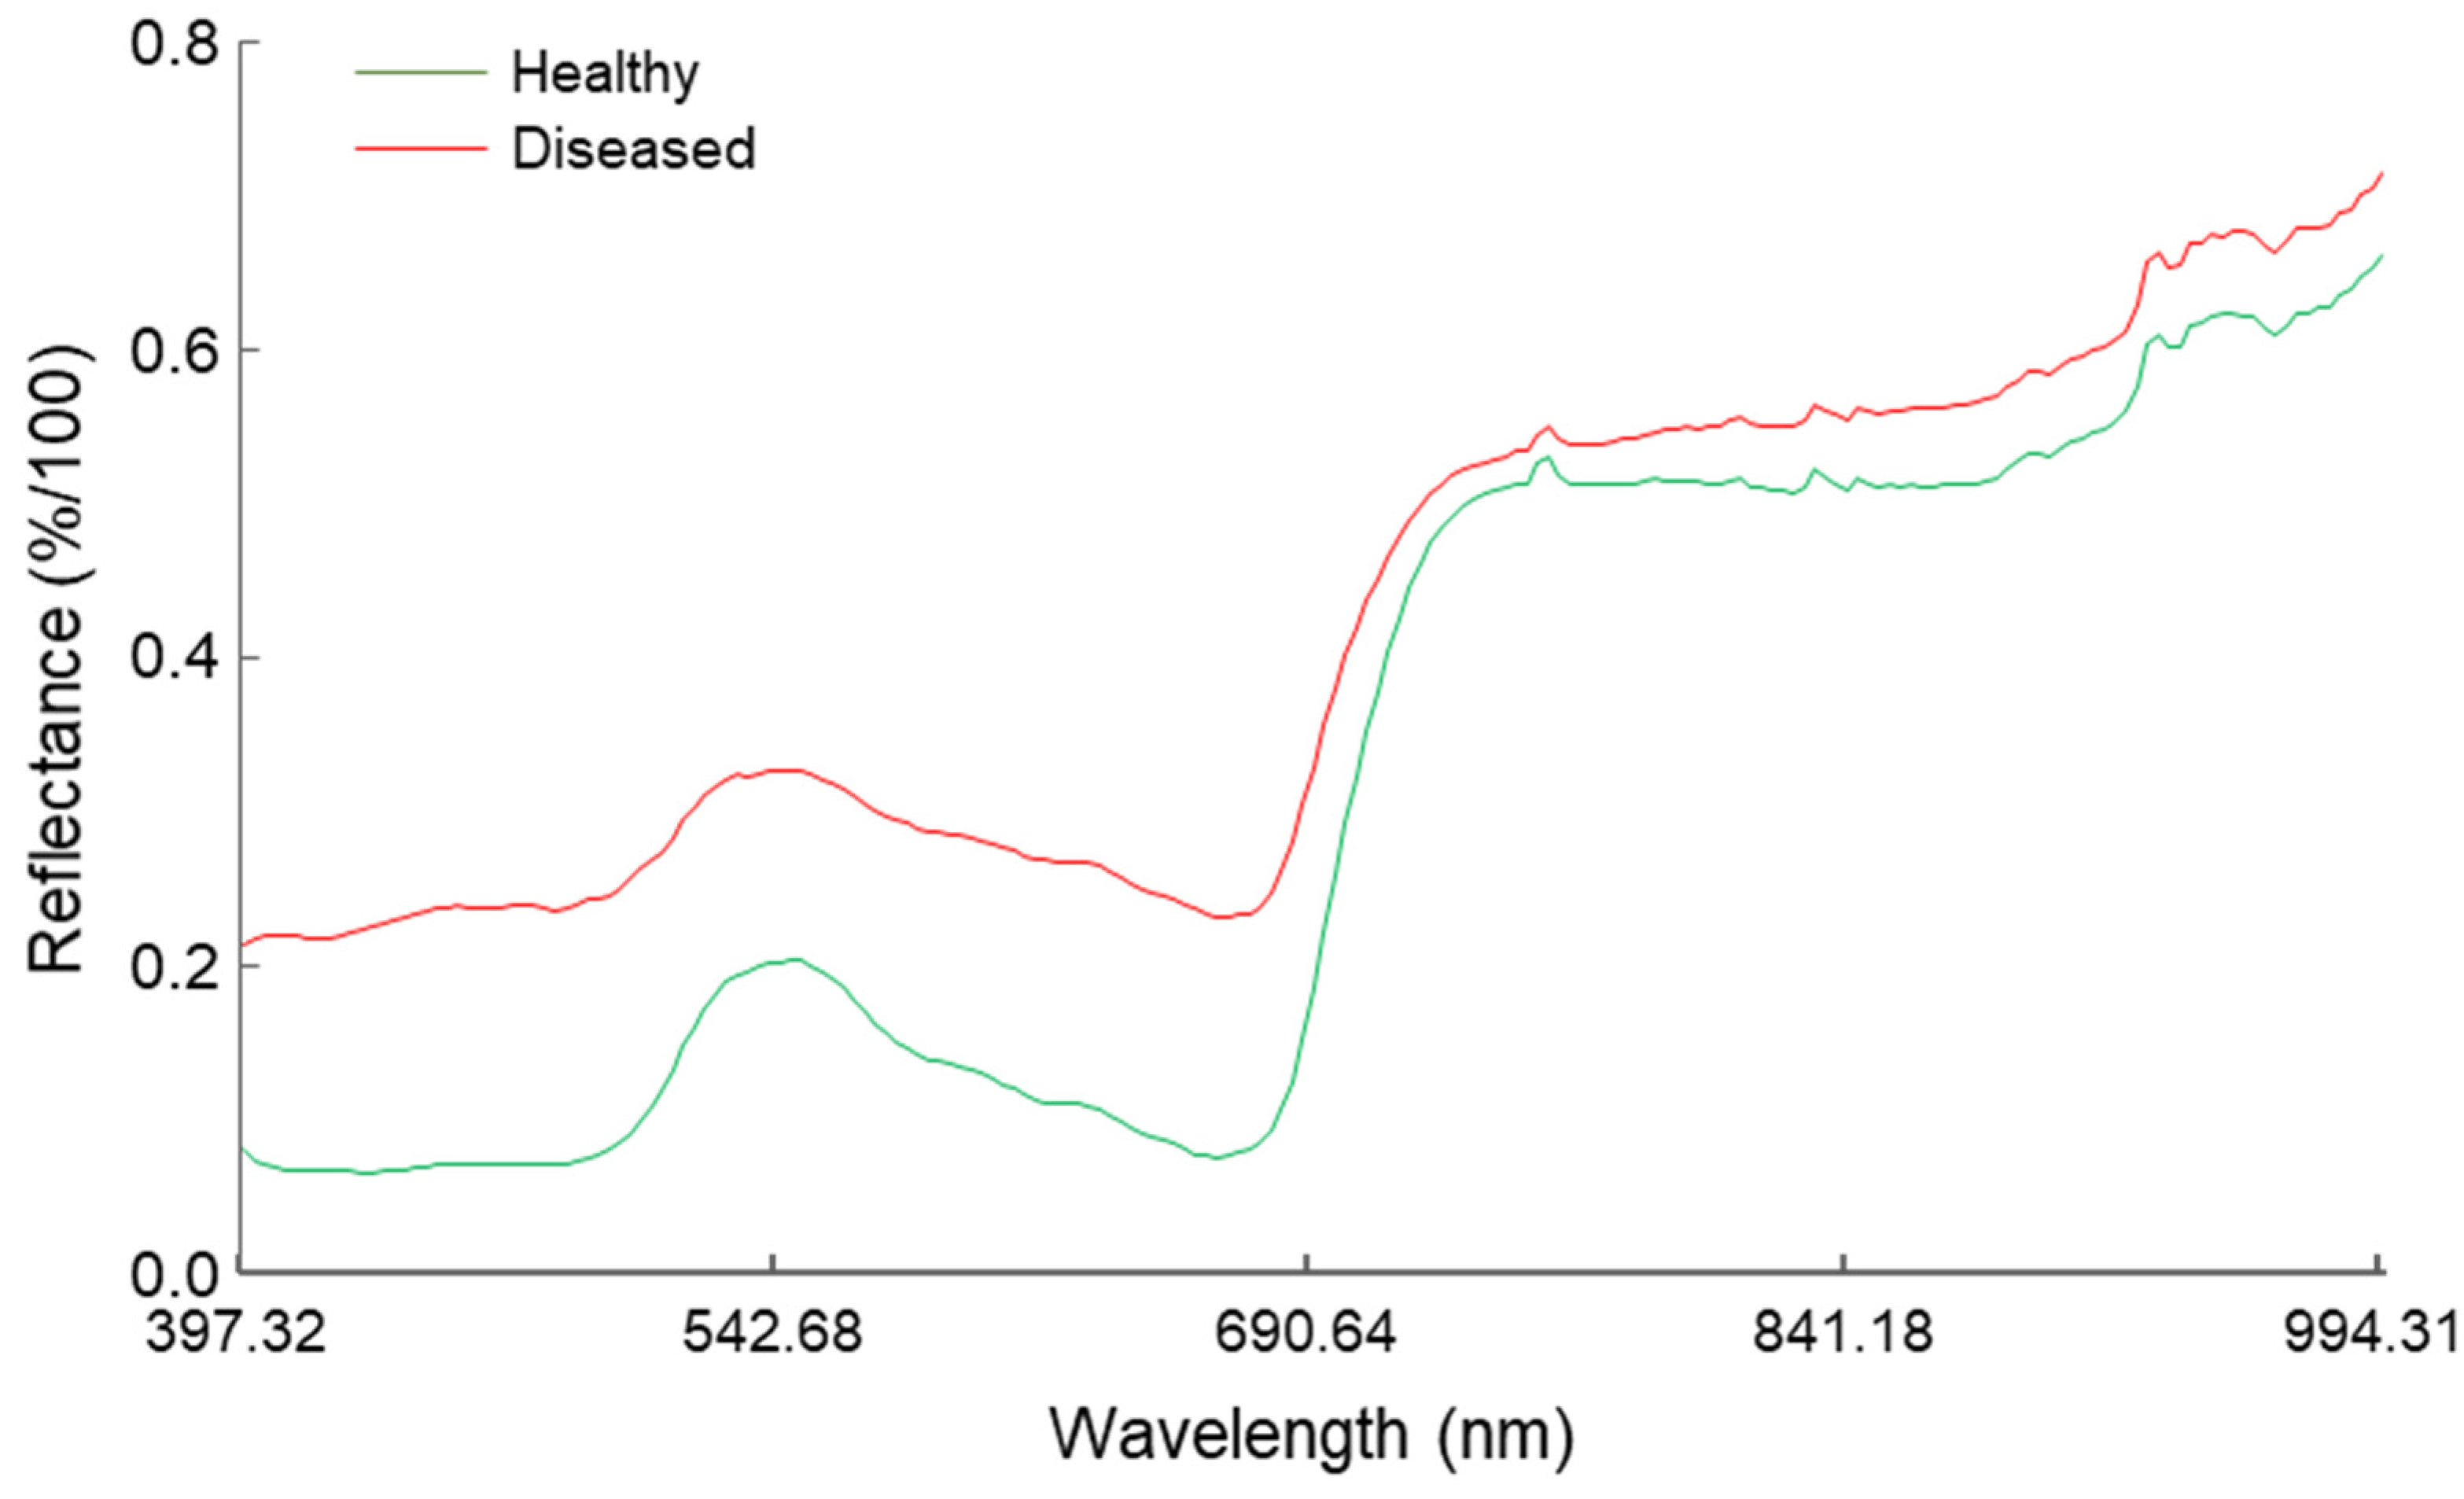
3.2. Hyperspectral Signature of Healthy and Powdery Mildew-Infected Wild Rocket

Reflectance patterns, as illustrated in Figure 6, obtained by means of all pixel-wise spectral data from healthy and powdery mildew-infected samples, show high differences along the whole considered wavelength range, especially in the visible spectral region (VIS) occurring from 400 to 700 nm, in detail at blue and red bands. Increased reflectance for the infected sample was observed in the whole spectrum analyzed. Moreover, soft slope variation occurred in the red-edge, likely due to a slight shift in the healthy and diseased lines’ mutual position.

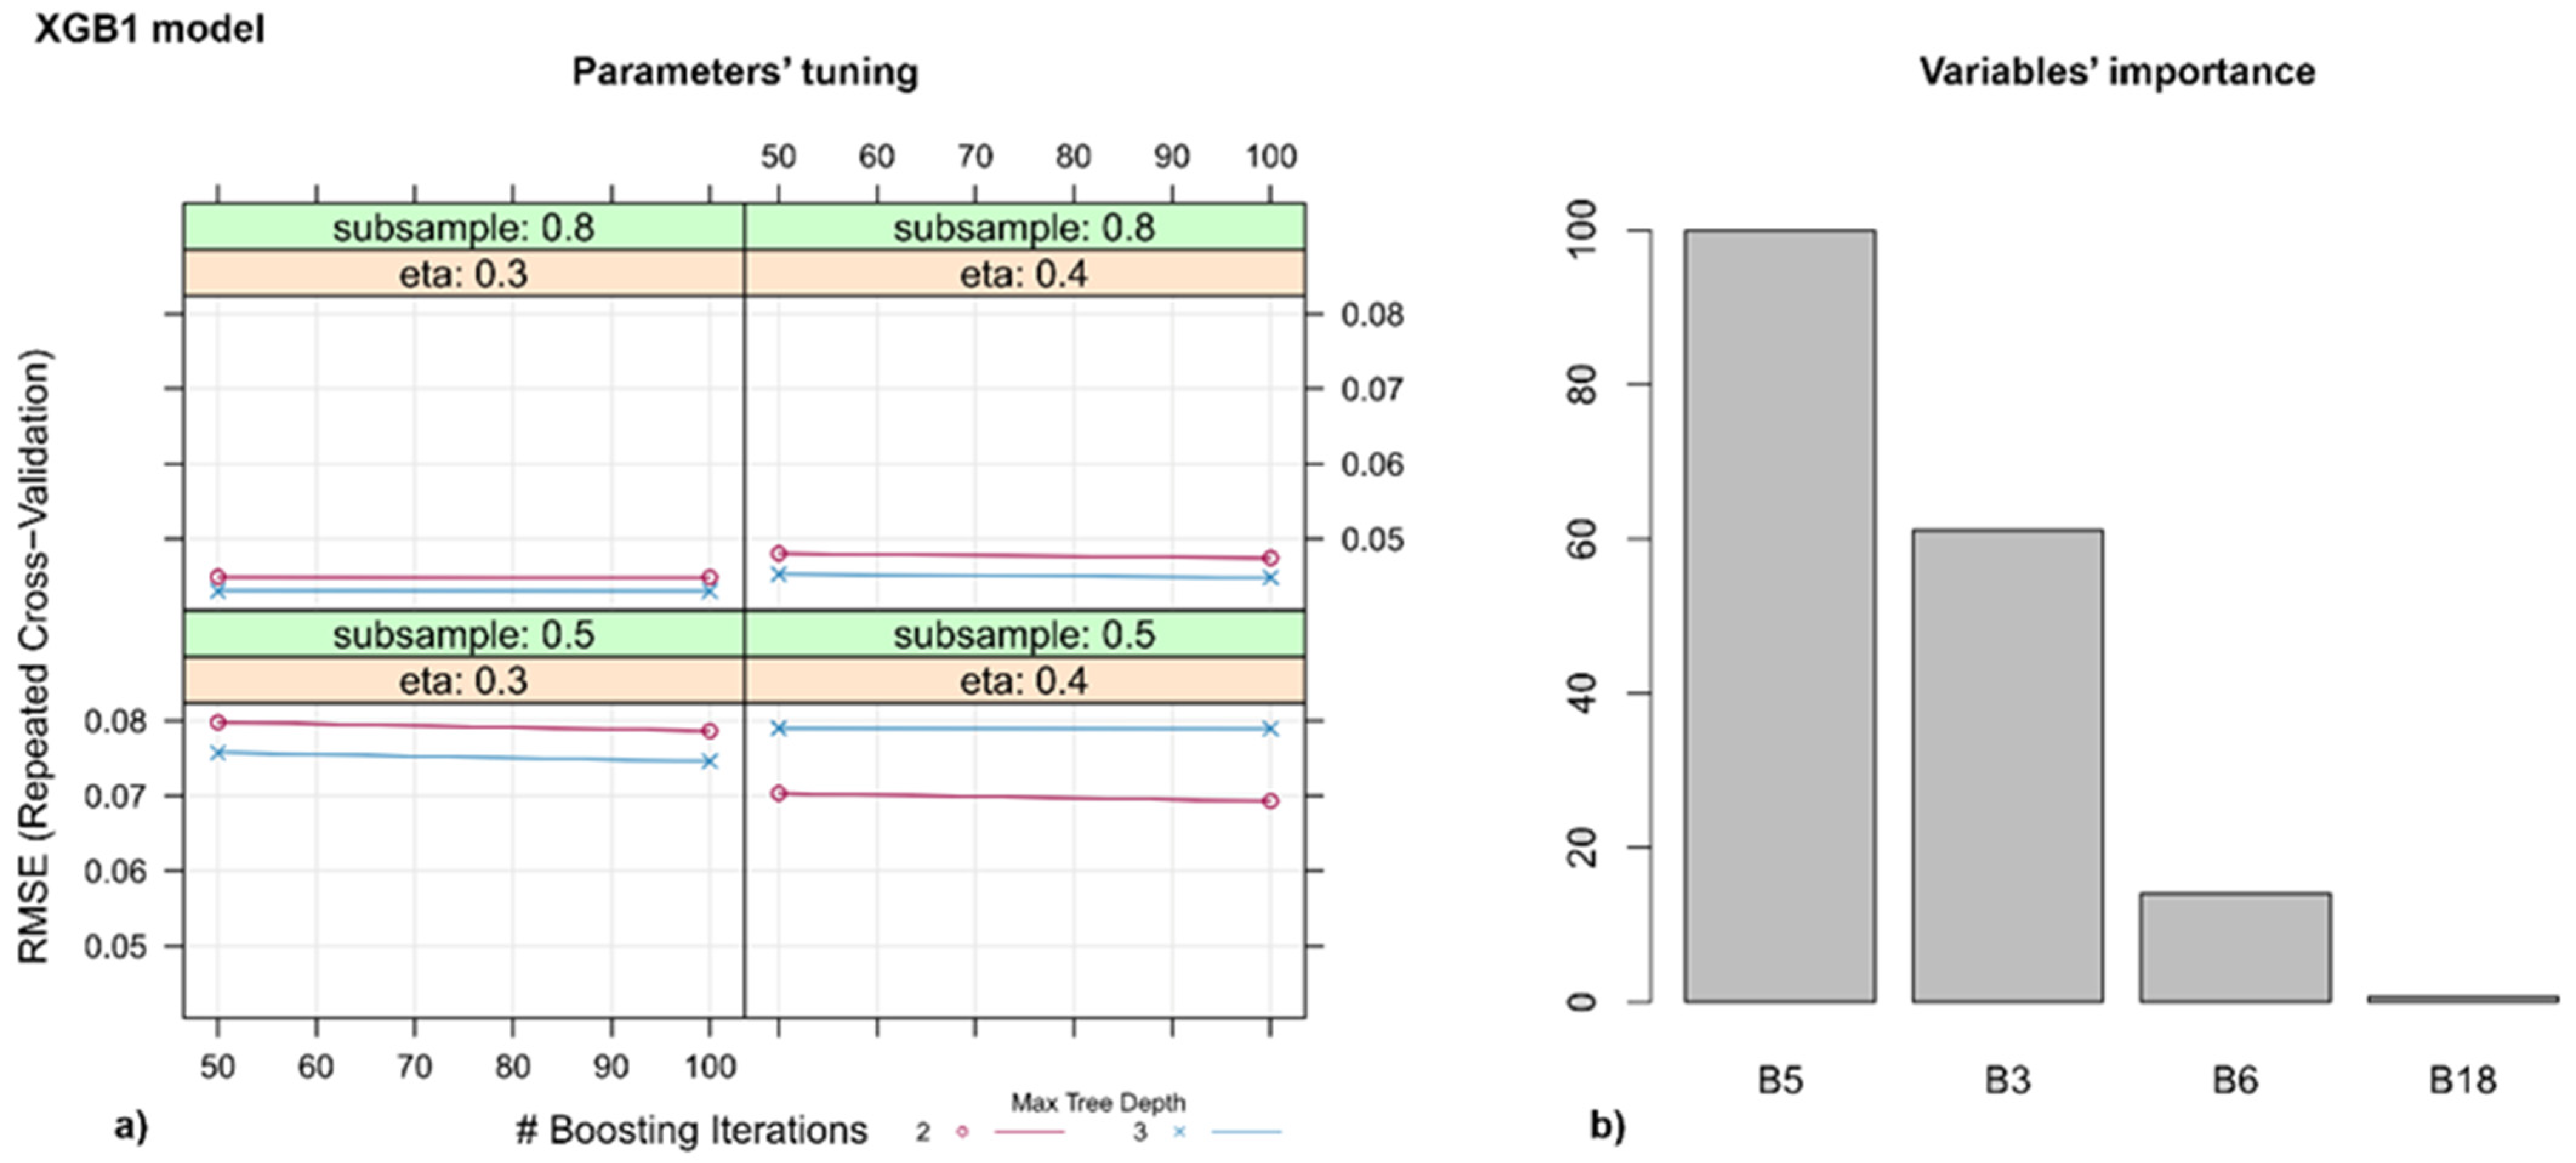
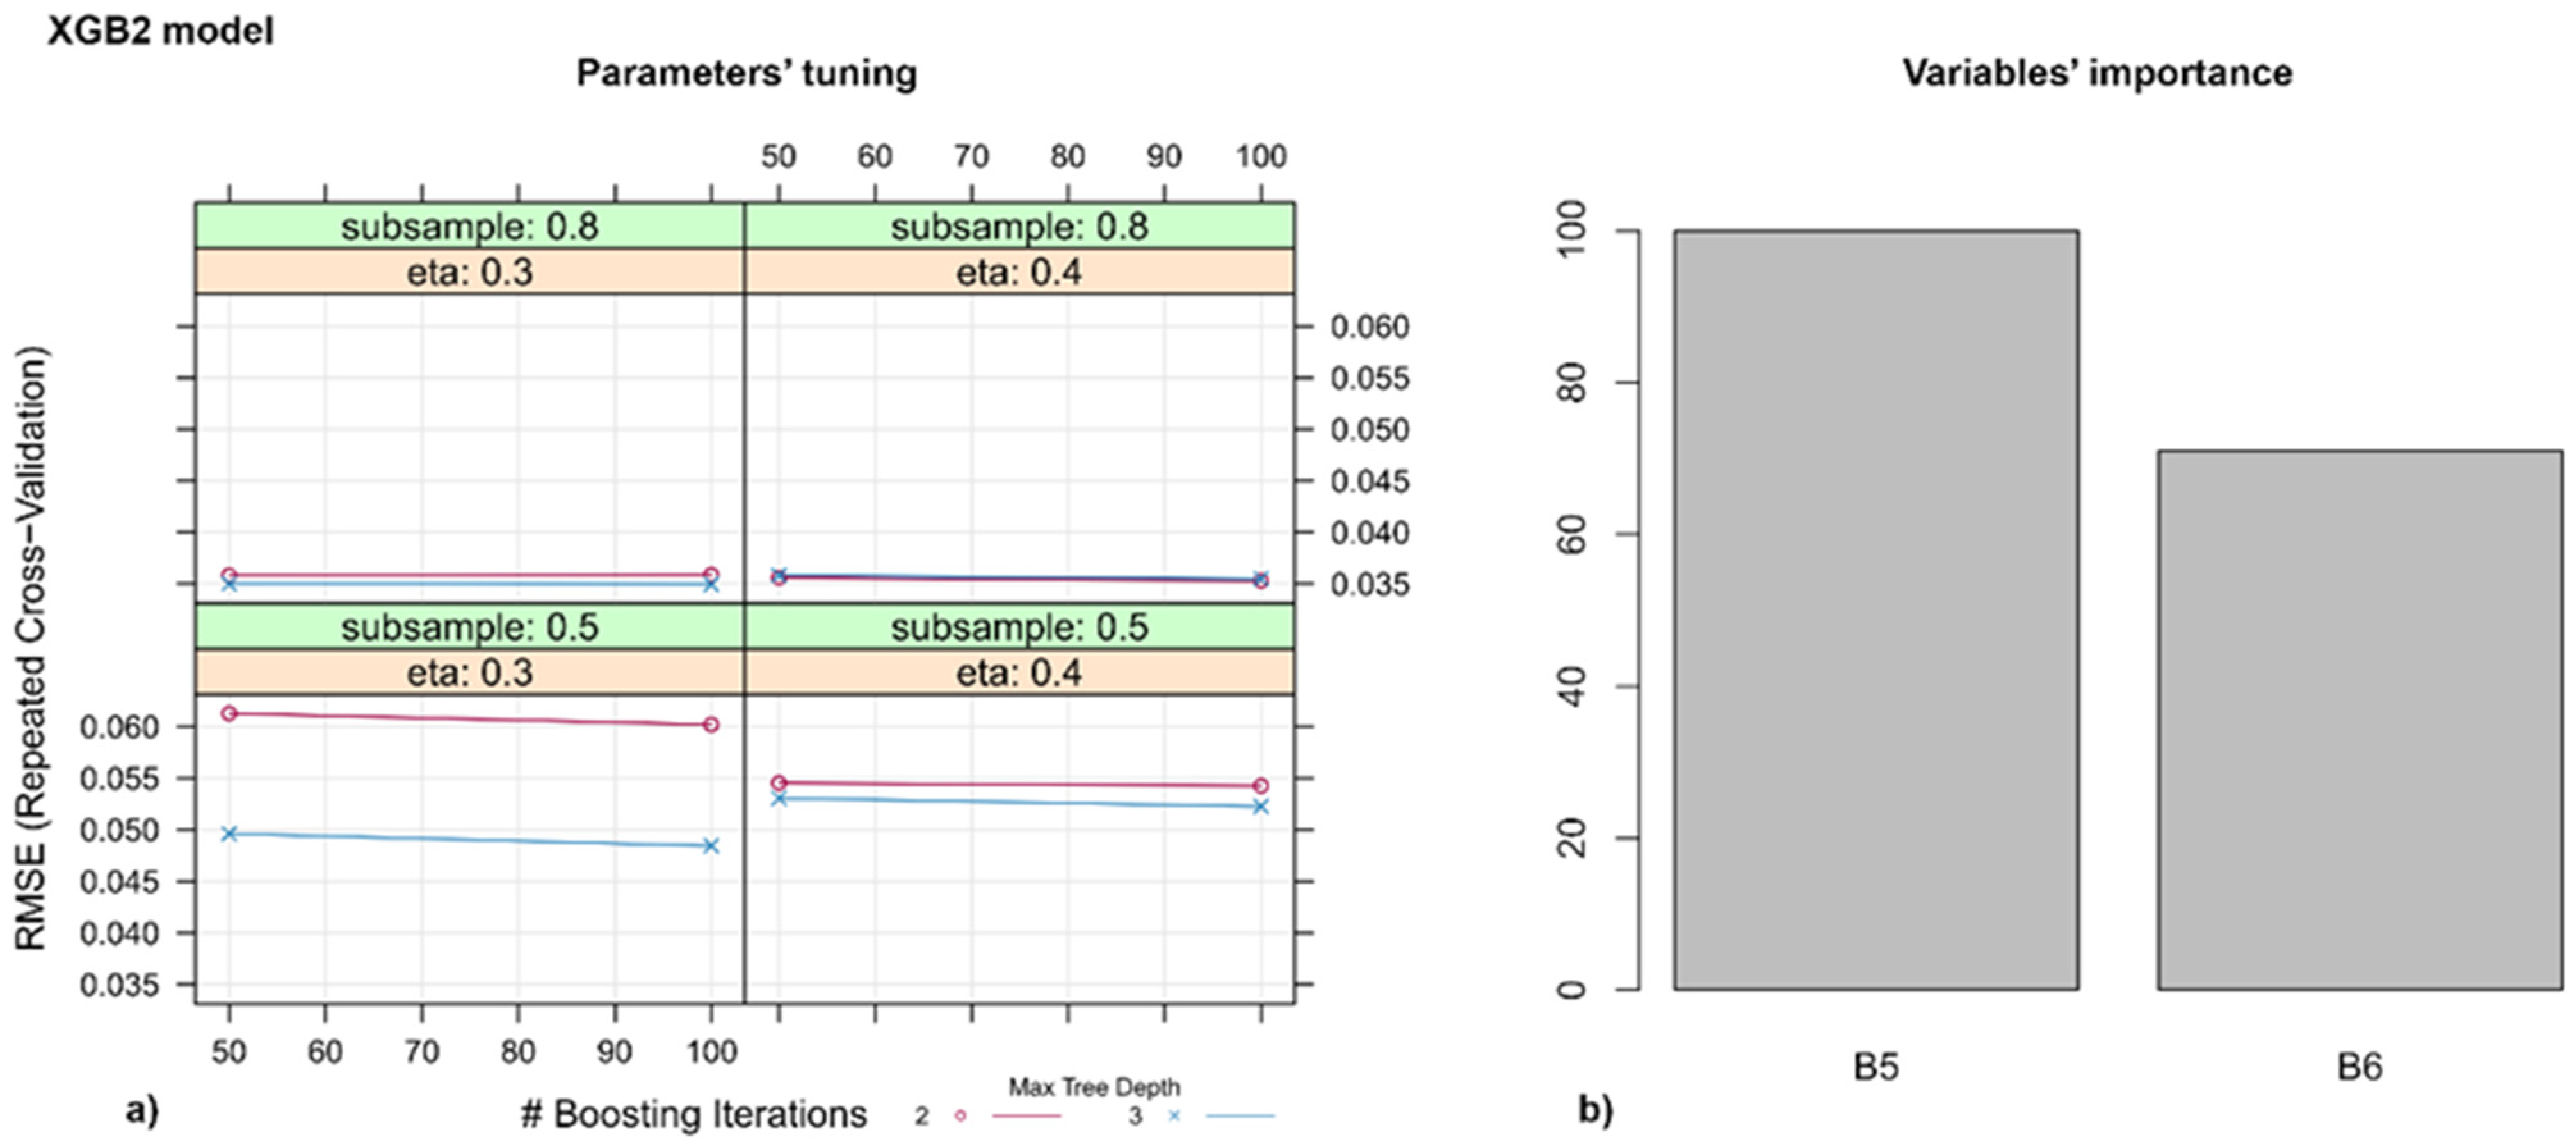
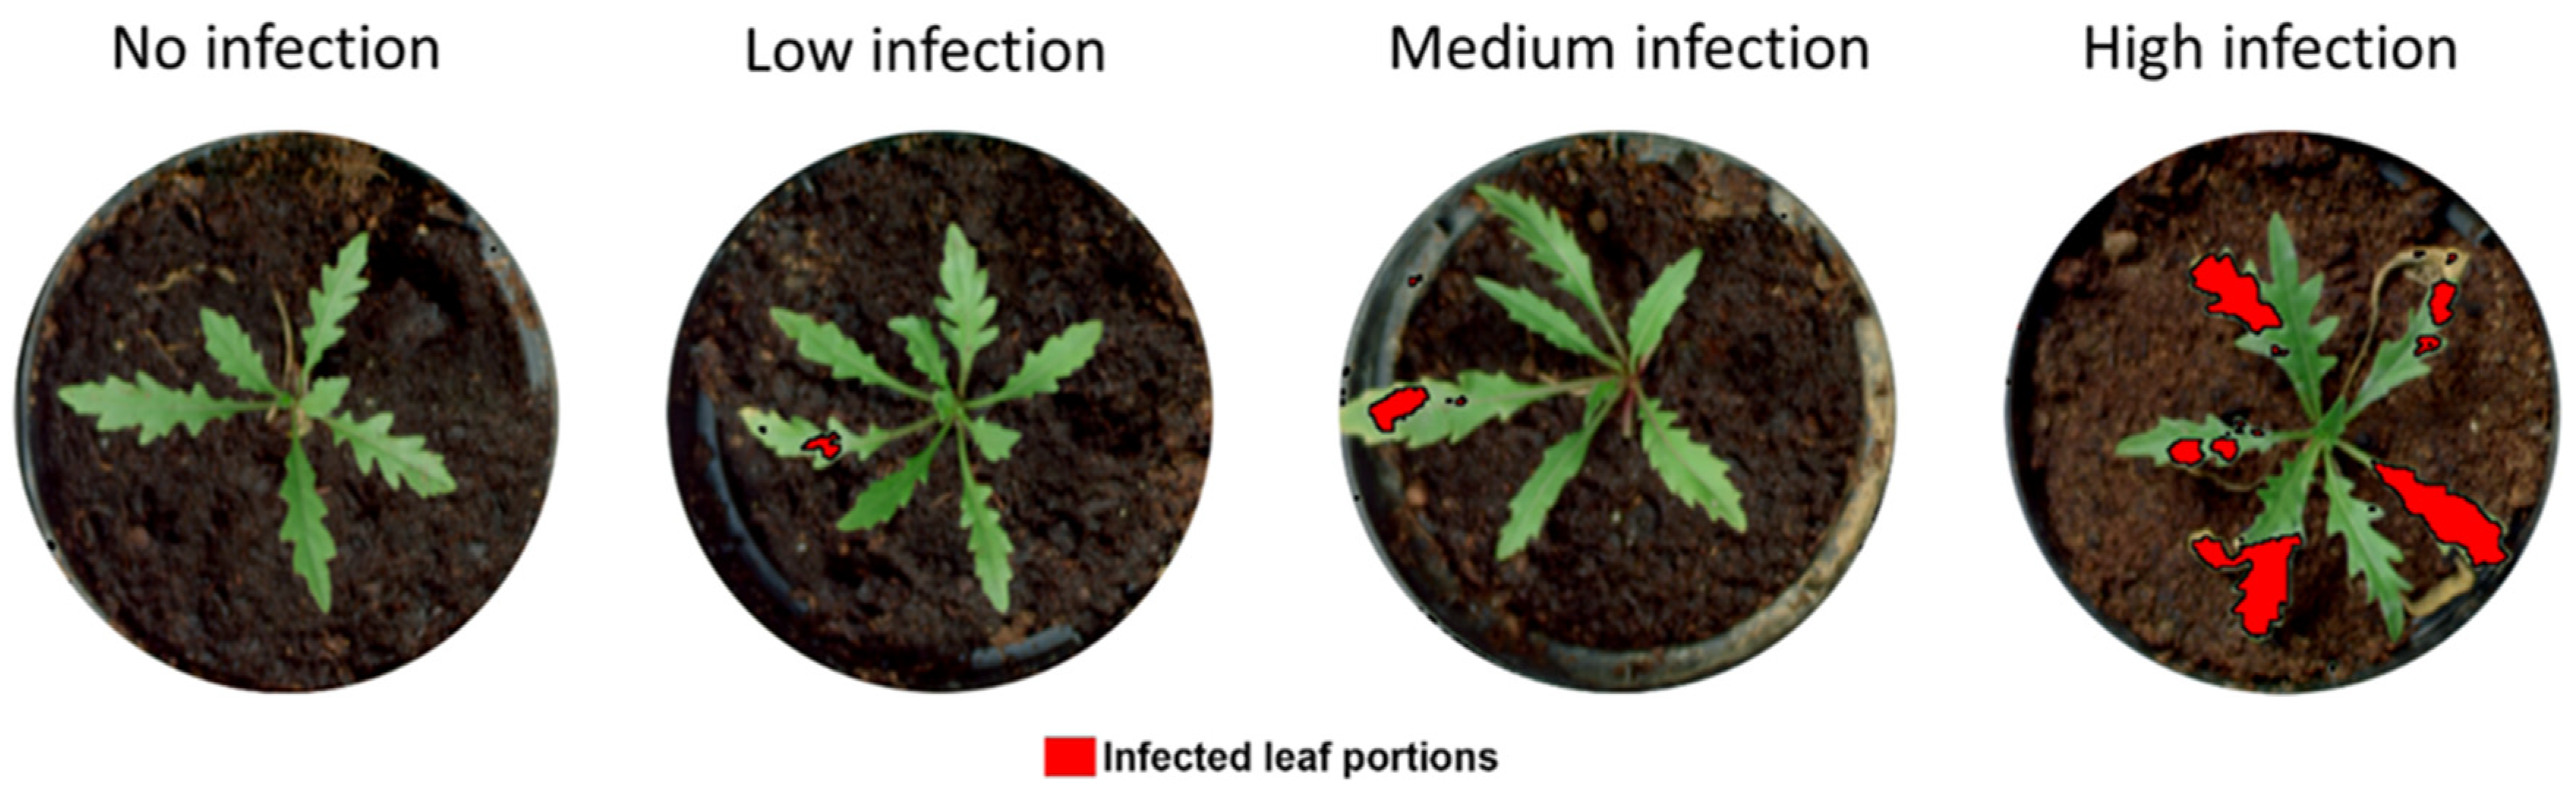
3.3. Models for Identifying Disease Spots on the Leaves

Before performing any predictive modeling procedure, variable pre-processing was performed in order to avoid variance inflation and collinearity of variables, whose main effect is to produce biased estimations. Data were submitted to variable reduction through a machine learning high performing model. RFE algorithm with the RF model and five-fold cross validation and 100 iterations produced a stable model’s coefficient of determination (R2) after considering a number of 61 variables; thereby, this is the number of less-correlated predictors used to train XGBoost algorithm. The detailed results yielded by the RFE algorithm are provided in Table S2 of the Supplementary Materials. The parameters were chosen by means of iterative tuning operations. For training our models (XGB1 and XGB2), we used the tree-based strategy of the XGBoost algorithm. Since we gave a score of 1 to the infected pixels and 0 to the healthy ones, we used a binary logistic function as a loss function to allow the algorithm to measure its predictive performance by means of Root Mean Squared Error values (RMSE).
For both XGB1 and XGB2, we tuned the model’s parameters by repeating 10 times a five-fold cross validation procedure in which we tested any combination of the parameters’ values in order to improve the predictive performance of the model. More specifically, we tested 50 and 100 random trees, the max depth of tree values (tree complexity) 2 and 3, the learning rate values (the model’s strength to overfitting) 0.3 and 0.4, and the fraction of observations to build trees 0.5 and 0.8. We kept constant all other model parameters, such as gamma = 0, portion of all predictors to sample for each new tree = 0.8, and minimum sum of weight for splitting point = 1.
With these parameter settings (Figure 7a), the model, named XGB1, performed very well with an average Root Mean Squared Error (RMSE) of 0.020 (minimum value = 0.014, maximum value = 0.267) with the training dataset. The model’s prediction ability performance test by using an independent testing dataset reached a TSS score of 0.932. As regards the variables in training the XGBoost algorithm, the most important predictors in discriminating healthy from infected samples were (in order of decreasing importance) B5, B3, B6, and B18 (Figure 7b), corresponding respectively to the wavelength of the spectrum: 408.85, 403.09, 411.74, and 446.45 nm, with the remaining variables providing no importance to the model.
Hence, a second model (XGB2) was trained by using the same training and testing datasets, but only with the above-mentioned predictors variables that were shown to be important in the previous XGB1 model. The XGB2 parameters that were chosen for the tuning procedure were the same as in XGB1 model (Figure 8a) and the average RMSE was 0.0345 (minimum value = 0.020, maximum value = 0.203). The model’s performance with an independent testing dataset yielded a TSS score practically identical to the XGB1.
In XGB2, the most important predictor variables were B5 and B6 (Figure 8b). The XGB2 model for sample image disease classification was used (Figure 9), since it showed a predictive performance identical to XGB1.

4. Discussion

Cultivated “wild rocket” is susceptible to many fungal diseases affecting the root system, collar, and/or the canopy, which have to be addressed with fungicidal means since they constitute a dramatic limiting factor in the productive systems. In this study, the occurrence of the powdery mildew typical whitening on the surface of D. tenuifolia leaves was observed. Based on morphological features and molecular analysis, disease was attributed to the fungal pathogen E. cruciferarum. The fungus is responsible of powdery mildew on several Brassicaceae species [44,45,46,47]. In 2004, it has been noticed on Diplotaxis sp. in Turkey [48]. Nicoletti et al. [49] referred to occasional observations of powdery mildew on wild rocket in Italy, indicating Erisyphe cichoracaearum as the causal agent. To the best of our knowledge, this study is the first report of E. cruciferarum as the powdery mildew agent on D. tenuifolia. The pathogen could be favored by greenhouse climatic conditions compatible with powdery mildew development. A literature survey showed that E. cruciferarum can arise on different hosts with medium–high levels of relative humidity (90 to 24%), and air temperatures accounting, on average, around values of 19–25 °C [50,51,52,53]. As the infection progresses, spreading chlorosis, dehydration, and necrosis can reduce the whole plant fitness [54]. Fungal infections can also generally reduce the cold hardiness of plants, increasing frost damage [55].
Since it is considered sporadic on young wild rocket plants, the disease can easily remain undetected; hence, non-destructive high performing methods, such as digital ones, may increase the chance of a quick real-time field identification reducing the possible detrimental impacts of eventual underestimated outbreaks in intensive cultivations.
Hyperspectral image analysis allowed to characterize the spectral response of powdery mildew on wild rocket with the aim to configure an expert system which could accurately distinguish symptomatic from non-symptomatic plants. The infected leaves displayed increased reflectance in the visible and NIR regions, possibly due to the epiphytic fungal colonization [56,57]. Powdery mildew masks the leaf upper page with the fungal structures (such as conidiophores and conidia), thus limiting light absorption by leaf parenchyma and spongy mesophyll, which is ordinarily regulated by the amount of chlorophyll [58], and results in a net increment of the reflectance signal [59]. Accordingly, the red-edge reciprocal position of the healthy and diseased lines is shifted, likely due to secondary effects such as chlorophyll degradation and/or changes in other pigments [60]. In fact, powdery mildew pathogens impact plants by inducing a disease-specific pixel-wise spectral signature, as previously displayed by Mahlein et al. [57] on sugar beet affected by E. betae. As the aim of this study was not only to generate a predictive model for plant disease but also to highlight the most informative input variables for discriminating infected from healthy samples, we developed some strategies in order to produce the best discriminative model with the minimum number of predictor variables. At first, in order to reduce complexity and eliminate redundancy from the high-dimensional hyperspectral dataset, we pre-treated and filtered the spectral bands by means of a recursive strategy based on an RF algorithm. This starting procedure reduced the disease predictive wavelength number by around 98.2%. Then, we recursively performed two consecutive MLA models for healthy/infected samples discrimination. We fed the first model with the predictors selected by the variables’ pre-treatment procedure, then we used the most explanatory variables of this model to feed a second XGBoost algorithm. Interestingly, the two models showed the same predictive performance, allowing us to use the less predictor-rich model to classify the case studies. This important level of simplification can lead to an oligarchic spectral detection of the diseased status that is easier to manage, which has also been proposed by Zhu et al. [61] classifying pre-symptomatic Tobacco mosaic virus-affected Nicotiana tabacum plants. Those narrow-extracted bands may have, in perspective, the potential to be used for cheaper multispectral device applications. In the current study, the procedures we carried out selected four most contributory wavelengths falling in the range of 403–446 nm. Close to this result, using UAV-based hyperspectral imaging and a radial basis function neural network, the significant shift occurring in the spectral information between late-stage powdery mildew-affected squash plants and asymptomatic ones has been condensed in a very restricted number of bands, at 388–390 nm, belonging to the violet-blue range of the spectrum [20]. Violet-blue light (400–495 nm) is involved in a wide range of plant physiological processes, including stomatal conductance regulation and the normal photosynthetic functioning [62] through absorption by chlorophyll a, which transfers energy to the photosystem and makes photosynthesis possible [63]. Therefore, based on our hyperspectral observations, it is conceivable that the developing powdery mildew significantly reduces the functionality of the photoactive pigments in wild rocket leaves. White powdery mildew on wild rocket leaves contrasts sharply with the normal greenness of the species, so these results, which enhance the discriminatory capacity of a few bands, agree with evidence in literature. In agreement with this hypothesis, Zhao et al. [19] efficiently identified wheat/Blumeria graminis-compatible interactions on the basis of the most significant wavelengths, among which there was a responsible band falling into violet-blue light region, as has been identified by pixel-based analytical methods based on principal component analysis (492.7 nm), the RF algorithm (413.3 nm), the and successive projections algorithm (423.9 nm). A specific Blue Index, calculated as the R450-to-R490 simple ratio, has also been designed in order to track the progression of olive canopy decay due to Verticillium wilting [64]. Advances of the current study clarified that as the estimation of pigment concentrations in wild rocket provide information about specific attributes of plant physiology [65], powdery mildew can be indirectly detected with hyperspectral imaging by catching the reduced chlorophyll irradiation.

5. Conclusions

Powdery mildew induces changes in the spectrum of the infected wild rocket leaves, thus enabling the detection of diseases with proximal sensing tools, which sets the stage for new possibilities of disease monitoring. Findings of the present study indicate the potential to boost the powdery mildew detection trough high-performing machine learning modeling relying on very few bands useful to efficiently identify diseased plants. The most explanatory variables identified by our models perfectly agree with the evidence of the plants’ biology.
We carried out this research with the perspective of improving the management efficiency of cultivations with the aim of lowering the chemical pressure on the crop and the environment by means of using digital technologies in the automatized large-scale surveying of the plant health status and their development.

Supplementary Materials

The following are available online at https://0-www-mdpi-com.brum.beds.ac.uk/article/10.3390/agriculture11040337/s1, Table S1: Model features and parameter tuning, Table S2: Predictor variable dimensionality reduction by means of the Recursive Features Selection algorithm.

Author Contributions

Conceptualization, C.P.; methodology, C.P. and F.C.; software, validation, formal analysis, investigation, G.M., N.N. and F.C.; writing—original draft preparation C.P., T.C. and F.C.; writing—review and editing C.P., G.M., N.N., T.C. and F.C.; supervision, project administration, funding acquisition, C.P. All authors have read and agreed to the published version of the manuscript.

Funding

This research was funded by the Italian Ministry of Agriculture, Food and Forestry Policies (MiPAAF), grant number DM 36503.7305.2018 of 20 December 2018 with the AgriDigit project, sub-project Tecnologie digitali integrate per il rafforzamento sostenibile di produzioni e trasformazioni agroalimentari (AgroFiliere).

Institutional Review Board Statement

Not applicable.

Informed Consent Statement

Not applicable.

Data Availability Statement

Data supporting reported results are available, on request, from the corresponding Author.

Conflicts of Interest

The authors declare no conflict of interest.

References

  1. Glawe, D.A. The powdery mildews: A review of the world’s most familiar (yet poorly known) plant pathogens. Annu. Rev. Phytopathol. 2008, 46, 27–51. [Google Scholar] [CrossRef] [PubMed]
  2. Bradshaw, M.; Tobin, P.C. Sequencing herbarium specimens of a common detrimental plant disease (powdery mildew). Phytopathology 2020, 110, 7. [Google Scholar] [CrossRef]
  3. Sambucci, O.; Alston, J.M.; Fuller, K.B.; Lusk, J. The pecuniary and nonpecuniary costs of powdery mildew and the potential value of resistant grape varieties in California. Am. J. Enol. Vitic. 2019, 70, 177–187. [Google Scholar] [CrossRef]
  4. Jee, H.J.; Shim, C.K.; Ryu, K.Y.; Shin, H.D. Symptoms and damages of powdery mildew on leafy lettuce caused by Podosphaera fusca. Res. Plant Dis. 2006, 12, 294–297. [Google Scholar] [CrossRef] [Green Version]
  5. Williamson, C.J.; Smith, W.M. Fungicidal control of powdery mildew and its effect on yield, digestibility and chemical composition of eight forage rape cultivars. J. Agric. Sci. 1986, 107, 385–391. [Google Scholar] [CrossRef]
  6. Asher, M.J.C.; Williams, G.E. Forecasting the national incidence of sugar-beet powdery mildew from weather data in Britain. Plant Pathol. 1991, 40, 100–107. [Google Scholar] [CrossRef]
  7. Penaud, A. Chemical control and yield losses caused by Erysiphe cruciferarum on oilseed rape in France. In Proceedings of the 10th International Rapeseed Congress, Canberra, Australia, 26–29 September 1999; Wratten, N., Salisbury, P.A., Eds.; The Regional Institute Ltd.: Canberra, Australia, 1999. [Google Scholar]
  8. Enright, S.M.; Cipollini, D. Infection by powdery mildew Erysiphe cruciferarum (Erysiphaceae) strongly affects growth and fitness of Alliaria petiolata (Brassicaceae). Am. J. Bot. 2007, 94, 1813–1820. [Google Scholar] [CrossRef] [PubMed]
  9. Vijayakumar, J.; Arumugam, S. Early detection of powdery mildew disease for betelvine plants using digital image analysis. Int. J. Mod. Eng. Res. 2012, 2, 2581–2583. [Google Scholar]
  10. Mahmud, M.S.; Zaman, Q.U.; Esau, T.J.; Chang, Y.K.; Price, G.W.; Prithiviraj, B. Real-time detection of strawberry powdery mildew disease using a mobile machine vision system. Agronomy 2020, 10, 1027. [Google Scholar] [CrossRef]
  11. Baudry, J.; Alomar, O.; Begg, G.; Büren, C.; Chenaux, B.; Elmquist, H.; Flamm, C.W.; Gosme, M.; Guerin, O.; Jeanneret, P.; et al. EIP-AGRI Focus Group Benefits of Landscape Features for Arable Crop Production. 2016. Available online: https://hal.inrae.fr/hal-02800942 (accessed on 10 February 2021).
  12. Franke, J.; Menz, G. Multi-temporal wheat disease detection by multi-spectral remote sensing. Precis. Agric. 2007, 8, 161–172. [Google Scholar] [CrossRef]
  13. Bock, C.H.; Poole, G.H.; Parker, P.E.; Gottwald, T.R. Plant disease severity estimated visually, by digital photography and image analysis, and by hyperspectral imaging. Crit. Rev. Plant Sci. 2010, 29, 59–107. [Google Scholar] [CrossRef]
  14. Behmann, J.; Steinrücken, J.; Plümer, L. Detection of early plant stress responses in hyperspectral images. ISPRS J. Photogramm. Remote Sens. 2014, 93, 98–111. [Google Scholar] [CrossRef]
  15. Ge, Y.; Bai, G.; Stoerger, V.; Schnable, J.C. Temporal dynamics of maize plant growth, water use, and leaf water content using automated high throughput RGB and hyperspectral imaging. Comput. Electron. Agric. 2016, 127, 625–632. [Google Scholar] [CrossRef] [Green Version]
  16. Rouphael, Y.; Spíchal, L.; Panzarová, K.; Casa, R.; Colla, G. High-throughput plant phenotyping for developing novel biostimulants: From lab to field or from field to lab? Front. Plant Sci. 2018, 9, 1197. [Google Scholar] [CrossRef]
  17. Thenkabail, P.S.; Smith, R.B.; De Pauw, E. Hyperspectral vegetation indices and their relationships with agricultural crop characteristics. Remote Sens. Environ. 2000, 71, 158–182. [Google Scholar] [CrossRef]
  18. Paoletti, M.E.; Haut, J.M.; Plaza, J.; Plaza, A. Deep learning classifiers for hyperspectral imaging: A review. ISPRS J. Photogramm. Remote Sens. 2019, 158, 279–317. [Google Scholar] [CrossRef]
  19. Zhao, J.; Fang, Y.; Chu, G.; Yan, H.; Hu, L.; Huang, L. Identification of leaf-scale wheat powdery mildew (Blumeria graminis f. sp. tritici) combining hyperspectral imaging and an SVM classifier. Plants 2020, 9, 936. [Google Scholar] [CrossRef]
  20. Abdulridha, J.; Ampatzidis, Y.; Roberts, P.; Kakarla, S.C. Detecting powdery mildew disease in squash at different stages using UAV-based hyperspectral imaging and artificial intelligence. Biosyst. Eng. 2020, 197, 135–148. [Google Scholar] [CrossRef]
  21. Lin, K.; Gong, L.; Huang, Y.; Liu, C.; Pan, J. Deep learning-based segmentation and quantification of cucumber powdery mildew using convolutional neural network. Front. Plant Sci. 2019, 10, 155. [Google Scholar] [CrossRef] [PubMed] [Green Version]
  22. Pérez-Roncal, C.; López-Maestresalas, A.; Lopez-Molina, C.; Jarén, C.; Urrestarazu, J.; Santesteban, L.G.; Arazuri, S. Hyperspectral imaging to assess the presence of powdery mildew (Erysiphe necator) in cv. Carignan noir grapevine bunches. Agronomy 2020, 10, 88. [Google Scholar] [CrossRef] [Green Version]
  23. Frezza, D.; Logegaray, V.R.; León, A.P.; Harris, M.; Chiesa, A. Rocket (Eruca sativa Mill.) quality affected by preharvest and postharvest factors. Acta Hort. 2010, 875, 357–364. [Google Scholar] [CrossRef]
  24. Buttaro, D.; Renna, M.; Gerardi, C.; Blando, F.; Santamaria, P.; Serio, F. Soilless production of wild rocket as affected by greenhouse coverage with photovoltaic modules. Acta Sci. Pol. Hortorum Cultus 2016, 15, 129–142. [Google Scholar]
  25. Bonasia, A.; Lazzizera, C.; Elia, A.; Conversa, G. Nutritional, biophysical and physiological characteristics of wild rocket genotypes as affected by soilless cultivation system, salinity level of nutrient solution and growing period. Front. Plant Sci. 2017, 8, 300. [Google Scholar] [CrossRef] [PubMed] [Green Version]
  26. Bonasia, A.; Conversa, G.; Lazzizera, C.; Elia, A. Post-harvest performance of ready-to-eat wild rocket salad as affected by growing period, soilless cultivation system and genotype. Postharvest Biol. Technol. 2019, 156, 110909. [Google Scholar] [CrossRef]
  27. Caruso, G.; Parrella, G.; Giorgini, M.; Nicoletti, R. Crop systems, quality and protection of Diplotaxis tenuifolia. Agriculture 2018, 8, 55. [Google Scholar] [CrossRef] [Green Version]
  28. Attanayake, R.N.; Glawe, D.A.; Dugan, F.M.; Chen, W. Erysiphe trifolii causing powdery mildew of lentil (Lens culinaris). Plant Dis. 2009, 93, 797–803. [Google Scholar] [CrossRef] [Green Version]
  29. Pastirčáková, K.; Jankovics, T.; Komáromi, J.; Pintye, A.; Pastirčák, M. Genetic diversity and host range of powdery mildews on Papaveraceae. Mycol. Prog. 2016, 15, 36. [Google Scholar] [CrossRef]
  30. Tamura, K.; Nei, M. Estimation of the number of nucleotide substitutions in the control region of mitochondrial DNA in humans and chimpanzees. Mol. Biol. Evol. 1993, 10, 512–526. [Google Scholar]
  31. Felsenstein, J. Confidence limits on phylogenies: An approach using the bootstrap. Evolution 1985, 39, 783–791. [Google Scholar] [CrossRef]
  32. Alkooranee, J.T.; Liu, S.; Aledan, T.R.; Yin, Y.; Li, M. First report of powdery mildew caused by Erysiphe cruciferarum on Brassica napus in China. Plant Dis. 2015, 99, 1651. [Google Scholar] [CrossRef]
  33. Hijmans, R.J. Raster: Geographic Data Analysis and Modeling. R Package Version 3.4-5. 2020. Available online: https://CRAN.R-project.org/package=raster (accessed on 10 February 2021).
  34. R Core Team. R: A Language and Environment for Statistical Computing; R Foundation for Statistical Computing: Vienna, Austria, 2020; Available online: https://www.R-project.org/ (accessed on 10 February 2021).
  35. Kuhn, M. Caret: Classification and Regression Training. R Package Version 6.0-86. 2020. Available online: https://CRAN.R-project.org/package=caret (accessed on 10 February 2021).
  36. Chen, T.; Guestrin, C. Xgboost: A scalable tree boosting system. In Proceedings of the 22nd ACM Sigkdd International Conference on Knowledge Discovery and Data Mining, San Francisco, CA, USA, 13–17 August 2016; pp. 785–794. [Google Scholar]
  37. Allouche, O.; Tsoar, A.; Kadmon, R. Assessing the accuracy of species distribution models: Prevalence, kappa and the true skill statistic (TSS). J. Appl. Ecol. 2006, 3, 1223–1232. [Google Scholar] [CrossRef]
  38. Purnell, T.J.; Sivanesan, A. Erysiphe cruciferarum. [Descriptions of Fungi and Bacteria]. IMI Descr. Fungi Bact. 1970. [Google Scholar] [CrossRef]
  39. Choi, J.K.; Kim, J.H.; Cho, S.E.; Shin, H.D. First report of powdery mildew caused by Erysiphe cruciferarum on garden cress in Korea. Plant Dis. 2013, 97, 998. [Google Scholar] [CrossRef]
  40. Zhao, H.H.; Xing, H.H.; Liang, C.; Yang, X.Y.; Cho, S.E.; Shin, H.D. First report of powdery mildew caused by Erysiphe cruciferarum on Chinese cabbage in China. Plant Dis. 2014, 98, 421. [Google Scholar] [CrossRef]
  41. Attanayake, R.N.; Glawe, D.A.; McPhee, K.E.; Dugan, F.M.; Chen, W. Erysiphe trifolii—A newly recognized powdery mildew pathogen of pea. Plant Pathol. 2010, 59, 712–720. [Google Scholar] [CrossRef]
  42. Choi, H.W.; Choi, Y.J.; Kim, D.S.; Hwang, I.S.; Choi, D.S.; Kim, N.H.; Lee, D.H.; Shin, H.D.; Nam, J.; Hwang, B.K. First report of powdery mildew caused by Erysiphe cruciferarum on Arabidopsis thaliana in Korea. Plant Pathol. J. 2009, 25, 86–90. [Google Scholar] [CrossRef] [Green Version]
  43. Meeboon, J.; Takamatsu, S. Notes on powdery mildews (Erysiphales) in Thailand II. Erysiphe species on Adoxaceae Anacardiaceae, Apocynaceae, Araliaceae, Aristolochiaceae, Bixaceae, Brassicaceae, Cleomaceae, Convolvulaceae, Cucurbitaceae and Euphorbiacea. Trop. Plant Pathol. 2016, 41, 357–369. [Google Scholar] [CrossRef]
  44. Gunasinghe, N.; You, M.P.; Lanoiselet, V.; Eyres, N.; Barbetti, M.J. First report of powdery mildew caused by Erysiphe cruciferarum on Brassica campestris var. pekinensis, B. carinata, Eruca sativa, E. vesicaria in Australia and on B. rapa and B. oleracea var. capitata in Western Australia. Plant Dis. 2013, 97, 9. [Google Scholar] [CrossRef] [PubMed]
  45. Betz, E.C.; Punja, Z.K. Management of powdery mildew, caused by Erysiphe cruciferarum, on wasabi (Wasabia japonica) plants in British Columbia. Can. J. Plant Pathol. 2020. [Google Scholar] [CrossRef]
  46. Nanjundan, J.; Manjunatha, C.; Radhamani, J.; Thakur, A.K.; Yadav, R.; Kumar, A.; Meena, M.L.; Tyagi, R.K.; Yadava, D.K.; Singh, D. Identification of new source of resistance to powdery mildew of Indian mustard and studying its inheritance. Plant Pathol. J. 2020, 36, 111–120. [Google Scholar] [CrossRef]
  47. Cipollini, D.; Davis, S.; Lieurance, D.; Cipollini, K.; Bahn, V. Biogeographic variation in resistance of the invasive plant, Alliaria petiolata, to a powdery mildew fungus and effect of resistance on competitive dynamics. Biol. Invasions 2020, 22, 1657–1668. [Google Scholar] [CrossRef] [Green Version]
  48. Bahçecioǧlu, Z.; Kabaktepe, S.; Yildiz, B. Microfungi isolated from plants in Kahramanmarafl Province, Turkey. Turk. J. Bot. 2006, 30, 419–434. [Google Scholar]
  49. Nicoletti, R.; Raimo, F.; Miccio, G. Diplotaxis tenuifolia: Biology, production and properties. Eur. J. Plant Sci. Biotechnol. 2007, 1, 36–43. [Google Scholar]
  50. Desai, A.G.; Chattopadhyay, C.; Agrawal, R.; Kumar, A.; Meena, R.L.; Meena, P.D.; Sharma, K.C.; Srinivasa Rao, M.; Prasad, Y.G.; Ramakrishna, Y.S. Brassica juncea powdery mildew epidemiology and weather based forecasting models for India—A case study. J. Plant Dis. Prot. 2004, 5, 429–438. [Google Scholar]
  51. Garibaldi, A.; Bertetti, D.; Gullino, M.L. Outbreak of powdery mildew caused by Erysiphe cruciferarum on spider flower (Cleome hassleriana) in Italy. Plant Dis. 2009, 93, 963. [Google Scholar] [CrossRef]
  52. Vellios, E.; Karkanis, A.; Bilalis, D. Powdery mildew (Erysiphe cruciferarum) infection on camelina (Camelina sativa) under Mediterranean conditions and the role of wild mustard (Sinapis arvensis) as alternative host of this pathogen. Emir. J. Food Agric. 2017, 29, 639–642. [Google Scholar] [CrossRef] [Green Version]
  53. Uloth, M.B.; You, M.P.; Barbetti, M.J. Plant age and ambient temperature: Significant drivers for powdery mildew (Erysiphe cruciferarum) epidemics on oilseed rape (Brassica napus). Plant Pathol. 2018, 67, 445–456. [Google Scholar] [CrossRef]
  54. Adam, L.; Somerville, S.C. Genetic characterization of five powdery mildew disease resistance loci in Arabidopsis thaliana. Plant J. 1996, 9, 341–356. [Google Scholar] [CrossRef] [PubMed]
  55. Paul, N.D.; Ayres, P.G. The impact of a pathogen (Puccinia lagenophorae) on populations of groundsel (Senecio vulgaris) overwintering in the field: I. mortality, vegetative growth and the development of size hierarchies. J. Ecol. 1986, 74, 1069–1084. [Google Scholar] [CrossRef]
  56. Kuckenberg, J.; Tartachnyk, I.; Schmitz-Eiberger, M.; Noga, G. Early detection of leaf rust and powdery mildew infections on wheat leaves by PAM fluorescence imaging. In Proceedings of the 6th European Conference on Precision Agriculture, Skiathos, Greece, 3–6 June 2007; Stafford, J.V., Ed.; Wageningen Academic Publishers: Wageningen, The Netherlands, 2007; pp. 515–521. [Google Scholar]
  57. Mahlein, A.K.; Steiner, U.; Hillnhütter, C.; Dehne, H.W.; Oerke, E.C. Hyperspectral imaging for small-scale analysis of symptoms caused by different sugar beet diseases. Plant Methods 2012, 8, 3. [Google Scholar] [CrossRef] [Green Version]
  58. Tartachnyk, I.; Rademacher, I.; Kühbauch, W. Distinguishing nitrogen deficiency and fungal infection of winter wheat by laser-induced fluorescence. Precis. Agric. 2006, 7, 281–293. [Google Scholar] [CrossRef]
  59. Devadas, R.; Lamb, D.W.; Simpfendorfer, S.; Backhouse, D. Evaluating ten spectral vegetation indices for identifying rust infection in individual wheat leaves. Precis. Agric. 2009, 10, 459–470. [Google Scholar] [CrossRef]
  60. Abu-Foul, S.; Raskin, V.I.; Sztejnberg, A.; Marder, J.B. Disruption of chlorophyll organization and function in powdery mildew-diseased cucumber leaves and its control by the hyperparasite Ampelomyces quisqualis. Phytopathology 1996, 86, 195–199. [Google Scholar] [CrossRef]
  61. Zhu, H.; Chu, B.; Zhang, C.; Liu, F.; Jiang, L.; He, Y. Hyperspectral imaging for presymptomatic detection of tobacco disease with successive projections algorithm and machine-learning classifiers. Sci. Rep. 2017, 7, 4125. [Google Scholar] [CrossRef] [PubMed] [Green Version]
  62. Hogewoning, S.W.; Trouwborst, G.; Maljaars, H.; Poorter, H.; van Ieperen, W.; Harbinson, J. Blue light dose–responses of leaf photosynthesis, morphology, and chemical composition of Cucumis sativus grown under different combinations of red and blue light. J. Exp. Bot. 2010, 61, 3107–3117. [Google Scholar] [CrossRef] [PubMed]
  63. Wang, J.; Lu, W.; Tong, Y.; Yang, Q. Leaf morphology, photosynthetic performance, chlorophyll fluorescence, stomatal development of lettuce (Lactuca sativa L.) exposed to different ratios of red light to blue light. Front. Plant Sci. 2016, 7, 250. [Google Scholar] [CrossRef] [PubMed] [Green Version]
  64. Calderón, R.; Navas-Cortés, J.A.; Lucena, C.; Zarco-Tejada, P.J. High-resolution airborne hyperspectral and thermal imagery for early detection of Verticillium wilt of olive using fluorescence, temperature and narrow-band spectral indices. Remote Sens. Environ. 2013, 139, 231–245. [Google Scholar] [CrossRef]
  65. Hniličková, H.; Hnilička, F.; Martinkova, J.; Kraus, K. Effects of salt stress on water status, photosynthesis and chlorophyll fluorescence of rocket. Plant Soil Environ. 2017, 63, 362–367. [Google Scholar]
Figure 1. Front view of the image acquisition station, equipped with snapshot Specim IQ camera for images in visible and near-infrared spectra, mounted on an ebb-and-flow bench for potted wild rocket cultivation.
Agriculture 11 00337 g001
Figure 2. Daily average of temperature (red) and relative humidity (blue) of air recorded in the greenhouse during the wild rocket cultivation.
Agriculture 11 00337 g002
Figure 3. Healthy and powdery mildew-infected wild rocket.
Agriculture 11 00337 g003
Figure 4. Particular of powdery mildew on a Diplotaxis tenuifolia leaf (a). Conidiophores (b) and conidia (c) of Erysiphe cruciferarum viewed with a light microscope.
Agriculture 11 00337 g004
Figure 5. Phylogenetic tree inferred from partial ITS gene sequences of 22 powdery mildew sequences. The Erysiphe glycines sequence (MN420982.1) was used as the outgroup. The numbers above the branches denote the bootstrap values from 1000 replications. Bootstrap values ≥60% (maximum parsimony and maximum likelihood) and posterior probability ≥95% (Bayesian inference) are shown.
Agriculture 11 00337 g005
Figure 6. Comparison of the hyperspectral reflectance curves of the healthy and infected samples.
Agriculture 11 00337 g006
Figure 7. XGB1 model parameters’ tuning procedure yielded the following optimal setting: 50 boosting iterations, subsample = 0.8, eta = 0.3, and maximum tree depth = 3 (a). The most important variables in explaining the differences between the infected and healthy samples, in order of decreasing importance, are B5 (R408.85 nm), B3 (R403.09 nm), B6 (R411.74 nm), and B18 (R446.45 nm) (b).
Agriculture 11 00337 g007
Figure 8. XGB2 model parameters tuning showing the optimal setting: 50 boosting iterations, subsample = 0.8, eta = 0.3, and maximum tree depth = 3 (a). Variables’ importance for XGB2: B5 (R408.85 nm) and B6 (R411.74 nm) (b).
Agriculture 11 00337 g008
Figure 9. Disease classification by using the XGB2 model on four plants with known status of disease (from completely healthy to completely infected). The red sectors represent the pixels the model identified as infected.
Agriculture 11 00337 g009
Publisher’s Note: MDPI stays neutral with regard to jurisdictional claims in published maps and institutional affiliations.

