Article

Responses of Soil Abiotic Properties and Microbial Community Structure to 25-Year Cucumber Monoculture in Commercial Greenhouses

1
Institute of Plant Protection, Chinese Academy of Agricultural Sciences, Beijing 100193, China
2
School of Food and Agriculture, University of Maine, Orono, ME 04469, USA
*
Author to whom correspondence should be addressed.
These authors contributed equally to this work.
Submission received: 19 February 2021 / Revised: 5 April 2021 / Accepted: 8 April 2021 / Published: 11 April 2021
(This article belongs to the Special Issue Fertilizer Use, Soil Health and Agricultural Sustainability)

Abstract

:
Cucumber monoculture could cause soil salinization and acidification, soilborne diseases, and eventually yield loss. However, after a 25-year monoculture in Wafangdian county, Liaoning province, China, cucumber yields have remained satisfactory. In the present study, we investigated how the soil abiotic and biotic properties, in addition to soil rhizosphere microbial community structure in the greenhouses, could still sustain plant growth after such long-term monoculture production. Soil organic carbon, total nitrogen, and available nitrogen were accumulated significantly after monoculture. Such increasing soil fertility was accompanied by increased soil microbial abundance, which reshaped soil microbial community structure. Both bacterial and fungal diversity, including observed and estimated richness, Heip evenness, and Shannon diversity, decreased significantly, while the monoculture period had a greater influence on fungal diversity than on bacterial diversity. Although the high accumulation of soil nutrients increased soil salinity and acidity, the abundance of potential plant pathogenic fungi did not show an obvious increase. These results indicated that maintaining soil abiotic and biotic properties using organic fertilizers and balanced chemical fertilizers, especially improving potassium fertilizer application, could be useful measurements for the sustainable development of greenhouse vegetable production. In addition, appropriate management strategies should be considered to reduce the potential risk of soil salinization.

1. Introduction

Cucumber (Cucumis sativus) is a major vegetable crop of high economic importance in China and in many other countries. It is commonly cultivated in monoculture systems in commercial greenhouses, mostly in the northern region [1]. However, cucumber monoculture has not been considered a sustainable long-term agricultural practice [2,3,4].
Generally, cucumber monoculture could increase soilborne plant diseases, suppress plant growth, and reduce fruit yield and quality [4,5,6]. Previous experimental studies have revealed that soil microbial community structures in cucumber monoculture systems change [4,7]. For example, the population of Fusarium oxysporum f. sp. cucumerinum, a destructive soilborne pathogen [8], increased significantly in soils with consecutive cucumber monocultures [1,4]. In addition, significant self-suppression is a potential challenge in cucumber monoculture [3,4]. Furthermore, continuous monoculture could alter multiple biotic and abiotic indicators of soil health and then decrease growth and yield significantly [2,6,9,10]. Notably, most of the observations reported above were made under controlled experimental conditions and under seven or less years of monoculture [1,4,6,7].
The monoculture periods in commercial cucumber production facilities in Wafangdian county, Liaoning province, China, are much longer than in the experimental fields, and the yields are still satisfying to growers. For example, there are some greenhouses that have been cropped continuously with cucumber for nearly 30 years with no obvious negative impacts on yield. We hypothesized that the soil’s physical, chemical, and biological properties in the greenhouses would not have been changed significantly.
Under monoculture systems, fertilization is potentially the most important cultivation management measure influencing soil properties [11,12,13]. Over-fertilization is common to ensure high yield under high multiple cropping index in greenhouses [14]. In Wafangdian, farmers generally apply organic fertilizer, including compost and manure from animals such as swine, cow, chicken, and sheep, once a year in summer before planting. Water-soluble fertilizers are applied frequently during the cucumber growth season every one-to-two weeks. Such fertilization strategies are quite different from those adopted under experimental conditions with rational fertilization and environmental control [7]. A previous study reported the acidification and salinization of soil under long-term vegetable cultivation under greenhouse conditions [12]; however, the responses of soil microbial communities to long-term greenhouse cultivation remain poorly understood. The fertilization practices adopted under greenhouse conditions could alter soil properties such as pH, salinity, and carbon (C) content, which are also key factors influencing soil microbial community structure [15,16,17].
In the present study, our aim was to (i) investigate soil abiotic properties and microbial community structure in the rhizosphere under commercial long-term cucumber mono-cropping greenhouses that have not had substantial decreases in yield over the years; and (ii) to evaluate the correlation between soil abiotic and microbial community structure. The finding of the present study could provide key insights to facilitate the sustainability of greenhouse vegetable production.

2. Materials and Methods

2.1. Soil Sampling

Sampling was conducted in Wafangdian county, Dalian city, Liaoning province, China (39°20′ N–40°07′ N, 121°13′ E–122°16′ E). Soil samples were collected from 18 commercial greenhouses in November 2016 when cucumbers (C. sativus, var. Zhongnong No. 26, China Vegetable Seed Technology Co., Ltd., Beijing, China) were at the fruiting stage. The greenhouses had been under cucumber monoculture for a broad range of years: 1, 3, 7, 15, and 25 years, and had not been treated with soil fungicides or fumigants during the entire previous year before we sampled. These greenhouses have similar fertilization management practices. Briefly, 2–3 t/ha of organic fertilizer and 660–1100 kg/ha of chemical nitrogen (N), phosphorus (P), and potassium (K) fertilizers were applied yearly in summer before planting. At least two kinds of organic fertilizers were included, such as compost and manure from chicken, cow, swine, or sheep. Among these organic fertilizers, chicken manure was the most commonly used. Chemical fertilizers were applied at a rate of 180–300 kg/ha of N, 240–400 kg/ha of P2O5, 100–250 kg/ha K2O, respectively. During the growing season, 150–300 kg/ha water-soluble fertilizers, were applied about every ten days each time. Based on cucumber monoculture years (CMY), 18 soil samples were placed into five groups with digital numbers indicating the year of cultivation: CMY1, CMY3, CMY7, CMY15, and CMY25 (Table S1). Four greenhouses fell under each period except CMY1. Only two greenhouses with one-year cucumber monoculture were found in this county and were grouped into CMY1.
In each greenhouse, seven plants were selected across the field in a zigzag pattern and mixed into one composite sample. For each plant, cucumber roots with surrounding soil in the top 15–20 cm were carefully dug up. Soil attached to the root segments within less than 5 mm from the root surface, defined as rhizosphere soil, was collected into sterile plastic bags, stored in a box with dry ice, and transported to the laboratory. The rhizosphere soil was stored at −80 °C until soil DNA extraction for the microbial community test. Bulk soils from the same tillage layers around the plants were collected and composited to determine the soil abiotic properties.

2.2. Soil Abiotic Properties

Bulk soils were sieved through a 2 mm mesh to remove stones, plant roots, and residues, and thoroughly homogenized. The sieved soil was air-dried to determine the soil abiotic properties. Briefly, soil electrical conductivity (EC) was measured (soil:water = 1:5 w/v) at 25 °C using an electrolytic conductivity meter (Leici DJS-1C, Shanghai Yidian Analytical Instrument Co., Ltd., Shanghai, China). Soil pH was determined (soil:water = 1:2.5 w/v) at 25 °C with a glass electrode meter (Leici, PHB-4, Shanghai Yidian Analytical Instrument Co., Ltd.). Soil organic carbon (SOC) was determined using the potassium dichromate external heating method and total nitrogen (N, TN) was measured using the Kjeldahl method [18]. Available nitrogen (AN) was determined using the alkaline hydrolysis method [18]. Total phosphorus (P, TP) and potassium (K, TK) were measured by first digesting the soil using the high-temperature melting method with sodium hydroxide and the concentrations detected using the molybdenum blue method and flame photometry, respectively [18].

2.3. Soil DNA Extraction and Quantitative PCR

Total soil DNA was extracted from homogenized rhizosphere soil samples using the FastDNA SPIN Kit for Soil (MP Biomedicals, Solon, OH, USA) according to the manufacturer’s instruction. For each soil sample, DNA extraction was carried out in triplicate and then mixed into one. The DNA integrity was examined on a 1% agarose gel. DNA concentration and the A260/280 and A260/230 ratios were determined using a spectrophotometer (NanoDrop2000, Thermo Fisher Scientific, Wilmington, DE, USA). Extracted DNA was stored at −20 °C until use.
Total populations of bacterial and fungal communities were estimated using SYBR Green qPCR assays with primer sets of 338f/518r [6] and 817F/1196R [19] targeting bacterial 16S and fungal 18S rDNA genes, respectively. The qPCR assay was conducted using an IQ5 quantitative PCR system (Bio-Rad Lab, Hercules, CA, USA) in a 25 μL volume containing 12.5 μL 2× SYBR Premix Ex Taq™ (Takara, Dalian, China), 1 μL of each 10 mM primer, 1 μL of standard or extracted soil DNA, and 9.5 μL of double distilled water.
The PCR conditions were pre-denaturing at 95 °C for 30 s, followed by 41 cycles of denaturing at 95 °C for 5 s, annealing at 56 °C for 30 s for bacterial 16S rDNA gene or 50 °C for 30 s for fungal 18S region, extension at 72 °C for 30 s, detection of fluorescence at 80 °C for 6 s, and a final elongation at 72 °C for 10 min. Melting curve conditions were: 81 cycles from 55.0 °C to 95.0 °C with a temperature rise of 0.5 °C every 10 s.
Standard curves were generated using 10-fold dilution series of plasmids containing the 16S rRNA or 18S rRNA gene regions amplified from soil samples. Double-distilled water was used as the negative control. All amplifications were performed in triplicate. The threshold cycle (Ct) values obtained for each sample were compared with the standard curve to determine the initial copy number of the target genes. Melting curve analyses were performed to confirm that the amplified products were the appropriate sizes.

2.4. MiSeq Sequencing

For bacterial amplification, primer pair 338F/806R was used to target the V3–V4 hypervariable regions of 16S rDNA genes with the expected product sizes of 468 bp [20]. For fungal amplification, the primer pair ITS1F/ITS2R was used to target the internal transcription spacer (ITS) regions, with expected product sizes of 300 bp [21]. The primers were modified with an eight-base barcode at the 5′ end, to generate PCR products with unique barcodes for each sample.
All PCR reactions were carried out in triplicate in 20.0 μL reactions with 4 μL of 5× FastPfu buffer, 0.4 μL FastPfu DNA polymerase (TransGen AP221-02, Beijing, China), 2.0 μL of 2.5 mM deoxynucleotide triphosphates, 0.8 μL of 5 μM forward and reverse primers, 0.2 μL of bovine serum albumin and approximately 10 ng template DNA, and then made up to 20 μL with double-distilled water. Each reaction was performed in ABI GeneAMP 9700 PCR system (Applied Biosystems, Foster City, CA, USA), according to the following protocol: thermal cycling consisted of an initial denaturation at 94 °C for 3 min, followed by 35 cycles of denaturation at 95 °C for 30 s, annealing at 55 °C for 30 s, and elongation at 72 °C for 45 s, with a final extension at 72 °C for 10 min. Reactions without template DNA were used as the negative control.
The PCR products were examined by electrophoresis in a 2% agarose gel and purified using the AxyPrep DNA Gel Extraction Kit (Axygen Biosciences, Union City, CA, USA) and quantified using QuantiFluor™-ST fluorometer (Promega, WI, USA). Equal amounts of PCR products from each sample were combined into a single tube and sequenced on an Illumina Miseq platform (PE250for fungi, PE300 for bacteria, Illumina, San Diego, CA, USA). The sequence reads were deposited in the Sequence Read Archive at the National Centre for Biotechnology Information (NCBI) under accession No: PRJNA526607 (https://0-www-ncbi-nlm-nih-gov.brum.beds.ac.uk/sra/PRJNA526607 (accessed on 12 March 2019)).

2.5. Statistical Analyses

Raw sequences from 18 soil samples were demultiplexed and quality filtered using QIIME v1.17 (http://qiime.org (accessed on 20 May 2017)) according to the procedures in a previous study [4]. Operational taxonomic units (OTUs) were clustered with a 97% similarity cut-off using UPARSE v7.1 (http://drive5.com/uparse/ (accessed on 22 May 2017)) and chimeric sequences were identified and removed using UCHIME [22]. The taxonomy of each 16S rRNA gene sequence was analyzed using the Ribosomal Database Project Classifier (http://rdp.cme.msu.edu/ (accessed on 3 June 2017)) against the Silva (Release128, http://www.arb-silva.de (accessed on 3 June 2017)) 16S rRNA database using a confidence threshold of 70%. The ITS gene sequences were aligned against the Unite (Release 7.0 http://unite.ut.ee/index.php (accessed on 3 June 2017)) database for fungi, and clustered into different taxonomic levels at the 70% threshold. Sequences affiliated to Cyanobacteria/Chloroplast or mitochondria were not considered in further analyses.
Alpha diversity indices, including observed richness (Sobs, the number of distinct OTUs observed per sample), Chao1 estimated community richness (Chao), Heip’s metric of community evenness (Heip), and Shannon’s diversity (Shannon) were calculated using Mothur [23]. To minimize the impact of read count variation in different samples, the sequences were subsampled randomly at the same sequence depth (based on the least abundant sequences in all samples) prior to alpha diversity analysis.
Principal coordinates analysis (PCoA) was used to compare beta diversity between samples based on the Bray–Curtis distance matrix. This was performed in R v3.4.3 (https://www.r-project.org/ (accessed on 21 March 2018)) using the “ape” package [24]. The results of the detrended correspondence analysis revealed that bacterial or fungal community composition were influenced by soil factors, so that redundancy analysis (RDA) and canonical-correlation analysis (CCA) were performed. RDA was performed followed using permutation tests to test the contribution and significance of the selected abiotic variables on the microbial communities. This was followed by a forward selection procedure with double-stopping criterion, an adjusted R2, and α < 0.05 to generate parsimonious models and identify the most relevant variables. The significance of RDA models was tested using analysis of variance based on 999 permutations using the “vegan” package in R v3.4.3. The CCA was also performed in R v3.4.3 using the “vegan” package. Correlation analyses were tested using “psych” package in R v3.4.3.
The original relative abundance OTU tables (presented as percentages) combined with total bacterial and fungal quantities (based on quantitative PCR results) were used to calculate the absolute abundances of all the OTUs [25]. FUNguild (http://www.stbates.org/guilds/app.php (accessed on 8 November 2018)) was used to assign potential fungi functions [26]. Total OTUs and Fusarium spp. classified into plant pathogen categories were analyzed.

3. Results

3.1. Soil Properties

Key soil properties changed significantly with cropping years. Excluding pH and TK, the EC, SOC, TN, AN, and TP were significantly higher in monoculture soils than in the initial soils, and continued to increase as the cropping years were extended (Table 1). The data for each soil sample are presented in Table S1. The lowest C/N ratio was 7.56, in CMY1, and increased to 9.37 in CMY7. However, the highest pH was 6.23, in CMY1, and decreased to 4.80 in CMY7. There was a significant negative correlation between the C/N ratio and pH (r = −0.435, p = 0.036), while there was no significant difference in TK among all samples. EC values increased dramatically, 1.54- to 5.42-fold, after monoculture from 3 to 25 years. After replanting, key soil nutrients, including SOC, TN, and AN, exhibited similar increasing trends, increasing 1.32–4.60-fold, 1.44–4.23-fold, and 1.37–4.18-fold, respectively. In addition, long-term monoculture increased soil TP when compared to the levels in the initial soil, with 1.26–2.62-fold increases. Notably, the EC values were highly positively correlated with soil SOC (r = 0.750, p < 0.01), TN (r = 0.706, p < 0.01) and AN (ρ = 0.839, p < 0.01).

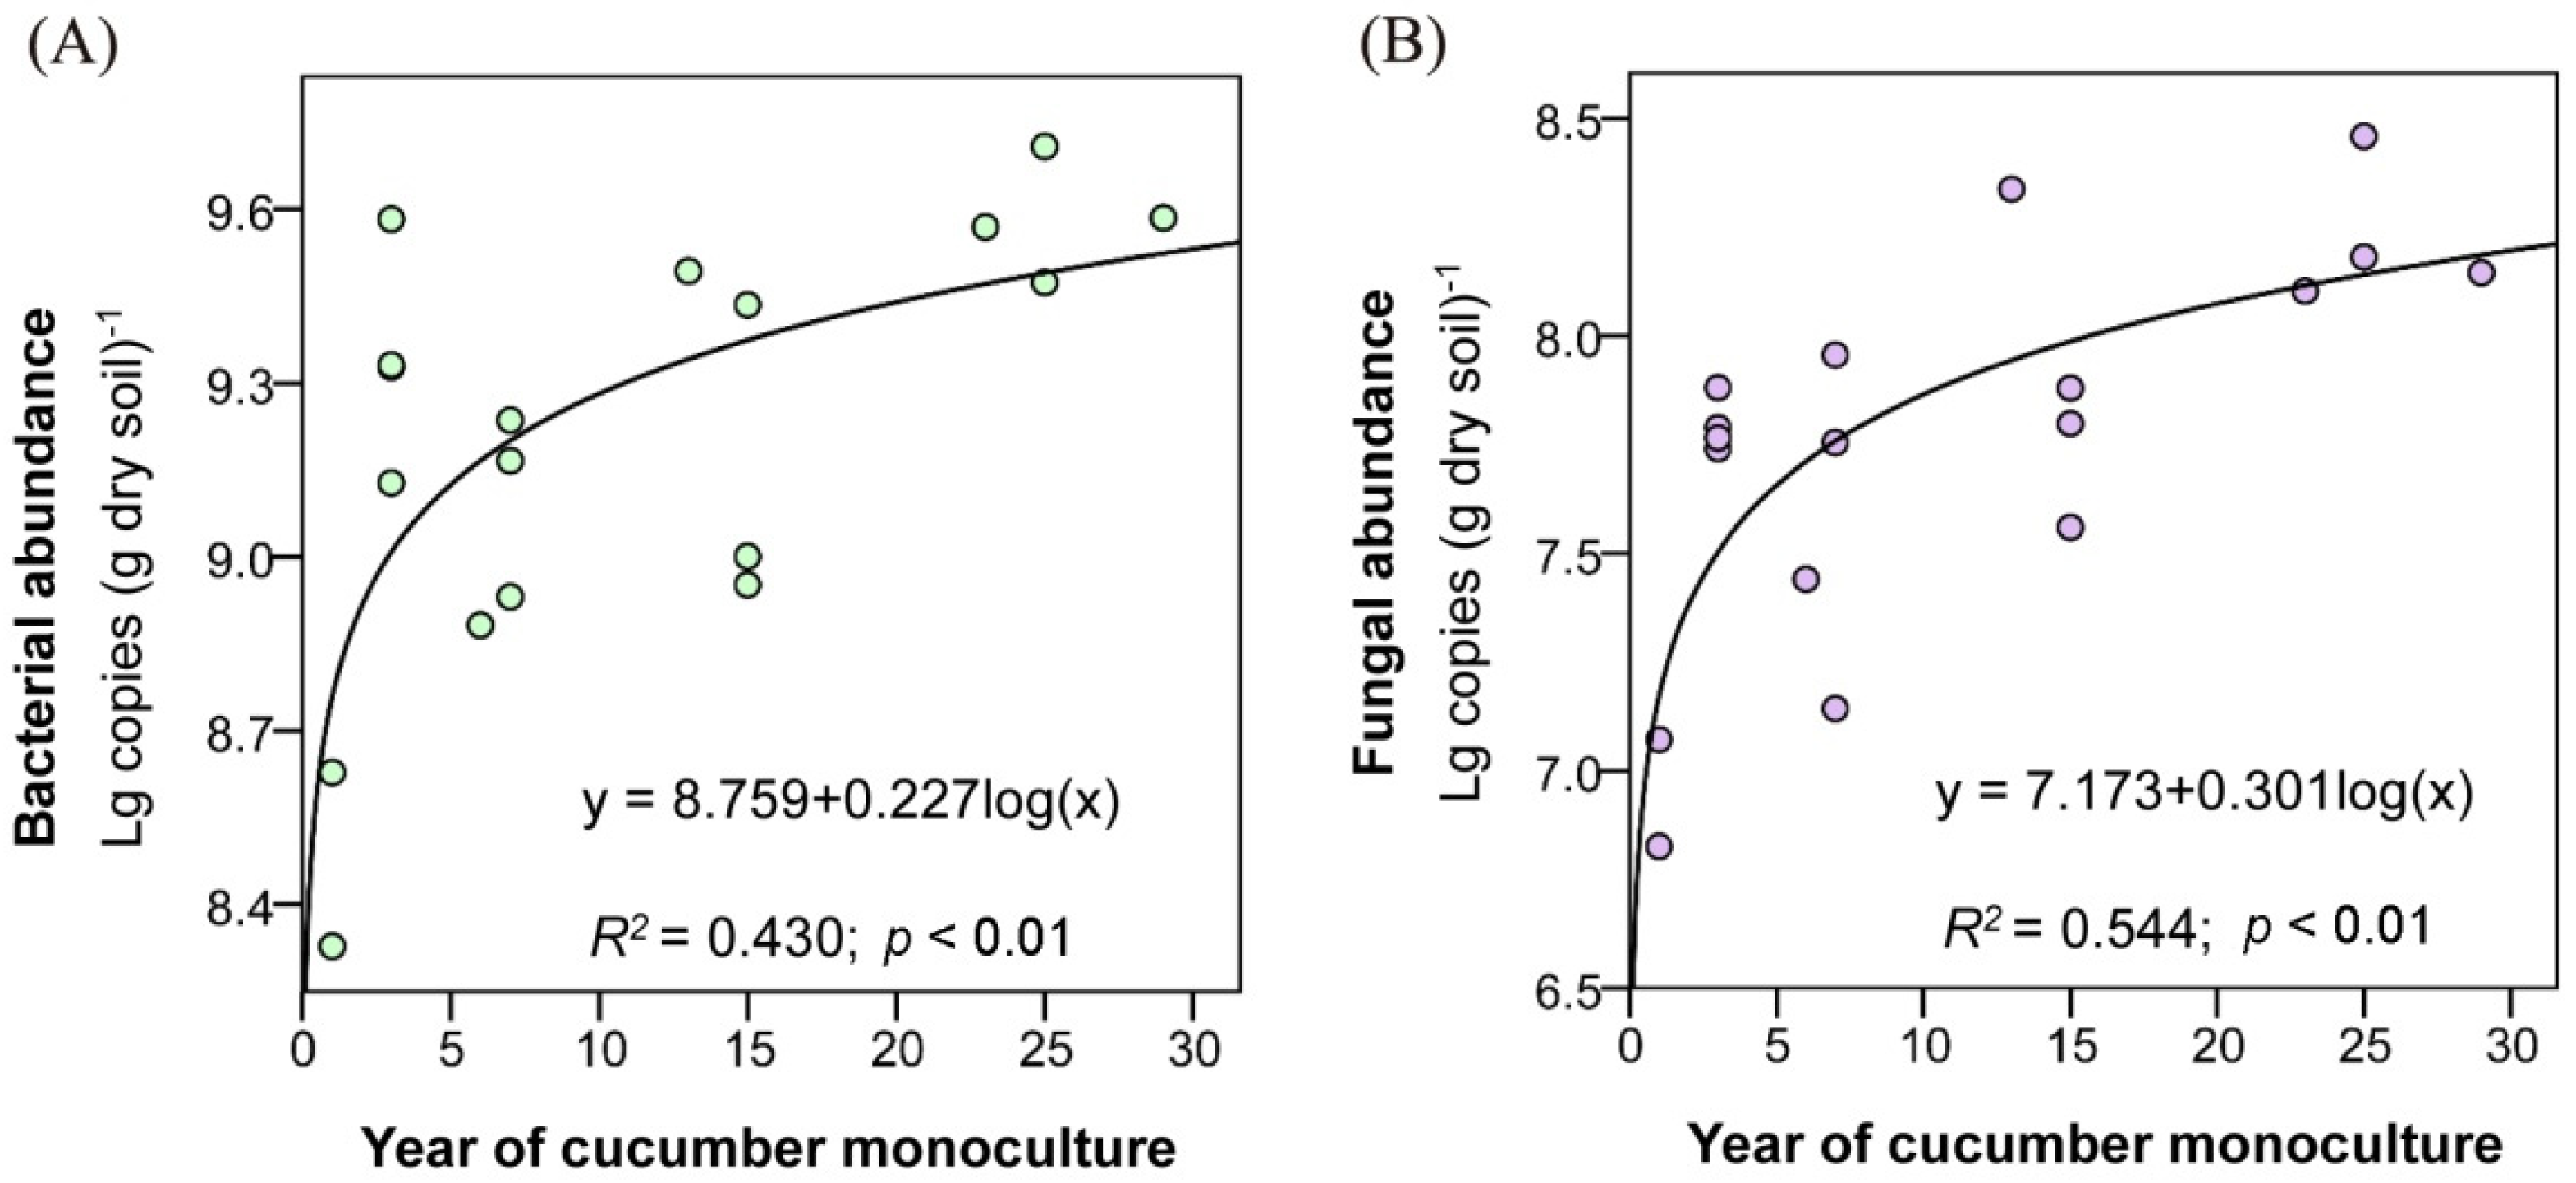
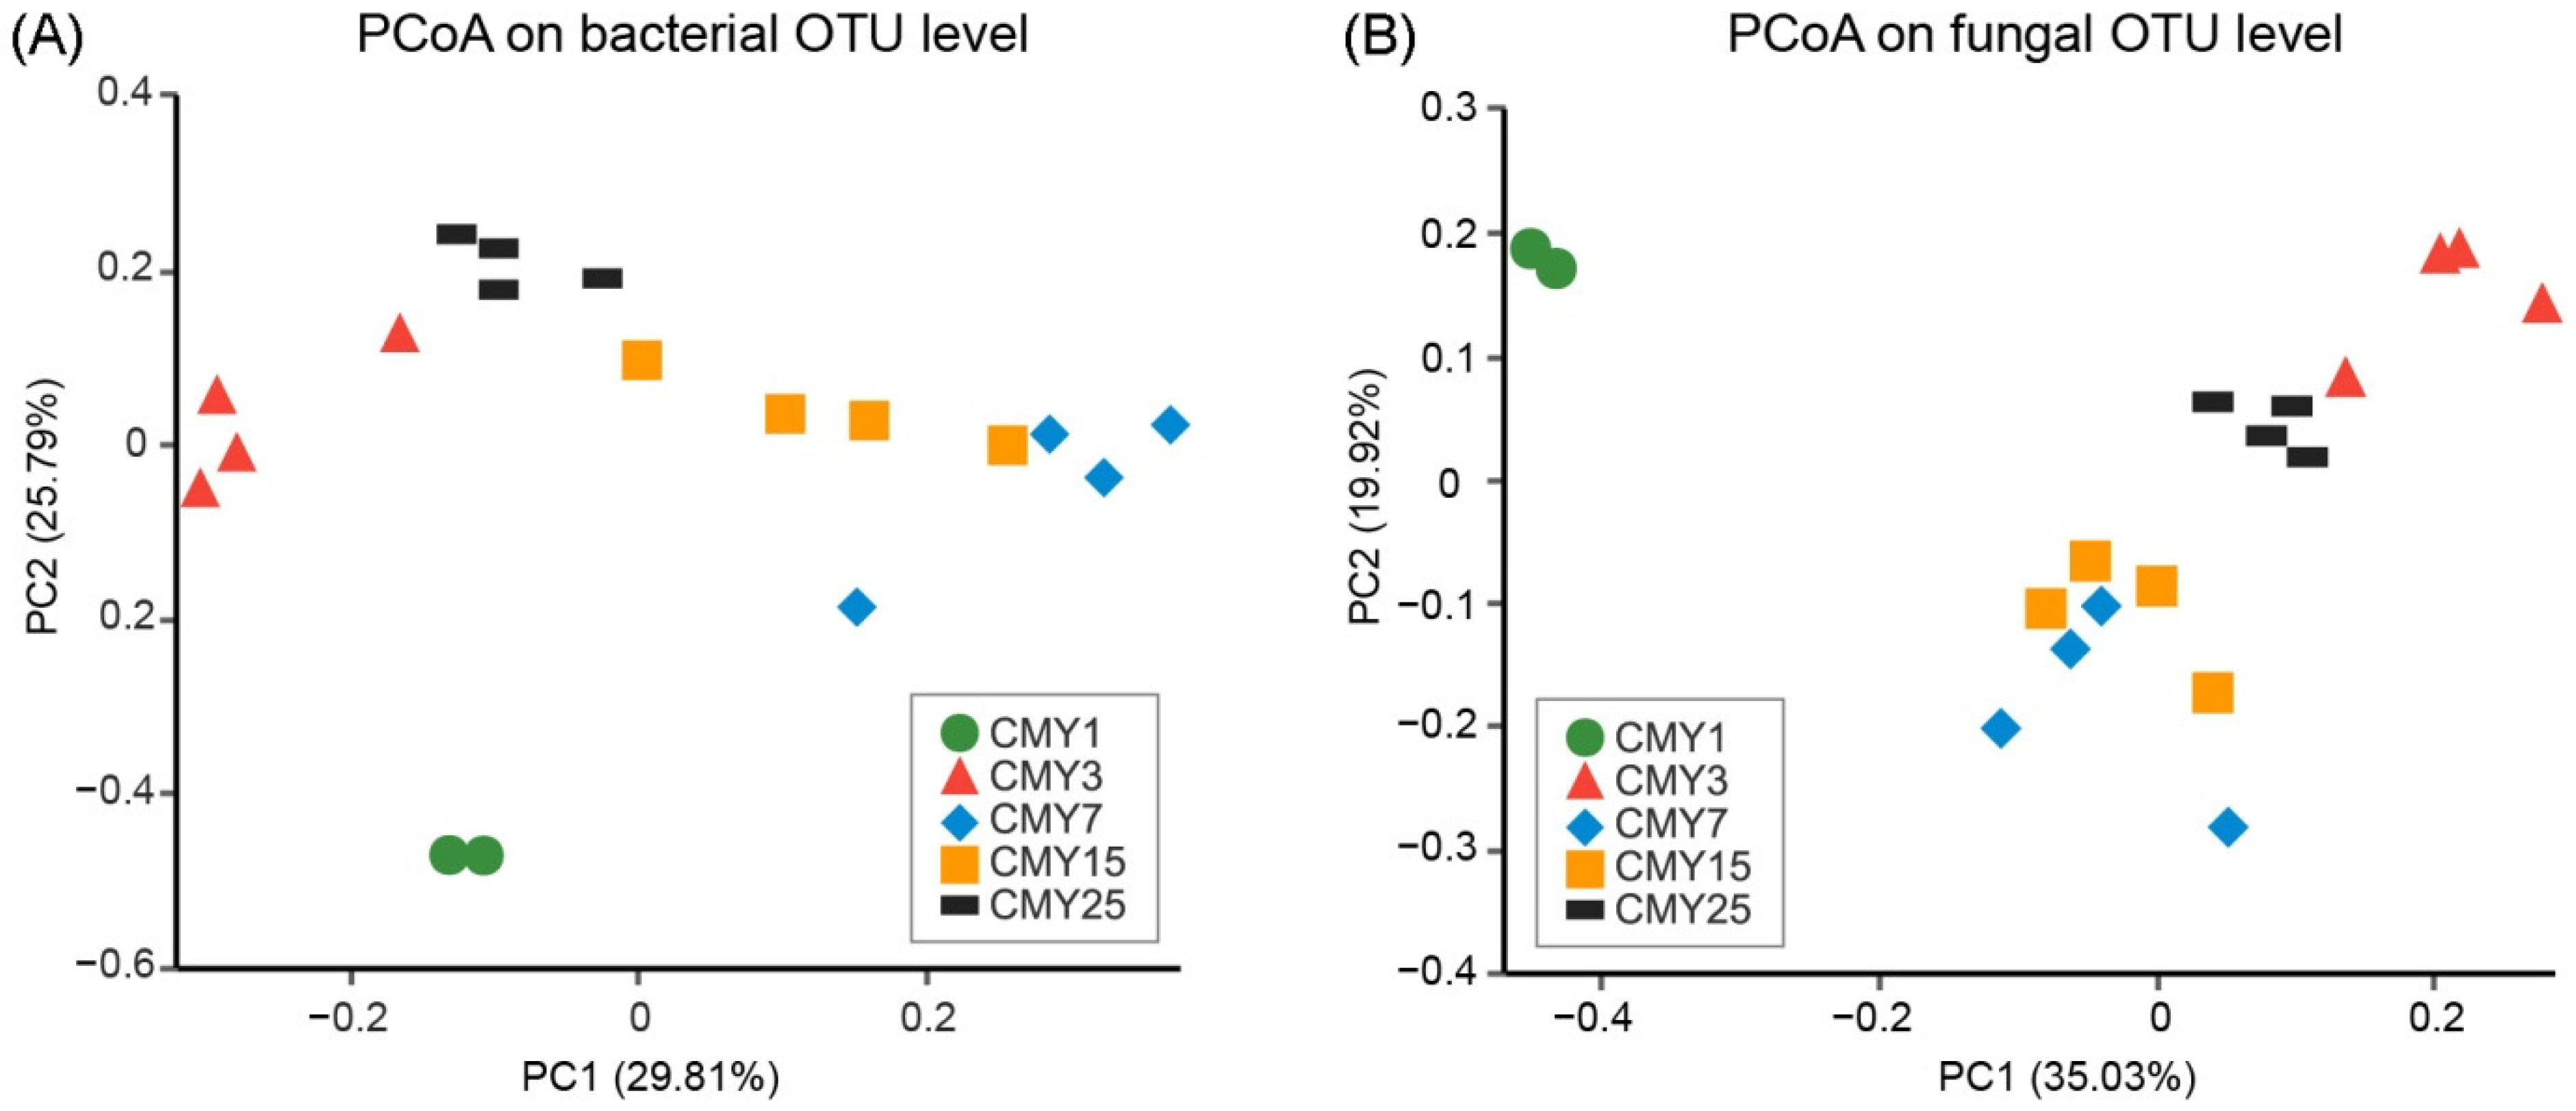
3.2. Soil Microbial Abundance and Diversity

Soil microbial abundance increased notably after long-term monoculture (Figure 1). Bacterial abundance ranged from 2.13 × 10⁸ to 5.11 × 10⁹ copies·g−1 dry soil, and fungal abundance ranged from 6.70 × 10⁶ to 2.88 × 10⁸ copies·g−1 dry soil (Table 1). Pairwise analyses revealed that both bacterial and fungal abundance were significantly positively correlated with cropping years (ρ = 0.779 and p < 0.001 for bacteria, ρ = 0.848 and p < 0.001 for fungi).
A total of 856,181 and 913,612 sequences were obtained from 18 soil samples for bacteria and fungi, respectively. For each sample, bacterial and fungal raw sequence reads ranged from 40,318 to 55,332, and 41,341 to 57,831, respectively. The read lengths of bacterial and fungal sequences ranged from 304 to 490 bp, with a mean of 438 bp, and ranged from 212 to 419 bp with a mean of 300 bp, respectively. After clustering and alignment, a total of 6665 bacterial OTUs and 710 fungal OTUs were obtained based on a 0.97 threshold across all samples. The coverage values for bacteria ranged from 0.98 to 0.99, and the coverage values of fungi were greater than 0.99, which suggested that the sequencing depth adequately covered most of the microorganisms.
Alpha diversity, including richness (Sobs and Chao indices), evenness (Heip index), and diversity (Shannon index), decreased in both bacterial and fungal communities with an increase in cropping years (Table 2), although there were variations among the same groups. In general, the bacterial diversity was much greater than the fungal diversity. Nevertheless, generally, monoculture time had a much greater influence on fungal diversity than on bacterial diversity (Table 2).

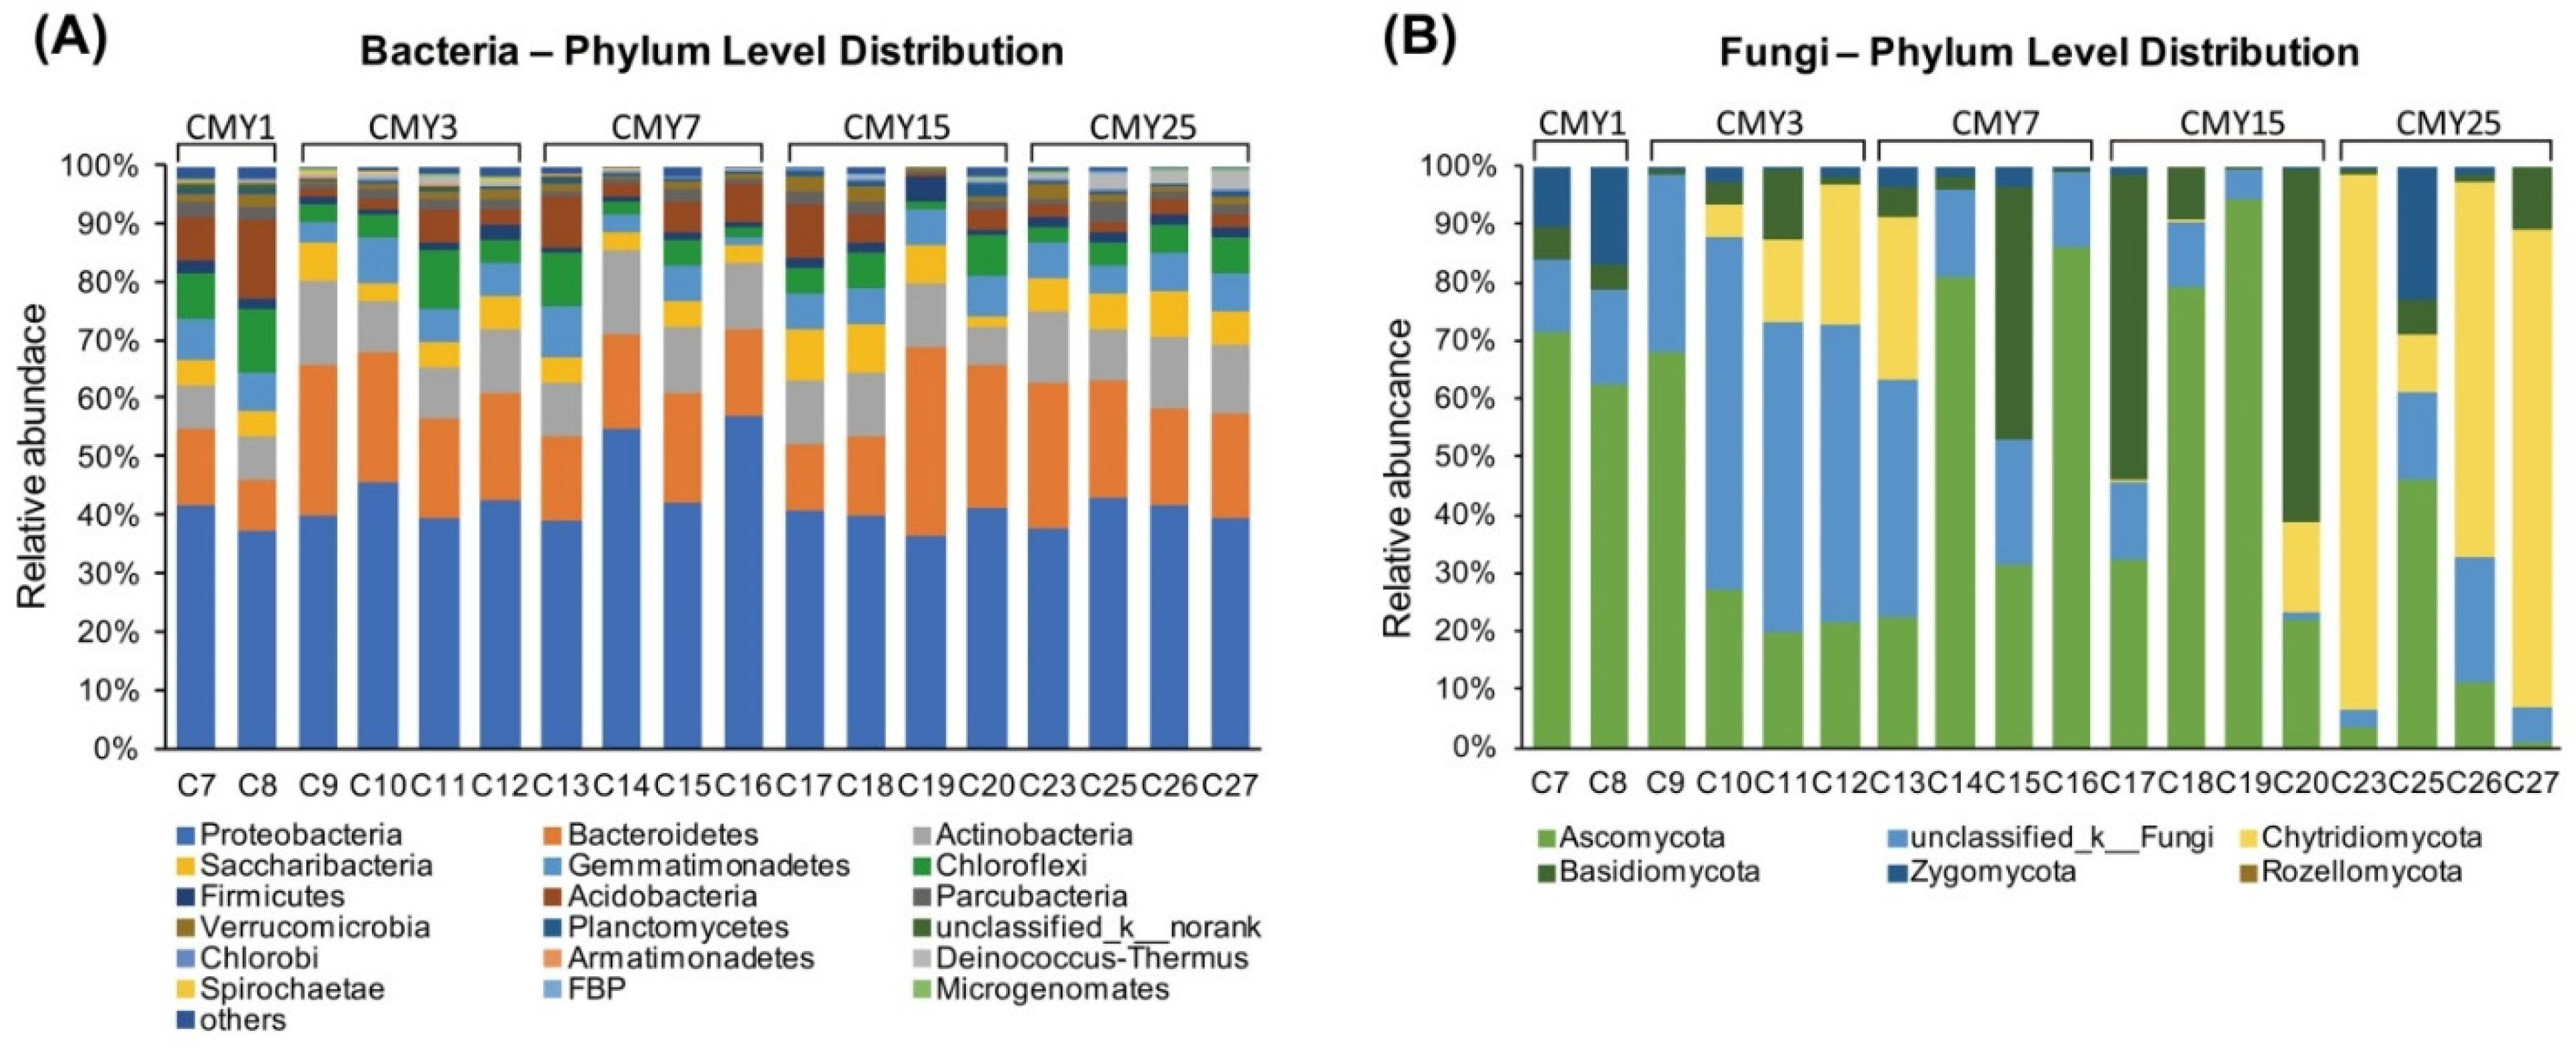
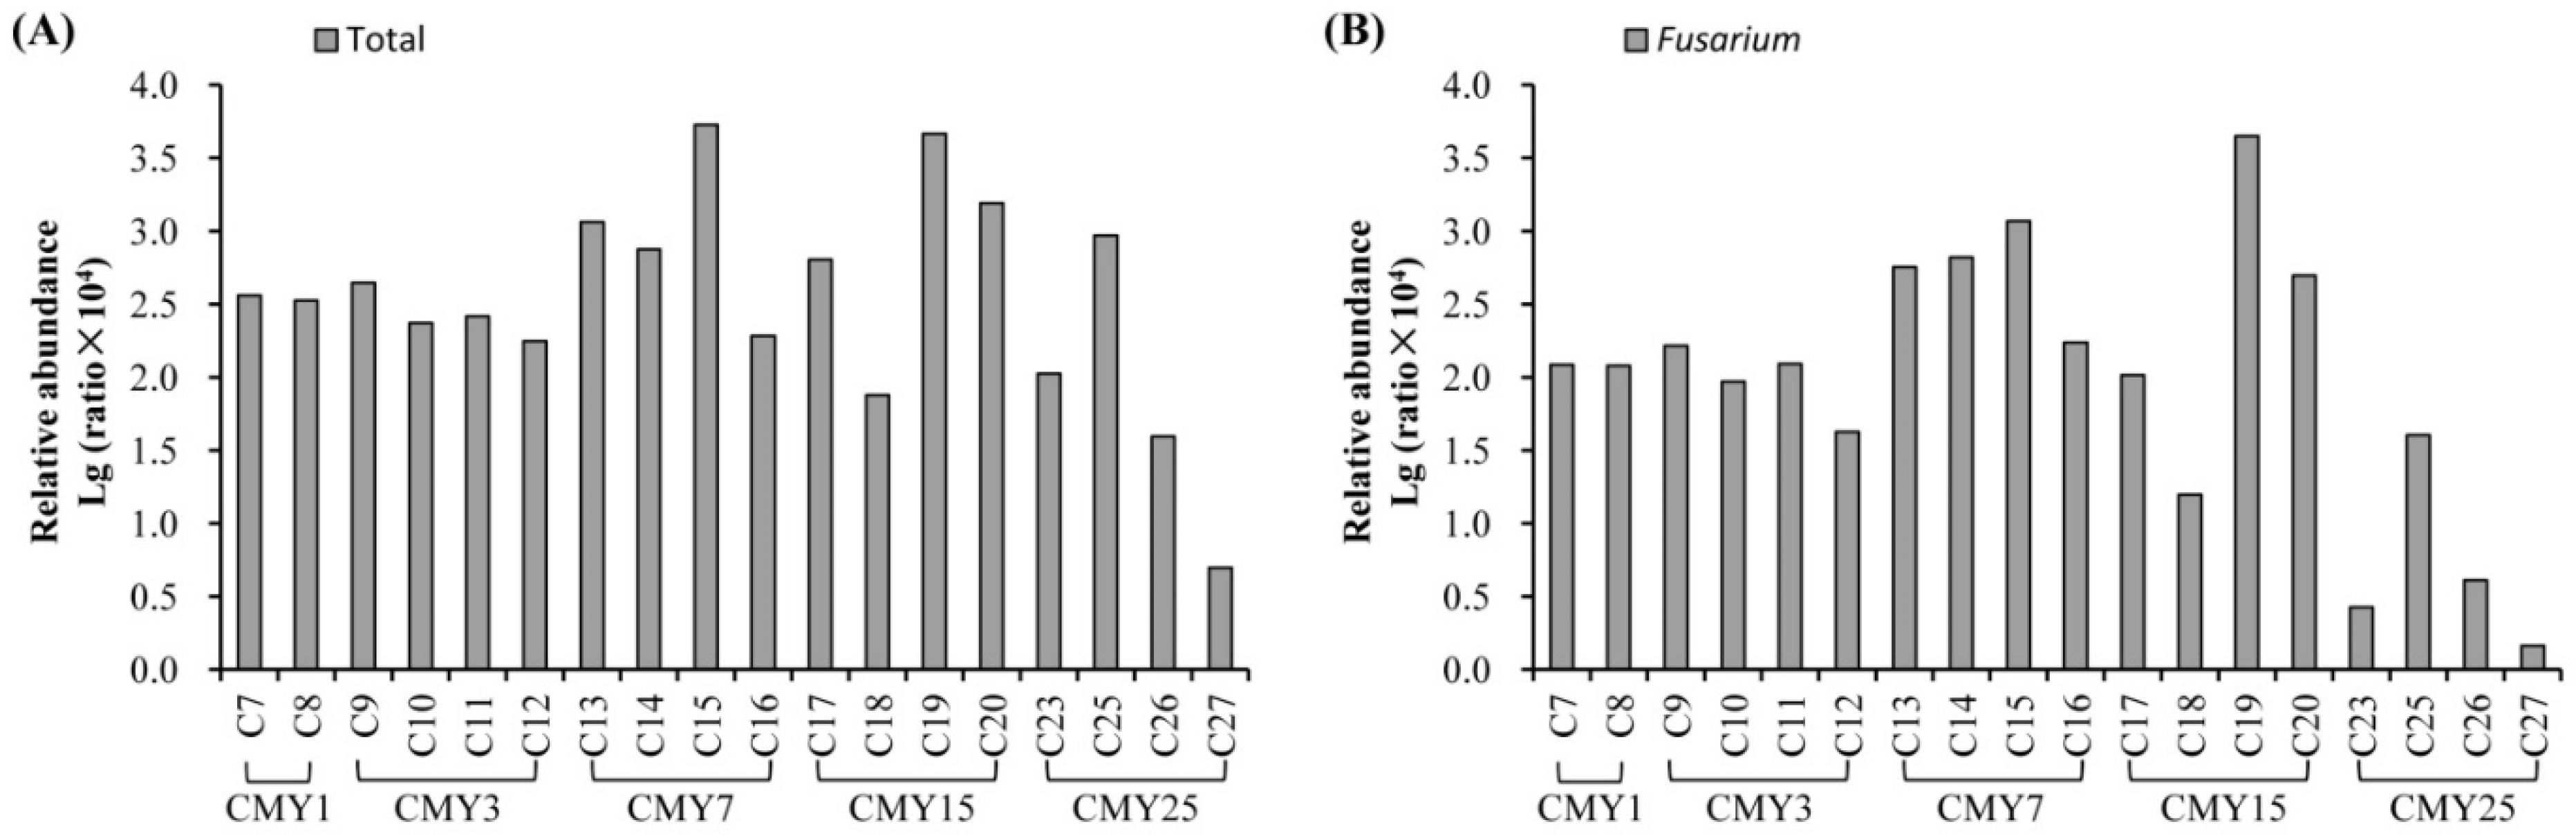
3.3. Soil Microbial Taxonomic Composition

Bacterial community structure in the cucumber rhizosphere soil was significantly altered after monoculture, irrespective of the monoculture period (Figure 2A). Across all samples analyzed, 34 bacterial phyla were detected. The dominant bacterial phyla (average relative abundances > 10%) across all the soil samples were Proteobacteria (37.08–57.41%), Bacteroidetes (9.21–33.49%), Actinobacteria (7.42–15.29%) (Figure 3A). The three dominant phyla above accounted for 73.90% of the reads in all samples (57.61–87.88%). Gemmatimonadetes, Saccharibacteria, Acidobacteria, and Chloroflexi accounted for 19.53% of the reads in all samples, while the other phyla accounted for only 6.57%. At the class level, Gammaproteobacteria, Alphaproteobacteria, Sphingobacteriia, and Actinobacteria were the dominant classes (average relative abundances > 10%) across all the soil samples. At the genus level, Arachidicoccus, Rhodanobacter, and Streptomyces were dominant (average relative abundances > 3%) across all the soil samples, excluding the unclassified genus. Some bacteria used widely in biocontrol or beneficial activities, such as Bacillus, Streptomyces, and Pseudomonas, were positively correlated with cropping years, and had high total absolute abundance in rhizosphere soils in multi-year cropping systems, especially in CMY25 (Figure 4A).
According to the PCoA analysis results, fungal composition in cucumber rhizosphere soils was also altered considerably after monoculture, irrespective of the period of monoculture (Figure 2B). Across all samples analyzed, six fungal phyla were detected. The unclassified fungal phylum accounted for 21.84% of the reads in all samples. The dominant fungal phyla (average relative abundances > 10%) included Ascomycota, Chytridiomycota, and Basidiomycota. Unexpectedly, they changed tremendously among different samples and groups. Across all soil samples, relative abundances of Ascomycota ranged from 1.05% to 94.42%, Chytridiomycota from 0.00% to 91.73%, Basidiomycota ranged from 0.45% to 76.57% (Figure 3B). Zygomycota, and Rozellomycota accounted for only 3.87% of the reads in all samples. At the class level, Chytridiomycetes, Sordariomycetes, Eurotiomycetes, and Agaricomycetes were the dominant classes (average relative abundances > 10%) across all the soil samples, in addition to the unclassified fungi. At the genus level, Olpidium, Penicillium, Fusarium, and Mortierella were the dominant genera (average relative abundances > 3%) across all the soil samples, in addition to the unclassified fungi.
For the fungal community, 132 potential plant pathogenic OTUs were identified using FUNguild, including Alternaria, Fusarium, Rhizoctonia, and Sclerotinia. Among these potential plant pathogenic fungi, the relative abundance of Fusarium was higher than others. The relative abundance of the total plant pathogenic fungi and Fusarium spp. did not show obvious change before the first 3 years of planting, increased in most CMY7 and CMY15 samples, and finally clearly decreased in CMY25 samples (Figure 4). In contrast, the absolute abundance of total plant pathogenic fungi and Fusarium spp. did not show obvious changes among such a long monoculture span (Supplementary data Figure S1).

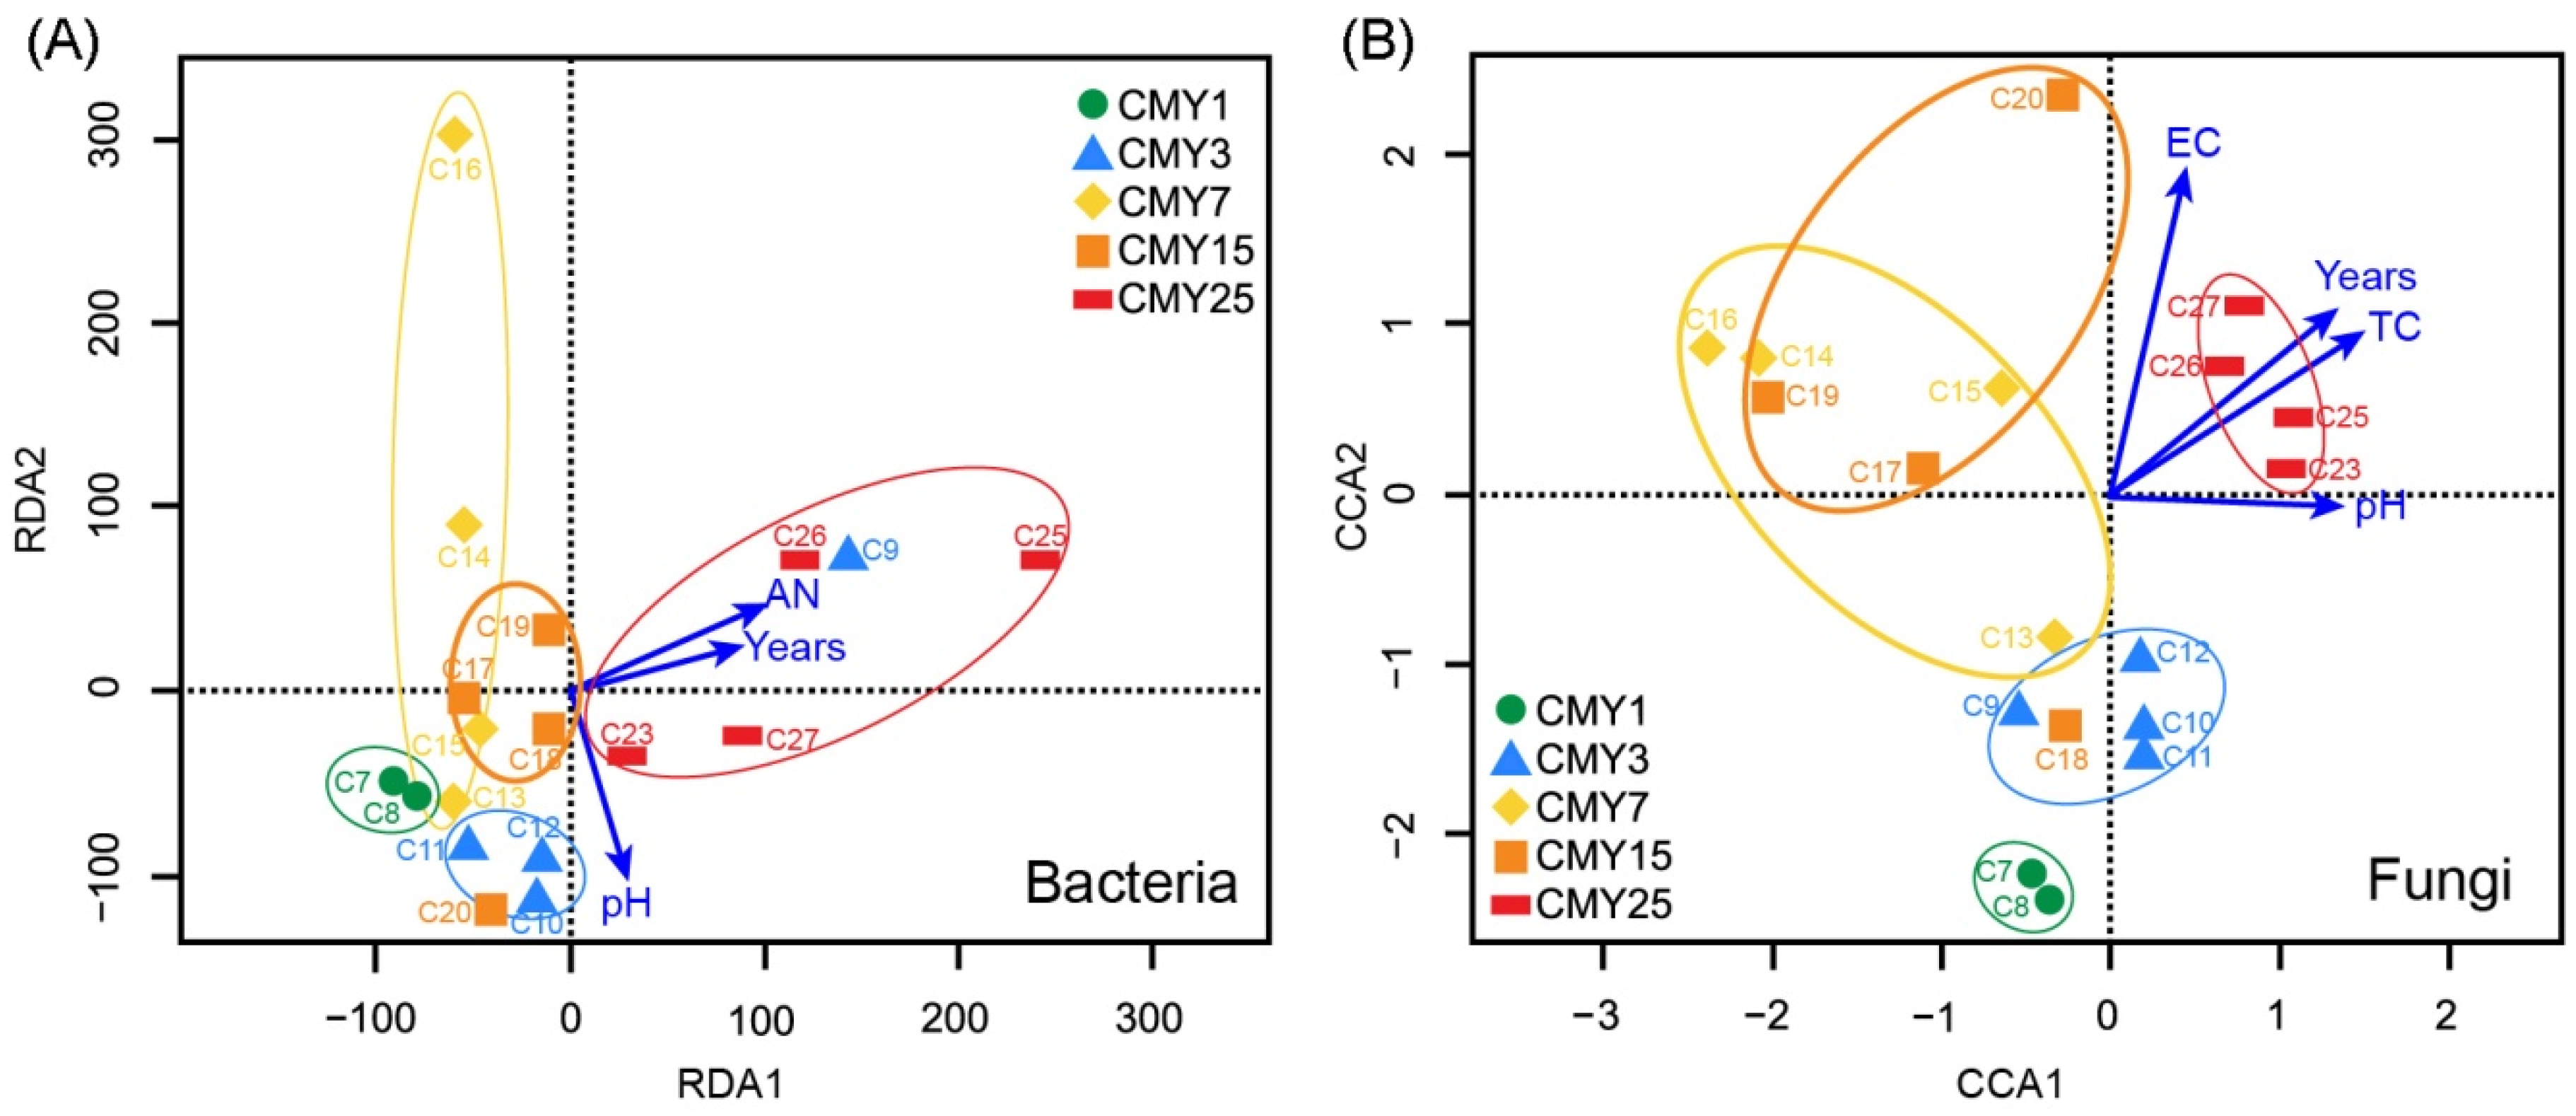
3.4. Correlations among Soil Abiotic Properties, Microbial Community Structure, and Monoculture Years

For microbial abundance, bacterial abundance was positively correlated with soil AN, TN, SOC, TP, and EC, and fungal abundance was highly positively correlated with soil TN, SOC, and AN (Table 3).
For microbial alpha diversity, soil EC values were negatively correlated with richness, evenness, and the diversity of both bacteria and fungi (Table 2). Soil pH was only positively correlated with bacterial community structure, with no significant correlation with fungal community structure (Table 2). Soil AN content was negatively correlated with bacterial and fungal richness and fungal Shannon diversity, but did not influence evenness. Soil TN and SOC content was only negatively correlated with fungal richness. All the other soil parameters were not correlated with alpha diversity (Table 2).
RDA was conducted for the bacterial community to explore its relationships with soil abiotic properties and cropping years. Overall, the two RDA axes explain only 29.71% of the total variation, whereas axis 1 explains 24.91% of the total variation. The main factor influencing bacterial community structure across different cropping year samples was AN, followed by pH, and cropping years (Figure 5A). CCA was used to explore the relationships between fungal community structure and soil abiotic properties and cropping years. EC had the greatest impact on fungal community composition, followed by SOC and pH (Figure 5B).
Dominant microbial taxa abundance was closely correlated with soil abiotic properties. The relative abundance of Proteobacteria was significantly negatively correlated with TP (ρ = −0.434, p = 0.036). In addition, the abundance of Bacteroidetes was significantly positively correlated with soil EC (ρ = 0.404, p = 0.048), but was significantly negatively correlated with soil TK (ρ = −0.615, p < 0.01), while Actinobacteria abundance was significantly negatively correlated with pH (ρ= −0.457, p = 0.028). Both the relative abundances of Acidobacteria (r = 0.745, p < 0.01) and Chloroflexi (r = 0.467, p = 0.025) were significantly positively correlated with soil TK. The abundance of Saccharibacteria was significantly positively correlated with soil TN, TP, and AN, but was significantly negatively correlated with soil C/N. For the dominant fungal phyla, the abundance of Ascomycota was significantly negatively correlated with soil SOC (r = −0.509, p = 0.015), TN (ρ = −0.587, p < 0.01), and pH (ρ = −0.405, p = 0.048), while Chytridiomycota abundance was significantly positively correlated with soil SOC (ρ = −0.675, p < 0.01), TP (ρ = 0.698, p < 0.01), AN (ρ = 0.612, p < 0.01), and EC (r = 0.411, p = 0.045). However, there was no significant correlation between Basidiomycota relative abundance and soil properties.

4. Discussion

4.1. Impacts of Long-Term Cucumber Monoculture on Soil Abiotic Properties

Key soil nutrients increased with an increase in cropping years, excluding TK. The constant TK observed across all the cropping years could be due to the high potash consumption of cucumber [27]. It could also be due to the imbalanced fertilizer application and the higher cost of potash fertilizer than nitrogenous and phosphatic fertilizers. Consequently, more potash application would enhance cucumber growth and yield further.
The high soil fertility could compensate a monoculture system and help facilitating acceptable cucumber yields. In this study, SOC, TN, and AN all increased markedly up to 5-fold the concentrations of the initial soil as cucumber monoculture continued. The distinct accumulation of SOC, TN, and AN could be attributed to the over-fertilization with organic and chemical fertilizers. Notably, the C/N ratio, which ranged from 7.20 to 9.37, was more stable than any other property, indicating relatively balanced C and N fertilizer application. Since organic fertilizer, manure, and compost, have higher C contents [28], the combination of manure and chemical fertilizer significantly enhances SOC and TN contents [29].
Over-fertilization in cucumber greenhouses did not only increase soil fertility, but also increased EC values considerably, indicating severe soil salinization, which are consistent with previous reports that high N inputs could lead to NO3- accumulation and, in turn, soil salinization [12,30,31]. Although the EC values increased up to 1632 µs·cm−1, it is way below the threshold value of 4000 µs·cm−1, which is detrimental to many crops [32].
Notably, soil acidification was not as severe as salinization in the present study, so that significantly low pH values were only observed in CMY7. The findings are inconsistent with the results of previous findings, where both long-term monoculture and over-fertilization increased soil acidification [12,31,33]. For example, in a previous study in Shouguang, Shandong province, vegetable soil pH and soil EC were significantly negatively correlated under greenhouse production [12]. However, we did not observe such a correlation in Wafangdian, Liaoning province. The generally minor shifts in pH could be attributed to long-term manure and compost application, since organic manure could effectively buffer soil acidification [11,29,33].

4.2. Impacts of Long-Term Monoculture on Soil Microbial Abundance and Structure

In this study, microbial abundance generally increased after long-term cucumber monoculture, which is contrary to the findings in a previous study, where bacterial abundance decreased significantly following continuous cucumber cropping [7]. Apparently, the addition of fertilizer was a crucial factor. Since both bacterial and fungal abundance were significantly positively correlated with soil TN, SOC, and AN, the increased soil microbial abundance was attributable to SOC and N accumulation. Similar results have been observed in open-field soils with long-term manure and chemical fertilizer application [29].
Although the total microbial abundance increased with the extension of the monoculture cropping period, both bacterial and fungal community diversity decreased. However, a previous study has reported higher fungal diversity in cucumber monoculture soil than in a two-year rotation system (tomato–celery–cucumber–Chinese cabbage) [4]. The inconsistent results could be caused by differences in soil abiotic properties, indicating that soil management could have a greater influence on fungal diversity than monoculture or rotation practices. Notably, the similarity between CMY3 and CMY25 for both bacterial and fungal beta diversity, might be due to the same trend of some taxa, such as a decrease in the relative abundance of Acidobacteria and Ascomycota, and an increase in Chytridiomycota. Nevertheless, the underlying causes for the similarity would be interesting for a future analysis.
Although the soil microbial communities had been altered by the monocropping cultures, the absolute abundance of possible plant pathogenic fungi and Fusarium spp. did not show obvious changes among such a long monoculture span. Notably, the relative abundance of these pathogenic fungi increased slightly during 7–15 years’ cropping, and then decreased during 25 years’ cropping. Since we collected soils from cucumber crops without typical disease symptoms, the obvious accumulation of fungal or bacterial pathogens has not been observed in the rhizosphere soils. The reduction in potential fungal pathogens might be due to the increment of some beneficial bacteria, such as Bacillus, Streptomyces, and Pseudomonas, which could inhibit fungal pathogens and promote cucumber growth [34], in addition to degrading phenolic acids to minimize autotoxicity in cucumber cropping systems [3,11]. It will be meaningful to determine potential functional changes in bacterial communities in a future analysis.

4.3. Correlation between Soil Abiotic Properties and Soil Microbial Communities

After cucumber monoculture, higher soil fertility was accompanied by greater soil microbial abundance. Sufficient soil nutrients can provide substrates for microbes, and balanced fertilization stimulates more microbial growth and activity [29]. Notably, soil TK accumulation was not as high as those of TN and TP in the greenhouses that we sampled. Nevertheless, soil TK could be improved in future cropping systems via enhanced K input.
Soil microbial community structure was altered as the soil properties changed. All the three dominant bacterial phyla, Proteobacteria, Bacteroidetes, and Actinobacteria, did not exhibit significant correlation with soil SOC and TN, indicating that the marked accumulation of soil C and N contents did not significantly influence the dominant bacteria. In contrast, high soil C and N contents significantly decreased the relative abundance of the dominant fungal phylum, Ascomycota, but markedly stimulated Chytridiomycota. Such distinct effects of soil C and N contents on bacteria and fungi could partially explain why the overall fungal diversity was much more substantially influenced by monoculture period than bacterial diversity.
The high soil salinization could be the major factor in soil influencing soil microbial community structures. Soil EC values were significantly correlated with bacterial and fungal richness, evenness, and diversity, and had greater effects than any of the other soil properties tested. We also found that soil EC was the abiotic factor having the greatest impact on fungal community composition. Although the RDA plot did not show the soil EC values, only 29.71% of the total variation was explained by two RDA axes, suggesting that much more complex environmental factors influenced the bacterial community structure. Generally, salinization is detrimental to the growth of most microbes [17,35]. Nevertheless, some taxa are adaptive to hypertonic conditions, such as genus Olpidium, in phylum Chytridiomycota. Future studies should investigate the underlying conditions facilitating the proliferation of Olpidium spp. in high salinity soil conditions.
Soil TK was significantly correlated with the abundance of some microbial taxa. More importantly, available K (AK) was the most important form having a direct effect. We noticed that the relative abundance of Bacteroidetes was negatively correlated with soil TK, but there was no significant difference in TK among the cropping years, suggesting that TK might have a limited effect on Bacteroidetes. Not only the relative predominant phyla but also the relative abundance of Acidobacteria was highly and positively correlated with soil TK, indicating that higher K input could induce more Streptomyces proliferation. At this point, further research should investigate if Streptomyces are beneficial or pathogenic to cucumber, since this group of bacteria contain both antagonists and plant pathogens [36]. In a long-term vegetable greenhouse, in Shouguang, Shandong, soil AK was significantly accumulated along with TN, AN and TP [12]. As such, we should further investigate the AK in the determination of superior fertilization regimes for Wafangdian greenhouse cucumber production activities.

5. Conclusions

In the present study, we characterized soil abiotic properties and rhizosphere microbial communities in commercial cucumber monoculture cropping systems in greenhouses sustained for as long as 25 years. High fertilizer or organic matter inputs had greater impacts on soil microbial community structure than the period of monoculture. Higher soil fertility was accompanied with greater soil microbial abundance and altered the soil microbial community structure. Although the high accumulation of soil nutrient increased soil salinity and acidity, the abundance of possible plant pathogenic fungi did not obviously accumulate, suggesting that the rhizosphere soil microbial communities might still remain healthy. According to the results, modifying soil abiotic and biotic properties using organic fertilizers and balanced chemical fertilizer inputs, especially improving potassium fertilizer application, could be beneficial to the sustainable development of greenhouse vegetable production. In addition, appropriate management strategies should be considered to reduce the potential risk of soil salinization.

Supplementary Materials

The following are available online at https://0-www-mdpi-com.brum.beds.ac.uk/article/10.3390/agriculture11040341/s1, Table S1: Soil properties and the abundance of bacterial and fungal communities under different lengths of monoculture, Figure S1: Absolute abundance of operational taxonomic units (OTUs) potentially related to plant pathogenic fungi (A) and Fusarium spp. (B) under long-term cucumber monoculture soils.

Author Contributions

X.-H.L., S.-D.L., and Y.-H.G. conceived and designed the study. X.-H.L., Y.-H.G., and J.-J.H. wrote the manuscript. Y.-H.G. and X.-H.L. collected soil samples. Y.-H.G., L.Y., and Z.-Q.M. analyzed the soil properties. X.-H.L., Y.-H.G., and R.-J.G. analyzed the data. All authors have read and agreed to the published version of the manuscript.

Funding

This work was financially supported by the National Key Research and Development Program of China (2016YFD0201000), and the China Agricultural Research System (CARS-25-D05).

Institutional Review Board Statement

Not applicable.

Informed Consent Statement

Not applicable.

Data Availability Statement

The datasets used during the current study are available from the corresponding author on reasonable request. The sequence datasets generated and analyzed in the present study are available in the Sequence Read Archive of the NCBI under accession number PRJNA526607.

Acknowledgments

The authors highly appreciate the assistance of Shu-Min Lin in the sampling activity.

Conflicts of Interest

The authors declare no conflict of interest.

References

  1. Zhou, X.; Wu, F. Dynamics of the diversity of fungal and Fusarium communities during continuous cropping of cucumber in the greenhouse. FEMS Microbiol. Ecol. 2012, 80, 469–478. [Google Scholar] [CrossRef] [Green Version]
  2. Wu, F.; Yu, H.; Yu, G.; Pan, K.; Bao, J. Improved bacterial community diversity and cucumber yields in a rotation with kidney bean-celery-cucumber. Acta Agric. Scand. Sect. B Soil Plant Sci. 2011, 61, 122–128. [Google Scholar] [CrossRef]
  3. Zhou, X.; Wu, F. p-Coumaric acid influenced cucumber rhizosphere soil microbial communities and the growth of Fusarium oxysporum f.sp. cucumerinum Owen. PLoS ONE 2012, 7, e48288. [Google Scholar] [CrossRef] [PubMed] [Green Version]
  4. Zhou, X.; Liu, J.; Wu, F. Soil microbial communities in cucumber monoculture and rotation systems and their feedback effects on cucumber seedling growth. Plant Soil 2017, 415, 507–520. [Google Scholar] [CrossRef]
  5. Li, Z.; Zu, C.; Wang, C.; Yang, J.; Yu, H.; Wu, H. Different responses of rhizosphere and non-rhizosphere soil microbial communities to consecutive Piper nigrum L. monoculture. Sci. Rep. 2016, 6, 35825. [Google Scholar] [CrossRef] [PubMed]
  6. Zhou, X.; Yu, G.; Wu, F. Soil phenolics in a continuously mono-cropped cucumber (Cucumis sativus L.) system and their effects on cucumber seedling growth and soil microbial communities. Eur. J. Soil Sci. 2012, 63, 332–340. [Google Scholar] [CrossRef]
  7. Guo, L.; Han, L.; Yang, L.; Zeng, H.; Fan, D.; Zhu, Y.; Feng, Y.; Wang, G.; Peng, C.; Jiang, X.; et al. Genome and transcriptome analysis of the fungal pathogen Fusarium oxysporum f. sp. cubense causing banana vascular wilt disease. PLoS ONE 2014, 9, e95543. [Google Scholar]
  8. Ye, S.F.; Yu, J.Q.; Peng, Y.H.; Zheng, J.H.; Zou, L.Y. Incidence of Fusarium wilt in Cucumis sativus L. is promoted by cinnamic acid, an autotoxin in root exudates. Plant Soil 2004, 263, 143–150. [Google Scholar] [CrossRef]
  9. Zhou, X.; Yu, G.; Wu, F. Effects of intercropping cucumber with onion or garlic on soil enzyme activities, microbial communities and cucumber yield. Eur. J. Soil Biol. 2011, 47, 279–287. [Google Scholar] [CrossRef]
  10. Pervaiz, Z.H.; Iqbal, J.; Zhang, Q.; Chen, D.; Wei, H.; Saleem, M. Continuous cropping alters multiple biotic and abiotic indicators of soil health. Soil Syst. 2020, 4, 59. [Google Scholar] [CrossRef]
  11. Wang, L.; Yang, F.; Yaoyao, E.; Yuan, J.; Raza, W.; Huang, Q.; Shen, Q. Long-term application of bioorganic fertilizers improved soil biochemical properties and microbial communities of an apple orchard soil. Front. Microbiol. 2016, 7, 1893. [Google Scholar] [CrossRef]
  12. Han, J.; Luo, Y.; Yang, L.; Liu, X.; Wu, L.; Xu, J. Acidification and salinization of soils with different initial pH under greenhouse vegetable cultivation. J. Soils Sed. 2014, 14, 1683–1692. [Google Scholar] [CrossRef]
  13. Wang, L.; Li, J.; Yang, F.; Yaoyao, E.; Raza, W.; Huang, Q.; Shen, Q. Application of bioorganic fertilizer significantly increased apple yields and shaped bacterial community structure in orchard soil. Microb. Ecol. 2017, 73, 404–416. [Google Scholar] [CrossRef]
  14. Yu, H.Y.; Li, T.X.; Zhang, X.Z. Nutrient budget and soil nutrient status in greenhouse system. Agric. Sci. China 2010, 9, 871–879. [Google Scholar] [CrossRef]
  15. Liu, J.; Sui, Y.; Yu, Z.; Shi, Y.; Chu, H.; Jin, J.; Liu, X.; Wang, G. High throughput sequencing analysis of biogeographical distribution of bacterial communities in the black soils of northeast China. Soil Biol. Biochem. 2014, 70, 113–122. [Google Scholar] [CrossRef]
  16. Agtmaal, M.V.; Straathof, A.; Termorshuizen, A.; Teurlincx, S.; Hundscheid, M.; Ruyters, S.; Busschaert, P.; Lievens, B.; Boer, W.D. Exploring the reservoir of potential fungal plant pathogens in agricultural soil. Appl. Soil Ecol. 2017, 121, 152–160. [Google Scholar] [CrossRef]
  17. Zhao, S.; Liu, J.J.; Banerjee, S.; Zhou, N.; Zhao, Z.Y.; Zhang, K.; Tian, C.Y. Soil pH is equally important as salinity in shaping bacterial communities in saline soils under halophytic vegetation. Sci. Rep. 2018, 8, 4550. [Google Scholar] [CrossRef]
  18. Lu, R. Methods of Soil and Agricultural Chemistry Analysis; China Agricultural Science and Technology Press: Beijing, China, 2000. [Google Scholar]
  19. Rousk, J.; Bååth, E.; Brookes, P.C.; Lauber, C.L.; Lozupone, C.; Caporaso, J.G.; Knight, R.; Fierer, N. Soil bacterial and fungal communities across a pH gradient in an arable soil. ISME J. 2010, 4, 1340–1351. [Google Scholar] [CrossRef]
  20. Xu, N.; Tan, G.; Wang, H.; Gai, X. Effect of biochar additions to soil on nitrogen leaching, microbial biomass and bacterial community structure. Eur. J. Soil Biol. 2016, 74, 1–8. [Google Scholar] [CrossRef]
  21. Bokulich, N.A.; Mills, D.A. Improved selection of internal transcribed spacer-specific primers enables quantitative, ultra-high-throughput profiling of fungal communities. Appl. Environ. Microbiol. 2013, 79, 2519–2526. [Google Scholar] [CrossRef] [Green Version]
  22. Edgar, R.C.; Haas, B.J.; Clemente, J.C.; Quince, C.; Knight, R. UCHIME improves sensitivity and speed of chimera detection. Bioinformatics 2011, 27, 2194–2200. [Google Scholar] [CrossRef] [Green Version]
  23. Schloss, P.D.; Gevers, D.; Westcott, S.L. Reducing the effects of PCR amplification and sequencing Artifacts on 16s rRNA-based studies. PLoS ONE 2011, 6, e27310. [Google Scholar] [CrossRef] [Green Version]
  24. Paradis, E.; Claude, J.; Strimmer, K. APE: Analyses of phylogenetics and evolution in R language. Bioinformatics 2004, 20, 289–290. [Google Scholar] [CrossRef] [Green Version]
  25. Lou, J.; Yang, L.; Wang, H.; Wu, L.; Xu, J. Assessing soil bacterial community and dynamics by integrated high-throughput absolute abundance quantification. PeerJ 2018, 2018, e4514. [Google Scholar] [CrossRef] [PubMed]
  26. Nguyen, N.H.; Song, Z.; Bates, S.T.; Branco, S.; Tedersoo, L.; Menke, J.; Schilling, J.S.; Kennedy, P.G. FUNGuild: An open annotation tool for parsing fungal community datasets by ecological guild. Fungal Ecol. 2016, 20, 241–248. [Google Scholar] [CrossRef]
  27. Zhang, M.M.; Wang, N.; Hu, Y.B.; Sun, G.Y. Changes in soil physicochemical properties and soil bacterial community in mulberry (Morus alba L.)/alfalfa (Medicago sativa L.) intercropping system. Microbiologyopen 2018, 7, e555. [Google Scholar] [CrossRef]
  28. Giacometti, C.; Cavani, L.; Baldoni, G.; Ciavatta, C.; Marzadori, C.; Kandeler, E. Microplate-scale fluorometric soil enzyme assays as tools to assess soil quality in a long-term agricultural field experiment. Appl. Soil Ecol. 2014, 75, 80–85. [Google Scholar] [CrossRef]
  29. Wei, M.; Hu, G.; Wang, H.; Bai, E.; Lou, Y.; Zhang, A.; Zhuge, Y. 35 years of manure and chemical fertilizer application alters soil microbial community composition in a Fluvo-aquic soil in Northern China. Eur. J. Soil Biol. 2017, 82, 27–34. [Google Scholar] [CrossRef]
  30. Shi, W.M.; Yao, J.; Yan, F. Vegetable cultivation under greenhouse conditions leads to rapid accumulation of nutrients, acidification and salinity of soils and groundwater contamination in South-Eastern China. Nutr. Cycl. Agroecosyst. 2009, 83, 73–84. [Google Scholar] [CrossRef]
  31. Shen, W.; Ni, Y.; Gao, N.; Bian, B.; Zheng, S.; Lin, X.; Chu, H. Bacterial community composition is shaped by soil secondary salinization and acidification brought on by high nitrogen fertilization rates. Appl. Soil Ecol. 2016, 108, 76–83. [Google Scholar] [CrossRef]
  32. Kingery, W.L.; Wood, C.W.; Delaney, D.P.; Williams, J.C.; Mullins, G.L. Impact of long-term land application of broiler litter on environmentally related soil properties. J. Environ. Qual. 1994, 23, 139–147. [Google Scholar] [CrossRef]
  33. Ding, J.; Ma, M.; Jiang, X.; Liu, Y.; Zhang, J.; Suo, L.; Wang, L.; Wei, D.; Li, J. Effects of applying inorganic fertilizer and organic manure for 35 years on the structure and diversity of ammonia-oxidizing archaea communities in a Chinese Mollisols field. MicrobiologyOpen 2020, 9, e00942. [Google Scholar] [CrossRef] [Green Version]
  34. Jin, X.; Zhang, J.; Shi, Y.; Wu, F.; Zhou, X. Green manures of Indian mustard and wild rocket enhance cucumber resistance to Fusarium wilt through modulating rhizosphere bacterial community composition. Plant Soil 2019, 441, 283–300. [Google Scholar] [CrossRef]
  35. Andronov, E.E.; Petrova, S.N.; Pinaev, A.G.; Pershina, E.V.; Rakhimgaliyeva, S.; Akhmedenov, K.M.; Gorobets, A.V.; Sergaliev, N.K. Analysis of the structure of microbial community in soils with different degrees of salinization using T-RFLP and real-time PCR techniques. Eurasian Soil Sci. 2012, 45, 147–156. [Google Scholar] [CrossRef]
  36. Meng, Q.; Yin, J.; Rosenzweig, N.; Douches, D.; Hao, J.J. Culture-based assessment of microbial communities in soil suppressive to potato common scab. Plant Dis. 2012, 96, 712–717. [Google Scholar] [CrossRef] [PubMed] [Green Version]
Figure 1. Relationship between the rhizosphere bacterial (A) and fungal (B) abundance and the cucumber monoculture years in greenhouses. Regression results are presented in the figure, where x is the period (year) of cucumber monoculture, and y is abundance.
Agriculture 11 00341 g001
Figure 2. Principal coordinate analysis (PCoA) of bacterial (A) and fungal (B) community. Analysis based on operational taxonomic unit (OTU) composition with the first two axes explaining 29.81 and 25.79% of the total variation for the bacterial data and 35.03 and 19.92% of the variation for fungi.
Agriculture 11 00341 g002
Figure 3. Relative abundance of bacteria (A) and fungi (B) at the phylum levels in cucumber rhizosphere soil under long-term monoculture systems in greenhouses.
Agriculture 11 00341 g003
Figure 4. Relative abundance of operational taxonomic units (OTUs) potentially related to plant pathogenic fungi (A) and Fusarium spp. (B) under long-term cucumber monoculture soils.
Agriculture 11 00341 g004
Figure 5. Redundancy analysis (RDA) of soil bacterial communities (A) and canonical correspondence analysis (CCA) of soil fungal communities (B) and soil properties under long-term cucumber monoculture systems. Lengths and angles of the arrows represent correlations between selected soil properties and soil communities, and the dots represent samples. AN: available nitrogen; EC: electronic conductivity; SOC: soil organic carbon; Years: years of monoculture.
Agriculture 11 00341 g005
Table 1. Soil abiotic properties and microbial abundances under different periods of cucumber monoculture under greenhouse conditions.
GroupYear of MonocultureEC a
(μs·cm−1)
pHSOC b
(g·kg−1)
TN c
(g·kg−1)
C/NAN d
(mg·kg−1)
TP e
(‰)
TK f
%
16S Gene
(×108 Copies·g−1)
18S Gene
(×106 Copies·g−1)
CMY11215.9 a6.23 b10.53 a1.39 a7.56 ab210.12 a0.47 a2.475 a2.13–4.256.7–11.8
CMY33547.8 a6.21 b24.39 b3.39 b7.20 a497.30 b1.06 abc2.378 a13.41–38.2755.1–76.1
CMY76~71002 b4.80 a34.87 bc3.71 b9.37 b567.32 bc0.99 ab2.478 a7.62–17.2113.9–90.6
CMY1513~151165 b5.48 ab36.90 c4.43 b8.46 ab743.38 c1.18 bc2.430 a8.95–31.1336.3–218.0
CMY2523~291385 b5.85 b58.94 d7.27 c8.13 ab1088.96 d1.70 c2.155 a29.74–51.09127.0–288.0
Multiple comparisons were performed using Duncan analysis at the α = 0.05 significance level. Means followed by different letters were significantly different. a EC: soil electrical conductivity; b SOC: soil organic carbon; c TN: total nitrogen; d AN: available nitrogen; e TP: total phosphorus; f TK: total potassium.
Table 2. Correlation of soil microbial alpha diversity with a period of monoculture and soil properties in 25-year cucumber monocultures in greenhouse conditions.
Diversity IndicesSobsChaoShannonHeip
Analytical MethodPearsonSpearmanPearsonSpearmanPearsonSpearmanPearsonSpearman
BacteriaYears aCor−0.392−0.523 *−0.432−0.558 *−0.226−0.490 *−0.252−0.472 *
Sig0.1080.0260.0730.0160.3670.0390.3130.048
EC bCor−0.635 **−0.664 **−0.614 **−0.682 **−0.526 *−0.653 **−0.568 *−0.598 **
Sig0.0050.0030.0070.0020.0250.0030.0140.009
pHCor0.4120.502 *0.3420.471 *0.495 *0.526 *0.4390.527 *
Sig0.0890.0340.1650.0480.0370.0250.0680.025
AN cCor−0.512 *−0.548 *−0.540 *−0.575 *----
Sig0.0300.0190.0210.013----
FungiYears aCor−0.630 **−0.709 **−0.649 **−0.735 **−0.542 *−0.662 **−0.469 *−0.487 *
Sig0.0050.0010.0040.0010.020.0030.050.04
EC bCor−0.827 **−0.808 **−0.805 **−0.789 **−0.652 **−0.736 **−0.520 *−0.538 *
Sig<0.000<0.000<0.000<0.0000.0030.0010.0270.021
AN cCor−0.67 0 **−0.633 **−0.688 **−0.668 **−0.485 *−0.562 *--
Sig0.0020.0050.0020.0020.0410.015--
SOC dCor−0.480 *−0.41−0.511 *−0.443----
Sig0.0430.0910.030.066----
TN eCor−0.469 *−0.325−0.508 *−0.385----
Sig0.0500.1880.0310.115----
In a two-tailed test, * indicates p < 0.05 and ** indicates p < 0.01. a Years: years of monoculture; b EC: soil electrical conductivity; c AN: available nitrogen; d SOC: soil organic carbon; e TN: total nitrogen; Cor: correlation coefficient; Sig: significance. “-” means there is no significant correlation based on both Pearson and Spearman analyses.
Table 3. Spearman’s and Pearson’s analyses of correlation between soil microbial abundance and soil abiotic properties of long-term cucumber monoculture in greenhouse conditions.
Soil PropertiesCorrelationBacteriaFungi
PearsonSpearmanPearsonSpearman
SOC aCor0.633 **0.488 *0.605 **0.624 **
Sig0.0050.0400.0080.006
TN bCor0.699 **0.550 *0.617 **0.593 **
Sig0.0010.0180.0060.009
TP cCor0.536 *0.470 *-0.480 *
Sig0.0220.049-0.044
AN dCor0.711 **0.610 **0.557 *0.633 **
Sig0.0010.0070.0160.005
EC eCor0.527 *0.583 *-0.564 *
Sig0.0250.011-0.015
In a two-tailed test, * indicates p < 0.05 and ** indicates p < 0.01. a SOC: soil organic carbon; b TN: total nitrogen; c TP: total phosphorus; d AN: available nitrogen; e EC: soil electrical conductivity; Cor: correlation coefficient; Sig: significance.
Publisher’s Note: MDPI stays neutral with regard to jurisdictional claims in published maps and institutional affiliations.

