Article

Drought Shocks and Gearing Impacts on the Profitability of Sheep Farming

1
Graham Centre for Agricultural Innovation (an Alliance between Charles Sturt University and NSW DPI), Albert Pugsley Place, Wagga Wagga, NSW 2650, Australia
2
School of Agricultural & Wine Sciences, Charles Sturt University, Locked Bag 588, Wagga Wagga, NSW 2678, Australia
3
School of Computing and Mathematics, Charles Sturt University, Locked Bag 588, Wagga Wagga, NSW 2678, Australia
4
School of Animal & Veterinary Sciences, Charles Sturt University, Locked Bag 588, Wagga Wagga, NSW 2678, Australia
5
Land and Agri-Business Management Department, Harper Adams University, Newport, Shropshire TF10 8NB, UK
*
Author to whom correspondence should be addressed.
Submission received: 6 March 2021 / Revised: 12 April 2021 / Accepted: 13 April 2021 / Published: 18 April 2021
(This article belongs to the Special Issue Livestock Farm and Agribusiness Management)

Abstract

:
The resilience and profitability of livestock production in many countries can be impacted by shocks, such as drought and market shifts, especially under high debt levels. For farmers to remain profitable through such uncertainty, there is a need to understand and predict a farming business’s ability to withstand and recover from such shocks. This research demonstrates the use of biophysical modelling linked with copula and Monte Carlo simulation techniques to predict the risks faced by a typical wool and meat lamb enterprise in South-Eastern Australia, given the financial impacts of different debt levels on a farming business’s profitability and growth in net wealth. The study tested five starting gearing scenarios, i.e., debt to equity (D:E) ratios to define a farm’s financial risk profiles, given weather and price variations over time. Farms with higher gearing are increasingly worse off, highlighting the implications of debt accumulating over time due to drought shocks. In addition to business risk, financial risk should be included in the analyses and planning of farm production to identify optimal management strategies better. The methods described in this paper enable the extension of production simulation to include the farmer’s management information to determine financial risk profiles and guide decision making for improved business resilience.

1. Introduction

Due to the uncertainties and variabilities in international prices and exchange rates, Australian farmers are considered to face high production and output price risks, according to the Organisation for Economic Co-operation and Development (OECD) [1,2]. Assessing farm financial viability helps farmers make informed decisions with more awareness of their business’s potential risks [3].
Of the more than 80,000 farm businesses in Australia, 32,000 are sheep-and-lamb-producing, and 99% of these are Australian owned and operated [4]. According to Frilay et al. [5], typical sheep and lamb businesses in Australia have incurred average debts of A$688,000 over the past ten years, potentially impacting the long-term viability of a farm’s capacity to service debt. Malcolm [6] highlights that capital investment in agriculture is pivotal and focusing on economic analysis alone without giving equivalent attention to finance is “half the job”. Previous studies [7] have analysed risk through gross margins or risk methodology [8] without taking into account the relationship between production and prices and the impact of farm debt. These methods are likely to lead to inaccurate conclusions and sub-optimal decision making when considering strategies based on historical data. Hutchings and Nordblom [9] use discrete stochastic programming to optimise cash flow margins using Monte Carlo simulation. We make use of historical data and its relationships using copulas to advance these past studies.
Since both profit and cost depend on the prices and quantities of inputs and outputs, net profit distribution can be considered the weighted outcome of all these variables. This is a stochastic problem dealing with jointly distributed random variates. The probability distribution of the net profit will depend on the joint multivariate distribution of all prices and quantities, which is difficult to obtain analytically, as the individual univariate probability distributions are often different and non-Gaussian. The use of ‘copula’ has emerged as an industry standard for financial risk management, which can give the joint distribution by combining all univariate distributions through multivariate operations, based on Sklar’s Theorem [10]. Common copula functions include Gaussian, Student’s t, Clayton and Gumbel, where the latter two are most useful when variables exhibit strong tail dependence [11].
Copula-based methods have recently been applied to agricultural risk management and proven useful [12]. For example, Nguyen-Huy et al. [13] used copula methods to obtain the conditional value-at-risk for a wheat farming portfolio while Ji et al. [14] modelled the time-varying dependence structure between energy and agricultural commodity markets. Vergni et al. [15] used bivariate copula models to analyse the characteristics of droughts. Ribeiro et al. [16] demonstrated the use of copula methods to model the drought risk of rainfed cropping systems. In the present study, copula methods are applied to model the lamb and wool production risks due to variations in prices and weather.
The aims of this study are to understand sheep enterprises’ ability to survive and be sustained economically and financially surrounded by variable, and possibly extreme, weather conditions, including a period of severe drought and fluctuating prices, while capturing their historical relationship using copulas. We have adopted a whole farm approach to estimate the impact of either low or typically substantial opening debts on the risk profiles through applying the novel copula-based methods.

2. Materials and Methods
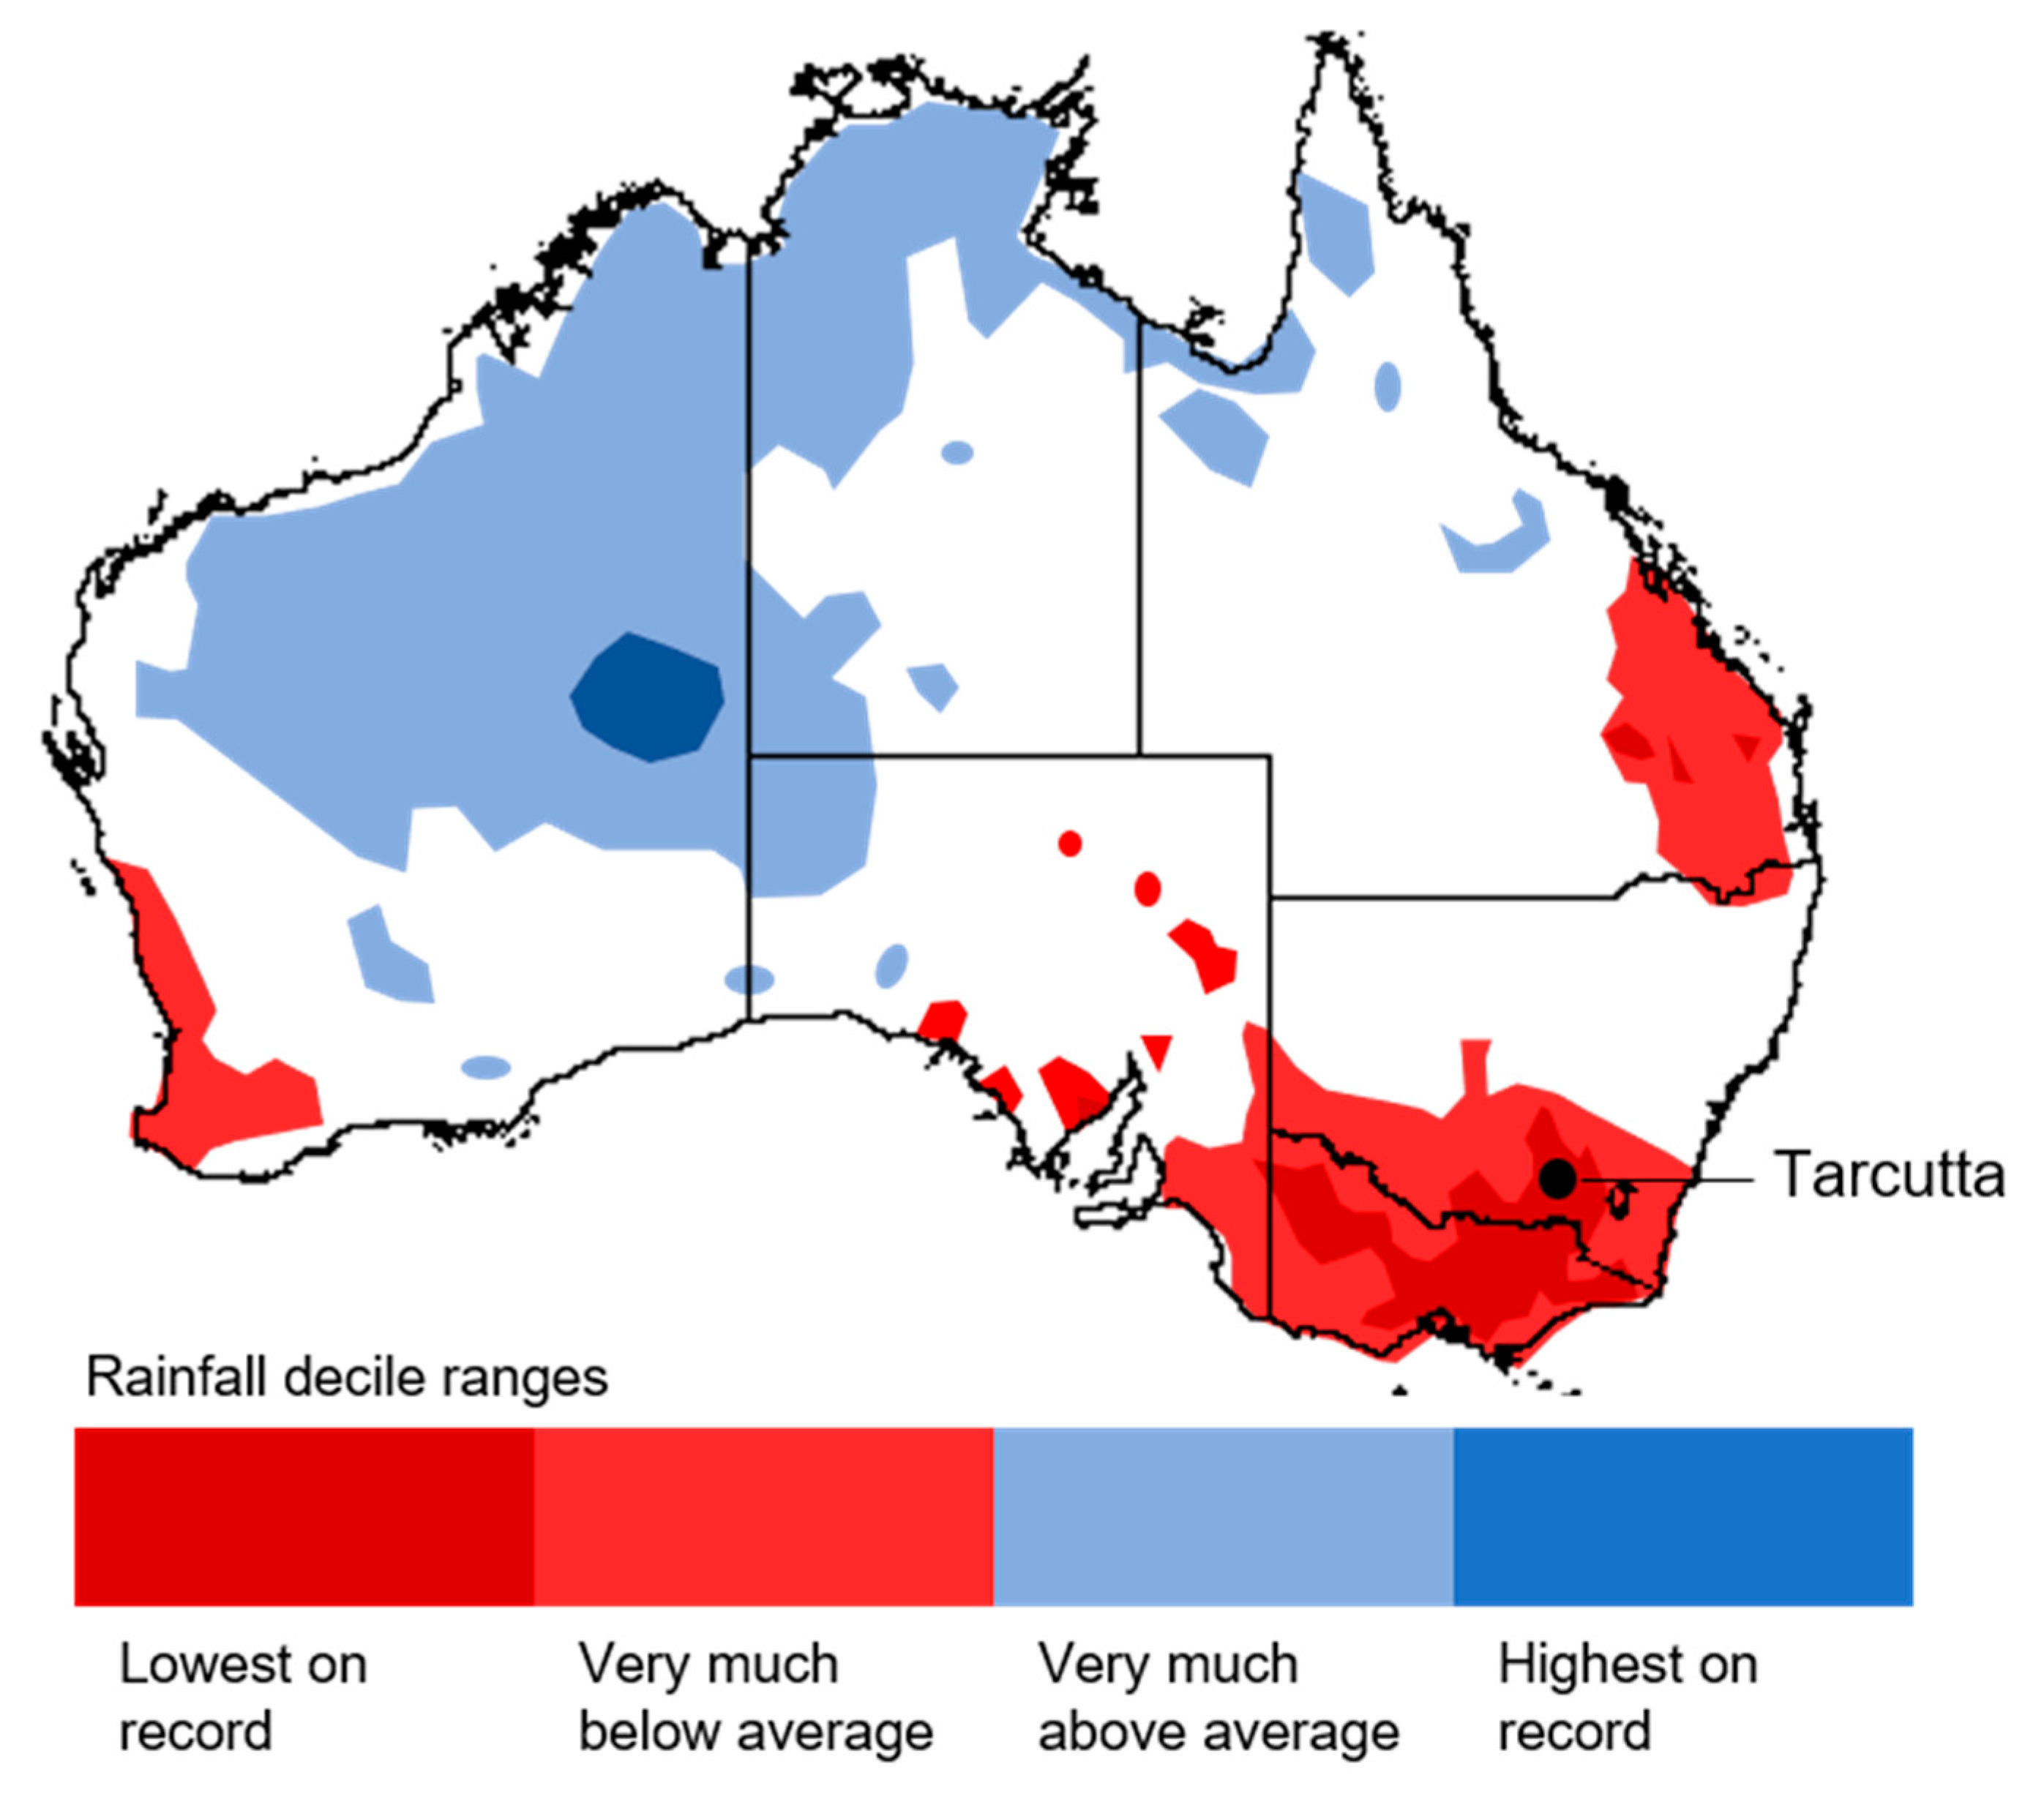
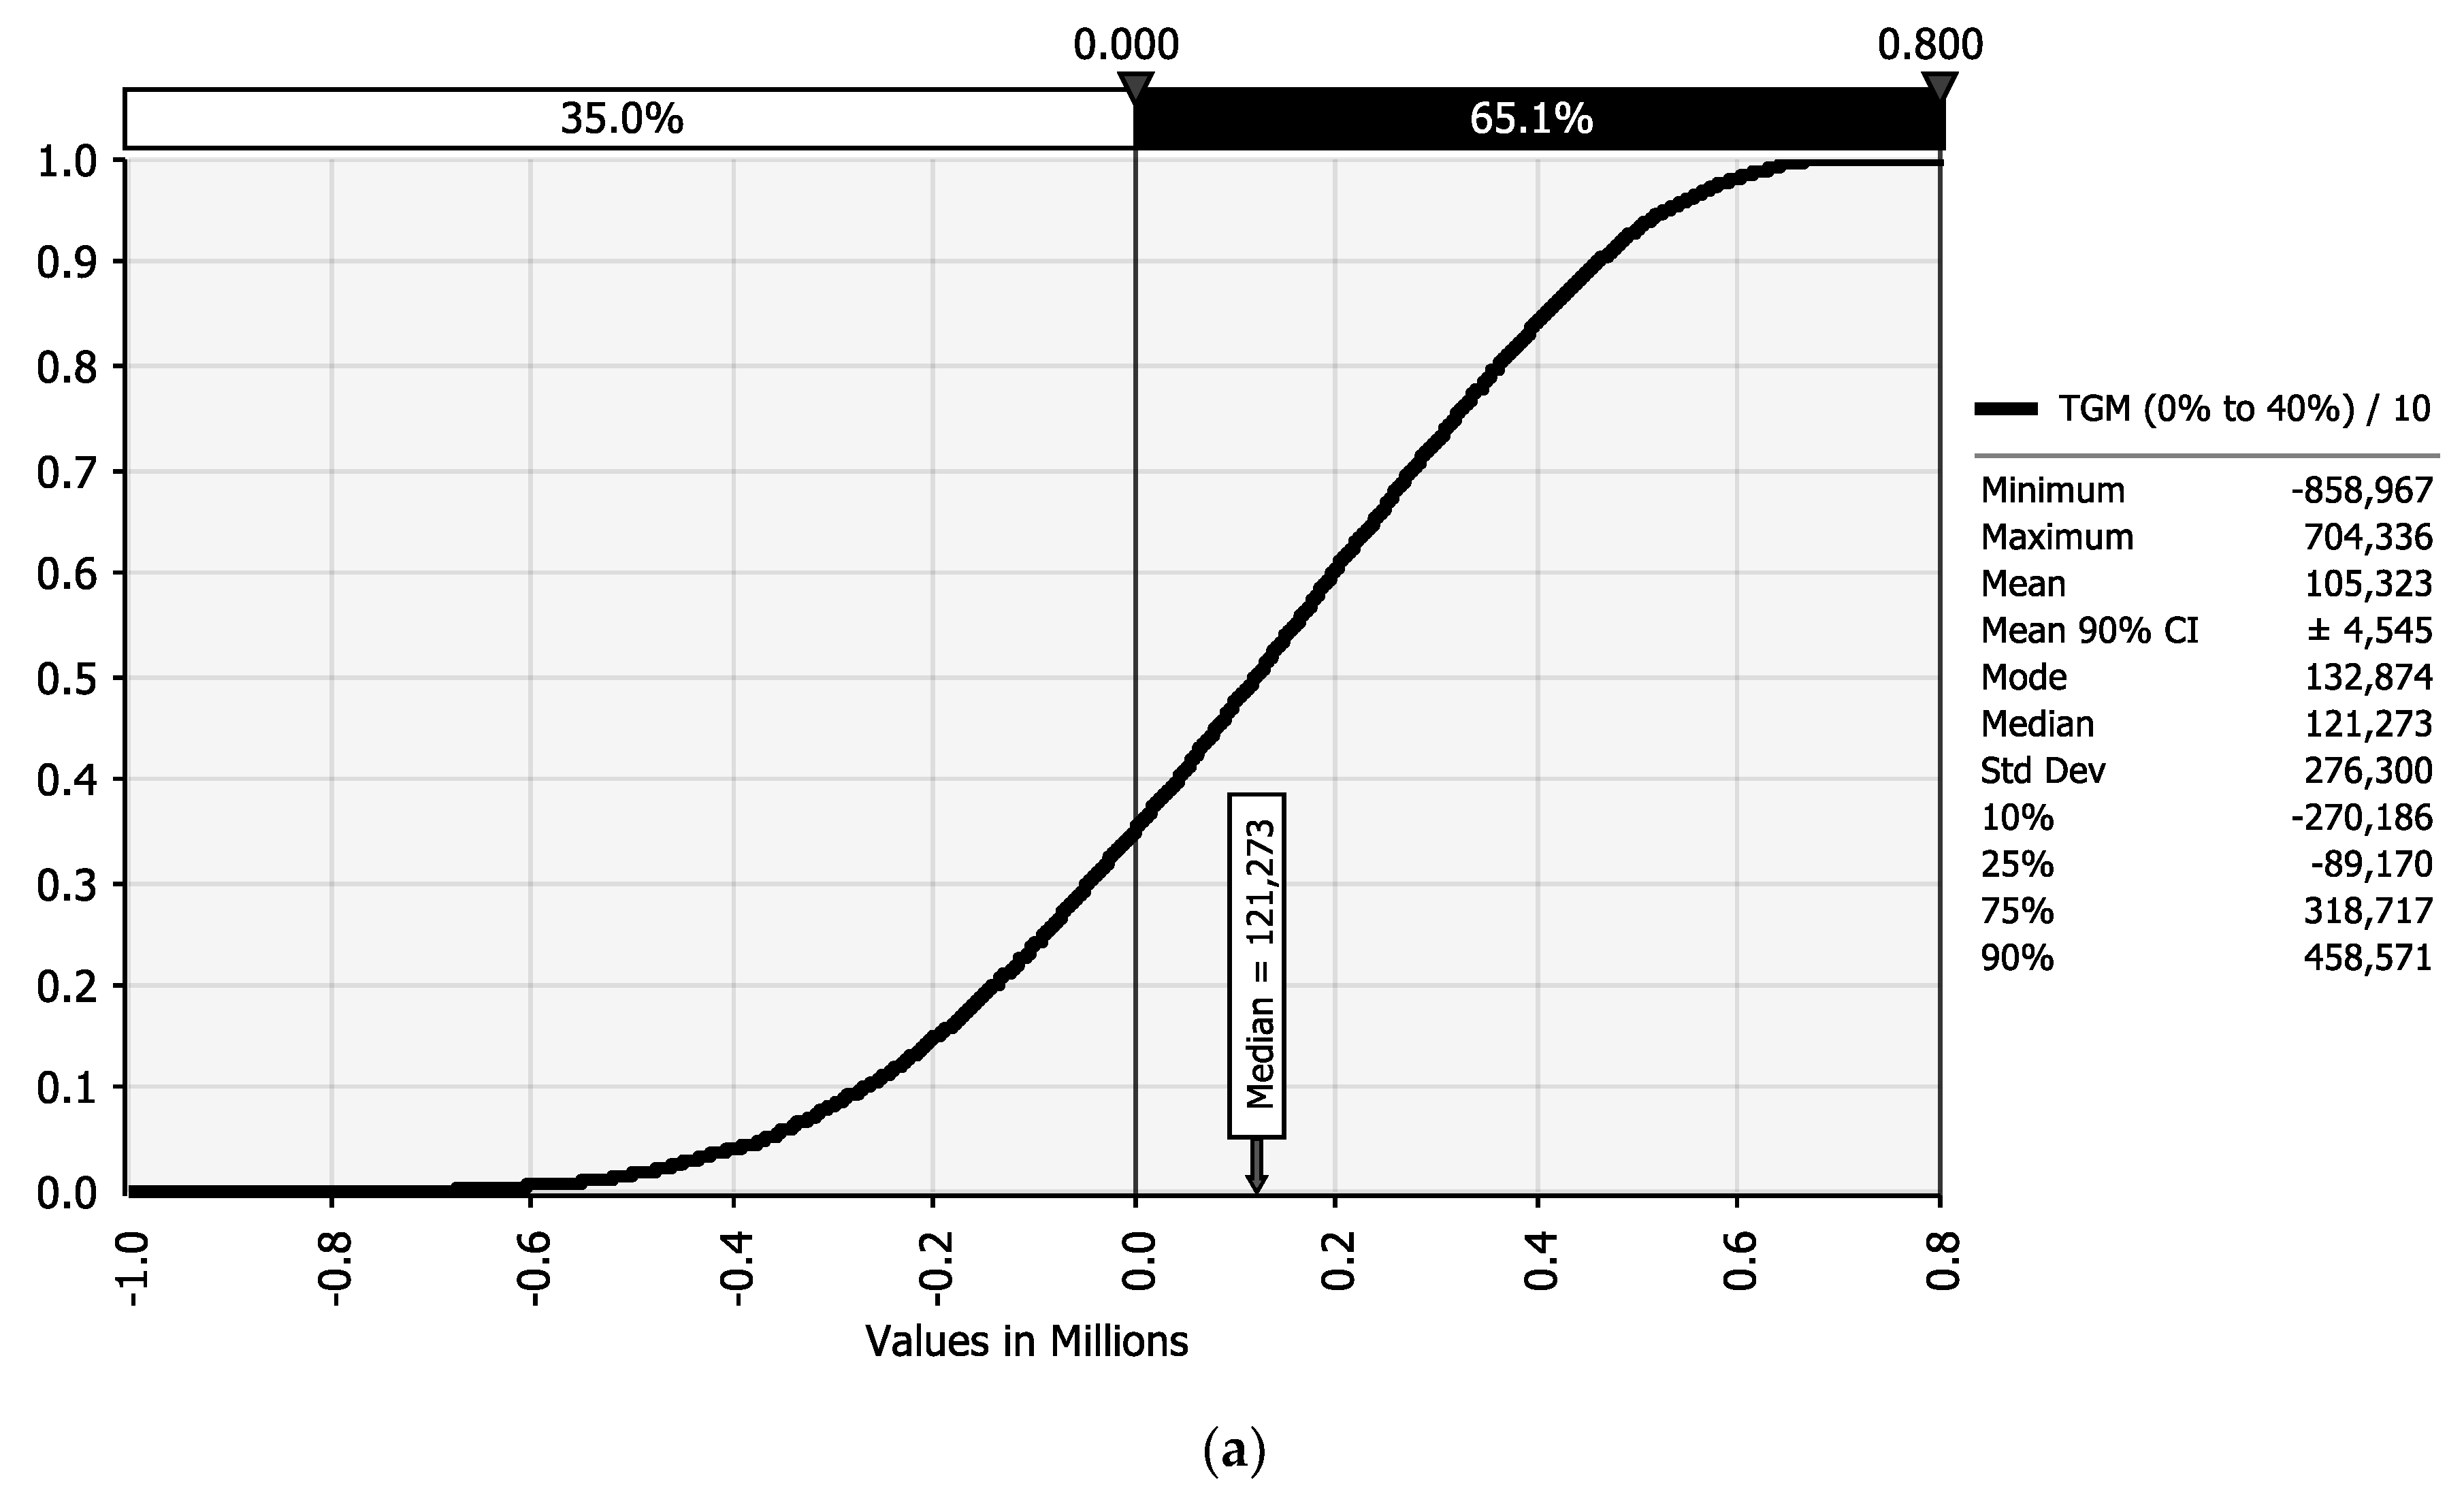
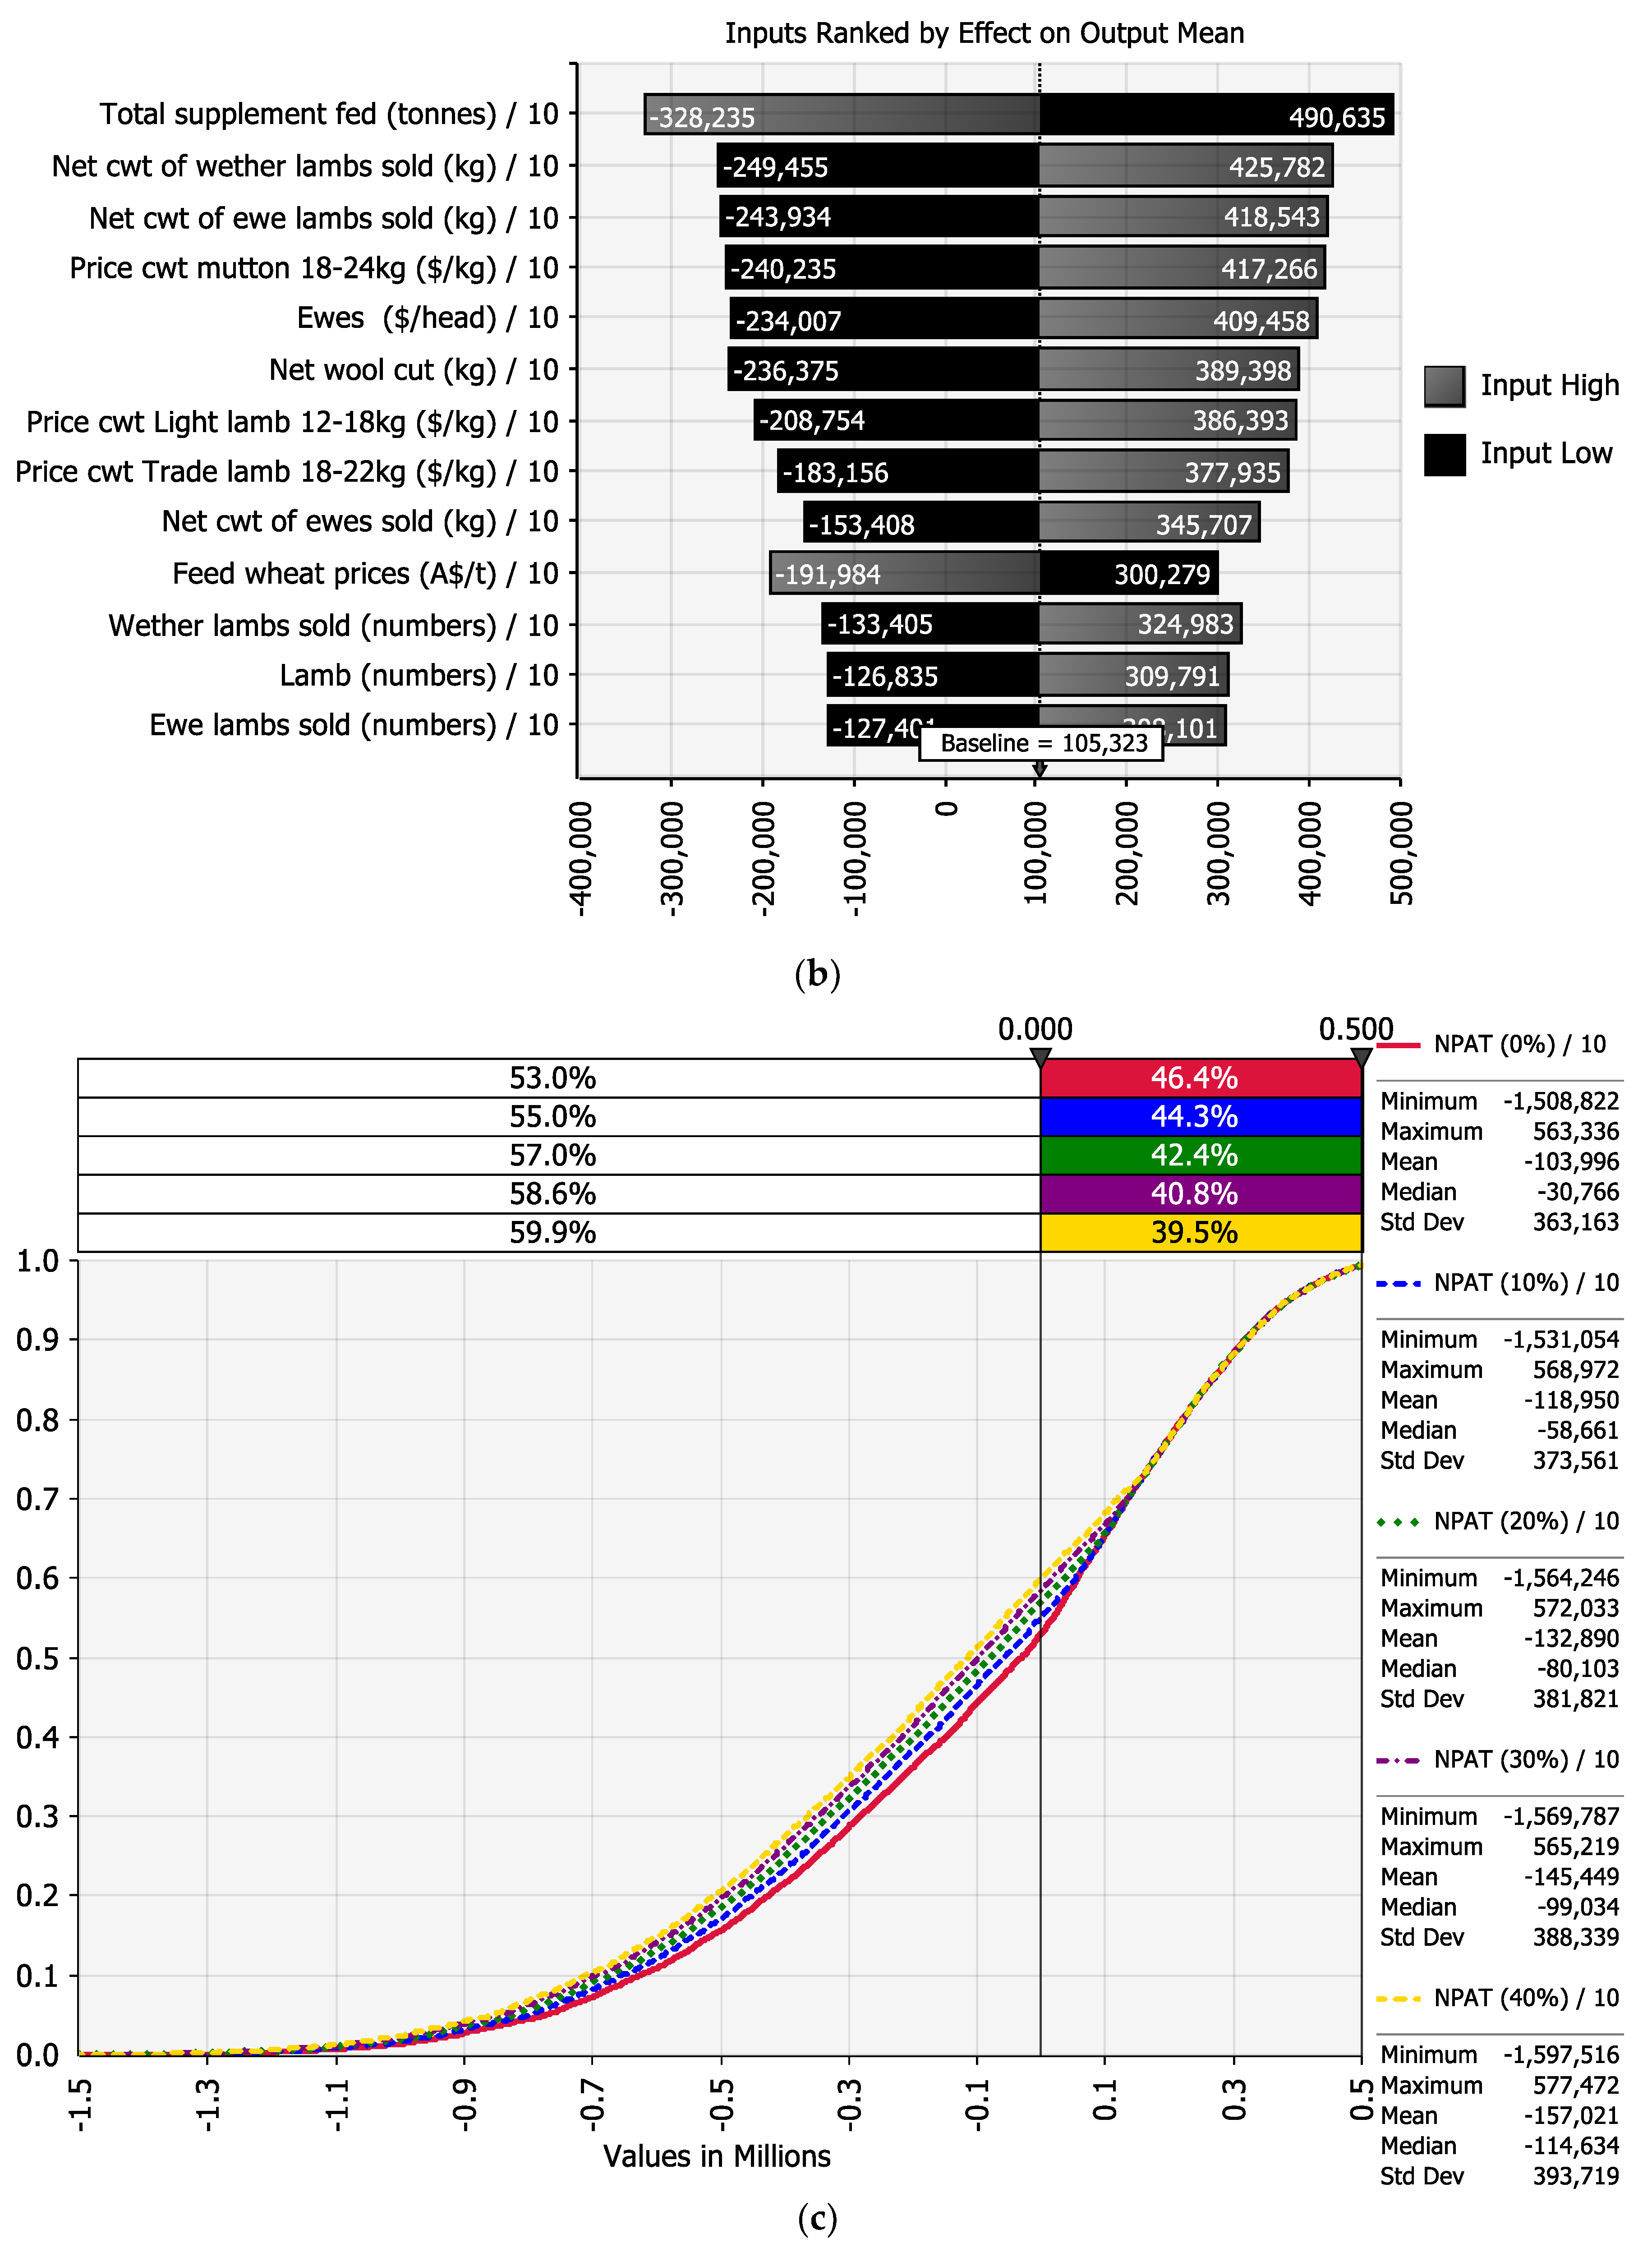
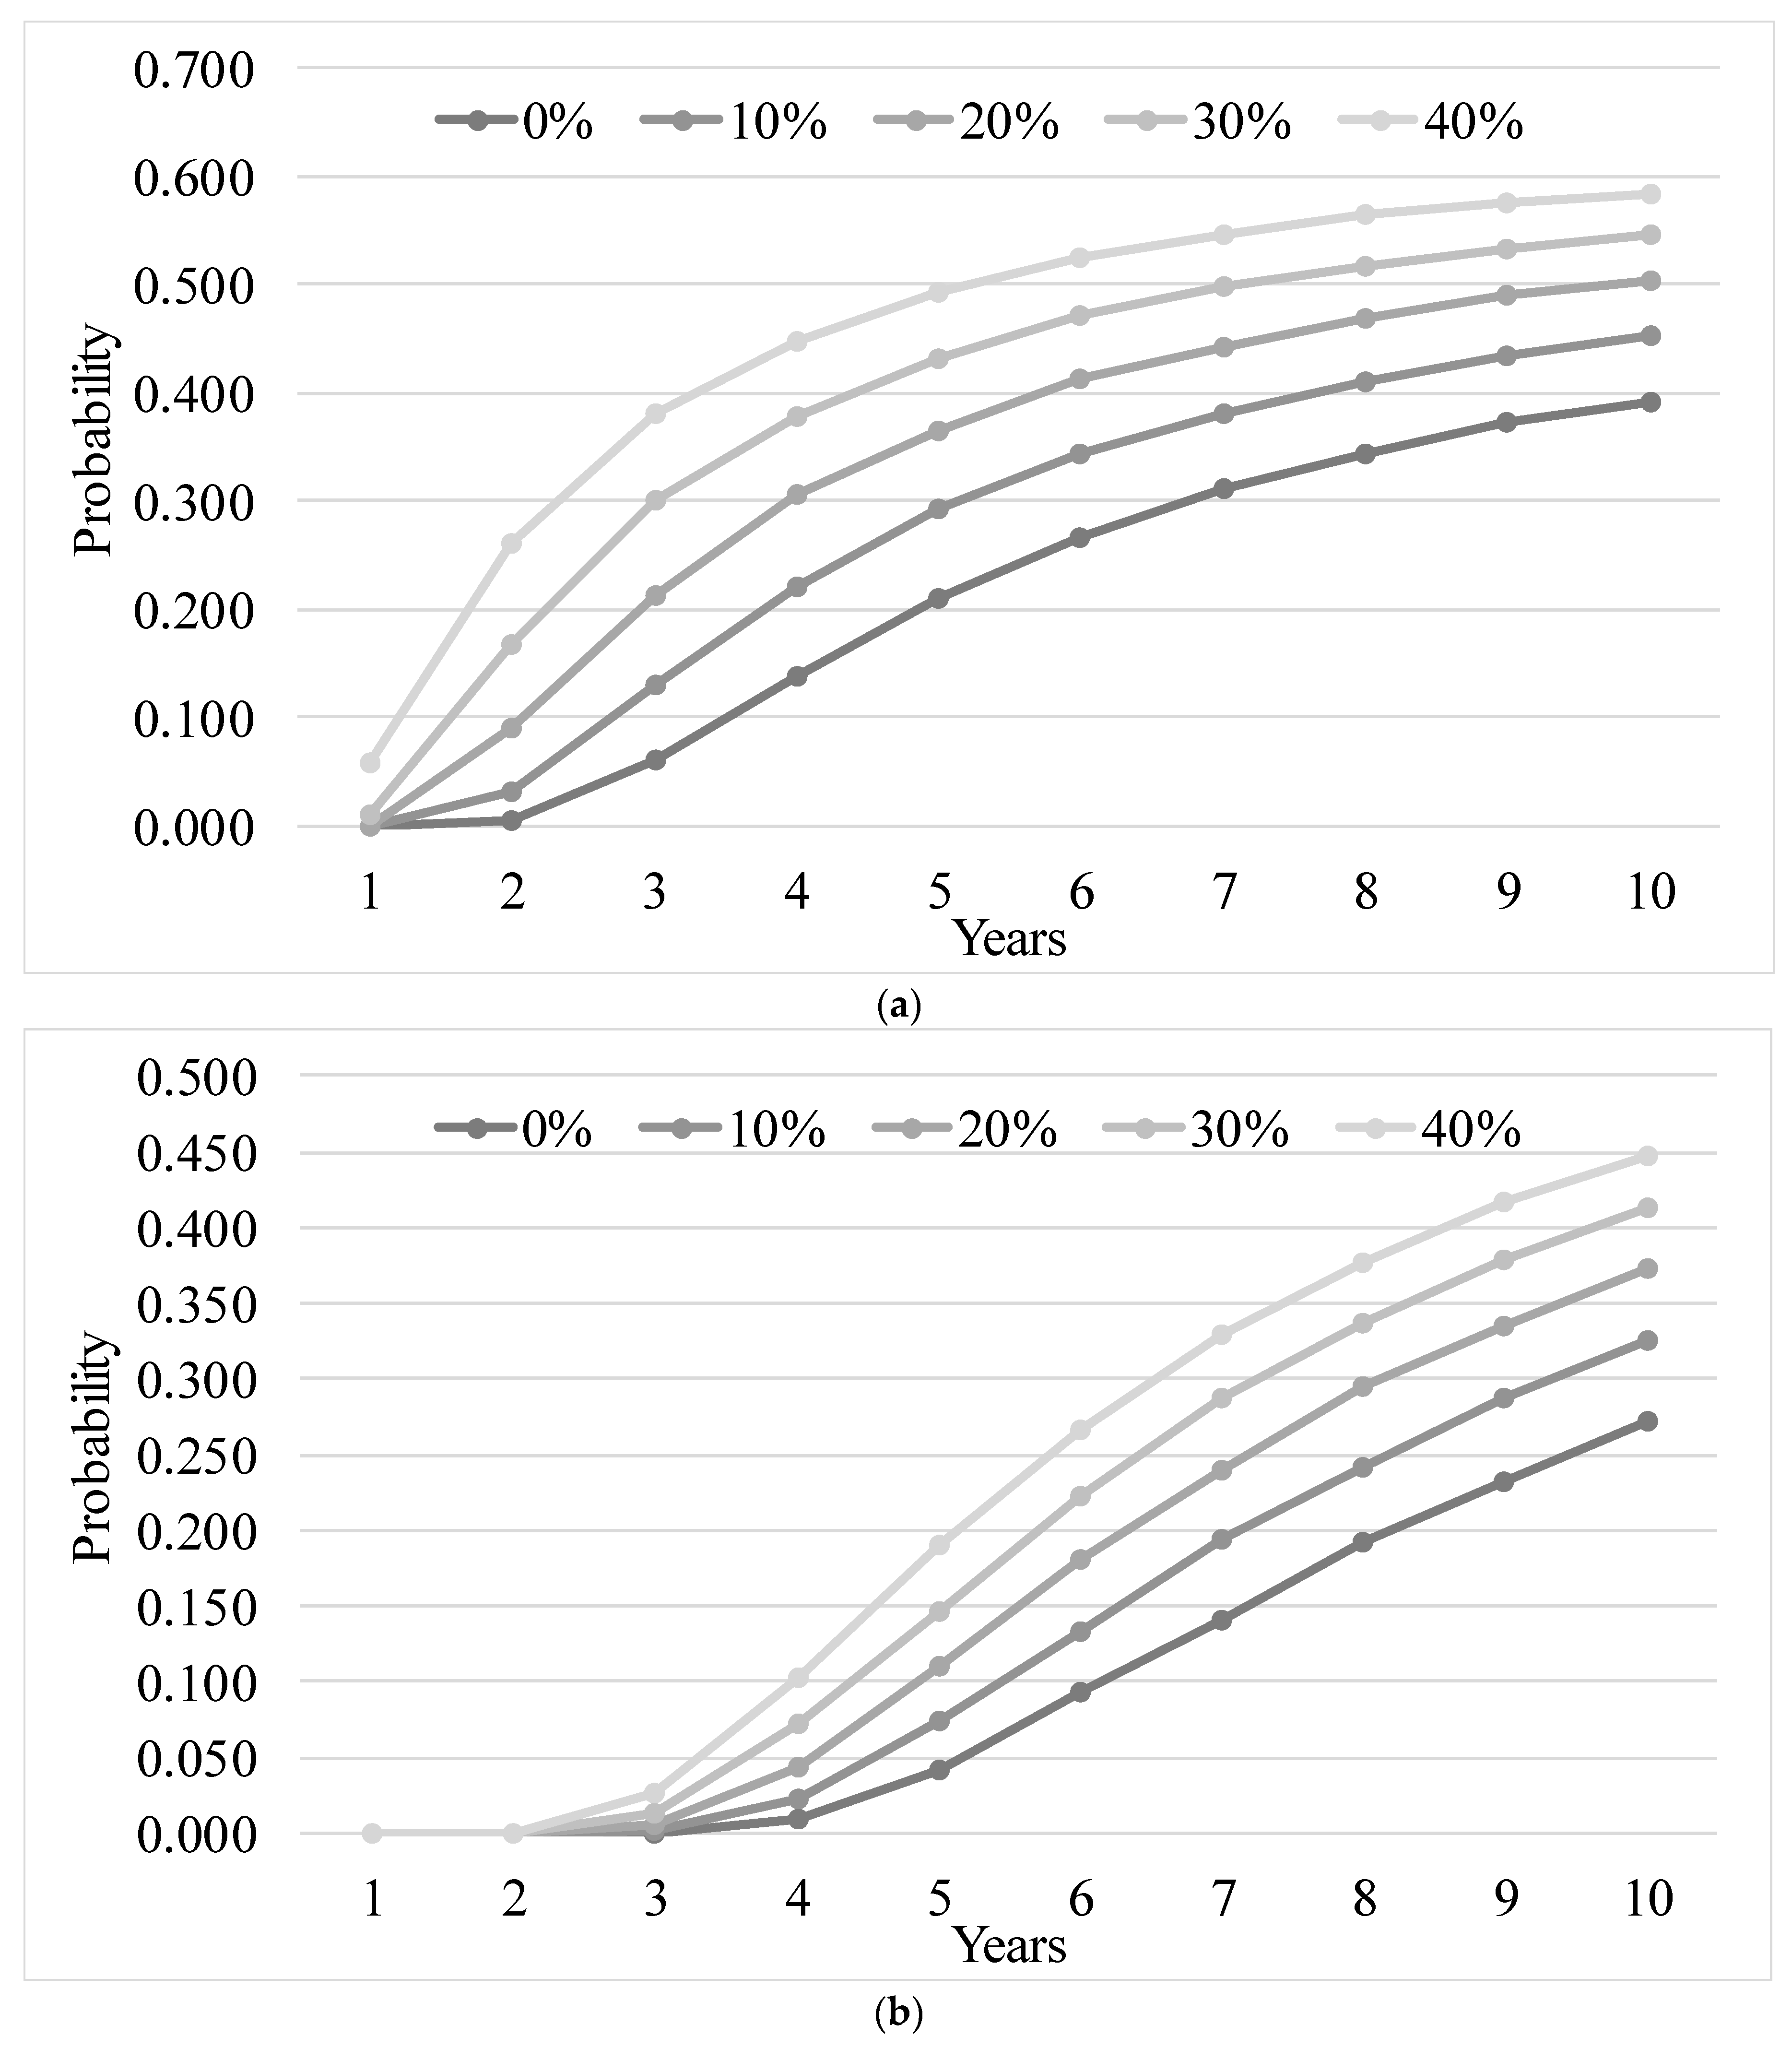
Farm production output was generated, taking into account weather variability, using the GrassGro decision support tool [17], which is used to assist decision-making in Australian sheep and beef enterprises. The whole farm risk analysis model (Figure 1a) was built using production outputs generated by GrassGro and historical prices and costs for the same period. Distributions were fitted on these inputs that were also correlated using copula. Farm’s businesses decadal key performance indicators (KPIs) were captured by integrating balance sheets, profit and loss budgets and cash flows over a ten-year simulation horizon (Appendix B). These financial statements were linked together for each of the five debt to equity (D:E) ratio scenarios using Microsoft Excel functionalities. The numbers at year 0 were static; however, these were dynamic for years 1 to 10 based on the closing figures in the previous years (Figure 1b). Monte Carlo simulations were run to capture all possible outcomes.
Production data from 2002 to 2017 simulated using the CSIRO GrassGro software were used for this analysis, which included severe drought periods during 2002 and 2006 (Figure 2) [19] covering many of the sheepmeat growing regions of Australia [20]. The variability in the production of grazing systems is driven by altering weather conditions annually, and was predicted through simulation using GrassGro version 3.3.9 [17]. Using a representative case study approach [21] the model was set up to replicate a 1000 Hectare (ha) Merino ewe farm near Tarcutta (Figure 2), south-western New South Wales (NSW), and calibrated using a field experiment conducted between 2006 and 2010, which is previously reported in Robertson et al. [22]. GrassGro is a mechanistic biophysical model that allows farmers and natural resource managers to focus on the biophysical interactions within a farming system [17]. It quantifies pasture and animal production at daily time-steps. Pasture and animal production data are extractable and are available for the analysis of risk.
The simulated farm consisted of three paddocks; two 400 ha phalaris pasture paddocks and one 200 ha lucerne paddock. The annual loss in production as a result of establishing pasture over part of the farm was accounted for by lowering the soil fertility scalar and the pasture growth rate by 5% (assuming a 20-year life span for each pasture type). The simulated Merino ewe based first-cross lamb producing flock assumed purchased replacement ewes operating at a stocking rate of five ewes/ha. The standard reference weight of ewes was 55 kg with a genotype producing 4.95 kg greasy wool of 19.6-micron. On 1 February, the ewes were joined to Suffolk rams and the resulting crossbred lambs were born in July. Sufficient replacement ewes at 18 months of age were bought each January to maintain the flock size, and ewes were cast-for-age in November when 6 to 7 years of age. On average, around 15% of adult ewes were sold per annum and 110 lambs were sold per 100 ewes. The annual mortality rate for ewes was 5%, and they were shorn annually on 15 May. The sheep continually grazed pastures, and lambs were sold between 31 October and 15 December. The lambs were not fed wheat supplements post-weaning and were sold early when the pastures were inadequate. The impact of drought meant lambs could not attain the target sale liveweight of 45 kg in years of low rainfall and poor pasture availability. However, the ewes were supplemented with wheat grain when pastures were insufficient to keep the body condition score at a minimum of 2.5. GrassGro production data were extracted into an Excel spreadsheet, matched with variable prices and costs, and gross margins were calculated for the 16 years from 2002 to 2017. 2016–2017 was taken as the base year to which prices and costs were converted in real terms (Appendix A).
The key aim of the study was to assess the business and financial risk faced by a typical wool and meat lamb enterprise in South-Eastern part of Australia by adopting a probabilistic whole-farm model. The impact of five initial debt to equity (D:E) ratios (0%, 10%, 20%, 30% and 40% as gearing ratios) on the growth in net wealth was simulated. For all gearing D:E scenarios, the opening asset levels were held constant, with debt levels modified to achieve different D:E ratios (Table 1). This provided a ‘baseline’ of opening figures against which to gauge business equity progression or decline over the simulated years.
The GrassGro simulation holds all prices and costs at a fixed level while determining gross margins (GM); for our study, however, it was important to capture the variations in these values over the 2012–2017 period for wool, ewes, lambs and feed wheat as found in key public sources [23,24,25,26] to populate Appendix A. For other variable costs, minimum, most likely and maximum values for four different years of sheep enterprise data in NSW for 2013–2014, 2014–2015, 2015–2016 and 2016–2017 from the Australian Agricultural and Grazing Industries Survey (AAGIS) [27] were adopted. Changes in whole-farm financial and economic performance were calculated using standard methods [28,29,30,31] to annually determine the farm’s total gross margin (TGM), earnings before interest and taxation (EBIT) and Net Profit (NP). The key performance indicators (KPI) of D:A (Debt:Assets or solvency ratio), equity to assets (E:A or equity ratio), changing debt to equity (D:E or gearing ratio), return on capital (ROC) and return on equity (ROE) were obtained from the balance sheet and profit & loss statements for the decadal analysis. Cash flows were used to determine the net present value (NPV) with a 4% discount rate and modified internal rate of return (MIRR) [28,29,30,31] (Figure 1) with detailed explanations provided in Appendix B. Additionally, Conditional Value-at-Risk [32,33,34] with a risk α of 10% (CVaR10) was determined for the change in equity values for each D:E scenario over the 10-year simulation period to estimate the potential mean tail-end losses of net wealth.
The fitted univariate distributions (and their theoretical summary statistics) for the input variables (Figure 1) for all D:E scenarios are shown in Table 2. Gaussian copula was fitted to establish the relationship between the inputs that gave total revenue and variable costs. The empirical correlation matrix, which was used as a parameter in the Gaussian copula, can be found in Table 3. These tables were also used to capture the changes in livestock asset values represented in the balance sheet.
In fitting distributions for the univariate input variables from Appendix A, all potential distributions including, but not limited to, uniform, triangular and PERT distributions [35] were considered. The probability density functions of these distributions are given by:
f u n i f o r m ( x ; a , b ) = ( b a ) 1 1 { x [ a , b ] } ,     < a < b < ,
f t r i a n g l e ( x ; a , b , c ) = 2 ( x a ) ( c a ) ( b a ) 1 { x [ a , b ] } + 2 ( c x ) ( c a ) ( c b ) 1 { x ( b , c ] } ,   < a b c <
f p e r t ( x ; a , b , c ) = ( x a ) α 1 1 ( c x ) α 2 1 B ( α 1 , α 2 ) ( c a ) α 1 + α 2 1 1 { x [ a , c ] } , < a b c < , α 1 = 6 ( μ a ) c a ,   α 2 = 6 ( c μ ) c a ,   μ = a + 4 b + c 6 ,   B   represents   the   Beta   function
where α = 1 + 4 b a c a and β = 1 + 4 c b c a . In the above equations, 1 { A } represents the indicator function which takes a value of 1 if the condition A specified in the curly bracket is satisfied, and 0 otherwise. The best-fitted distributions were selected using the Akaike Information Criterion (AIC), which takes into account both the likelihood ( L ) and the number of parameters ( k ) :
A I C = 2 l o g   L + 2 k .
All fitted distributions were visually checked against the empirical distributions. These multivariate input distributions were correlated using copulas (Hardaker et al., 2015). Mathematically, for d random variables X 1 ,   X 2 , ,   X d with marginal cumulative distributions functions F X i ( x ) , the joint cumulative distribution function can be written as
F X 1 X 2 X d ( x 1 , x 2 , , x d ) = C θ ( F X 1 ( x 1 ) , F X 2 ( x 2 ) , , F X d ( x d ) ) ,
for some copula function C with parameter θ . For instance, the Gaussian copula admits the form
Φ d , R ( F X 1 ( x 1 ) , F X 2 ( x 2 ) , , F X d ( x d ) ) ,
where Φ d , R represents the cumulative distribution function of the d-dimensional zero-mean normal distribution with covariance matrix R. The type of copula was selected using the “Maximum Likelihood Estimation (MLE) (High Accuracy)” functionality in the software. Under this method, the potential copulas’ parameters were estimated by maximising the joint likelihood function of the observed data. Again, AIC was used to choose the final copula type. These fitted input distributions and the copula function were used to drive the Monte Carlo simulation with 10,000 iterations. All these analyses were carried out in a Microsoft Excel® based farm budgeting spreadsheet using @RISK8.1® [36] to fit copula and execute simulations.

3. Results

The farm gross margin (GM) mean and standard deviation with variable prices and costs was $97 and $258/ha compared to $176 and $162/ha, respectively, for constant prices and costs (Figure 3). The coefficient of variation (CV) for estimated GM was nearly three times higher (0.92 vs. 2.65) when market prices and costs over the study period were assumed to be variable, compared to the constant price approach (based on means) used by GrassGro.
Total gross margins (TGM) were negative 35% of the time (Figure 4a) for all D:E scenarios. As a tool for sensitivity analysis, the tornado graph (Figure 4b) showed that variation in the quantity of total wheat supplement fed had the largest impact on the gross margin values. In good years, when less supplementary feed was needed, a TGM of around $490,000 could be achieved. In contrast, during a bad year, i.e., a drought year when large amounts of supplementary feed were needed, a TGM of around −$328,000 resulted. TGM was also heavily dependent on the net carcase weight (cwt) of wether and ewe lambs sold, which was very much dependent on pasture growth as lambs were not supplementary fed. In good years when wether and ewe lambs were heavier, a TGM of $425,000 and $418,000 could be achieved, whereas, in a bad year, the TGM losses were −$249,000 and −$243,000. Net profit (NP) or annual growth in equity was negative 53%, 55%, 57%, 59% and 60% (Figure 4c) of the time at the end of Year 10 for the five scenarios, i.e., 0% to 40% opening D:E ratios, respectively.
Figure 5a shows the probability of farm D:A ratio, as a measure of solvency, being greater than 50% for the five D:E ratio scenarios. Starting D:E ratios of 30% and 40% had a 1% and 6% probability of reaching a 50% D:A ratio within the first 12 months. The 40% D:E scenario had more than a 50% probability of the debt being higher than equity (a D:A > 50%) by the sixth year. The 30% D:E scenario reached an equivalent level by the 8th year, and the 20% D:E scenario by the 10th year.
At a more extreme level, Figure 5b shows the probability for the five D:E scenarios of farm debt rising to a level higher than assets, i.e., a D:A of 100% or more and being the point of insolvency. All five D:E ratio scenarios maintained a 1% to 10% probability of reaching insolvency by the fourth year. Starting D:E ratios of 30% and 40% reach more than 40% probability by the 10th year.
The business median gearing KPI D:E ratios showed the extreme nature of loss for higher debts. The ratio resulted 12% for D:E scenario 1 and as high as 434% for scenario 5 in year 10. D:E Scenario 5 shows debt was 4.34 times larger than equity, i.e., ~19% equity, which corresponds to the median E:A ratio (Table 4).
Similarly, the median equity KPI of E:A ratios resulted in 81% ratio for D:E scenario 1 to 19% for scenario 5 by year 10. In the case of D:E scenario 5, for example, equity declined to 0.19 times of assets, although it started at 0.71 in year 1.
The farm business median solvency KPI of D:A ratios reflected higher closing median debts. For D:E scenario 1 it ended up to be 10% starting from 0% in year 1. For D:E scenario 5, however, it was as high as 81% in year 10 from 29% in year 1, showing the compounding impact of debt. As expected, the median ROC for the first and final year was identical across all D:E scenarios due to EBIT and assets being the same across all the D:E scenarios. However, due to the impact of gearing on ROE [25], the median ROE was markedly different across all D:E scenarios. With increasing debt levels from year 1 to year 10, the impact of higher finance costs and higher gearing (D:E ratios) resulted in NP and subsequent ROE to decline, which also results in equity declining over the years. For 0% D:E scenario, the mean ROE was −1.1% for both year 1 and 10, whereas for 40% D:E scenario, it was −3.2% for year 1 and −19.2% for year 10.
Median NPV was -$1.3 million (Table 4), with a probability of being negative 70% of the time for all five D:E scenarios. Median MIRR was −0.5%, with a 73% chance of being less than the hurdle rate of 4% real interest rate for the decadal cash flows. The CVaR10 showed that for the lowest 10% of growth in equity values (value change in net worth), all D:E scenarios lost equity with the average potential net loss in equity between $4.9 m and $5.5 m.

4. Discussion

The uncertainty and variability in production and prices make farming a risky business. Copula driven Monte Carlo simulations provide a tool to understand the impact of these variabilities on the profitability of farm businesses. A higher CV, compared to the situation where prices and costs were kept static, was observed in this analysis when variabilities from different sources were joined. At gross margin (GM) level of analysis, 65% of years showed positive returns-whereas at EBIT level (inclusive of business risk and fixed costs), it was only profitable 52% of the time, and with consideration of financial risks, NP was profitable 46% of the time under D:E scenario 1 and 40% of the time under D:E scenario 5. This clearly indicates the importance of considering the profitability of agricultural activities and investments at the whole farm level, especially when the returns on these investments are gearing dependent.
Univariate distributions [36] of the input variables (i.e., price, quantity and cost) allow the study of individual impacts on the profitability of farms (Figure 4b). The total quantity of wheat supplement fed provided the largest impact. The net weight of ewe and wether lambs sold ranked the second and the third, respectively. These highlight the effect of weather variations, particularly the adverse impact of drought in this analysis. The maintenance of the flock size at five ewes per hectare during the periods of drought may have impacted the profitability. Alternatively, farmers have the option to destock or modify their grazing practices. This alternative strategy may have helped minimise the losses and reduced the accumulation of debt. The effectiveness of such tactical adjustments to stocking rate depends on the marginal costs of feeding to retain stock during a drought compared to the net costs of replacing animals’ post-drought. This would be subject to both the severity of the drought and the volatility of both supplementary feed prices and livestock prices during the drought and post-drought period [37]. The impact of such strategies can be more effectively ascertained with the approach applied in this study.
Inferred agricultural profitability reduced by a large extent, and risk escalated when all costs (Figure 4c) were considered in the five D:E scenarios. This highlights the risk of not taking all costs into consideration. Over time, the risk was summarised using cumulative distribution frequencies (Figure 4c) that showed the range of likely outcomes for NP or annual growth in equity. At the end of year 10, the D:E scenario with the highest opening debt had a negative NP 60% of the time due to debt servicing costs, highlighting the impact of debt on financial risk and on profitability and net wealth. A higher number of drought years would put such a farm, even without any opening debt, in financial difficulty with a probability of 53% in making a loss. This analysis highlights the need for farms to plan for poor years, as with increasing climate variability, it is likely that increasing proportions of farming businesses may be at risk if they do not adopt drought mitigation strategies.
Median ending decadal cash balance, i.e., debt accumulation, tells a similar story (Table 4), as does the effect of debt on the net worth of the farm over time. Hutchings and Nordblom [9] define a farm as financially viable if it’s chance of having a positive growth in equity over a random decade is greater than 60%. According to our study, this does not occur under any D:E scenario, with the probability of positive equity growth ranging between 41% to 33% for D:E scenarios 1 to 5. Given the correlations between the input variables taken into account through the method applied, it may be exacerbating the negative interactions between variables and their impact on profitability. Another reason for the difference in outcome may be that this study used a single livestock enterprise whereby Hutchings and Nordblom [9] was based on a mixed farming system in which diversification is known to improve financial stability [29].
The solvency and gearing ratios became worse from year 1 to 10 as we moved from low debt to high debt scenarios. In this study, a higher gearing ratio only results in negative outcomes when ROC is less than the interest rate (4%). When ROC is higher than the interest rate, then more highly geared the business is, more positive are the gains in equity [29]. The challenge in agriculture is the large variability in TGM, EBIT and subsequent ROC, where the latter can often be lower than the cost of finance. Hence, highly geared businesses, as is the case in this study, accelerate towards larger losses in net wealth/equity, or even worse, insolvency within a short period of time.
The median ROC was the same in all D:E scenarios (Table 4), as the cost of servicing debt is not considered for in the calculations. The median ROE in the tenth year, however, was much worse as we moved from low to high opening D:E ratios, which resulted from a smaller NP divided by even smaller equity. Under all D:E scenarios–year 1 results indicate that the business is negatively geared, i.e., ROE < ROC, therefore ROC < Interest rate, so any debt is undesirable. Table 4 only showed the median value to highlight the long term impacts of drought within the ongoing debt levels and business resilience; however, the variability of ROE in year 10 would be increasing. CVaR10 showed the downside risk for all five D:E scenarios (Figure 5a,b), with scenario 5 making the biggest losses, although all opening D:E ratio scenarios made substantial losses at the tail end. The CVaR10 values are higher than the starting equity for all. Krause [38] regard >30% as a weak (<10% as strong) debt to asset (D:A) ratio, whereas the 50% solvency ratio used as a threshold in Figure 5a corresponds to a situation where if farm’s debt position gets worse than that, lenders are not likely to continue supporting the business.

5. Conclusions

Increasing gearing leads to more variable equity growth and increased chances of losing equity. If farmers do nothing to change their management in response to drought (especially reducing debt), then they are likely to increase their chance of insolvency. Although it would be advisable to keep equity levels above a prescribed threshold level, there is uncertainty around what is a safe level of debt. To define a safe level of debt, this study showed that it requires region and farm enterprise-specific analysis, as well as also being dependent on a farmers’ attitude to risk [12]. Further research directions include applying a similar method to conduct further analyses in different contexts, such as comparing mixed crop-livestock enterprises in different areas. To better assist local farmers in making decisions, especially given the likelihood of droughts in Australia and the severe impacts of accruing liabilities, risk profiles for different sheep producing regions could also be created.
In calculating the gross margins, GrassGro assumes all prices are static, and this is useful for some purposes. However, constant prices and non-whole farm-level analysis certainly does not help farmer make decisions in the context of their resilience to drought shocks and long term viability, as a gross margin and constant price approach grossly under-estimates both business and financial risks in agricultural investments. By incorporating the variability in input costs, output prices and production due to extreme weather conditions, the usefulness of GrassGro is further enhanced, which allows more accurate and realistic financial risk assessment.
If the recent climate (during a period of quite extreme variability) is a reflection of the future climate, this work highlights the importance of considering the true financial performance of a business and the need to tactically and strategically modify management to ensure long term financial viability.
It reinforces the need for farm managers to consider their debt levels/leverage and their capacity to generate returns in excess of the cost of external liabilities, rather than rely on gross margins as the key tool in supporting decision making.
Using the copula-based approach described in this research enables farm managers and their advisors to better explore alternatives under more realistic environmental and market variability.
It is known that the individual distributions of the input variables have a considerable impact on the copula fitted and hence the simulation results [39]. While the distributions were selected based on AIC in this work, other measures such as those mentioned in [40] would be used. Other methods such as the hybrid method proposed by [41] may also be considered. The study on the impact of different choices of individual distributions will be left for future research.

Author Contributions

Conceptualisation by S.S.G., T.N., T.H., R.H.L.I. and K.B.; Methodology, S.S.G., T.N., R.H.L.I. and K.B.; Software, GrassGro simulation for the production run by S.R. and S.S.G.; Validation, GrassGro model simulated production by S.R. and Palisade @RISK8.1 by S.S.G.; Formal analysis, S.S.G., T.N., R.H.L.I., K.B. and T.H.; Data curation, S.S.G.; Writing—S.S.G., T.N., K.B., R.H.L.I., S.R. and T.H.; Original draft preparation, S.S.G., T.N., R.H.L.I., S.R., K.B. and T.H.; Writing—review and editing, S.S.G., T.N., K.B., R.H.L.I., S.R. and T.H.; Visualisation, S.S.G., T.N. and K.B. All authors have read and agreed to the published version of the manuscript.

Funding

This research received no external funding.

Institutional Review Board Statement

Not applicable.

Data Availability Statement

Data is contained within the article.

Acknowledgments

We are indebted to several people for making this paper possible in its present form through their contributions and comments. Peter Martin, Senior Economist, Australian Bureau of Agricultural and Resource Economics and Sciences (ABARES), provided the state-wise breakdown of the cost of production and financial performance data for sheep enterprises in Australia. Henry Ridge, Project Coordinator Woolgrower Services, Australian Wool Innovation, provided historical data for different wool classes. Neville Herrmann, Software Developer, GRAZPLAN, CSIRO Agriculture & Food, helped answer some of our queries about GrassGro. Nepal Ghosh CA JP, Assistant Manager–Business Advisory, RSM Australia Pty Ltd., responded to our questions regarding farm business taxation. We are indebted to the Graham Centre for Agricultural Innovation (an alliance between Charles Sturt University and the NSW Department of Primary Industries) for supporting this work. An earlier version of the paper was presented at the AARES conference in Melbourne in February 2019 [42].

Conflicts of Interest

The authors declare no conflict of interest.

Appendix A

Historical annual market prices, variable costs and quantities for the 1000 ha merino ewe and first-cross lamb enterprise (all inputs are variables). Individual univariate probability distributions were fitted on the input variables in the first six columns for shearing, husbandry, rams replacement costs, pasture maintenance and establishment costs. Rams bought, and total land area was constant values across all years.
YearWool Clean 20 µm ($/kg)Net Wool Cut (kg)Price cwt Mutton 18–24 kg ($/kg)Price Merino Sheep Skin 24.1 kg + 1.5″–2″ ($/skin)Ewes Sold Cast for Age (no.)Net cwt of ewes Sold (kg)Price cwt Trade Lamb 18–22 kg ($/kg)Price cwt Light Lamb 12–18 kg ($/kg)Price Lamb Skin 16.1–20 kg 1″–2″ ($/skin)Wether Lambs Sold (no.)Net cwt of Wether Lambs Sold (kg)Ewe Lambs Sold (no.)Net cwt of ewe Lambs Sold (kg)Total shorn (no.)Ewe (no.)Lamb (no.)Ewes ($/hd)Ewes Bought (no.)Feed Wheat Prices (AUD/t)Total Supplement Fed (Tonnes)Rams Bought (no.)Total ha
200215.4166112.318.481427.44.84.013.4266013.1265512.049124872531596107030743216.71000
200314.9161892.915.383528.35.54.911.525886.725836.74900487351711231110435127416.71000
200412.1149502.719.192128.35.44.715.024998.525058.4492248625004130112430682616.71000
200510.5153322.412.583429.24.84.27.927499.027388.9493549015487116120226276016.71000
200610.9166561.914.180424.14.43.510.1273310.8273910.04917490154721001087251107316.71000
200713.3119382.013.482527.54.13.49.7254911.7254010.9492048925089941052363109516.71000
200811.5156052.412.587127.94.83.99.0283414.4283913.0491648835673104107852249916.71000
20099.9154573.08.093928.75.34.44.5269415.9270014.1491848965394116113738977616.71000
201011.2156444.416.584629.15.95.412.6271817.6273115.8490848965449155117327531516.71000
201115.4171734.723.379129.36.36.218.0286318.1285616.249304880571917711102982116.71000
201213.6166722.815.882028.94.64.411.7286015.7286613.9490848805726123109525012316.71000
201312.8153592.214.385828.94.63.910.8280916.1282214.5490448815631104110433063416.71000
201412.2165573.39.589928.65.44.86.3262315.6260313.6490748765226125112132534916.71000
201513.2162363.712.481328.65.75.38.4276516.8275615.0491348925521140117530460116.71000
201614.5161623.615.285129.45.85.69.5239218.6239416.5491948894786149108228551616.71000
201716.1163224.515.484427.66.36.211.5282811.028279.8492348915655168111222875816.71000
Shearing ($/hd)Husbandry per ewe ($)Husbandry per lamb ($)Purchase cost per ram ($)Pasture costs ($/ha)Pasture establishment costs ($/ha)
Min11.47.87.850035.60.0
Most Likely11.99.09.074638.926.5
Max12.110.610.6250040.50.0

Appendix B

The net worth or owner’s equity in the farm was defined as:
N e t   w o r t h = T o t a l   f a r m   a s s e t s T o t a l   f a r m   l i a b i l i t i e s
Risk profiles are generated from the balance sheet. The profiles were represented using cumulative distribution functions (CDFs) [12], demonstrating the stochastic nature of growth in equity and called “distributions of decadal change in equity″. Examples based on mixed farming systems in Australia can be found in Hutchings [43].
The balance sheet was driven by the linked annual profit and loss budgets. Solvency ratios such as debt to assets and equity to assets, expressed in percentages, were used to determine if a farm could survive during an economic downturn. These were calculated from the balance sheet by dividing the farm owner’s total debt and total equity by the total assets managed to represent the number of assets on which the owners have a residual claim.
D e b t   t o   a s s e t s   r a t i o = T o t a l   f a r m   Debt   T o t a l   f a r m   A s s e t s   × 100 %
E q u i t y   t o   a s s e t s   r a t i o = T o t a l   f a r m   E q u i t y   T o t a l   f a r m   A s s e t s   × 100 %
The debt to equity ratio was another leverage ratio which compares the farm’s total liability to its total equity. Essentially this ratio uses the farm’s balance sheet to measure the proportion of the business financed by creditors versus what the owners have committed.
D e b t   t o   E q u i t y   r a t i o = T o t a l   f a r m   L i a b i l i t i e s   T o t a l   f a r m   E q u i t y   × 100 %
Unless the amount of capital utilised to produce the profit is taken into account, profit alone does not illustrate economic efficiency. Return on capital (ROC), or assets managed, examines the farm’s efficiency in generating returns through capital resources allocation.
R O C = O p e r a t i n g   p r o f i t   o r   E B I T T o t a l   a s s e t s   m a n a g e d   × 100 %
The return on owner’s equity (ROE) ratio provides a measure for the return generated based on the capital invested by the owners.
R O E = N e t   p r o f i t T o t a l   E q u i t y   × 100 %
These key performance indicators (KPIs) were reported in both opening and closing balances every year.
Profitability in each year was then estimated using a profit and loss budget and a farm business growth method adopted by Malcolm, Makeham and Wright [28]. The total gross margin (TGM) was calculated as the difference between the farm gross income (GI) and the total variable costs (TVC):
T G M = G I + o r c h a n g e   i n   l i v e s t o c k   a s s e t   v a l u e T V C
The gross income (GI) is defined as the price (P) of output produced multiplied by the quantity (Q) of output. Both P and Q are variable for any farms, hence involving risk. These P and Q were correlated and jointly defined a multivariate distribution, which was used to simulate yields and prices data that mimic the real world. Distributions of profit and loss budgets and cash flows over ten years were generated by conducting 10,000 iterations of simulations for each of the debt scenarios. In each iteration, prices, quantities and costs were simulated through the multivariate distributions fitted from historical data. Financial ratios and indicators were hence derived.
Sensitivity analysis was carried out by analysing the mean changes in the TGM values under various input variable scenarios. Specifically, the simulated values of inputs were first sorted in ascending order. These values were then grouped into ten equal-sized bins, each representing a scenario. The mean TGM under each scenario was computed. The entire range as well as the means of the lowest and highest ten gross margins were presented in the form of a tornado graph.
Earnings before interest and tax (EBIT) was estimated as the total gross margin (TGM) less the overhead or fixed costs (OH). EBIT was also referred as farm operating profit (OP), which was considered as a reward to everyone who contributed to the capital used in the business. A managerial allowance amounted $60,000 plus family drawings of $36,000 was deducted before obtaining net growth. An annual depreciation of 5%, calculated using a straight-line balance method, of capital invested in machinery was considered as the only fixed cost. The annual depreciation was calculated as:
A n n u a l   d e p r e c i a t i o n = ( b o o k   v a l u e   a t   b e g i n n i n g   o f   y e a r ) × R
where R was a constant rate, and the earnings before interest and tax (EBIT) was calculated as:
E B I T = T G M O H
The reward to the farmer’s capital, net farm profit before tax (NPBT), was calculated as EBIT less interest.
N P B T = E B I T i n t e r e s t   p a i d   t o   c r e d i t o r s
Tax was not dealt with in this analysis to keep the Net profit comparison basis the same for five farm debt scenarios as it would have given an undue advantage to the farm with higher debt.
N P   o r   g r o w t h   i n   e q u i t y = N P B T l i v i n g   e x p e n s e s
For all assumed debt scenarios, in the years the business was unable to repay its liabilities, i.e., if operating profit exceeded the combined total of interest on loans and family drawings, these repayment amounts were paid directly from the operating profit, or else were met from the bank overdraft facility and the balance carried forward to the next period.
Cash flow is defined as earnings after tax plus depreciation. Depreciation and interest were added back to the net farm income. Net present values (NPVs) were estimated for all the five scenarios, assuming that the initial investment in year zero was all the capital invested in the farm business/project, including debt and owner’s equity. A discount or hurdle rate RR of 4% per annum based on Australian Bankers’ Association [44] nominal 6.5% interest rate ( R ) estimates to move the cash flows (CF) from year 1 to 10–each cash flow was multiplied by the discount factor to move the CF back in the current period of 2017, commonly known as discounting and using an average of annual inflation ( π ) for the duration of the analysis, the real return ( R R ) can be calculated as follows:
R R = 1 + R ( 1 + π ) 1 = 1 + 6.5 % ( 1 + 2.4 % ) 1 = 4 %
Mathematically, NPV can be calculated as
N P V = P V   ( B e n e f i t s ) P V   ( C o s t s )
The decision is to accept the project if NPV > 0.
N P V = I 0 + C F 1 ( 1 + R R ) t 1 + C F 2 ( 1 + R R ) t 2 + + C F n ( 1 + R R ) t n + s a l v a g e   v a l u e
where I 0 was the initial investment cost of capital or capital expenditure (CAPX), C F i was the cash flow in period i , t i was the time the i th cash flow was received, RR was the discount or hurdle rate, assumed to be constant for the whole period. The salvage value was that leftover at the conclusion of the project, which was assumed to be the closing farm asset value excluding any cash surpluses received in all five gearing scenarios, i.e., debt to equity (D:E) ratio scenarios.
The modified internal rate of return (MIRR) [31] was used to compute the investment’s attractiveness. The rate at which the capital was borrowed was 4%, and the rate at which the funds could be reinvested was 2%. The decision rule is to accept the project if MIRR > RR, in the prospect of good years in the future, although here the evaluation is made in retrospect given the occurrence of terrible drought.

References

  1. Kimura, S.; Antón, J.; Lethi, C. Farm Level Analysis of Risk and Risk Management Strategies and Policies: Cross Country Analysis. In OECD Food, Agriculture and Fisheries No. 26; OECD Publishing: Paris, France, 2010. [Google Scholar]
  2. Kimura, S.; Antón, J. Risk Management in Agriculture in Australia. In OECD Food, Agriculture and Fisheries Papers, No. 39; OECD Publishing: Paris, France, 2011. [Google Scholar]
  3. Blackburn, A.; Rod, A. Financing Your Farm: A Practical Guide to Financial Growth, 4th ed.; Australian Bankers’ Association in conjunction with Grain Growers Association: Sydney, Australia, 2006. [Google Scholar]
  4. Australian Bureau of Statistics. Agricultural Commodities, Australia, 2016–2017, Catalogue No. 7121.0. Available online: http://www.abs.gov.au/AUSSTATS/[email protected]/DetailsPage/7121.02016-17?OpenDocument (accessed on 17 December 2018).
  5. Frilay, J.; van Dijk, J.; Ashton, D. Financial Performance of Lamb Producers, 2014–2015 to 2016–2017; Australian Bureau of Agricultural and Resource Economics and Sciences: Canberra, Australia, 2017.
  6. Malcolm, B. Financing Matters. AFBM J. 2011, 8, 11–18. [Google Scholar]
  7. Warn, L.; Ware, J.B.; Salmon, L.; Donnelly, J.; Alcock, D. Analysis of the Profitability of Sheep Wool and Meat Enterprises in Southern Australia. Final Rep. Proj. 1.2.6; Sheep Co-Operative Research Centre: Melbourne, Australia, 2006. [Google Scholar]
  8. Holmes Sackett. Prime Lamb Situation Analysis; Meat & Livestock Australia Limited: Sydney, Australia, 2010. [Google Scholar]
  9. Hutchings, T.R.; Nordblom, T.L. A Financial Analysis of the Effect of the Mix of Crop and Sheep Enterprises on the Risk Profile of Dryland Farms in South-Eastern Australia. AFBM J. 2011, 8, 19–41. [Google Scholar]
  10. Sklar, A. Fonctions De Répartition À N Dimensions Et Leurs Marges. Publ. Inst. Stat. Univ Paris 1959, 8, 229–231. [Google Scholar]
  11. Nelsen, R.B. An Introduction to Copulas, 2nd ed.; Springer: New York, NY, USA, 2006. [Google Scholar]
  12. Hardaker, J.B.; Lien, G.; Anderson, J.R.; Huirne, R.B.M. Coping with Risk in Agriculture; CABI: Wallingford, UK, 2015. [Google Scholar]
  13. Nguyen-Huy, T.; Deo, R.C.; Mushtaq, S.; Kath, J.; Khan, S. Copula-Based Agricultural Conditional Value-at-Risk Modelling for Geographical Diversifications in Wheat Farming Portfolio Management. Weather Clim. Extem. 2018, 21, 76–89. [Google Scholar] [CrossRef]
  14. Ji, Q.; Bouri, E.; Roubaud, D.; Shahzad, S.J.H. Risk Spillover between Energy and Agricultural Commodity Markets: A Dependence-Switching Covar-Copula Model. Energy Econ. 2018, 75, 14–27. [Google Scholar] [CrossRef]
  15. Vergni, L.; Todisco, F.L.; Mannocchi, F. Analysis of Agricultural Drought Characteristics through a Two-Dimensional Copula. Water Resour. Manag. 2015, 29, 2819–2835. [Google Scholar] [CrossRef]
  16. Riberiro, A.F.S.; Russo, A.; Gouveia, C.M.; Páscoa, P. Copula-Based Agricultural Drought Risk of Rainfed Cropping Systems. Agric. Water Manag. 2019, 223, 2795–2809. [Google Scholar]
  17. Moore, A.D.; Donnelly, J.R.; Freer, M. Grazplan: Decision Support Systems for Australian Grazing Enterprises. Iii. Pasture Growth and Soil Moisture Submodels, and the Grassgro Dss. Agric. Syst. 1997, 55, 535–582. [Google Scholar] [CrossRef]
  18. Lehman, D.; Groenendaal, H. Practical Spreadsheet Modeling Using @Risk; CRC Press: Boca Raton, FL, USA, 2020. [Google Scholar]
  19. Bureau of Meteorology. Previous Droughts; Australian Government, Bureau of Meteorology: Melbourne, Australia, 2021. [Google Scholar]
  20. Behrendt, K.; Weeks, P. How Are Global and Australian Sheepmeat Producers Performing? Global agri benchmark network results 2017. In MLA Market Information; Meat and Livestock Australia Ltd.: North Sydney, Australia, 2018. [Google Scholar]
  21. Nuthall, P.L. Farm Business Management Analysis of Farming Systems; CABI: Wallingford, UK, 2011. [Google Scholar]
  22. Robertson, S.M.; Broster, J.C.; Friend, M.A. Performance of Sheep Systems Grazing Perennial Pastures. 1. Pasture Persistence and Enterprise Productivity. Anim. Prod. Sci. 2019, 60, 388–405. [Google Scholar] [CrossRef]
  23. Australian Bureau of Agricultural and Resource Economics and Sciences. Agricultural Commodity Statistics 2018. ABARES. Available online: https://www.agriculture.gov.au/abares/research-topics/agricultural-outlook/data#agricultural-commodities (accessed on 20 December 2018).
  24. Meat and Livestock Australia. Saleyard Sheep and Lamb Indicators: New South Wales, Australia. Available online: http://statistics.mla.com.au/Report/List (accessed on 10 January 2019).
  25. Meat and Livestock Australia. Sheepskin Prices: Merino Sheep: New South Wales, Australia. Available online: http://statistics.mla.com.au/Report/List (accessed on 10 January 2019).
  26. Ridge, H.; (Australian Wool Innovation Limited, Sydney, Australia). Personal Communication, 2018.
  27. Martin, P. Cost of Sheep Production; Australian Bureau of Agricultural and Resource Economics and Sciences: Canberra, Australia, 2018.
  28. Malcolm, B.; Makeham, J.; Wright, V. The Farming Game: Agricultural Management and Marketing, 2nd ed.; Cambridge University Press: Melbourne, Australia, 2005. [Google Scholar]
  29. Behrendt, K.; Malcolm, B.; Jackson, T. Beef Business Management. In Beef Cattle Production and Trade; Cottle, D., Kahn, L., Eds.; CSIRO Publishing: Collingwood, Australia, 2014. [Google Scholar]
  30. Amidy, M.R.; Behrendt, K.; Badgery, W.B. Assessing the Profitability of Native Pasture Grazing Systems: A Stochastic Whole-Farm Modelling Approach. Anim. Prod. Sci. 2017, 57, 1859–1868. [Google Scholar] [CrossRef] [Green Version]
  31. Barry, P.J.; Ellinger, P.N. Financial Management in Agriculture, 7th ed.; Prentice Hall: Boston, MA, USA, 2012. [Google Scholar]
  32. Sarykalin, S.; Serraino, G.; Uryasev, S. Value-at-Risk Vs. Conditional Value-at-Risk in Risk Management and Optimisation. In State-of-the-Art Decision-Making Tools in the Information-Intensive Age; INFORMS Tutorials in Operations Research: Catonsville, MD USA, 2014; pp. 270–294. [Google Scholar]
  33. Rockafellar, R.T.; Uryasev, S. Conditional Value-at-Risk for General Loss Distributions. J. Bank. Financ. 2002, 26, 1443–1471. [Google Scholar] [CrossRef]
  34. Szegö, G. Measures of Risk. J. Bank. Financ. 2002, 26, 1253–1272. [Google Scholar] [CrossRef]
  35. Rees, M. Business Risk and Simulation Modelling in Practice: Using Excel, VBA and @Risk, 1st ed.; Wiley Finance Series: Newark, NJ, USA, 2015. [Google Scholar]
  36. @Risk, Decision Tools Suite 8. Palisade Corporation; Palisade Decision Tools: Ithaca, NY, USA, 2021.
  37. Buxton, R.; Smith, M.S. Managing Drought in Australia’s Rangelands: Four Weddings and a Funeral. Rangel. J. 1996, 18, 292–308. [Google Scholar] [CrossRef]
  38. Krause, M. Farming the Business Sowing for Your Future; Grains Research & Development Corporation (GRDC): Canberra, Australia, 2014. [Google Scholar]
  39. Fantazzini, D. The Effects of Misspecified Marginals and Copulas on Computing the Value at Risk: A Monte Carlo Study. Comput. Stat. Data Anal. 2009, 53, 2168–2188. [Google Scholar] [CrossRef]
  40. Delignette-Muller, M.L.; Dutang, C. fitdistrplus: An R Package for Fitting Distributions. J. Stat. Softw. 2015, 64, 34. [Google Scholar] [CrossRef] [Green Version]
  41. Zwick, D.S. A Hybrid Method for Fitting Distributions to Data and its Use in Computing Process Capability Indices. Qual. Eng. 1995, 7, 601–613. [Google Scholar] [CrossRef]
  42. Godfrey, S.; Nordblom, T.; Ip, R.; Robertson, S.; Hutchings, T. Using GrassGro® with @Risk®: Merino Ewe/First-Cross Lamb Enterprise Risk Profiles with Variable Prices and Weather; Australasian Agricultural and Resource Economics Society (AARES): Melbourne, Australia, 2019. [Google Scholar]
  43. Hutchings, T.R. Financial Risk on Dryland Farms in South-Eastern Australia. Ph.D. Thesis, Charles Sturt University, Wagga Wagga, Australia, 2013. [Google Scholar]
  44. Australian Bankers’ Association. Agriculture in Australia: Activity and Financing, Economic Report; Australian Bankers’ Association Inc.: Sydney, Australia, 2016. [Google Scholar]
Figure 1. (a) Sheep farm risk assessment model. The diagram distinguishes between the following elements, each with its own shape: Decisions: Rectangle, Input parameters: dashed line triangles for volatility, Output: Oval, Objectives: Hexagon, Diagram idea source: Lehman and Groenendaal [18]. TGM is farm’s total gross margin, EBIT is earnings before interest and taxation, NP is net profit, NPV is net present value and MIRR is modified internal rate of return. (b) Interlinked financial statements.
Agriculture 11 00366 g001
Figure 2. Map: Rainfall amounts based on rainfall deciles from 1997 to 2009 recorded by the Australian Bureau of Meteorology, see [19] for details. The case study site, Tarcutta, is indicated.
Agriculture 11 00366 g002
Figure 3. Annual gross margins (GM) for sheep enterprise with constant (grey bars) and variable prices (dark bars).
Agriculture 11 00366 g003
Figure 4. (a) Cumulative distribution frequency of total farm gross margin (TGM) in year 10, where the y-axis shows the probability of obtaining a value less than or equal to the corresponding x-axis value. The percentage on the top-right of the graph indicates the proportion of simulated TGM being greater than zero. The percentage on the top-left of the graph indicates the proportion of simulated TGM being less than or equal to zero. (b) Mean total gross margin (TGM) values at the highest 10% (dark bars) and lowest 10% (light bars) of simulated values of input variables at year 10. The numbers at the edges of each bar represent the mean TGM values for each selected input. (c) Cumulative distribution frequency of Net profit (NP) in year 10 for the five starting debt to equity scenarios, where the y-axis shows the probability of obtaining a value less than or equal to the corresponding x-axis value. The percentage on the top-right of the graph indicates the proportion of simulated TGM being greater than zero. The percentage on the top-left of the graph indicates the proportion of simulated TGM being less than or equal to zero. Summary statistics for each D:E scenario are provided on the right-hand side.
Agriculture 11 00366 g004aAgriculture 11 00366 g004b
Figure 5. (a) Probability of farm debt to asset (D:A) ratio being greater than 50% under different starting debt levels (D:E Scheme 0. 20%, 30% and 40%) over the 10 year simulation period. (b) Probability of farm debt to asset (D:A) ratio being greater than 100% (point of insolvency) under different starting debt levels (D:E scenarios 0%, 10%, 20%, 30% and 40%) over the 10 year simulation period.
Agriculture 11 00366 g005
Table 1. Opening balance sheet.
AssetsLiabilities
Land $2,500,000 @$2500/ha × 1000 Hectares 1Five opening debt to equity (D:E) ratio scenarios:
  • D:E Scenario1: 0%
  • D:E Scenario2: 10%
  • D:E Scenario3: 20%
  • D:E Scenario4: 30%
  • D:E Scenario5: 40%
Machinery $500,000
Livestock $674,965 approximately according to the market value of ewes 2
Total Assets: $3,674,965Total Liabilities: $0; $333,000; $613,000; $847,000; $1,050,000
1 The opening values for land and machinery were based on expert opinion. 2 The model accounts for ewes bought and sold, and the stock numbers were maintained. The market value of ewes was based on Meat and Livestock Australian (MLA) data as follows: Market Value ($/hd) = [Liveweight weight (kg) × 0.45 × Carcass weight price ($/kg)] + Skin value ($/hd).
Table 2. Fitted distributions of historical prices, total variable costs and quantities (and their theoretical summary statistics) for the 1000 ha merino ewe and first-cross lamb enterprise.
Historical Prices and Quantities
InputMinimumMaximumMeanMedianSDDistributionParameter
Wool clean 20 µm ($/kg)9.516.513.013.02.0Uniform(9.5, 16.5)
Net wool cut (kg)8695.217,173.315,760.216,075.81194.2Pert(8695.2, 17,173, 17,173)
Price cwt mutton 18–24 kg ($/kg)1.74.93.33.30.9Uniform(1.7, 4.9)
Price merino sheep skin 24.1 kg + 1.5″–2″ ($/skin)6.624.615.114.93.7Triangle(6.5, 14.1, 24.6)
Ewes sold cast for age (numbers) 791.0961.6847.9841.040.2Triangle(791, 791, 961.6)
Net cwt of ewes sold (kg)23.729.427.527.81.4Triangle(23.7, 29.4, 29.4)
Price cwt Trade lamb 18–22 kg ($/kg)4.06.45.25.20.7Uniform(4, 6.4)
Price cwt Light lamb 12–18 kg ($/kg) 3.26.44.84.80.9Uniform(3.2, 6.4)
Price lamb skin 16.1–20 kg 1″–2″ ($/skin)3.419.310.810.53.3Triangle(3.4, 9.7, 19.3)
Wether lambs sold (numbers)2332.62863.02686.22707.6125.0Triangle(2332.6, 2863, 2863)
Net cwt of wether lambs sold (kg)4.618.613.914.53.3Triangle(4.6, 18.6, 18.6)
Ewe lambs sold (numbers)2332.42866.02688.12709.713.1Triangle(2332.4, 2866, 2866)
Net cwt of ewe lambs sold (kg)5.016.512.713.12.7Triangle(5.1, 16.5, 16.5)
Historical Total Variable Costs and Quantities
Total shorn (numbers)4897.54939.94915.14913.99.0Triangle(4897.5, 4908, 4940)
Ewe (numbers)4855.84900.64885.74887.510.5Triangle(4855.8, 4900.6, 4900.6)
Lamb (numbers)4666.25726.05372.75415.6249.8Triangle(4666.2, 5726, 5726)
Ewes ($/head)93.8190.9126.1122.222.9Triangle(93.8, 93.8, 190.9)
Ewes bought (numbers)1042.01221.91115.31109.738.6Triangle(1042.1, 1082, 1221.9)
Feed wheat prices (AUD/t)228.4771.2318.8298.676.5Pert(228.4, 228.4, 771.2)
Total supplement fed (tonnes) *0.01357.5647.5647.5409.0Uniform(0.0,1357.5)
Inputs without Historical DataMinimumMost LikelyMaximum
Shearing ($/head)11.411.912.1 Pert(11.4, 11.9, 12.1)
Husbandry ($/ewe) 7.89.010.6 Pert(7.8, 9.0, 10.6)
Husbandry ($/lamb)5007462500 Pert(7.8, 9.0, 10.6)
Rams replacement ($/ram)35.638.940.5 Pert(500, 746, 2500)
Pasture costs ($/ha)26.526.526.5 Pert(35.6, 38.9, 40.5)
Pasture establishment costs ($/ha)11.411.912.1 Pert(24.2, 26.5, 27.6)
* For Total supplement fed (tonnes), the original theoretical minimum was −62.6, which was not realistic. It was manually adjusted to 0.0.
Table 3. Empirical correlation matrix for Gaussian copula for the total revenue and total variable cost (input variables) for the 1000 ha merino ewe and first-cross lamb enterprise.
1234567891011121314151617181920
1. Wool clean 20µm ($/kg)1.0
2. Net wool cut (kg)0.51.0
3. Price cwt mutton 18–24 kg ($/kg)0.40.41.0
4. Price merino sheep skin 24.1 kg + 1.5″–2″ $/skin)0.60.30.21.0
5. Ewes sold cast for age (numbers) −0.4−0.60.0−0.41.0
6. Net cwt of ewes sold (kg)0.00.00.60.10.11.0
7. Price cwt Trade lamb 18–22 kg ($/kg)0.40.30.90.30.00.51.0
8. Price cwt Light lamb 12–18 kg ($/kg) 0.50.41.00.30.00.51.01.0
9. Price lamb skin 16.1–20 kg 1″–2″ ($/skin)0.60.30.21.0−0.40.00.30.21.0
10. Wether lambs sold (numbers)0.10.50.20.1−0.40.10.10.10.21.0
11. Net cwt of wether lambs sold (kg)0.10.30.50.0−0.10.60.40.30.00.21.0
12. Ewe lambs sold (numbers)0.10.50.20.1−0.40.00.10.10.21.00.21.0
13. Net cwt of ewe lambs sold (kg)0.10.30.40.0−0.10.60.30.30.00.21.00.21.0
14. Total shorn (numbers)0.0−0.10.20.1−0.20.20.20.20.10.10.00.00.01.0
15. Ewe (numbers)−0.5−0.2−0.1−0.5−0.20.0−0.2−0.2−0.50.20.20.20.20.31.0
16. Lamb (numbers)0.10.50.20.1−0.40.10.10.10.21.00.21.00.20.10.21.0
17. Ewes ($/head)0.40.40.90.40.00.60.91.00.30.20.40.20.40.2−0.10.21.0
18. Ewes bought (numbers)−0.4−0.10.5−0.20.20.40.50.5−0.20.10.00.10.00.20.30.10.51.0
19. Feed wheat prices (AUD/t)−0.2−0.4−0.3−0.30.4−0.2−0.2−0.4−0.3−0.3−0.1−0.3−0.1−0.4−0.3−0.3−0.4−0.31.0
20. Total supplement fed (tonnes)−0.2−0.6−0.5−0.30.2−0.5−0.4−0.4−0.3−0.6−0.7−0.5−0.7−0.10.0−0.5−0.5−0.10.31.0
Table 4. Financial Ratios as Median Values for Key Performance Indicators (KPIs) for the five Opening Debt (Debt to Equity ratio) scenarios.
KPIs0% Opening D:E Ratio10% Opening D:E Ratio20% Opening D:E Ratio30% Opening D:E Ratio40% Opening D:E Ratio
Year 0Year 10Year 0Year 10Year 0Year 10Year 0Year 10Year 0Year 10
Assets$3,674,965$3,301,968$3,674,965$3,251,363$3,674,965$3,229,824$3,674,965$3,218,557$3,674,965$3,211,812
Debt$0$332,822$333,000$1,047,099$613,000$1,652,257$847,000$2,155,493$1,050,000$2,594,351
Equity$3,674,965$2,868,199$3,341,965$2,146,854$3,061,965$1,536,122$2,827,965$1,043,859$2,624,965$597,946
Gearing D:E *0%12%10%49%20%108%30%206%40%434%
Equity E:A *100%87%91%66%83%48%77%32%71%19%
Solvency D:A *0%10%9%32%17%51%23%67%29%81%
Year 1Year 10Year 1Year 10Year 1Year 10Year 1Year 10Year 1Year 10
ROC *−0.1%0.5%−0.2%0.5%−0.1%0.5%−0.2%0.5%−0.2%0.5%
ROE *−1.1%−1.1%−1.7%−2.7%−2.2%−5.2%−2.7%−9.5%−3.2%−19.2%
TGM$99,749$121,273$99,035$120,453$99,570$120,642$99,053$120,693$99,185$121,345
EBIT$5251$16,273$5965$15,453$5430$15,642$5947$15,693$5815$16,345
NP$41,251$30,766$55,285$58,661$65,950$80,103$75,827$99,034$83,815$114,634
Year 0 Year 0 Year 0 Year 0 Year 0
NPV$1,328,092 $1,333,242 $1,332,017 $1,327,591 $1,331,184
MIRR−0.5% −0.5% −0.5% −0.5% −0.5%
Year 10 Year 10 Year 10 Year 10 Year 10
CVaR10 $4,927,658 $5,119,387 $5,281,562 $5,416,217 $5,535,020
* Note: These ratios were calculated from the median asset, debt, equity. Earnings before interest and taxation (EBIT) and Net profit (NP) values. D:E is Debt to equity, E:A is Equity to assets, TGM is total gross margin, Debt to Assets is D:A ROC is Return on capital, ROE is Return on Equity, MIRR is modified internal rate of return.
Publisher’s Note: MDPI stays neutral with regard to jurisdictional claims in published maps and institutional affiliations.

