
A Comparison of Cereal and Cereal/Vetch Crops for Fodder Conservation


1
NSW Department of Primary Industries, Wagga Wagga Agricultural Institute, Pine Gully Road, Wagga Wagga, NSW 2650, Australia
2
Graham Centre for Agricultural Innovation, Albert Pugsley Place, Wagga Wagga, NSW 2650, Australia
*
Author to whom correspondence should be addressed.
†
Current address: No current affiliation.
Agriculture 2021, 11(5), 459; https://0-doi-org.brum.beds.ac.uk/10.3390/agriculture11050459
Submission received: 13 April 2021
/
Revised: 12 May 2021
/
Accepted: 13 May 2021
/
Published: 18 May 2021
(This article belongs to the Special Issue Forage Quality, Conservation and Evaluation in Ruminant Production Systems)
Abstract
:Experiments were conducted at three sites across southern New South Wales, Australia, over three years (2008 to 2010), to evaluate the agronomic and quality parameters of two wheat (Triticum aestivum L.), two barley (Hordeum vulgare L.), two oat (Avena sativa L.) and one triticale (× Triticosecale) variety, grown as monocultures or in combination with purple vetch (Vicia benghalensis L.). Harvests occurred when individual cereal varieties were at the boot, anthesis, milk and soft/mid dough stage of maturity; though drought conditions or lodging forced some soft/mid dough stage harvests to be abandoned. Yield and species composition of mixed crops were measured and digestibility, crude protein, water soluble carbohydrates and fibre content were determined. Yield differed between years reflective of growing season rainfall, which varied from 185 to 479 mm. Drought conditions in 2008 were associated with low yield, vetch inclusion and fibre content and high digestibility, water soluble carbohydrates and cereal crude protein content. Conversely, very favourable conditions in 2010 were associated with high yield and fibre content, and lower digestibility, water soluble carbohydrates and cereal crude protein content. Addition of vetch increased crude protein content all crops in 2009 and 2010, and 50% of the crops in 2008. Lodging was observed in later harvests of cereal/vetch crops in 2009 and 2010.
1. Introduction
Annual and growing season rainfall differs considerably from year to year in southern Australia, and is the major factor impacting forage production [1]. Drier and more variable conditions are predicted to intensify in southern Australia and other dryland farming areas of the world [2,3]. Consequently, the capacity to support livestock production will become more difficult as annual pasture regeneration becomes less reliable and the impacts of moisture stress (drought) on persistence of perennial pasture species become more severe [4,5]. Maintaining current levels of livestock production under future climate scenarios will require an increase in the use of stored fodder, including conserved forages, to cover deficits in the quantity and quality of pasture available [6]. Similarly, fodder conservation can be used to remove grazing pressure and the risk of overgrazing, particularly under adverse climatic events such as drought, that can lead to adverse effects on soil and other plant species. Forage conservation must utilise plant species that most appropriately match climatic and soil physiochemical constraints and also maintain or improve the natural resource base [7]. Forage species used for conservation will require attributes of adaptation to variable climatic conditions with capacity to rapidly produce harvestable quantities of material of high nutritive value to optimise livestock production.
Cereal crops are commonly grown in southern Australia under dryland conditions, principally for grain production. Farmers have an extensive range of varieties within the major cereal species which are available to suit a range in planting times, rainfall and soil conditions [8]. On farms where both crop and livestock production occur, dual purpose cereal varieties are often grazed during the vegetative phase in autumn and winter, prior to being harvested for grain [7]. Cereal crops that are adversely affected by severe moisture stress (drought) or frost damage during grain formation, and unlikely to produce an economically viable grain yield, are also salvaged by conserving them as hay or silage for sale or on-farm use [9]. Thus, cereal crops provide versatility to southern Australian farming systems.
There is growing interest amongst Australian farmers in making silage and hay from cereals or cereal/legume mixtures for feeding in beef, dairy and sheep enterprises and to ameliorate the effects of seasonal pasture deficits [10]. Reliable forage yields make cereal crops a viable option for forage conservation as either hay or silage, and some enterprises grow cereal and cereal/legume crops specifically for hay production, which is traded domestically, exported or used on-farm [10]. Previous studies have shown that cereal forage digestibility (and metabolisable energy (ME) content) declines with advancing plant maturity, though in some cases a partial recovery of ME content may occur post milk stage due to increased grain content. Similarly, crude protein (CP) content declines as forage matures, and is also highly variable; ranging from less than 40 g/kg to more than 150 g/kg dry matter (DM), even when cut at the boot stage i.e., just prior to ear emergence [10,11,12,13,14,15]. Authors from several countries and regions have reported that growing a legume, such as vetch (Vicia spp.) or peas (Pisum sativum L.) in combination with cereals can increase forage CP and ME contents, but the results are not always consistent and the impact on yield has been equivocal [15,16,17,18,19,20,21,22].
There is considerable information on specific cereal species and varieties suitable for a range of southern Australian growing conditions [8]. However, there is limited data on the most appropriate legume species and varieties to grow in combination with cereals in low and medium rainfall areas of southern Australia. The ideal legume species need to be competitive when grown in combination with cereals and adapted to climatic conditions and soil physiochemical constraints. Furthermore, legumes with a low hard seed content are preferred in this role to prevent future potential contamination of grain crops. Several vetch species are in cultivation and have been successfully grown in areas of southern Australia and are relatively tolerant of the soil physiochemical constraints, predominately soil acidity [23].
Three experiments were designed to investigate the potential improvements in feed quality and the impact on DM yield of including purple vetch (V. benghalensis L. cv. Popany) in mixtures with a range of cereals, including wheat, barley, oats and triticale. The experiments were conducted at sites where long-term annual rainfall typically ranges from 500–600 mm on soils that are typical of the region. The experiments were designed to test the hypotheses that inclusion of purple vetch (1) does not reduce yield, compared to cereal only crops, (2) increases feed quality, and (3) reduces the rate at which forage crop digestibility declines with increasing cereal maturity.
2. Materials and Methods
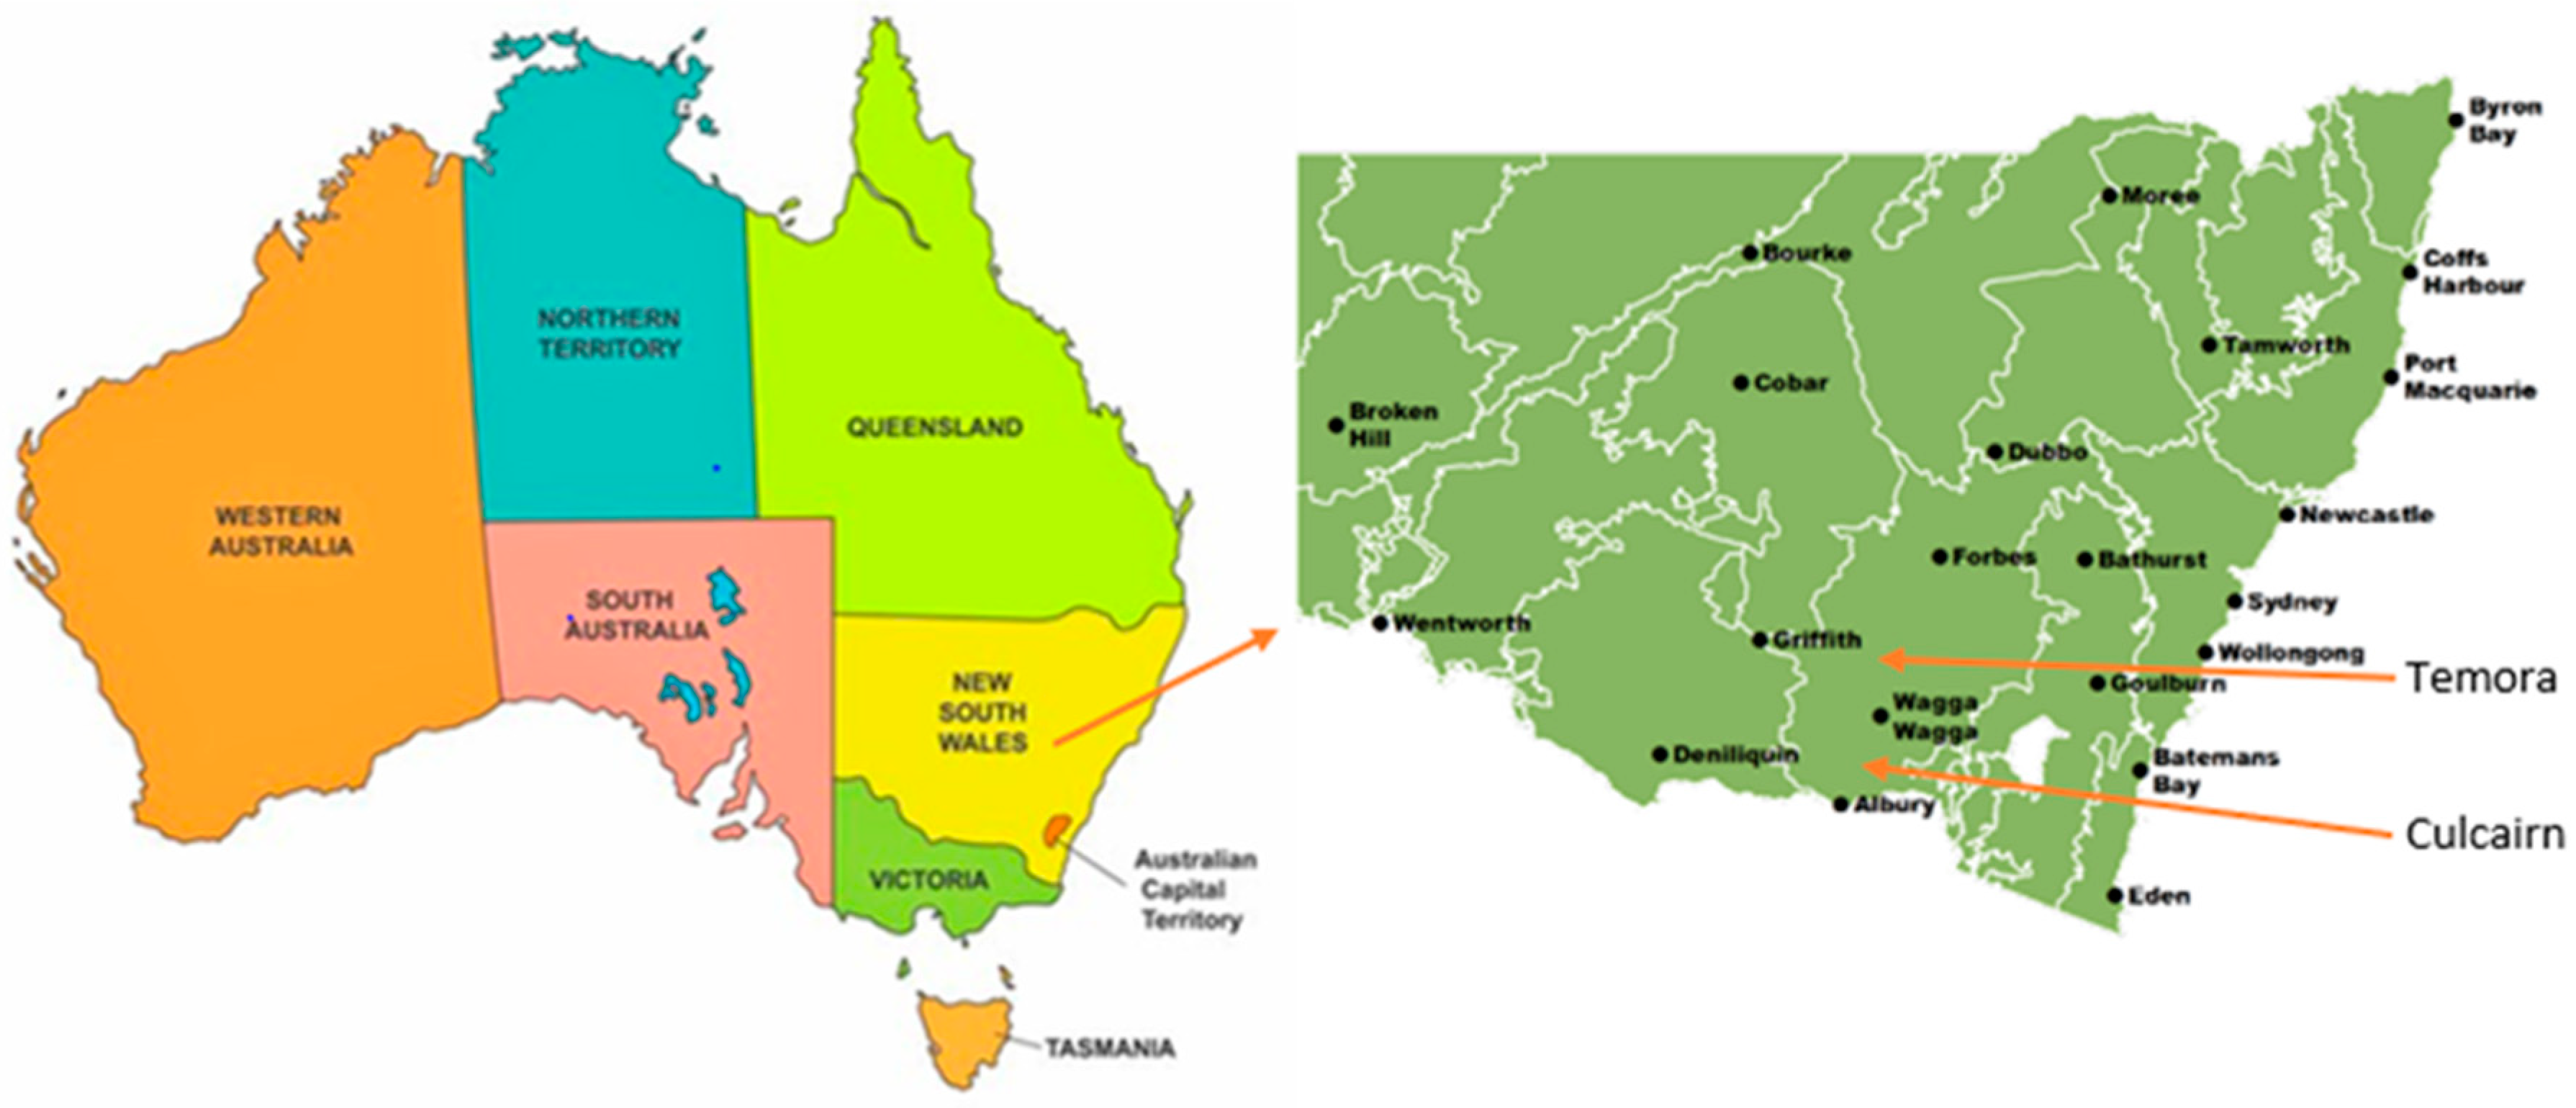
Plot experiments were conducted at three sites in southern Australia, in consecutive years: Wagga Wagga (35°12′ S, 147°37′ E) in 2008, Culcairn (35°59′ S, 147°03′ E) in 2009 and Temora (34°41′ S, 147°52′ E) in 2010 (http://www.bom.gov.au/climate/data/, accessed on 3 March 2021). The Temora and Culcairn sites were located approximately equidistant in a northerly and southerly bearing, respectively from the Wagga site (~85 km) (Figure 1). Soil at the Wagga Wagga and Temora sites were Luvisols while the Culcairn site was a Solonetz [24]. Soils were acidic having a pHCa of 4.8, 5.0 and 4.9 at the Wagga, Temora and Culcairn sites, respectively. All sites had been used for crop production in the two years leading up to commencement of the experiment. These soils are the most common throughout the study region [25,26]. Rainfall data were sourced online from the Australian Bureau of Meteorology (http://www.bom.gov.au/climate/data/, accessed on 3 March 2021).
Seven cereal varieties, comprising two wheat (Triticum aestivum L. cv EGA Wedgetail (dual purpose winter wheat) and T. aestivum L. cv Strzelecki (grain only spring wheat)), two barley (Hordeum vulgare L. cv. Urambie (dual purpose barley) and H. vulgare L. cv. Gairdner (malting barley)), two oat (Avena sativa L. cv Mannus (grain oat) and A. sativa L. cv. Echidna (dual purpose oat)) and one triticale (× Triticosecale cv. Tobruk (dual purpose triticale)) variety, were grown either as monocultures or in combination with Purple vetch (V. benghalensis L. cv. Popany): hereafter referred to as cereal or cereal/vetch crops. Cereal varieties were selected to ensure a range of species and varieties adapted to and grown in the region [8]. Treatments were the same for all sites.
Sowing rate for all the cereal varieties was 70 kg/ha for the monocultures and 15 kg/ha when sown with vetch at 60 kg/ha. Plot sizes varied with sites due to sowing equipment available at each location and were 1.44 m wide by 7 m long with 18 cm row spacing at the Wagga Wagga site; 1.8 m wide by 8.5 m long with 18 cm row spacing at the Culcairn site and 1.55 m wide by 9.05 m long by 9 rows with 17 cm row spacing at the Temora site. There was no buffer area between adjoining plots but there was a cereal crop buffer on all three sides to mitigate any edge effect. Crops were sown on 16 May 2008, 27 May 2009 and 14 May 2010 using a cone seeder with seed sown to a depth of 3 cm. Basal fertiliser of Starter 15 (14.2% N; 12.9% P; 10.7% S) at 100 kg/ha, Pasture Starter (6.7% N; 13.9% P; 8.6% S) at 145 kg/ha, mono-ammonium phosphate (10% N; 21.9% P) at 105 kg/ha and Starter 15 (14.6% N, 16.4% P, 7.1% S) at 105 kg/ha in 2008, 2009, 2010 and 2011, respectively. The fertilisers used reflected the requirements of each site to meet critical nutrient levels. A randomised block design was used at all sites, with three replicates per treatment.
It was intended to harvest a portion of each plot (treatment) on four occasions, when the cereal component reached the boot, flowering (anthesis), milk and soft/mid dough stage of development, equivalent to approximate growth stage (GS) 45, 65, 75 and 85 respectively [27]; hereafter, referred to as H1, H2, H3 and H4. However due to seasonal conditions, the actual number of harvests varied with treatment and site (Table 1).
Sampling procedure varied with site due to growing (primarily rainfall) conditions and was determined by ease of harvesting in the plots containing vetch. In 2008, where drought restricted vetch growth, two 1 m sections of row were harvested by hand from each plot at approximately 5 cm above soil level. In 2009 and 2010 when vetch yields were high, it was not possible to harvest individual rows due to physical entanglement of the vetch. In 2009, a single 45 cm wide section was cut across the whole plot using a sickle bar mower and in 2010, a 50 cm × 85 cm quadrat (equivalent to 50 cm by five rows) was cut from the edge of each plot. Harvest locations within each plot were selected randomly and were representative of the whole plot. Subsequent harvests were a minimum distance of 1 m from previously cut locations. The same harvest method was used for both cereal and cereal/vetch crops within a year.
In 2008 the whole harvested sample was retained for processing while in 2009 and 2010, when yields were much higher, the cut forage was thoroughly mixed and subsampled (approximately 20% to 25%). A portion of the sampled crop was chopped using a Morrison® garden mulcher (Morrison Industries, Hastings, New Zealand), and subsampled. This subsample was dried in a fan forced oven at 80 °C for 24 h to determine DM content, subsequently ground through a 1 mm screen and retained for feed quality analysis. An additional cereal/vetch crop sample was divided into cereal and vetch components and dried in a fan forced oven at 80 °C for 24–48 h to determine species composition on a DM basis. The proportion of cereal and vetch was also used to calculate respective yields from total yield.
Oven dried samples that had been retained for chemical analyses were ground through a 5 mm screen using a Retsch® SM100 mill (Retsch GmbH, Haan, NRW, Germany) to reduce particle size. This ground material was mixed and subsampled; the subsample was then ground through a Perten® 3100 laboratory mill (PerkinElmer Inc., Waltham, MA, USA) fitted with a 1 mm screen prior to chemical analysis.
Water soluble carbohydrates (WSC) was determined using AFIA method 1.11A [28] and nitrogen (N) was determined using the Dumas combustion method with a Leco CNS 2000® analyser (Leco, St. Joseph, MI, USA) [29]. CP content was calculated as N × 6.25. Predicted in vivo digestibility (digestible organic matter (DM basis): DOMD) was determined by modified Tilley and Terry [30] in vitro technique, with additional N to compensate for the low N status of some feeds [31], using a Daisy II® incubator (ANKOM Technology, Macedon, NY, USA). Organic matter (OM) was determined by heating in a muffle furnace at 550 °C for six hours. Acid detergent fibre (ADF) and neutral detergent fibre (NDF) were determined using near infrared (NIR) spectra with a Bruker multi-purpose analyser (MPA, Bruker Optik GmbH, Ettlingen, Germany) and OPUS software (version 5.1) with calibrations developed by the New South Wales (NSW) Department of Primary Industries’ NSW Feed Quality Service using the following methods: NDF and ADF analysed sequentially [32] using the filter bag method (Ankom® 200/220 fibre analyser, ANKOM technology, Macedon, NY, USA).
Yield, species composition and forage quality parameters were analysed using the REML function in Genstat 20th Edition [33]. Correlation analysis using predicted means for each variety × harvest combination was used to describe the relationship between crop parameters. Regression analysis using the same means and including harvest in the model was used to describe the variation in yield of cereal/vetch crops accounted for by the yield of the individual cereal and vetch components. Yield data for each year were analysed separately due to the large differences between years brought about by seasonal conditions. Fixed effects for yield were cereal variety, vetch, harvest and all interactions, and random effects were replicate and plot. Fixed effects for forage quality parameters were year, cereal variety, vetch, harvest and all interactions, and random effects were replicate within year and plot within year. Vetch content was fitted as a covariate within each cereal variety × vetch × harvest combination for all forage quality parameters analysed, using the method of Urquhart [34]. This technique accounts for natural variation in crop cereal:vetch ratio without affecting treatment means. Analysis of species composition was restricted to the cereal/vetch mixtures as the cereal only treatments were pure monocultures, with fixed effects being year, variety, harvest and their interaction; and random effects were replicate within year and plot within year. When the highest level interaction was not significant, then means presented are averaged over all appropriate treatments, e.g., means for variety include both cereal monocultures and cereal/vetch crops.
3. Results
Annual rainfall and growing season rainfall were below the long-term average in 2008 and 2009, and above average in 2010. Growing season rainfall was 56%, 81% and 134% of the long-term average for the respective sites in 2008, 2009 and 2010 (Table 2). Differences in the number of days between sowing and harvests were found between varieties and years (Table 1). Differences between later and earlier maturing varieties were more apparent at the H4 harvest.
3.1. Yield
In 2008 yield varied due to the main effects of cereal variety (p = 0.018; l.s.d.(p<0.05) = 296.6), vetch inclusion (p < 0.001; l.s.d.(p<0.05) = 158.6) and harvest (p < 0.001; l.s.d.(p<0.05) = 166.4) (Table 3). Yield of Mannus (2177 kg DM/ha), Urambie (2079 kg DM/ha), Tobruk (2071 kg DM/ha) and Strzelecki (2043 kg DM/ha) exceeded that of Gairdner (1793 kg DM/ha) and Wedgetail (1677 kg DM/ha), while yield of Echidna (1832 kg DM/ha) was similar to Wedgetail, Gairdner, Strzelecki, Tobruk and Urambie (Table 3). Mean yields ranged from 1677 kg DM/ha for Wedgetail crops to 2177 kg DM/ha for Mannus crops and were 21% higher for cereal compared to cereal/vetch crops (2137 vs. 1770 kg DM/ha). Mean yields increased between H1 (1506 kg DM/ha) and H2 (2216 kg DM/ha), and thereafter remained unchanged (H3: 2138 kg DM/ha). Yield of both the cereal and vetch components of the cereal/vetch crops similarly increased (p < 0.05) between H1 and H2 and thereafter remained unchanged.
At Culcairn in 2009 the final harvests of Wedgetail/vetch and Tobruk/vetch were abandoned due to lodging. Yield varied with the variety × vetch interaction (p = 0.021; l.s.d.(p<0.05) = 1290.2) (Table 3). Echidna and Echidna/vetch yields were higher (p < 0.05) than all other crops except Wedgetail and Tobruk, while Wedgetail and Tobruk yield was lower (p < 0.05) when sown in combination with vetch. 1374.5.; being higher (p < 0.05) at H4 than at H1 for all varieties except Strzelecki, Wedgetail and Tobruk. Yield was higher (p < 0.05) for Strzelecki at H3 than at H4, while Wedgetail yield did not vary between harvests. Yield of Tobruk crops increased (p < 0.05) so that H2 and H3 were higher than H1, with H4 intermediate and not different to any other harvest. Yield also varied with the vetch × harvest interaction (p < 0.001; l.s.d.(p<0.05) = 724.0), such that yield of cereal varieties increased (p < 0.05) with successive harvests up to H3, but thereafter did not change; whereas the yield of cereal/vetch crops was higher (p < 0.05) for H2 and H3 compared to H1, and higher (p < 0.05) for H2 compared to H4; when crops were observed to have lodged.
In 2010 yields varied due to the variety × vetch × harvest interaction (p < 0.001; l.s.d.(p<0.05) = 5742.0) (Table 3). Yield of all cereal crops increased (p < 0.05) between H1 and H4 but increases in cereal/vetch crop yield was more variable and often declined at later harvests when lodging was observed. For the cereal monocultures, Echidna and Urambie yield increased (p < 0.05) between H1 and H2, Gairdner and Mannus yield increased (p < 0.05) between H3 and H4. Wedgetail increased (p < 0.05) yield between H1 and H2, and again between H2 and H4; while Strzelecki and Tobruk both increased yield between H2 and H3 and between H3 and H4. For the mixed crops, yield increased (p < 0.05) between H1 and H2 for Echidna/vetch, and between H2 and H3 for both Echidna/vetch and Urambie/vetch Yield of Strzelecki/vetch, Wedgetail/vetch and Tobruk/vetch remained unchanged throughout the three harvests. The highest (p < 0.05) yield of Gairdner/vetch was at H3, with H1, H2 and H4 not different to each other. Mannus/vetch increased (p < 0.05) yield between H1 and H2, lost yield (p < 0.05) between H2 and H3, and then increased (p < 0.05) yield between H3 and H4, such that yield at H4 did not differ from any other harvest.
Yield of cereal and cereal/vetch crops was moderately correlated in 2008 (r = 0.63), 2009 (r = 0.59) and 2010 (r = 0.63). When data from H4 were excluded to avoid lodging and missed harvests biasing results, the correlation in 2010 was improved (r = 0.71), but not in 2009 (r = 0.53). Yield of the cereal component explained 94.1%, 56.1% and 98.7% of cereal/vetch yield in 2008, 2009 and 2010, respectively, compared to 60.1%, 19.6% and 86.4% for vetch. Removing H4 data from the regression analyses did not materially change these results: cereal yield explained 53.4% and 98.3% and vetch yield explained 26.3% and 81.3% in 2009 and 2010, respectively.
3.2. Species Composition
The proportion of vetch varied with harvest (p < 0.001) and the year × variety interaction (p = 0.004) (Table 4). The proportion of vetch increased (p < 0.05) between the first and last harvest with predicted means of 466.1, 490.7, 534.8 and 596.2 g/kg at H1, H2, H3 and H4, respectively. In 2008 Urambie/vetch contained less (p < 0.05) vetch than Strzelecki/vetch and Gairdner/vetch with all other varieties intermediate and not different to each other. In 2009 the vetch content of Echidna/vetch and Mannus/vetch was lower (p < 0.05) than for all other varieties. In 2010 vetch content of Echidna/vetch and Mannus/vetch was lower (p < 0.05) than all other varieties; and Strzelecki/vetch was higher (p < 0.05) than all varieties except Gairdner/vetch and Tobruk/vetch. Urambie/vetch was intermediate and similar to all varieties except Echidna/vetch, Mannus/vetch and Strzelecki/vetch. Vetch content was lower (p < 0.05) in 2008 compared to 2009 and 2010, except for Echidna/vetch which was similar in 2008 and 2010.
3.3. Digestibility
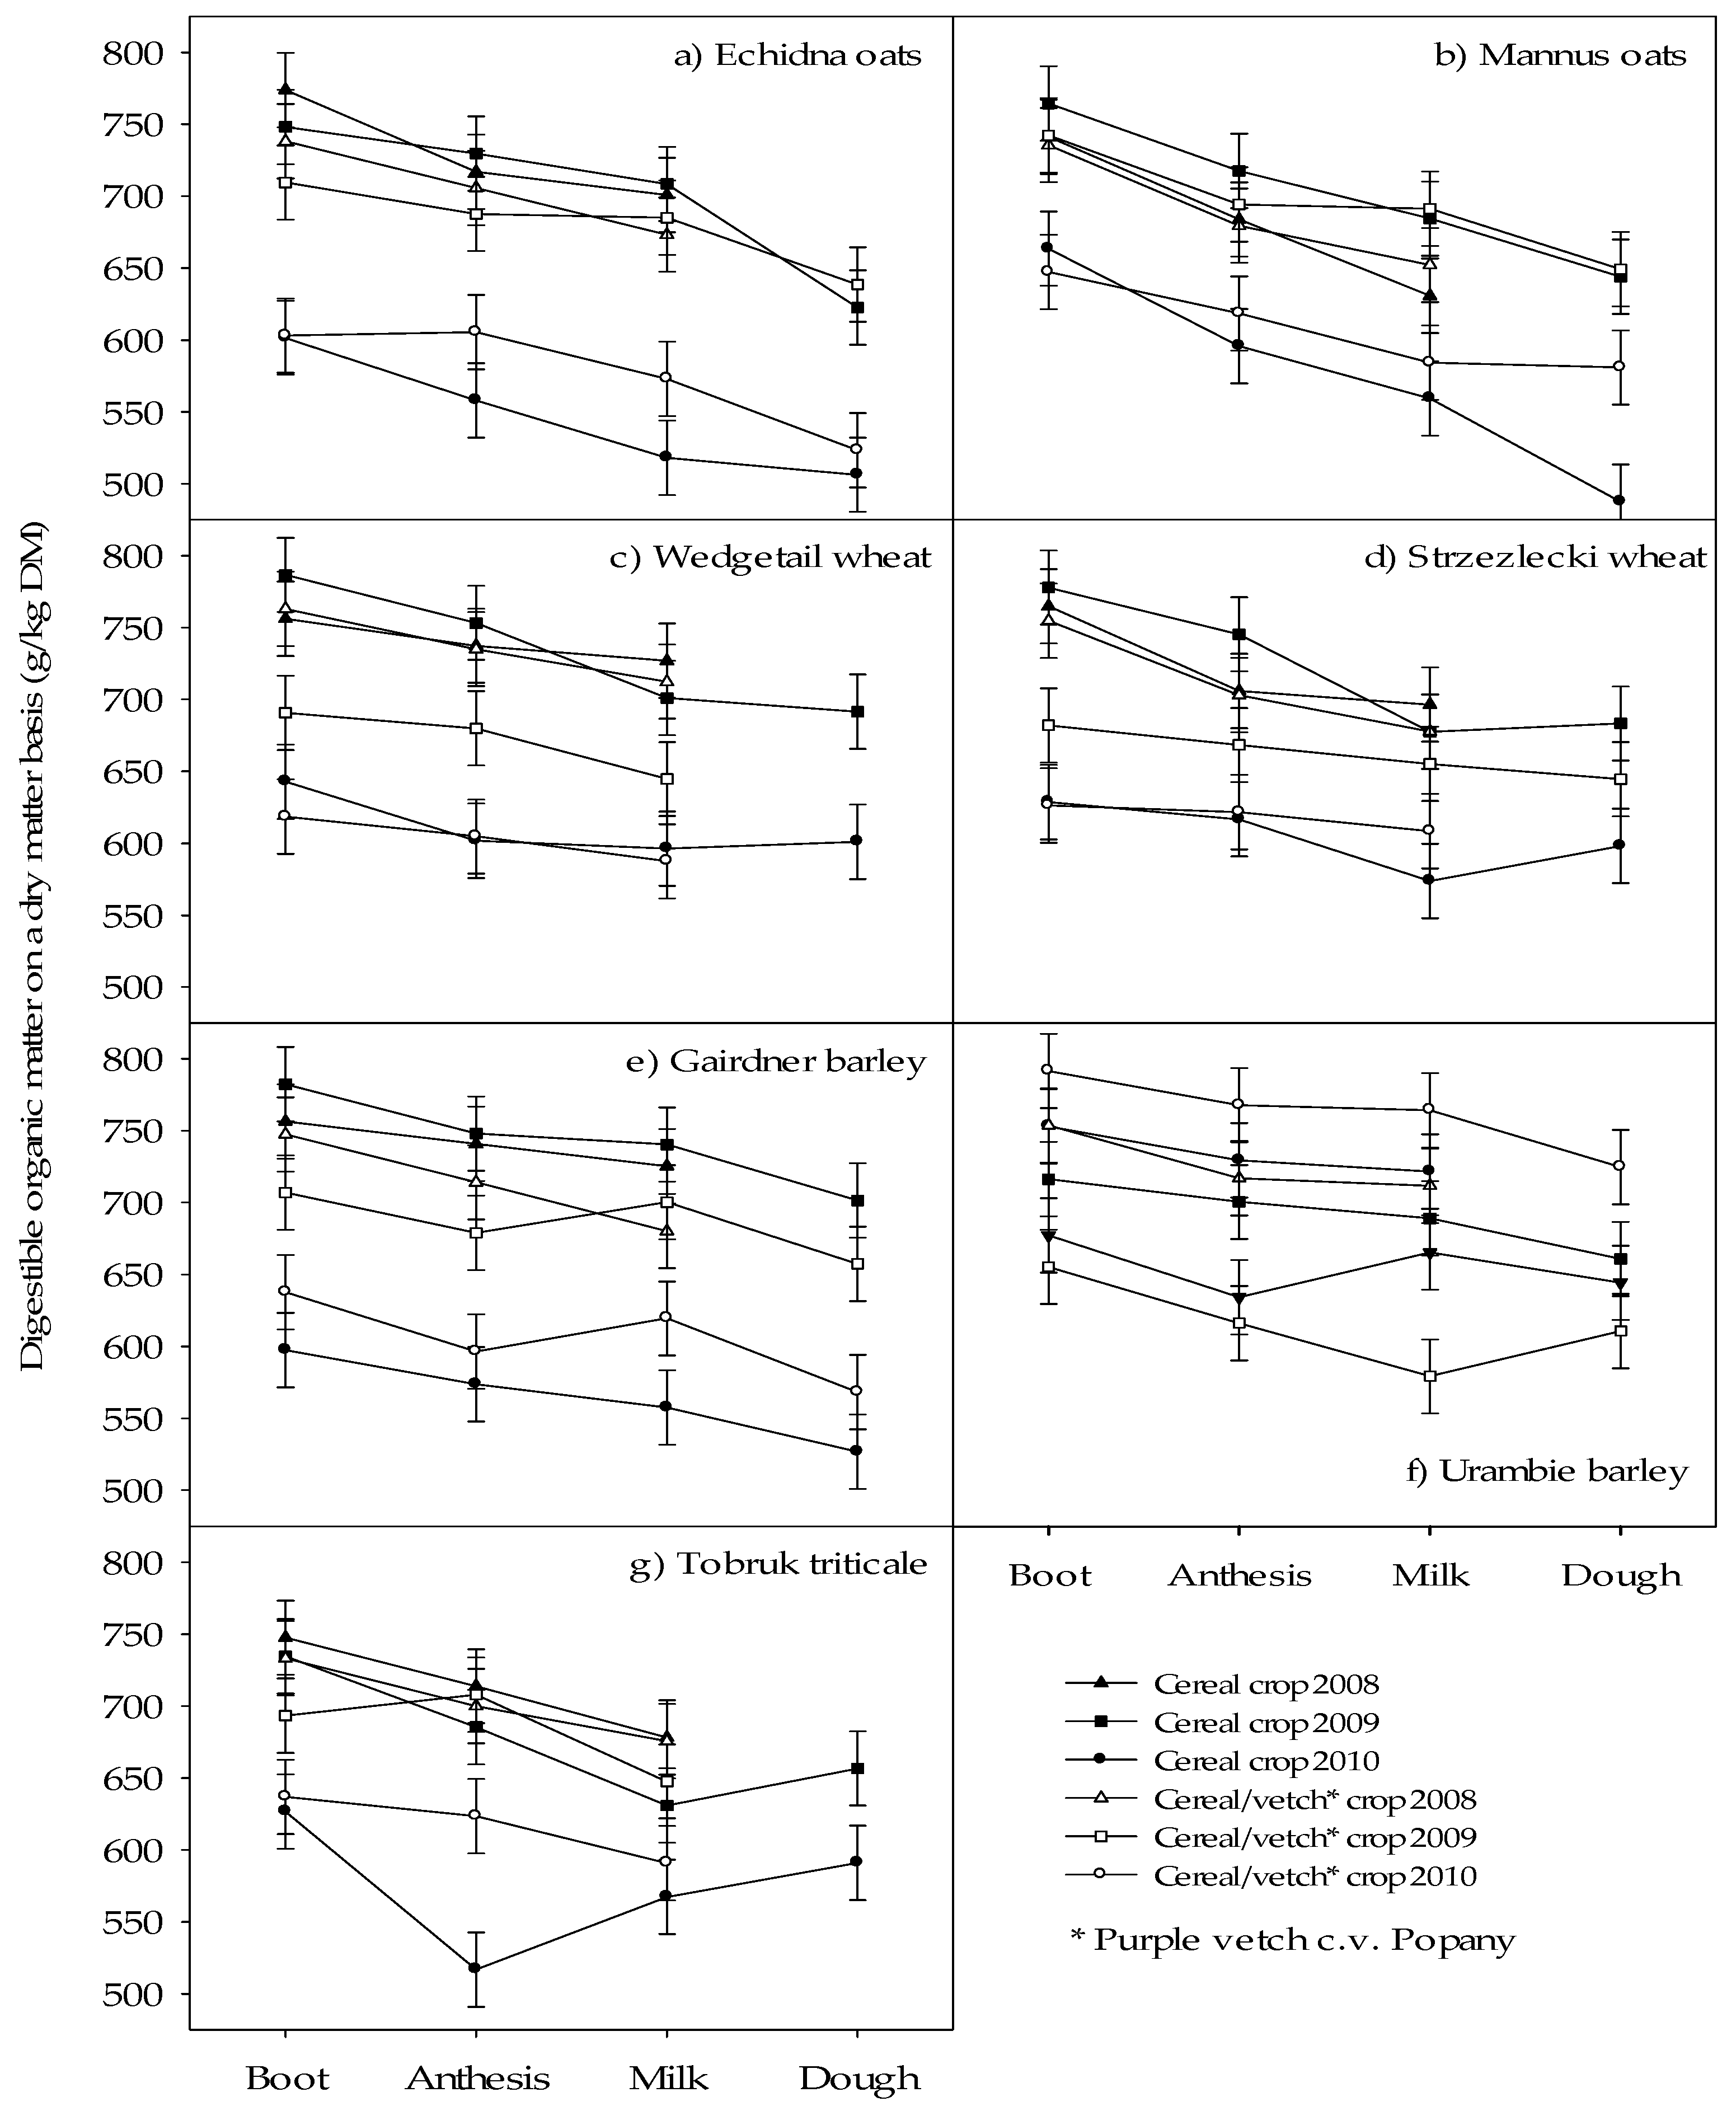
Digestibility (DOMD) varied (p = 0.049) with the year × variety × vetch × harvest interaction (Figure 2). Digestibility declined (p < 0.05) between the first and last harvest (H3 or H4) for all crops except Gairdner, Urambie/vetch, Urambie, Wedgetail and Wedgetail/vetch in 2008; Gairdner/vetch, Strzelecki/vetch, Tobruk/vetch and Wedgetail/vetch in 2009; and, Strezelecki/vetch, Strzelecki, Tobruk/vetch, Tobruk, Urambie/vetch, Urambie, Wedgetail/vetch and Wedgetail in 2010. In 2010 the digestibility of Strzelecki and Urambie/vetch initially declined before recovering to be like H1. Digestibility was lower (p < 0.05) in 2010 compared to 2008 and 2009 for all specific variety × vetch × harvest combinations except Strzelecki/vetch at H2 and H3 and Urambie/vetch at H in 2009. Digestibility of Mannus (H3) was higher in 2009 than in 2008 while digestibility of Strzelecki/vetch (H1) and Wedgetail/vetch (H1, H2 and H3) was higher (p < 0.05) in 2008 than 2009.
3.4. Crude Protein Content
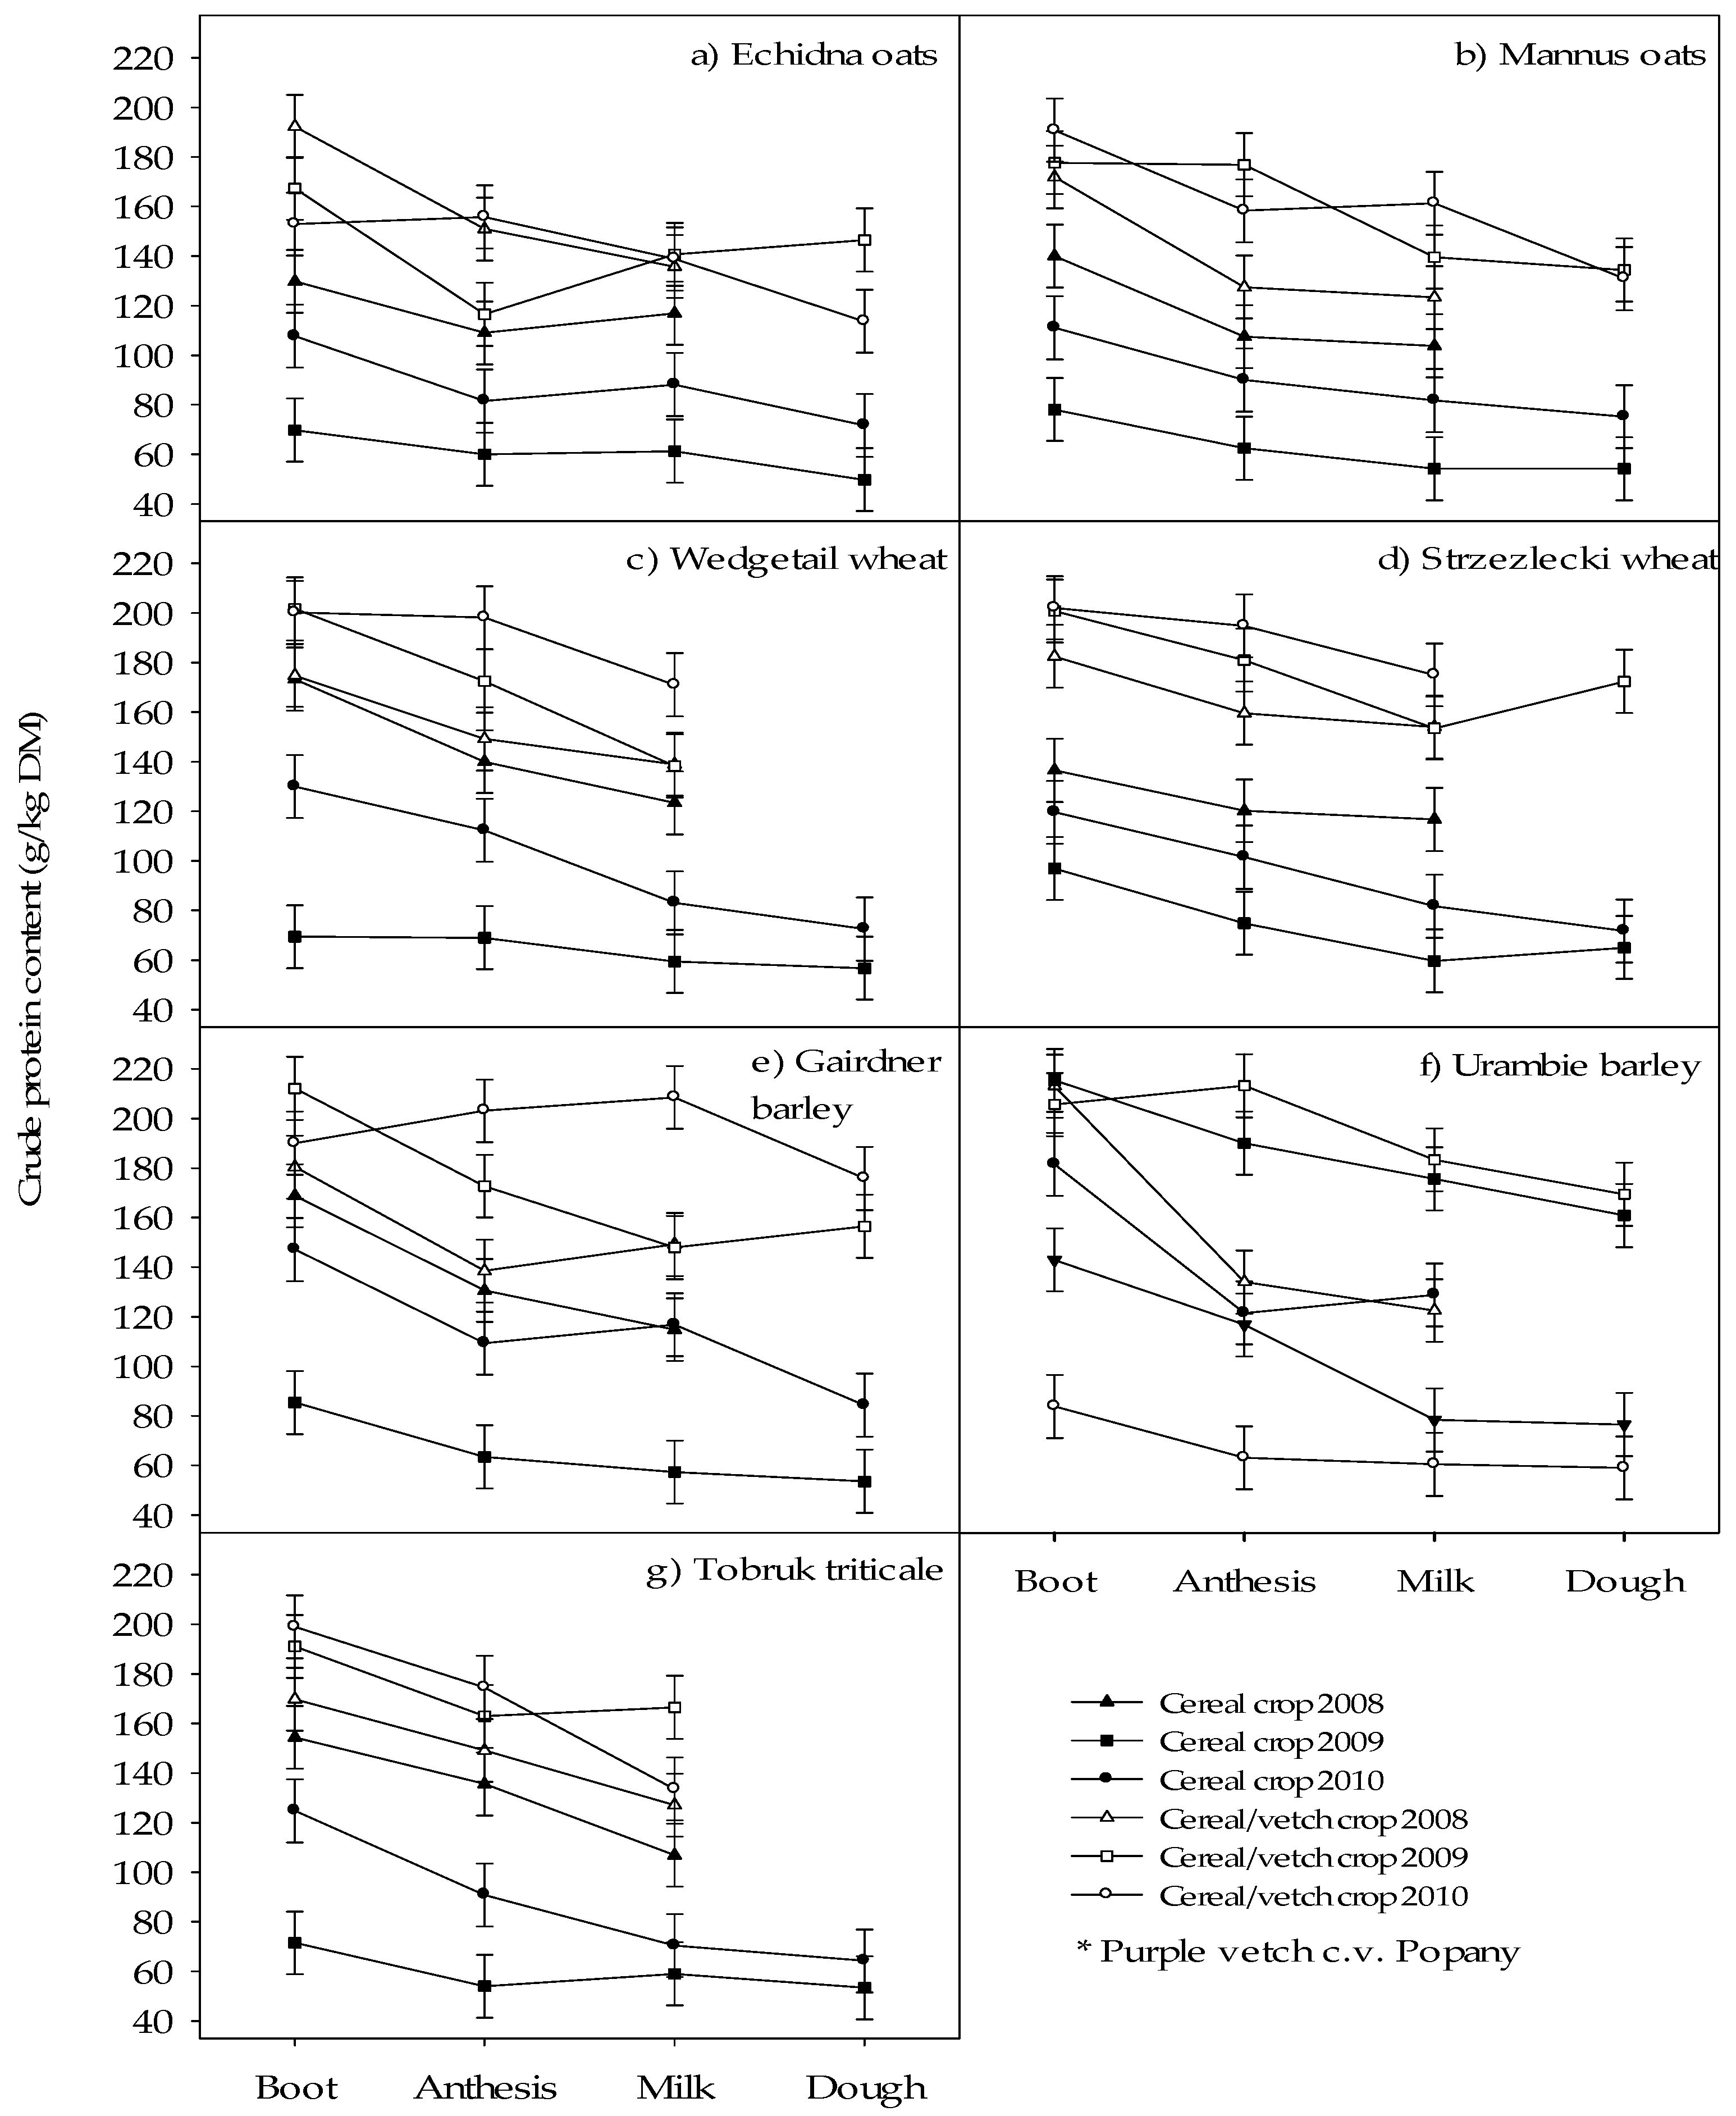
Crude protein content similarly varied significantly (p = 0.008) with the year × variety × vetch × harvest interaction (Figure 3). Crude protein declined with maturity for all crops except Echidna and Strzelecki in 2008, and Echidna, Mannus, Tobruk and Wedgetail in 2010. In 2009 the CP content of Echidna/vetch initially declined (p < 0.05) post H1, but subsequently increased so that H4 was not different to H1. Inclusion of vetch increased (p < 0.05) CP for all cereal varieties and at all harvests in 2009 and 2010. In 2008, the CP content of Strzelecki/vetch was higher (p < 0.05) than Strzelecki at all harvests. However, inclusion of vetch in 2008 did not increase CP content for the following variety by harvest combinations: Echidna (H3), Gairdner (H1 and H2), Mannus (H2 and H3), Tobruk (H1, H2 and H3), Urambie (H2 and H3), and Wedgetail (H1, H2 and H3). Average CP content of cereal/vetch and cereal crops differed markedly in 2009 (173 vs. 97 g/kg DM) and 2010, (167 vs. 65 g/kg DM). In contrast, the average CP content of the cereal/vetch and cereal crops in 2008 was 155 and 131 g/kg DM, respectively.
3.5. Water Soluble Carbohydrates Content
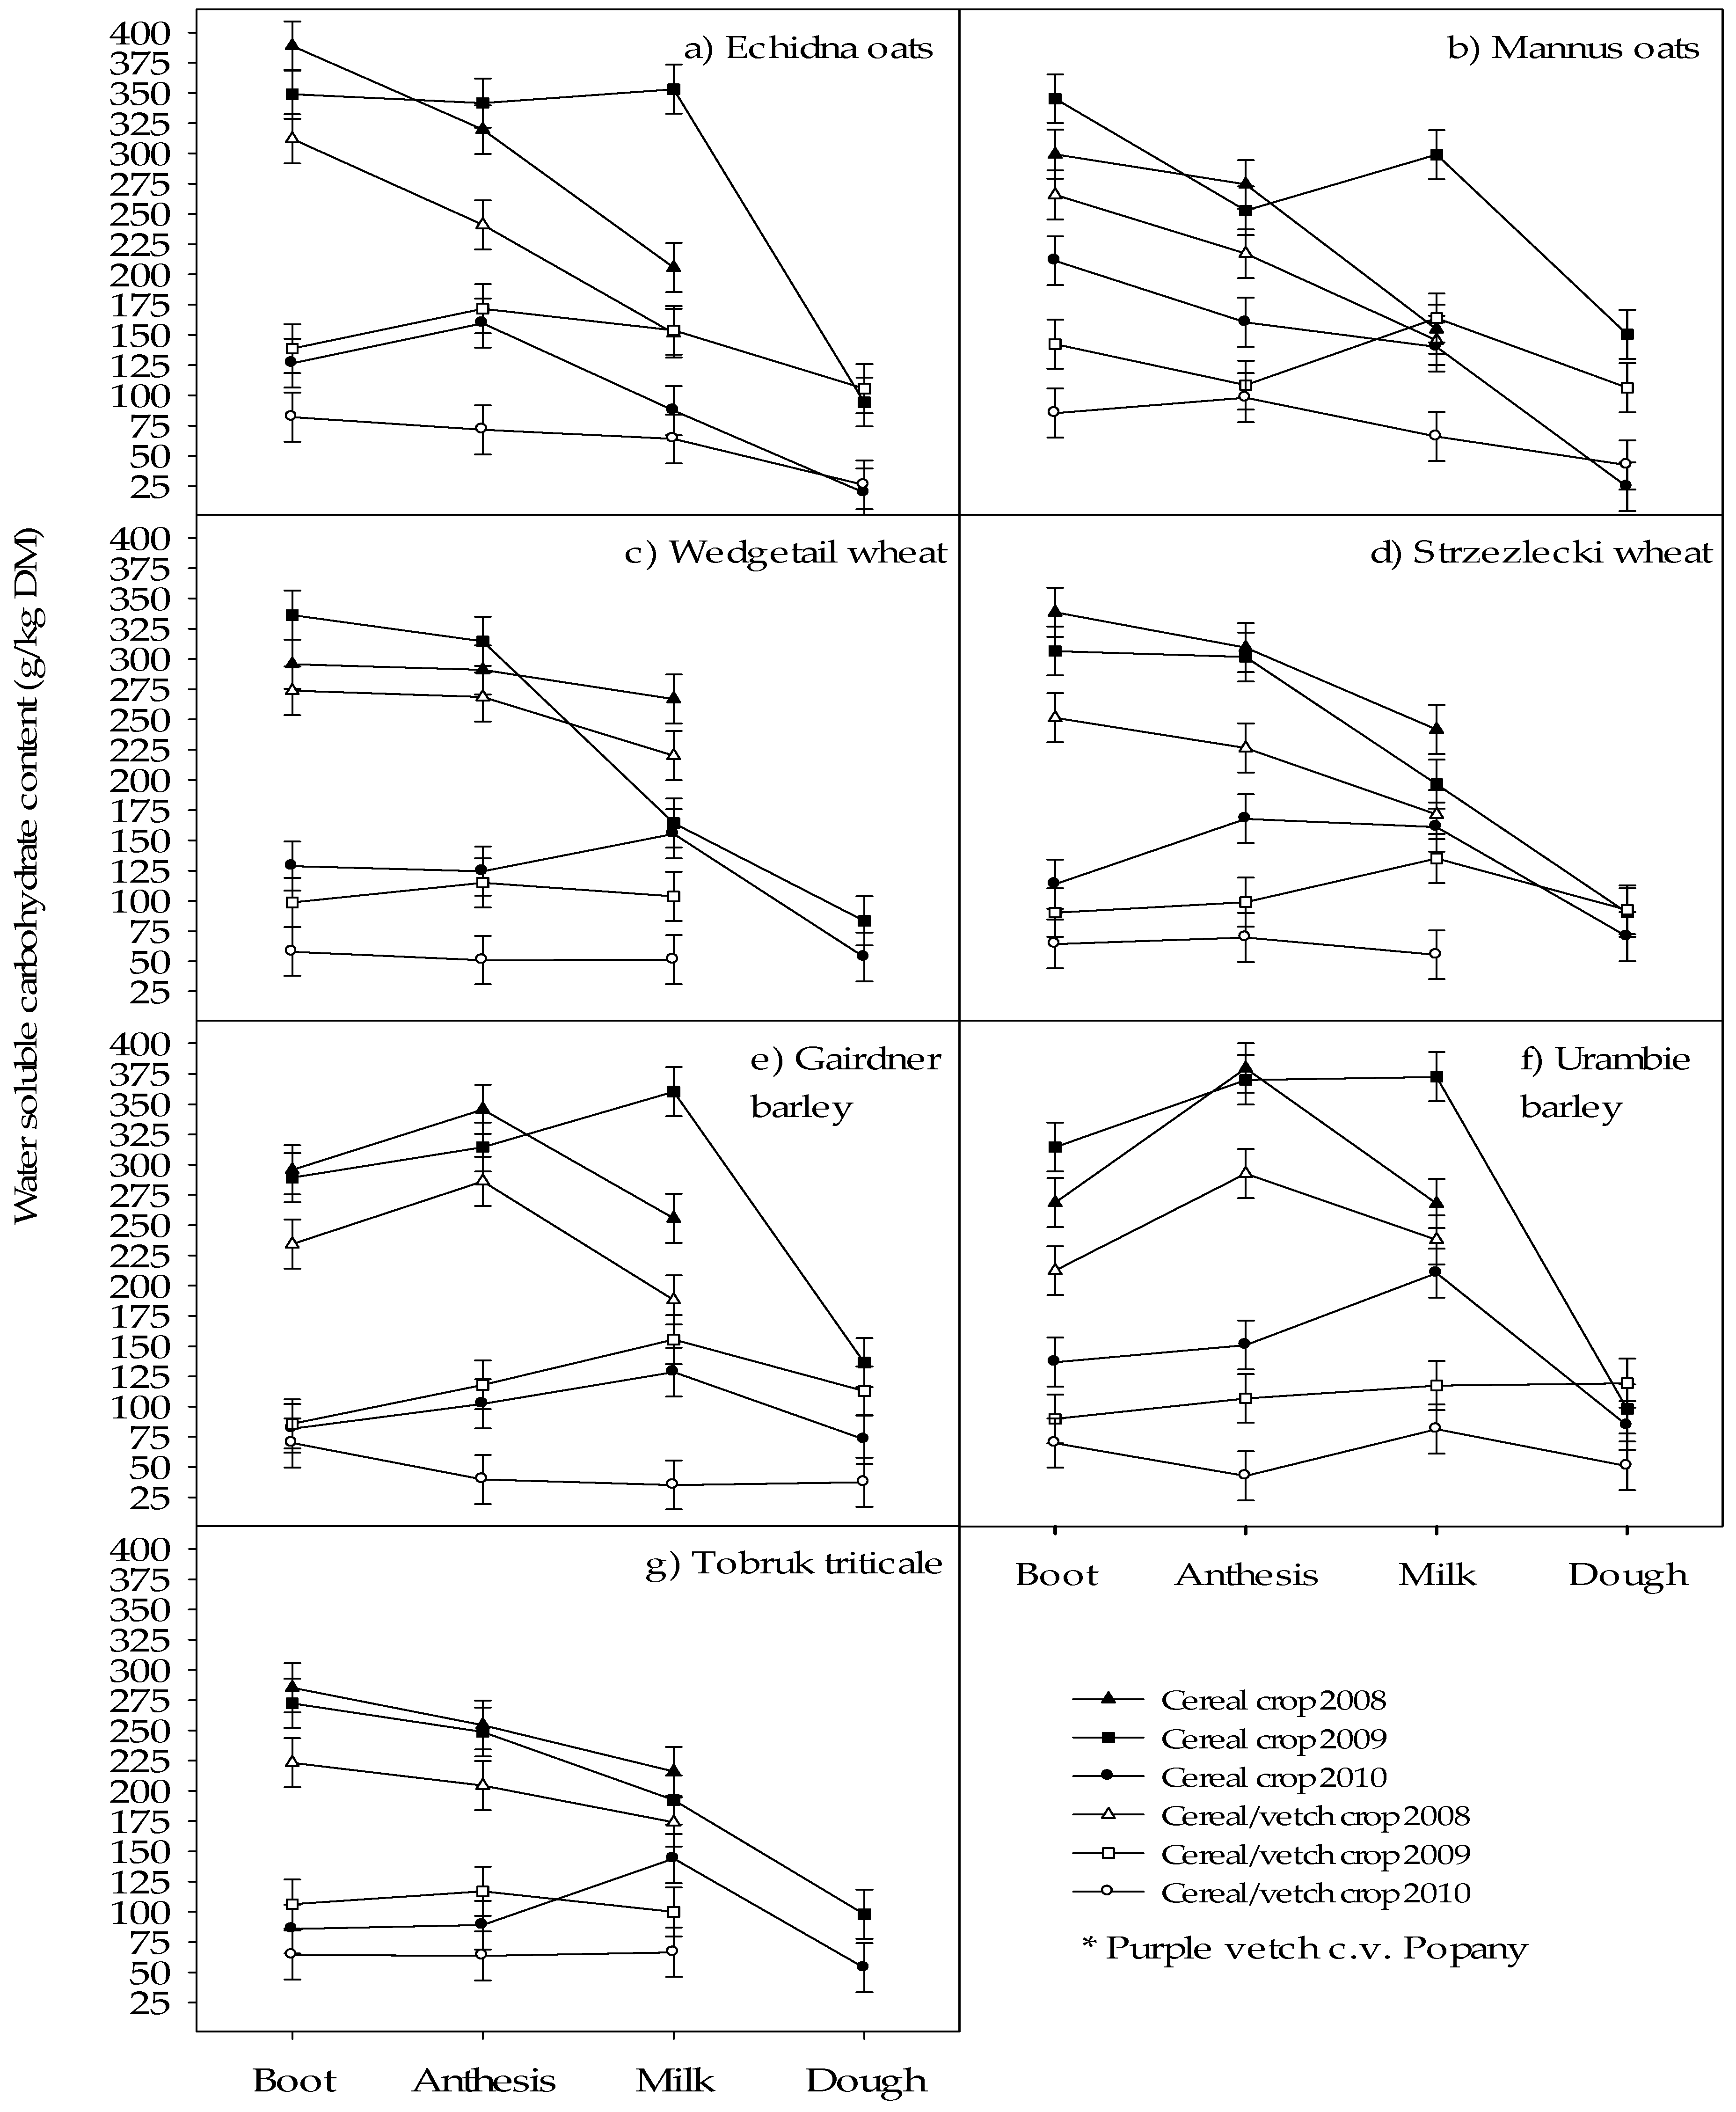
Water soluble carbohydrates content varied (p < 0.001) with the year × variety × vetch × harvest interaction (Figure 4). Water soluble carbohydrates content was generally higher (p < 0.05) for cereal monocultures compared to cereal/vetch crops when varieties were harvested at the same stage in the same year. The exceptions being Mannus (H1 and H3), Urambie (H3) and Wedgetail (H1 and H2) in 2008; Echidna (H4), Gairdner (H4), Strzelecki (H4) and Urambie (H4) in 2009; and, Echidna (H3 and H4), Gairdner (H1 and H4), Mannus (H4), Tobruk (H1 and H2) and Urambie (H4) in 2010. Crop WSC content generally declined with maturity: the exceptions being Wedgetail in 2008; Tobruk/vetch, Urambie/vetch and Wedgetail/vetch in 2009; and all cereal/vetch crops in 2010. However, the pattern of WSC content change varied between crops. Highest (p < 0.05) WSC content was observed at H2 and/or H3 for Gairdner/vetch, Gairdner, Urambie and Urambie/vetch in 2008; Echidna/vetch, Gairdner/vetch, Gairdner, Strzelecki/vetch and Urambie in 2009; and, Gairdner, Strzelecki, Tobruk and Wedgetail in 2010. Water soluble carbohydrates content of contemporary cereal and cereal/vetch crops was generally similar between 2008 and 2009, while the lowest (p < 0.05) WSC was observed in 2010.
3.6. Fibre Content
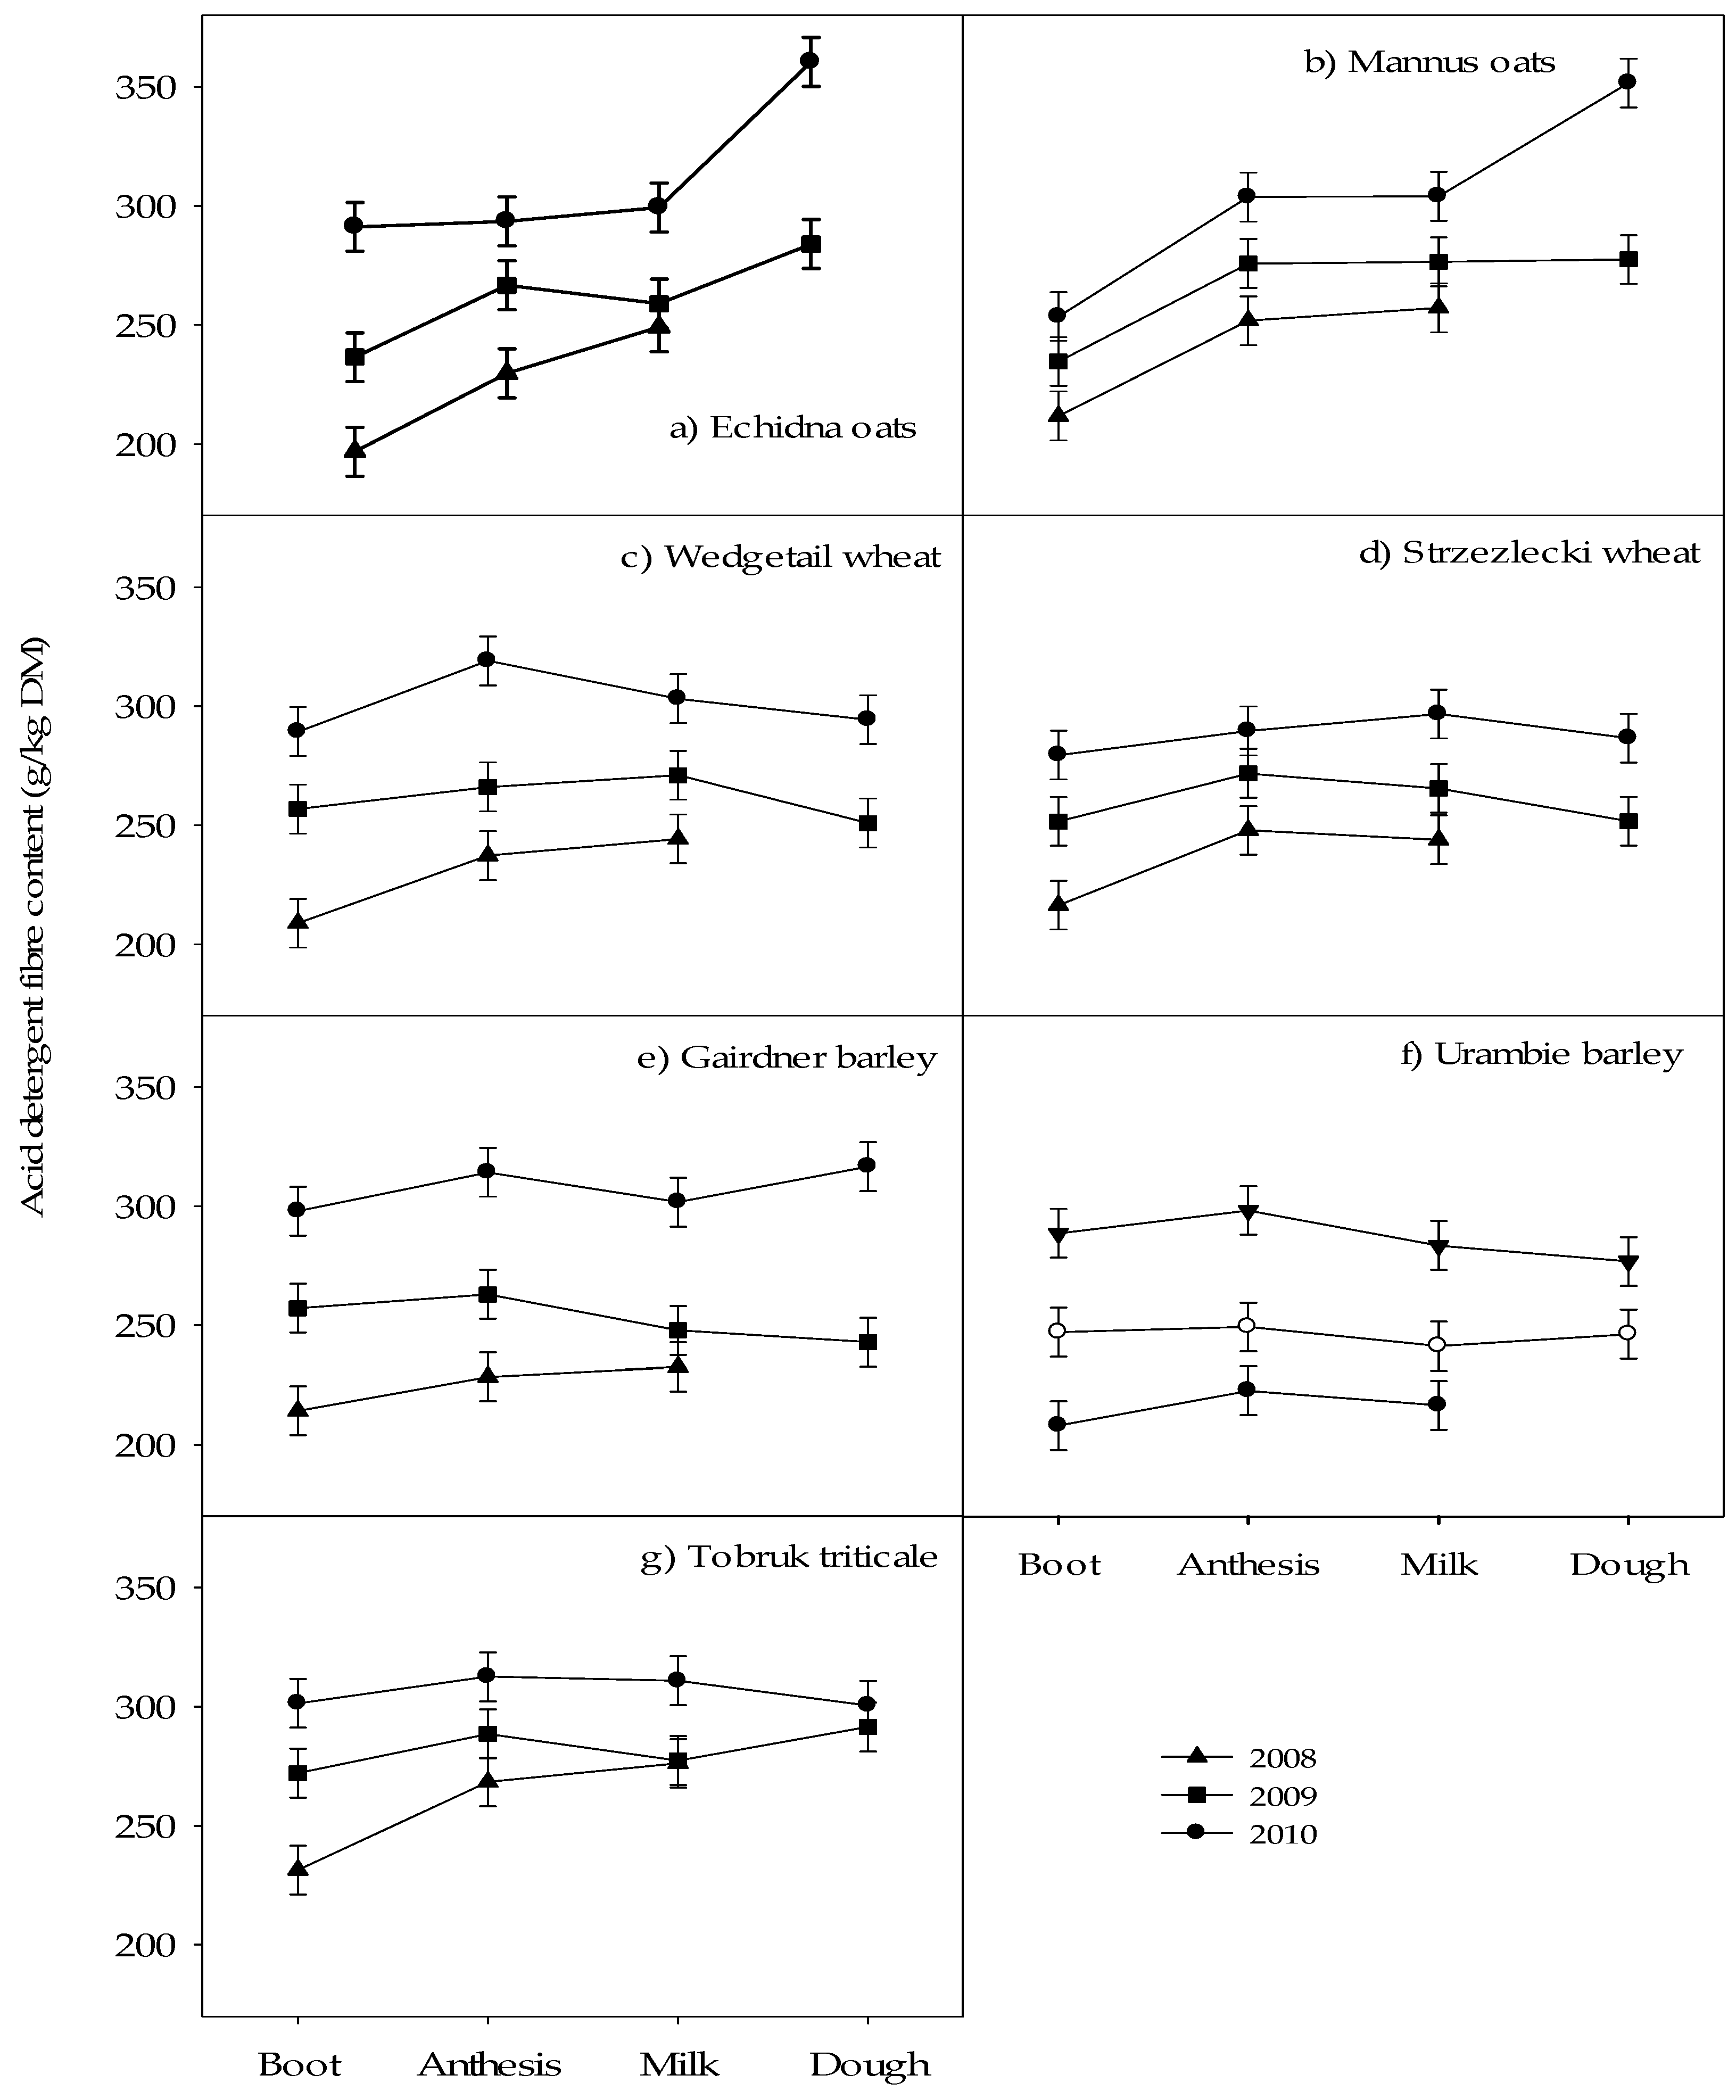
Acid detergent fibre content varied with all three-way interactions: variety × vetch × harvest (p = 0.027); year × vetch × harvest (p = 0.048); year × variety × harvest (p = 0.003); and year × variety × vetch (p < 0.001). The ADF content of all crops increased after the boot harvest except Gairdner and Urambie in all years; Tobruk in 2009 and 2010; Wedgetail in 2009; and Strzelecki in 2010. The ADF content of Strzelecki (2009) and Wedgetail (2010) initially increased before declining to be similar at the boot and soft/mid dough stages. Acid detergent fibre content was higher (p < 0.05) in 2010 than 2008, with ADF content in 2009 being generally intermediate (Figure 5). Three-way interactions containing vetch were significant; however, the effect of vetch on individual comparisons e.g., same variety and harvest, was minor; in most cases much less than 1.5% units. Therefore, this data has not been presented and we have concentrated on the numerically greater effects of year and harvest.
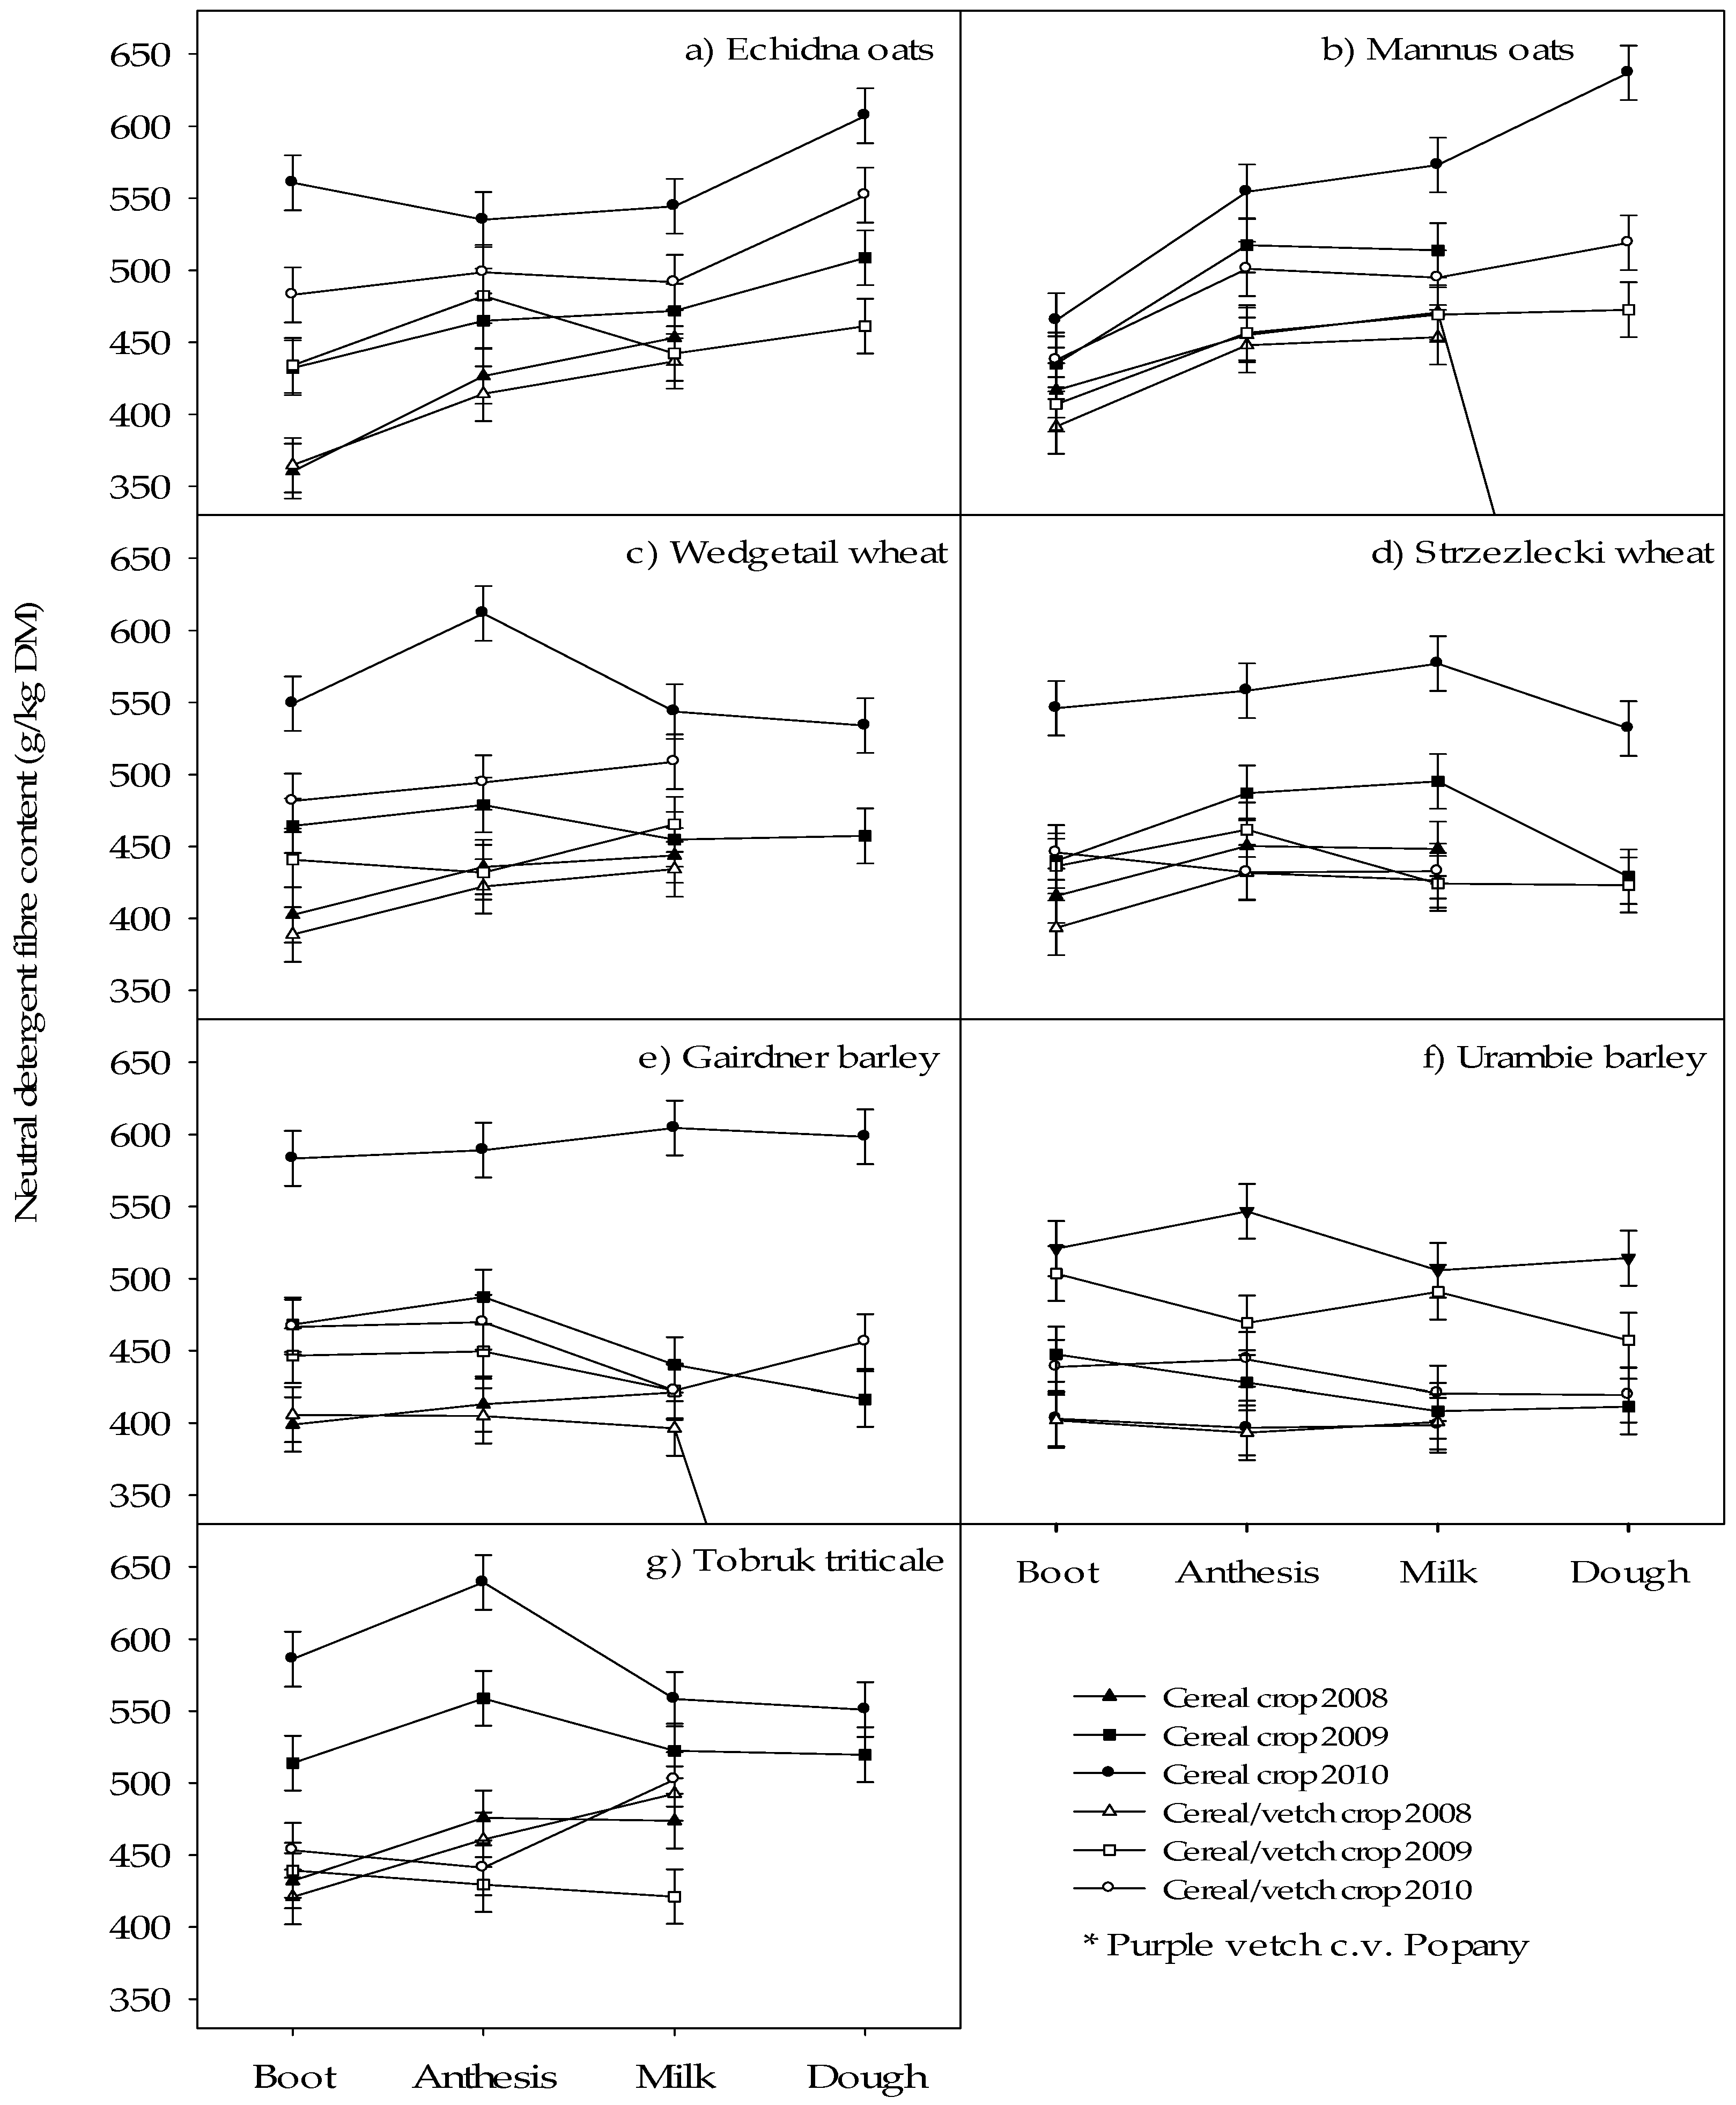
Neutral detergent fibre content varied (p = 0.012) with the year × variety × vetch × harvest interaction (Figure 6). Neutral detergent fibre content was higher (p < 0.05) in 2010 compared to 2008 for most crops, with NDF content in 2009 generally intermediate. Neutral detergent fibre content of 86% of the crops increased with maturity. Of the remainder, Gairdner/vetch and Urambie/vetch in 2009 had lower (p < 0.05) NDF at the soft/mid dough compared to the boot stage harvest, while 9% remained unchanged throughout the harvests. The unchanged group included Gairdner or Gairdner/vetch crops in 2008 and 2009.
4. Discussion
The effect of vetch inclusion on yield relative to cereal monocultures was not consistent either between years or between harvests within years. The hypothesis that inclusion of purple vetch did not reduce yield was proven to be false in 2008, whereas in 2009, where growing conditions were more typical of an average season, the hypothesis was generally proven true. Results were more equivocal in 2010 when yields were very high. We consider our first hypothesis that vetch inclusion increases feed quality to be true because low CP content of most cereal crops would have limited ruminant production. However, we found no evidence to support our second hypothesis that inclusion of vetch increased digestibility, and on several occasions particularly at earlier harvests in 2009, digestibility of the cereal was higher than cereal/vetch crops. We concluded our third hypothesis that vetch inclusion reduced the rate of decline to be neither proven nor disproven.
Yields varied considerably between years by up to 10 fold or even greater, although this was not statistically compared and appeared largely dependent on growing season rainfall. Previous experiments have also reported a diverse range in yields for similar forage crops across a range of environments [13,15,21,35,36,37,38,39,40,41]. We attribute the low yields and modest yield increase between boot and flowering in 2008 to drought. Senescence of both plants and plant components was apparent at the milk stage, with vetch plants appearing to be more affected than cereals. We concluded that vetch was more susceptible to dry conditions or did not compete as well for available moisture as the cereals; and consequently, yields for cereal/vetch were less than for the cereal crops in this year. This is consistent with a study which found that hairy vetch (V. villosa Roth) was less effective than oats (Avena sativa L.) at accessing available moisture when grown in a mixture [42].
It is also possible that some yield loss occurred in 2008 because senescent plant components (principally leaf) was lost. Reduced yields due to moisture stress of wheat, barley and triticale crops grown in combination with Hungarian vetch (V. pannonica Crantz) have previously been observed [16]. In one year of that experiment, moisture stress reduced yield by an average of 10.3% between flowering (8460 kg DM/ha) and milk stage of growth (7583 kg DM/ha), which the authors attributed to plants drying down and the barley plants shedding leaf material. The low yields (average 1953 kg/ha) and higher proportion of very dry or dead leaf would incur extensive field losses during hay or silage making, meaning these crops would be better suited to grazing than conservation. However, in that year crop yields exceeded the yield of traditional pasture species, such as subterranean clover (Trifolium subterraneum L.), from the surrounding region [43], highlighting the value of cereal-based forage crops, even under dry conditions, for grazing or conservation.
Yields achieved in 2010 were very high, and higher than most previous reports for similar crops grown in Australia or overseas. However, they are consistent with cumulative forage yields (single graze followed by a silage cut) reported by Fraser, Knight, Knowles and Hyslop [38] and wheat grain yields reported by Armour, et al. [44], which these authors attributed to ideal growing conditions for cereal crops grown in New Zealand. However, practically such high yields would make wilting for hay or silage more difficult indicating a possible advantage of later harvesting when crops naturally have lower moisture content, although any impact on forage quality would need to be considered.
In 2009 and 2010 the crops continued to accumulate biomass throughout the growing season; although harvested yield of some cereal/vetch crops declined at later harvests due to lodging. Lodging occurs when the weight of vetch forage exceeds the capacity of the fine stems to hold the plant upright. In our experiment this caused a significant quantity of forage to be below harvest height and, therefore, was not accounted for at sampling; this forage would not be harvested using commercial machinery and therefore represents a practical result. Lodging is also undesirable because forage quality declines as lodged material senesces and starts to decay, reducing quality and promoting the growth of moulds. Moulds contaminate hay and silage when incorporated during mechanical operations such as raking. In addition to the direct loss of quality, moulds can pose an animal health risk to livestock, and will increase the incidence of aerobic spoilage in silages [45,46]. Management options to ameliorate the risk of lodging include sowing later, using varieties of cereal with greater straw strength, using semi-dwarf cereal varieties, increasing the ratio of cereal to vetch, harvesting earlier, or grazing suitable crops to delay maturity [20,47,48]. However, each potential option to mitigate lodging will need to consider factors such as local growing conditions and response of the particular plant species and varieties to grazing.
In 2008 the yield ranking of cereal varieties was consistent across harvests, and irrespective of whether sown as a monoculture or in combination with vetch, whereas in 2009 and 2010, yield ranking due to cereal variety varied between harvests within years. Furthermore, variety differences were not consistent between experiments, although Echidna and Tobruk were consistently high-yielding in 2009 and 2010 when growing conditions were more favourable, while the yield of Mannus was highest in 2008, which was the drier year. This suggested differences in varietal adaptation to drought and variation in growth potential under different growing season conditions (primarily moisture availability) and/or competitive ability when grown in mixtures. However, more evaluation would be required to confirm varietal differences in response to differing levels of moisture stress. Overall, the yield of cereal/vetch crops was only moderately correlated with yield of cereal crops. This may be due to differences in the rate of biomass accumulation between cereal and vetch, relative plant population of the two species, seasonal conditions per se which could include an impact on species composition, variation in capacity of vetch and cereal components to access resources (moisture and nutrients) under different growing conditions, or even other external factors; however it is not possible to discern the cause(s) from these experiments. Future research to quantify these interactions is required.
The proportion of vetch in the cereal/vetch crops averaged 251.5, 640.4 and 639.1 g/kg in 2008, 2009 and 2010 respectively. The lower vetch content in 2008 appeared due to less early vigour compared to the cereals and was likely exacerbated by the dry conditions previously detailed. Furthermore, vetch content did not differ between harvests in 2008, indicating vetch and cereal species grew at the same or similar growth rates post H1. In contrast vetch content increased with harvest in 2010, indicating vetch biomass accumulated more rapidly than cereals after the boot stage. We attribute some advantage to the indeterminate growth habit of Popany vetch, which allowed it to make better use of the favourable growing conditions and extended growing season experienced in that year.
Vetch content fluctuated between harvests for some crops in 2009, primarily due to changes in cereal rather than vetch yield. Average cereal yield declined from a peak of 2781 kg DM/ha at flowering to 1631 kg DM/ha at soft/mid dough stage, while average vetch yield increased from 3484 kg DM/ha at boot to 4270 kg DM/ha at flowering, with no further significant increase. The authors concluded these observations were due to lodging, which resulted in a greater proportion of total biomass being below cutting height. Consequently cereals, with their determinate growth habit, suffered a yield loss, whereas vetch, with an indeterminate growth habit, was able to continue biomass accumulation and recover yield.
Inclusion of vetch reduced yield in 2008 during drier conditions, however results were more equivocal in 2009 and 2010. In those years, vetch reduced yield on 20 occasions and increased yield on 10 occasions, with no effect for the majority. Compared to cereal crops, inclusion of vetch was more likely to increase yield at boot and flowering (seven occasions) and reduce yield at milk and soft/mid dough (12 occasions). The authors concluded that under normal or favourable growing conditions inclusion of vetch was beneficial in most instances and could provide a yield advantage for crops harvested early for silage. However, later harvests for hay or silage could result in yield loss, in some instances due to lodging rather than differences in total biomass of the cereal and vetch components.
The digestibility of cereal crops has been shown to decline post the vegetative stage of growth for a period of time until grain development commences, and subsequently may continue to decline, remain reasonably stable, or even increase [10,14,49,50]. The changes in digestibility may be explained by the conflicting effects of increasing grain set, which increases digestibility, and the continuing decline in digestibility of leaf and stem fraction. Therefore, total plant digestibility is dependent on grain proportion and forage component digestibility. Digestibility of cereal/legume crops has also been shown to decline with advancing maturity [10,15], although the impact of grain development will depend on the proportion of cereal in the mix. Digestibility changes for most cereal and cereal/vetch crops in our study was similar to those previous reports. However, for eight crops, the decline in digestibility with maturity was not significant. The only crop which showed a significant recovery in DOMD with grain development was Tobruk in 2010. Based on our results, there is little likelihood of any worthwhile recover in DOMD and delaying harvest to the soft/mid dough stage would not be justified under most circumstances.
Digestibility in 2008 and 2009 was higher than some previous reports, but consistent with others [10,14,15]. Furthermore, crop digestibility in 2010 was consistently and markedly lower than in 2008 or 2009; and generally lower than other reports for similar crops. For example, DOMD of crops at the boot stage averaged 635 g/kg in 2010, compared to 761 g/kg and 738 g/kg in 2008 and 2009 respectively. Importantly, these results show that growing conditions per se have a direct impact on digestibility. It is also probable that interactions occur between growing condition and plant genetics i.e., species and variety. However, the authors are unaware of studies that have quantified the impact of different growing conditions on grain proportion, grain digestibility, leaf and stem digestibility, and subsequent whole plant digestibility, and interactions with genetics for cereal crops.
The lower DOMD values observed in 2010 were consistent with the higher fibre (ADF and NDF) content of those crops at the same relative stage of maturity. Over the combined data set there was a strong negative correlation between DOMD and both ADF (r = −0.87) and ADF (r = −0.73). It is also probable there was a greater degree of lignification in the cereals, but this was not tested. We concluded the greater fibre content was a direct consequence of the favourable growing conditions which resulted in very high yields; as shown by the strong correlations between yield and both ADF (r = 0.76) and NDF (r = 0.73). Increasing irrigation has been shown to increase yield and fibre content and reduce digestibility in forage sorghum [51]. In contrast, reduced precipitation has been shown to increase digestibility of barley straw [52]; which is consistent with the high digestibility we observed for crops grown in 2008. A consequence of moisture stress can be increased plant sugar content. As previously discussed, differences in yield between years was clear and appeared to be largely rainfall-dependent. In our experiments the correlation between yield and WSC was moderately negative (r = −0.63). In this instance the relationship was stronger when the individual crop types were analysed separately, likely due to the inherently higher WSC content of cereal compared to cereal/vetch crops: cereal crops (r = −0.73) and cereal/vetch crops (r = −0.76). These results also highlight the relative importance of harvesting at the boot stage for well grown compared to drought-affected crops.
The relationship between both ADF and NDF content and cereal crop maturity has been reported as being curvilinear, initially increasing from the boot stage, but later declining with grain filling [11,14,35,53]. In our experiments, the NDF of Strzelecki (2009) and Wedgetail, Strzelecki, Tobruk and Urambie (2010) followed this pattern, whereas the NDF content of both oat varieties was highest at the soft/mid dough stage. A possible explanation for this, based on previous reports for Australian cereals, is that oats contain less grain than wheat, barley and triticale as a proportion of total biomass [54]. The NDF content of all other crops except Gairdner in 2009, which was lowest at the soft/mid dough stage, remained constant. Unfortunately, the abandonment of the soft/mid dough stage harvest in 2008 being precluded assessment of the effect of drought on fibre content and maturity. The effect of vetch on fibre content was inconsistent but only based on data from nine crops because other crops were not harvested in 2009 and 2010 due to lodging.
The WSC content of both cereal and cereal/vetch crops declined with maturity as expected. In addition, we observed differences in WSC content due to vetch inclusion, year and cereal variety. Generally, for comparable crops, i.e., the same cereal variety and harvest maturity, cereal crops had higher WSC content than cereal/vetch crops at the boot, anthesis and milk harvests, but these differences had largely disappeared by the soft/mid dough stage. We attribute this primarily to a decline in cereal crop WSC content as a consequence of grain development. Differences existed due to cereal variety but were inconsistent between years and harvests. Further controlled studies would be required to identify varietal differences if this was considered to be of importance.
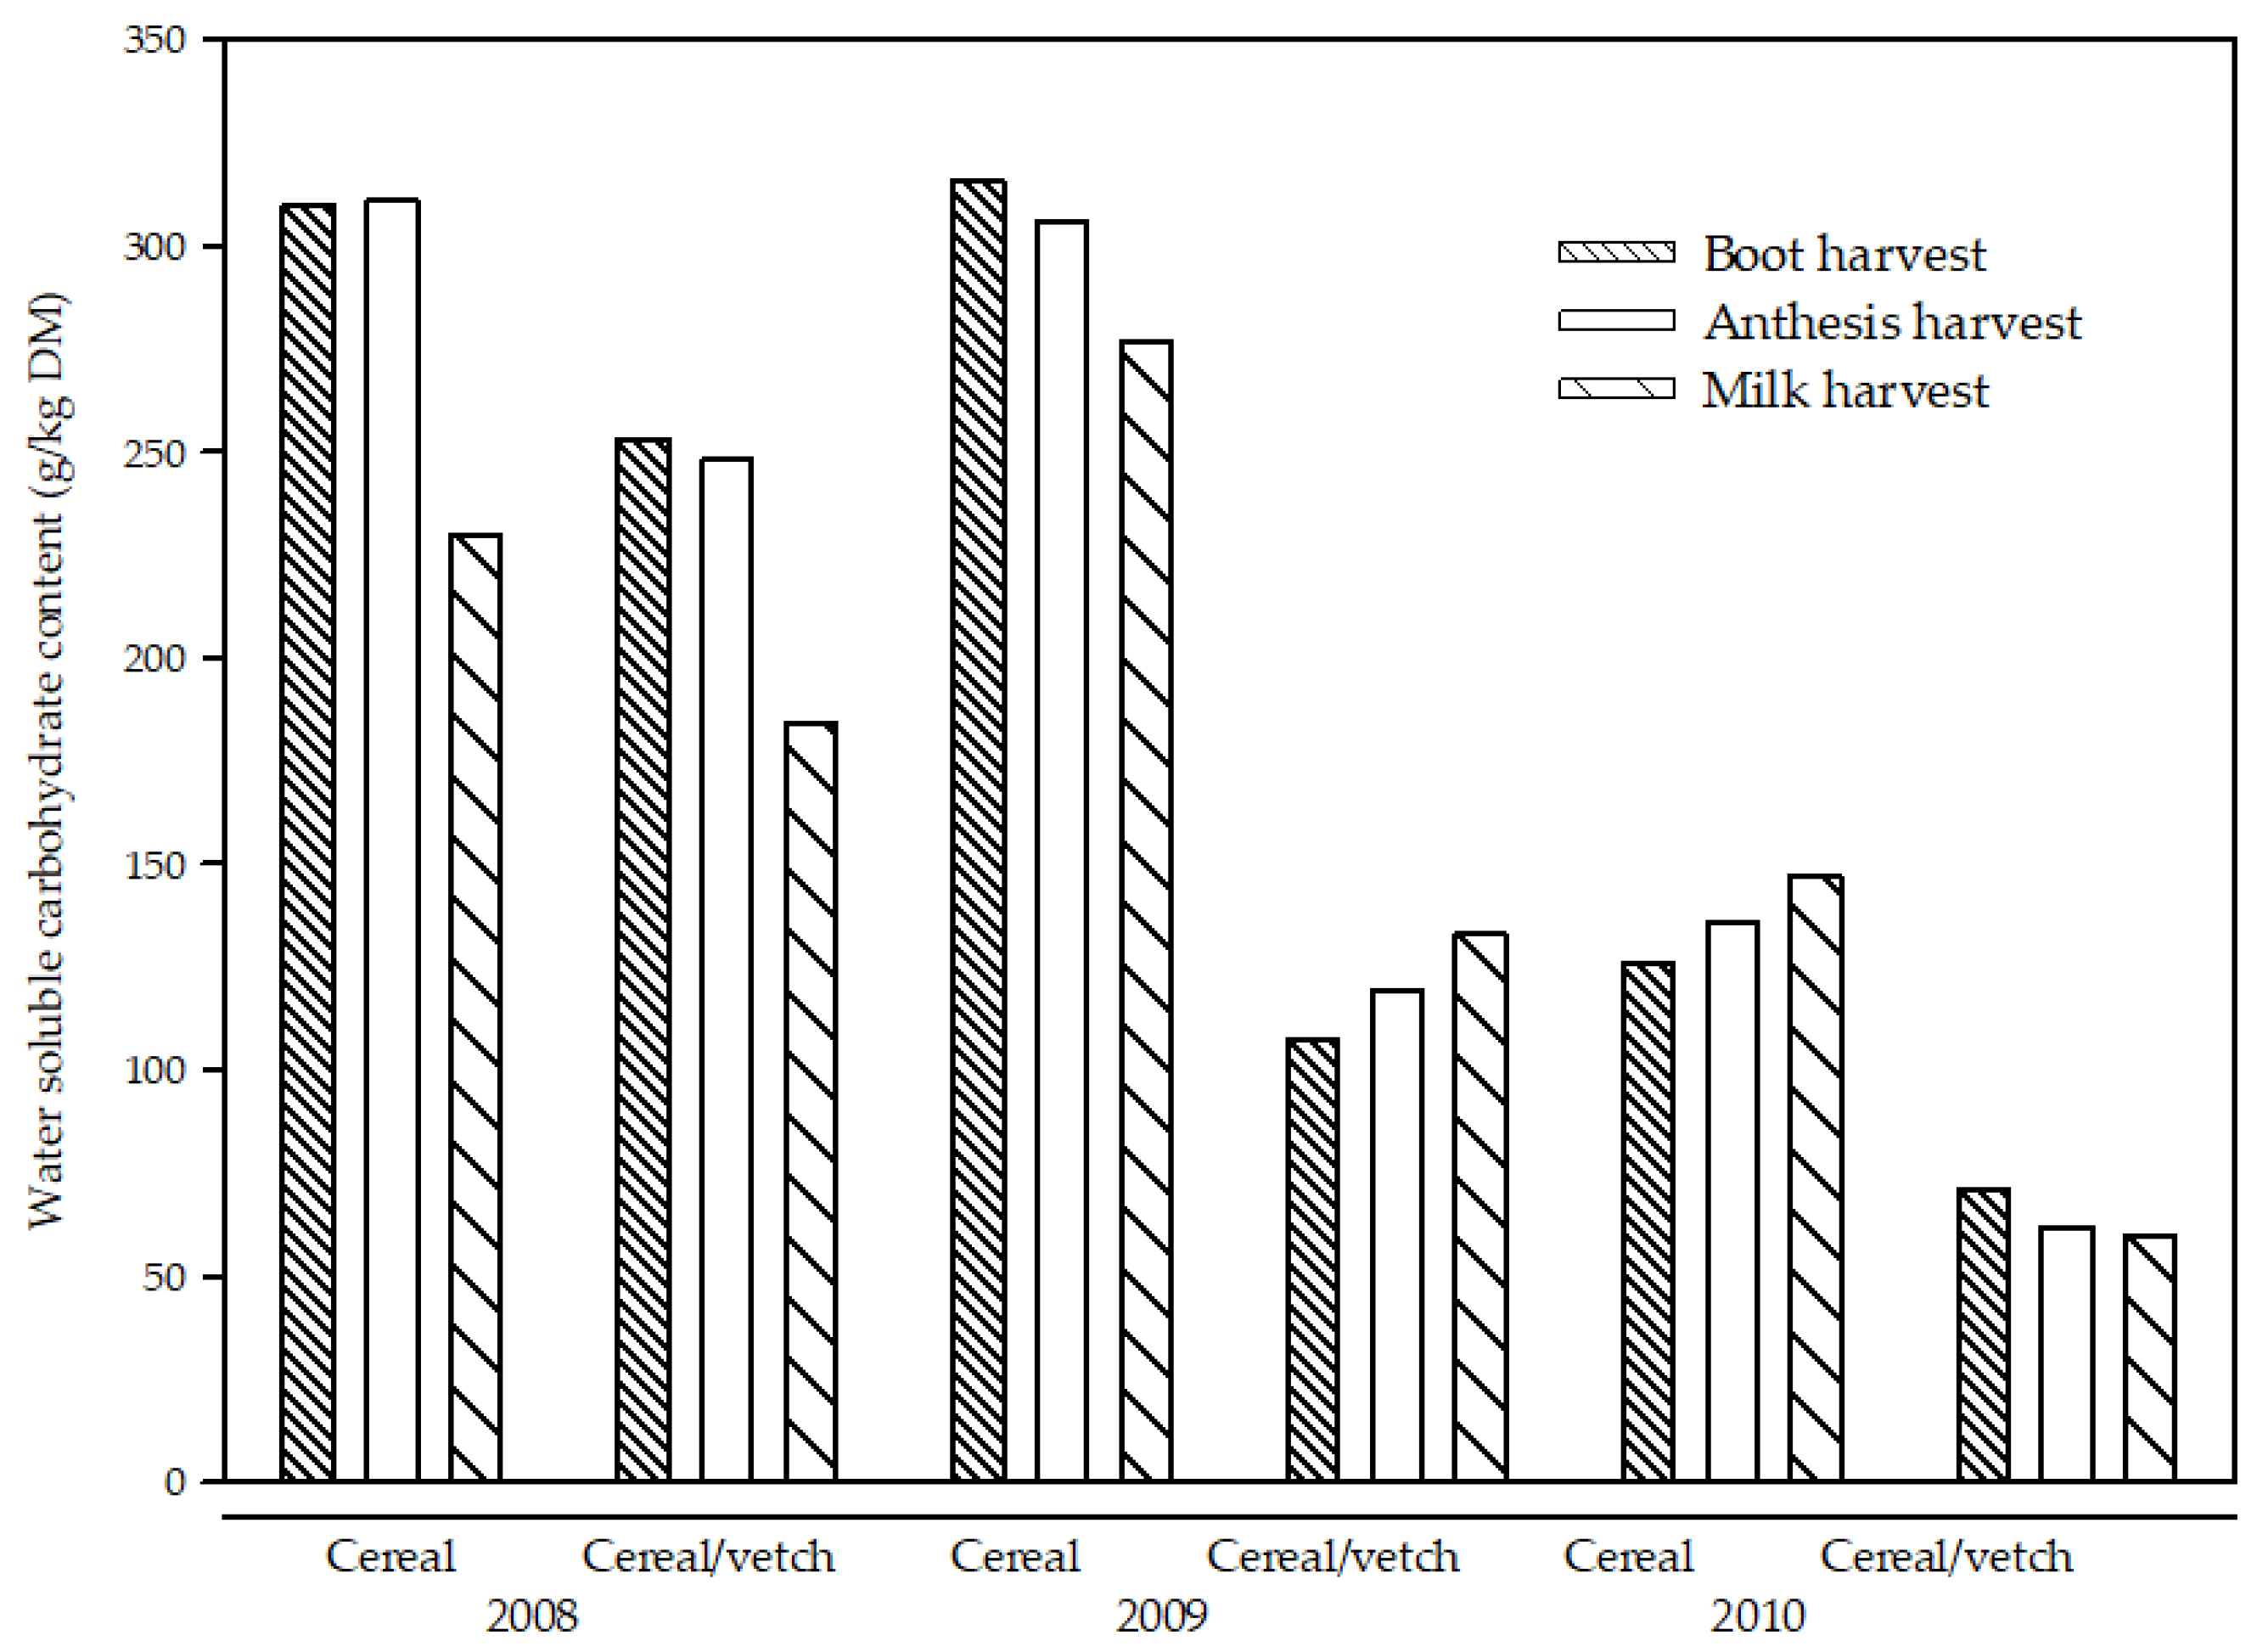
In addition, WSC content was generally lower for comparable crops in 2010 compared to 2008 and 2009. Furthermore, the average WSC content of the 2008 and 2009 cereal crops was alike at the boot, anthesis and milk harvests, whereas the average WSC content of 2009 cereal/vetch crops was lower and numerically closer to 2010 (Figure 7). There were also differences between years, with the average decline between boot and milk being 25.8% and 12.3% in 2008 and 2009, respectively, for cereal crops, and 27.3 and 15.5% in 2008 and 2010, respectively, for cereal/vetch crops. In contrast, WSC content increased by 16.7% for cereal crops in 2010 and 24.3% for cereal/vetch crops in 2009. Overall, these results highlight the significant impact that growing conditions can have on the proportion of individual carbohydrates components of the crops. The authors speculate that under severe moisture stress conditions, like those experienced in 2008, plants are less able to convert non-structural carbohydrates to structural carbohydrates. In contrast, when growing conditions are highly favourable and moisture content is essentially non-limiting, as in 2010, the rapid biomass accumulation necessarily requires a greater proportion of structural carbohydrates to support the plant growth. There is also the possibility that location differences had some impact on growth, however we believe that would be minor compared to differences in moisture availability.
Crop CP content and decline with maturity was similar to reports by other authors [10,11,15,40,53,55,56,57]. We found that cereal crop CP content varied markedly between years, further highlighting the potential for growing conditions to significantly alter forage quality. For example, average cereal crop CP content at the boot harvest ranged from 79 g/kg DM in 2009 to 154 g/kg DM in 2008. However, because crops were grown in different locations, we cannot state if the effect was due to site, rainfall or other factors; either solely or in combination. In contrast, growing conditions had less effect on the cereal/vetch crops, where average CP content at the boot stage ranged from 183 g/kg DM in 2008 to 195 g/kg DM in 2009.
Inclusion of vetch increased CP content for all comparable crops in 2009 and 2010, consistent with other studies [13,15,19,20]. However, in 2008, there was no difference in CP content between cereal and cereal/vetch for approximately half of the crops. We attribute the lack of difference to growing conditions which resulted in a higher cereal CP content, lower vetch content and early senescence of vetch plants. We also found that cereal/vetch CP content was positively correlated to vetch content (r = 0.73), after accounting for the effects of maturity (harvest) and year. Other authors have similarly reported that increasing legume content in cereal/legume crops increases forage CP content [13,15,17,40]. However, determining the ideal proportion of vetch will depend on a range of external (growing conditions) and management (sowing rates, harvest time) factors. Further research is required to quantify the interactions between these factors for a range of cereal and vetch genotypes, and to make recommendations on the best management of these crops.
While our studies focused on the role of domesticated cereals alone or in combination with legumes, changing climatic conditions and continued efforts in plant breeding programs may result in the use of locally adapted wild relatives being used in fodder conservation roles. Similarly, the use of domesticated cereal species for fodder conservation may be a mechanism to remove grazing pressure from threatened native plant species and communities, particularly under adverse climatic events such as drought.
5. Conclusions
Cereal and cereal/vetch crops can provide significant DM yields for fodder conservation. Addition of vetch per se does not necessarily affect yield, but can cause lodging on occasions, which will decrease harvestable yield. Vetch was more susceptible to drought which could disadvantage yield. However, vetch increased CP content and would justify its inclusion to ensure better utilisation of forage energy. Moisture stress appeared to reduce fibre content and increase digestibility, WSC content, ratio of WSC to fibre, and cereal crop CP content, whereas, more favourable growing conditions were associated with increased fibre content and reduced digestibility.
Further research is required to quantify the impacts of growing conditions on quality of species grown as monocultures and as mixed crops. Given the likely complex interactions between environment and genotype, further research is also needed to identify regionally specific management packages that recommends optimal species, varieties and sowing rates for cereal and cereal/vetch crops.
Author Contributions
Conceptualization, J.W.P. and B.F.H.; methodology, J.W.P. and B.F.H.; validation, J.W.P. and B.F.H.; formal analysis, J.W.P.; investigation, J.W.P. and C.A.R.; resources, J.F.W., J.W.P. and B.F.H.; data curation, C.A.R. and J.W.P.; writing—original draft preparation, J.W.P.; writing—review and editing, J.W.P. and B.F.H.; supervision, J.F.W. and J.W.P.; project administration, J.F.W.; funding acquisition, J.F.W. All authors have read and agreed to the published version of the manuscript.
Funding
This research was funded by the Australian Centre for International Agricultural Research, LPS-2006-119.
Institutional Review Board Statement
Not applicable.
Informed Consent Statement
Not applicable.
Data Availability Statement
All data contained within the paper in tabular or graphical format. Contact the corresponding author is further explanation is required.
Acknowledgments
The authors acknowledge the support provided by the New South Wales Department of Primary Industries and the Graham Centre for Agricultural Innovation.
Conflicts of Interest
The authors declare no conflict of interest.
References
- Chapman, D.F.; Cullen, B.R.; Johnson, I.R.; Beca, D. Interannual variation in pasture growth rate in Australian and New Zealand dairy regions and its consequences for system management. Anim. Prod. Sci. 2009, 49, 1071–1079. [Google Scholar] [CrossRef]
- Perrara, R.S.; Cullen, B.R.; Eckard, R.J. Changing patterns of pasture production in south-eastern Australia from 1960 to 2015. Crop. Pasture Sci. 2020, 71, 70. [Google Scholar] [CrossRef]
- Tramblay, Y.; Koutroulis, A.; Samaniego, L.; Vicente-Serrano, S.M.; Volaire, F.; Boone, A.; Le Page, M.; Llasat, M.C.; Albergel, C.; Burak, S.; et al. Challenges for drought assessment in the Mediterranean region under future climate scenarios. Earth Sci. Rev. 2020, 210, 103348. [Google Scholar] [CrossRef]
- Dear, B.S.; Virgona, J.M.; Sandral, G.A.; Swan, A.D.; Orchard, B.A. Effect of companion perennial grasses and lucerne on seed yield and regeneration of subterranean clover in two wheatbelt environments. Aust. J. Agric. Res. 2001, 52, 973–983. [Google Scholar] [CrossRef]
- Nie, Z.N.; Miller, S.; Moore, G.A.; Hackney, B.F.; Boschma, S.P.; Reed, K.F.M.; Mitchell, M.; Albertsen, T.O.; Clark, S.; Craig, A.D.; et al. Field evaluation of perennial grasses and herbs in southern Australia. 2. Persistence, root characteristics and summer activity. Aust. J. Exp. Agric. 2008, 48, 424–435. [Google Scholar] [CrossRef]
- Hackney, B.; Rodham, C.; Dyce, G.; Piltz, J. Pasture legumes differ in herbage production and quality throughout spring, impacting their potential role in fodder conservation and animal production. Grass Forage Sci. 2021, 76, 116–133. [Google Scholar] [CrossRef]
- Bell, L.W.; Moore, A.D.; Kirkegaard, J.A. Evolution in crop-livestock integration systems that improve farm productivity and environmental performance in Australia. Eur. J. Agron. 2014, 57, 10–20. [Google Scholar] [CrossRef]
- Matthews, P.; McCaffery, D.; Jenkins, L. Winter Crops Variety Sowing Guide 2020; NSW Department of Primary Industries: Orange, Australia, 2020.
- GRDC. Hay and Silage Fact Sheet: Making the Most of a Failed Winter Crop; Grains Research and Development Corporation: Canberrra, Australia, 2018. [Google Scholar]
- Kaiser, A.G.; Dear, B.S.; Morris, S.G. An evaluation of the yield and quality of oat-legume and ryegrass-legume mixtures and legume monocultures harvested at three stages of growth for silage. Aust. J. Exp. Agric. 2007, 47, 25–38. [Google Scholar] [CrossRef]
- Khorasani, G.R.; Jedel, P.E.; Helm, J.H.; Kennelly, J.J. Influence of stage of maturity on yield components and chemical composition of cereal grain silages. Can. J. Anim. Sci. 1997, 77, 259–267. [Google Scholar] [CrossRef]
- Wang, L. An Investigation on the Effect of Maturity Stage and Variety on the Quality of Cereal Forages; Charles Sturt University: Wagga Wagga, NSW, Australia, 2010. [Google Scholar]
- Moreira, N. The Effect of Seed Rate and Nitrogen-Fertilizer on the Yield and Nutritive-Value of Oat Vetch Mixtures. J. Agric. Sci. 1989, 112, 57–66. [Google Scholar] [CrossRef]
- Nadeau, E. Effects of plant species, stage of maturity and additive on the feeding value of whole-crop cereal silage. J. Sci. Food Agric. 2007, 87, 789–801. [Google Scholar] [CrossRef]
- Roberts, C.A.; Moore, K.J.; Johnson, K.D. Forage Quality and Yield of Wheat-Vetch at Different Stages of Maturity and Vetch Seeding Rates. Agron. J. 1989, 81, 57–60. [Google Scholar] [CrossRef]
- Acar, Z.; Gulumser, E.; Asci, O.O.; Basaran, U.; Mut, H.; Ayan, I. Effects of sowing ratio and harvest periods on hay yields, quality and competitive characteristics of Hungarian vetch-cereal mixtures. Legume Res. 2017, 40, 677–683. [Google Scholar] [CrossRef] [Green Version]
- Atis, I.; Kokten, K.; Hatipoglu, R.; Yilmaz, S.; Atak, M.; Can, E. Plant density and mixture ratio effects on the competition between common vetch and wheat. Aust. J. Crop Sci. 2012, 6, 498–505. [Google Scholar]
- Carr, P.M.; Horsley, R.D.; Poland, W.W. Barley, oat, and cereal-pea mixtures as dryland forages in the Northern Great Plains. Agron. J. 2004, 96, 677–684. [Google Scholar] [CrossRef] [Green Version]
- Erol, A.; Kaplan, M.; Kizilsimsek, M. Oats (Avena sativa)—Common vetch (Vicia sativa) mixtures grown on a low-input basis for a sustainable agriculture. Trop. Grassl. 2009, 43, 191–196. [Google Scholar]
- Karagic, D.; Mikic, A.; Milosevic, B.; Vasiljevic, S.; Dusanic, N. Common vetch-wheat intercropping: Haylage yield and quality depending on sowing rates. Afr. J. Biotechnol. 2012, 11, 7637–7642. [Google Scholar] [CrossRef]
- Nykanen, A.; Jauhiainen, L.; Rinne, M. Biomass production and feeding value of whole-crop cereal-legume silages. Agron. Res. 2009, 7, 684–690. [Google Scholar]
- Salawu, M.B.; Adesogan, A.T.; Weston, C.N.; Williams, S.P. Dry matter yield and nutritive value of pea/wheat bi-crops differing in maturity at harvest, pea to wheat ratio and pea variety. Anim. Feed. Sci. Technol. 2001, 94, 77–87. [Google Scholar] [CrossRef]
- Matic, R. Improved Vetch Varieties for Fodder Production; Rural Industries Research and Development Corporation: Canberrra, Australia, 2007. [Google Scholar]
- World Reference Base for Soil Resources 2014. International Soil Classification System for Naming Soils and Creating Legends for Soil Maps; FAO: Rome, Italy, 2014. [Google Scholar]
- Isbell, R. The Australian Soil Classification, 2nd ed.; CSIRO Publishing: Melbourne, Australia, 2016. [Google Scholar]
- McKenzie, N.; Jaquier, D.; Isbell, R.; Brown, K. Australian Soils and Landscapes an Illustrated Compendium; CSIRO: Melbourne, Australia, 2004. [Google Scholar]
- Zadoks, J.C.; Chang, T.T.; Konzak, C.F. A decimal code for the growth stages of cereals. Weed Res. 1974, 14, 415–421. [Google Scholar] [CrossRef]
- AFIA. AFIA—Laboratory Methods Manual, 8th ed.; Australian Fodder Industry Association: Melbourne, Australia, 2014. [Google Scholar]
- Association of Official Analytical Chemists. International Official Methods of Analysis, 16th ed.; AOAC: Rockville, MD, USA, 1997. [Google Scholar]
- Tilley, J.M.A.; Terry, R.A. A two-stage technique for the in vitro digestion of forage crops. Grass Forage Sci. 1963, 18, 104–111. [Google Scholar] [CrossRef]
- Piltz, J.W. Digestibility of Australian Maize Silages. Master’s Thesis, University of New England, New South Wales, Australia, 1993. [Google Scholar]
- Van Soest, P.J.; Robertson, J.B.; Lewis, B.A. Methods for dietary fiber, neutral detergent fiber, and nonstarch polysaccharides in relation to animal nutrition. J. Dairy Sci. 1991, 74, 3583–3597. [Google Scholar] [CrossRef]
- Genstat. Genstat for Windows, 20th ed.; VSN International Limited: Hemel Hempstead, UK, 2020; version 20.1. [Google Scholar]
- Urquhart, N.S. Adjustment in Covariance When One Factor Affects the Covariate. Biometrics 1982, 38, 651–660. [Google Scholar] [CrossRef] [PubMed]
- Delogu, G.; Faccini, N.; Faccioli, P.; Regiani, F.; Lendini, M.; Berardo, N.; Odoardi, M. Dry matter yield and quality evaluation at two phenological stages of forage triticale grown in the Po Valley and Sardinia, Italy. Field Crop. Res. 2002, 74, 207–215. [Google Scholar] [CrossRef]
- Edmisten, K.L.; Green, J.T.; Mueller, J.P.; Burns, J.C. Winter annual small grain forage potential. I. Dry matter yield in relation to morphological characteristics of four small grain species at six growth stages. Commun. Soil Sci. Plant Anal. 1998, 29, 867–879. [Google Scholar] [CrossRef]
- Fisher, L.J.; Fowler, D.B. Predicted forage value of whole plant cereals. Can. J. Plant Sci. 1975, 55, 975–986. [Google Scholar] [CrossRef]
- Fraser, T.J.; Knight, T.L.; Knowles, I.M.; Hyslop, M.G. Twenty-five tonnes of high quality forages annually in Canterbury. Proc. N. Z. Grassl. Assoc. 2004, 66, 85–91. [Google Scholar] [CrossRef]
- Jacobs, J.L.; Ward, G.N. Dry matter yields and nutritive value of silage from cereal and pea combinations. In Global Issues, Paddock Action, Proceedings of the 14th Agronomy Conference, Adelaide, Australia, 21–25 September 2008; Australian Society of Agronomy Inc.: Adelaide, Australia, 2008. [Google Scholar]
- Karagic, D.; Vasiljevic, S.; Katic, S.; Mikic, A.; Milic, D.; Milosevic, B.; Dusanic, N. Yield and quality of winter common vetch (Vicia sativa L.) haylage depending on sowing method. Biotechnol. Anim. Husb. 2011, 27, 1585–1594. [Google Scholar] [CrossRef]
- Anwar, A.; Ansar, M.; Nadeem, M.; Ahmad, G.; Khan, S.; Hussain, A. Performance of non-traditional winter legumes with oats for forage yield under rainfed conditions. J. Agric. Res. 2010, 48, 171–179. [Google Scholar]
- Zhang, Y.; Duan, Y.; Nie, J.Y.; Yang, J.; Ren, J.H.; van der Werf, W.; Evers, J.B.; Zhang, J.; Su, Z.C.; Zhang, L.Z. A lack of complementarity for water acquisition limits yield advantage of oats/vetch intercropping in a semi-arid condition. Agric. Water Manag. 2019, 225. [Google Scholar] [CrossRef]
- Hackney, B.; Rodham, C.; Piltz, J. Using Biserrula to Increase Crop and Livestock Production; Meat & Livestock Australia Ltd: North Sydney, Australia, 2013. [Google Scholar]
- Armour, T.; Jamieson, P.D.; Nicholls, A.; Zyskowski, R. Breaking the 15t/ha wheat yield barrier. In Proceedings of the 4th International Crop Science Congress, Brisbane, Australia, 26 September–1 October 2004. [Google Scholar]
- Wilkinson, J.M.; Davies, D.R. The aerobic stability of silage: Key findings and recent developments. Grass Forage Sci. 2013, 68, 1–19. [Google Scholar] [CrossRef]
- Davies, D.R.; Fychan, R.; Jones, R. Aerobic deterioration of silage: Causes and controls. In Nutritional Biotechnology in the Feed and Food Industries: Proceedings of Alltech’s 23rd Annual Symposium; Lyons, T.P., Jacques, K.A., Hower, J.M., Eds.; Alltech UK: Stamford, UK, 2007; pp. 227–238. [Google Scholar]
- Shah, A.N.; Tanveer, M.; Rehman, A.U.; Anjum, S.A.; Iqbal, J.; Ahmad, R. Lodging stress in cereal-effects and management: An overview. Environ. Sci. Pollut. Res. 2017, 24, 5222–5237. [Google Scholar] [CrossRef]
- Harrison, M.T.; Evans, J.R.; Dove, H.; Moore, A.D. Dual-purpose cereals: Can the relative influences of management and environment on crop recovery and grain yield be dissected? Crop. Pasture Sci. 2011, 62, 930–946. [Google Scholar] [CrossRef]
- Edmisten, K.L.; Green, J.T.; Mueller, J.P.; Burns, J.C. Winter annual small grain forage potential. II. Quantification of nutritive characteristics of four small grain species at six growth stages. Commun. Soil Sci. Plant Anal. 1998, 29, 881–899. [Google Scholar] [CrossRef]
- Jacobs, J.L.; Ward, G.N. Effect of intercropping forage peas (Pisum sativum L.) with winter wheat (Tritium vulgare L.) or triticale (Triticale hexaploide Lart.) on DM yield, nutritive characteristics when harvested at different stages of growth. Anim. Prod. Sci. 2012, 52, 949–958. [Google Scholar] [CrossRef]
- Carmi, A.; Aharoni, Y.; Edelstein, M.; Umiel, N.; Hagiladi, A.; Yosef, E.; Nikbachat, M.; Zenou, A.; Miron, J. Effects of irrigation and plant density on yield, composition and in vitro digestibility of a new forage sorghum variety, Tal, at two maturity stages. Anim. Feed. Sci. Technol. 2006, 131, 120–132. [Google Scholar] [CrossRef]
- Goodchild, A.V. Effects of rainfall and temperature on the feeding value of barley straw in a semi-arid Mediterranean environment. J. Agric. Sci. 1997, 129, 353–366. [Google Scholar] [CrossRef]
- Filya, I. Nutritive value of whole crop wheat silage harvested at three stages of maturity. Anim. Feed. Sci. Technol. 2003, 103, 85–95. [Google Scholar] [CrossRef]
- Unkovich, M.; Baldock, J.; Forbes, M. Variability in Harvest Index of Grain Crops and Potential Significance for Carbon Accounting: Examples from Australian Agriculture. Adv. Agron. 2010, 105, 173–219. [Google Scholar] [CrossRef]
- Borowiec, F.; Furgal, K.; Kaminski, J.; Zajac, T. Nutritive value of silage made of whole barley crop harvested at various stages of maturity. J. Anim. Feed. Sci. 1998, 7, 45–54. [Google Scholar] [CrossRef]
- Hadjipanayiotou, M.; Antoniou, I.; Theodoridou, M.; Photiou, A. In situ degradability of forages cut at different stages of growth. Livest. Prod. Sci. 1996, 45, 49–53. [Google Scholar] [CrossRef]
- Juskiw, P.E.; Helm, J.H.; Salmon, D.F. Forage yield and quality for monocrops and mixtures of small grain cereals. Crop Sci. 2000, 40, 138–147. [Google Scholar] [CrossRef]
Figure 1.
Location of Temora, Wagga Wagga and Culcairn trial sites in New South Wales (NSW), Australia.
Figure 1.
Location of Temora, Wagga Wagga and Culcairn trial sites in New South Wales (NSW), Australia.

Figure 2.
Digestibility of cereal and cereal/vetch crops harvested at the boot, anthesis, milk and soft/mid dough stage of cereal development. Data for seven cereal varieties with or without vetch and harvested in 2008, 2009 and 2010.
Figure 2.
Digestibility of cereal and cereal/vetch crops harvested at the boot, anthesis, milk and soft/mid dough stage of cereal development. Data for seven cereal varieties with or without vetch and harvested in 2008, 2009 and 2010.

Figure 3.
Crude protein content of cereal and cereal/vetch crops harvested at the boot, anthesis, milk and soft/mid dough stage of cereal development. Data for seven cereal varieties with or without vetch and harvested in 2008, 2009 and 2010.
Figure 3.
Crude protein content of cereal and cereal/vetch crops harvested at the boot, anthesis, milk and soft/mid dough stage of cereal development. Data for seven cereal varieties with or without vetch and harvested in 2008, 2009 and 2010.

Figure 4.
Water soluble carbohydrates content of cereal and cereal/vetch crops harvested at the boot, anthesis, milk and soft/mid dough stage of cereal development. Data for seven cereal varieties with or without vetch and harvested in 2008, 2009 and 2010.
Figure 4.
Water soluble carbohydrates content of cereal and cereal/vetch crops harvested at the boot, anthesis, milk and soft/mid dough stage of cereal development. Data for seven cereal varieties with or without vetch and harvested in 2008, 2009 and 2010.

Figure 5.
Effect of cereal variety and maturity at harvest on acid detergent fibre content (g/kg DM) of cereal and cereal/vetch crops. Data for seven cereal varieties averaged over crops with or without vetch and harvested in 2008, 2009 and 2010.
Figure 5.
Effect of cereal variety and maturity at harvest on acid detergent fibre content (g/kg DM) of cereal and cereal/vetch crops. Data for seven cereal varieties averaged over crops with or without vetch and harvested in 2008, 2009 and 2010.

Figure 6.
Neutral detergent fibre content of cereal and cereal/vetch crops harvested at the boot, anthesis, milk and soft/mid dough stage of cereal development. Data for seven cereal varieties with or without vetch and harvested in 2008, 2009 and 2010.
Figure 6.
Neutral detergent fibre content of cereal and cereal/vetch crops harvested at the boot, anthesis, milk and soft/mid dough stage of cereal development. Data for seven cereal varieties with or without vetch and harvested in 2008, 2009 and 2010.

Figure 7.
Average water soluble carbohydrates content of cereal and cereal/vetch crops harvested at the boot, anthesis and milk stage of cereal development in each of three years. Results are the mean of seven cereal varieties: two oats, two wheat, two barley and one triticale.
Figure 7.
Average water soluble carbohydrates content of cereal and cereal/vetch crops harvested at the boot, anthesis and milk stage of cereal development in each of three years. Results are the mean of seven cereal varieties: two oats, two wheat, two barley and one triticale.


Table 1.
Date at each harvest of cereal and cereal/vetch crops grown in three years at three sites in southern NSW.
Table 1.
Date at each harvest of cereal and cereal/vetch crops grown in three years at three sites in southern NSW.
| Cereal Species | Cereal Variety | Wagga 2008 Harvest | Culcairn 2009 Harvest | Temora 2010 Harvest | ||||||||
|---|---|---|---|---|---|---|---|---|---|---|---|---|
| 1 | 2 | 3 | 1 | 2 | 3 | 4 | 1 | 2 | 3 | 4 | ||
| Cereal crops | ||||||||||||
| Avena sativa L. | Echidna | 2 October | 15 October | 22 October | 27 September | 8 October | 13 October 1 | 30 October | 5 October | 20 October | 26 October 1 | 15 November 1 |
| A. sativa | Mannus | 29 September | 15 October | 22 October | 16 September | 28 September | 10 October 1 | 30 October | 7 October 1 | 14 October 1 | 24 October 1 | 18 November |
| Hordeum vulgare L. | Gairdner | 1 October 1 | 15 October | 22 October | 25 September | 8 October | 15 October | 31 October 1 | 5 October 3 | 11 October 3 | 20 October 3 | 3 November 1,3 |
| H. vulgare | Urambie | 29 September | 15 October | 22 October | 25 September | 8 October | 15 October | 30 October 1 | 24 September | 5 October | 20 October | 2 November 1 |
| Triticum aestivum L. | Wedgetail | 6 October | 17 October | 22 October | 8 October | 12 October | 3 November | 8 November 1 | 5 October | 20 October | 6 November 1 | 22 November |
| T. aestivum | Strzelecki | 6 October | 16 October 1 | 22 October | 3 October | 8 October | 2 November 1 | 10 November | 7 October 1 | 11 October | 26 October 1 | 22 November |
| × Triticosecale | Tobruk | 5 October 1 | 17 October | 22 October | 4 October 1 | 19 October | 3 November | 10 November | 5 October | 20 October | 9 November | 22 November |
| Cereal/vetch crops | ||||||||||||
| A. sativa | Echidna | 1 October 1 | 15 October | 22 October | 27 Sepember 1 | 12 October 1 | 19 October 1 | 30 October | 9 October 1 | 20 October | 25 October | 18 November |
| A. sativa | Mannus | 29 September | 15 October | 22 October | 16 September | 28 September | 8 October | 30 October | 7 October 1 | 20 October 1 | 27 October 1 | 18 November |
| H. vulgare | Gairdner | 1 October 1 | 15 October | 22 October | 25 September 3 | 9 October 1 | 16 October 1 | 28 October 1 | 5 October | 11 October | 23 October 1,3 | 1 November |
| H. vulgare | Urambie | 29 September | 15 October | 22 October | 25 September 1 | 8 October | 18 October 1 | 29 October 1 | 29 September 1 | 9 October 1 | 20 October | 3 November 1 |
| T. aestivum | Wedgetail | 6 October | 17 October | 22 October | 8 October | 18 October 1 | 3 November | not cut | 7 October 1 | 20 October | 7 November 1 | not cut |
| T. aestivum | Strzelecki | 3 October 1 | 16 October 1 | 22 October | 3 October 1,3 | 11 October 1 | 27 October | 3 November 2 | 5 October | 11 October | 6 November 1 | not cut |
| × Triticosecale | Tobruk | 5 October 1 | 17 October 3 | 22 October | 4 October 1 | 19 October | 3 November | not cut | 5 October | 20 October | 6 November 1 | not cut |
1 Mean date when not all plots harvested on the same day, 2 Only 1 value, 3 Only 2 values.
Table 2.
Annual and growing season rainfall (mm) at experimental sites compared to the long-term average for each respective site.
Table 2.
Annual and growing season rainfall (mm) at experimental sites compared to the long-term average for each respective site.
| Site | Year | Annual Rainfall | Growing Season Rainfall 1 | ||
|---|---|---|---|---|---|
| Experiment | Long-Term Average | Experiment | Long-Term Average | ||
| Wagga Wagga | 2008 | 414 | 524 | 185 | 329 |
| Culcairn | 2009 | 404 | 591 | 306 | 379 |
| Temora | 2010 | 749 | 524 | 479 | 358 |
1 Rainfall from April to the month in with the final harvest occurred; i.e., October in 2008 and 2009 and November in 2010.
Table 3.
Predicted mean yield (kg DM/ha) at each harvest of cereal and cereal/vetch crops grown in three years at three sites in southern NSW.
Table 3.
Predicted mean yield (kg DM/ha) at each harvest of cereal and cereal/vetch crops grown in three years at three sites in southern NSW.
| Cereal Species | Cereal Variety | Wagga Wagga 2008 Harvest | Culcairn 2009 Harvest | Temora 2010 Harvest | |||||||||
|---|---|---|---|---|---|---|---|---|---|---|---|---|---|
| 1 | 2 | 3 | 1 | 2 | 3 | 4 | 1 | 2 | 3 | 4 | |||
| Cereal crops | |||||||||||||
| Avena sativa L. | Echidna | 1569 | 2278 | 2200 | 7080 | 7810 | 8832 | 9988 | 17,569 | 28,019 | 25,935 | 27,280 | |
| A. sativa | Mannus | 1914 | 2624 | 2546 | 4172 | 5298 | 8700 | 8057 | 20,622 | 19,704 | 21,567 | 28,266 | |
| Hordeum vulgare L. | Gairdner | 1530 | 2240 | 2162 | 4258 | 5458 | 5677 | 6911 | 19,263 | 16,222 | 17,946 | 31,338 | |
| H. vulgare | Urambie | 1815 | 2525 | 2447 | 4599 | 5573 | 5624 | 7218 | 10,125 | 16,323 | 20,102 | 25,842 | |
| Triticum aestivum L. | Wedgetail | 1414 | 2124 | 2046 | 6504 | 7236 | 7861 | 6985 | 13,603 | 21,098 | 24,852 | 28,742 | |
| T. aestivum | Strzelecki | 1780 | 2490 | 2412 | 4091 | 4789 | 5954 | 6353 | 15,121 | 15,429 | 22,035 | 27,950 | |
| × Triticosecale | Tobruk | 1806 | 2516 | 2438 | 6705 | 8555 | 8566 | 8280 | 15,973 | 21,401 | 30,724 | 37,718 | |
| Cereal + vetch crops | |||||||||||||
| A. sativa | Echidna | 1201 | 1911 | 1833 | 7377 | 8381 | 8181 | 8445 | 17,215 | 22,968 | 28,916 | 29,573 | |
| A. sativa | Mannus | 1547 | 2257 | 2179 | 4340 | 5740 | 7920 | 6384 | 15,038 | 25,789 | 17,813 | 23,207 | |
| H. vulgare | Gairdner | 1163 | 1872 | 1794 | 5856 | 7330 | 6326 | 6669 | 14,860 | 14,172 | 24,954 | 14,472 | |
| H. vulgare | Urambie | 1448 | 2158 | 2080 | 5509 | 6756 | 5584 | 6287 | 10,198 | 12,270 | 19,575 | 17,310 | |
| T. aestivum | Wedgetail | 1047 | 1757 | 1679 | 5592 | 6598 | 6000 | * | 14,470 | 16,578 | 14,042 | * | |
| T. aestivum | Strzelecki | 1413 | 2122 | 2044 | 5919 | 6891 | 6834 | 6341 | 16,132 | 16,196 | 14,649 | * | |
| × Triticosecale | Tobruk | 1439 | 2149 | 2071 | 5534 | 7657 | 6446 | * | 16,563 | 17,578 | 17,112 | * | |
| p value | l.s.d.(p<0.05) | p value | l.s.d.(p<0.05) | p value | l.s.d.(p<0.05) | ||||||||
| variety | 0.018 | 296.6 | <0.001 | 902.4 | <0.001 | 2690.8 | |||||||
| vetch | <0.001 | 158.6 | ns | - | <0.001 | np | |||||||
| harvest | <0.001 | 166.4 | <0.001 | 478.0 | <0.001 | 1358.5 | |||||||
| variety × vetch | ns | - | 0.021 | 1290.2 | ns | - | |||||||
| variety × harvest | ns | - | 0.002 | 1374.5 | <0.001 | 4039.2 | |||||||
| vetch × harvest | ns | - | <0.001 | 724.0 | <0.001 | 2075.0 | |||||||
| variety × vetch × harvest | ns | - | ns | - | <0.001 | 5742.0 | |||||||
* No harvest of this treatment; ns = not significant; np = not predicted.
Table 4.
The effect of cereal variety and year on vetch content (g/kg) of cereal/vetch crops grown in three years at three sites 1 in southern NSW.
Table 4.
The effect of cereal variety and year on vetch content (g/kg) of cereal/vetch crops grown in three years at three sites 1 in southern NSW.
| Cereal Species | Cereal Variety | Year | ||
|---|---|---|---|---|
| 2008 | 2009 | 2010 | ||
| Avena sativa L. | Echidna | 320.6 | 478.2 | 430.7 |
| A. sativa | Gairdner | 356.8 | 682.4 | 726.5 |
| Hordeum vulgare L. | Mannus | 229.7 | 474.5 | 493.2 |
| H. vulgare | Strzelecki | 341.7 | 742.5 | 807.4 |
| Triticum aestivum L. | Tobruk | 249.1 | 730.4 | 686.5 |
| T. aestivum | Urambie | 204.1 | 704.9 | 627.7 |
| × Triticosecale | Wedgetail | 226.6 | 782.9 | 664.5 |
| p value | 0.004 | |||
| l.s.d.(p<0.05) | 125.46 | |||
1 Wagga Wagga in 2008, Culcairn in 2009 and Temora in 2010.
Publisher’s Note: MDPI stays neutral with regard to jurisdictional claims in published maps and institutional affiliations. |
© 2021 by the authors. Licensee MDPI, Basel, Switzerland. This article is an open access article distributed under the terms and conditions of the Creative Commons Attribution (CC BY) license (https://creativecommons.org/licenses/by/4.0/).
Share and Cite
MDPI and ACS Style
Piltz, J.W.; Rodham, C.A.; Wilkins, J.F.; Hackney, B.F. A Comparison of Cereal and Cereal/Vetch Crops for Fodder Conservation. Agriculture 2021, 11, 459. https://0-doi-org.brum.beds.ac.uk/10.3390/agriculture11050459
AMA Style
Piltz JW, Rodham CA, Wilkins JF, Hackney BF. A Comparison of Cereal and Cereal/Vetch Crops for Fodder Conservation. Agriculture. 2021; 11(5):459. https://0-doi-org.brum.beds.ac.uk/10.3390/agriculture11050459
Chicago/Turabian StylePiltz, John W., Craig A. Rodham, John F. Wilkins, and Belinda F. Hackney. 2021. "A Comparison of Cereal and Cereal/Vetch Crops for Fodder Conservation" Agriculture 11, no. 5: 459. https://0-doi-org.brum.beds.ac.uk/10.3390/agriculture11050459
Note that from the first issue of 2016, this journal uses article numbers instead of page numbers. See further details here.