
Weed Densities in Perennial Flower Mixtures Cropped for Greater Arable Biodiversity


1
Group Crop Health, Faculty of Agriculture and Environmental Sciences, University Rostock, 18051 Rostock, Germany
2
Leibniz Centre for Agricultural Landscape Research (ZALF), 15374 Müncheberg, Germany
*
Author to whom correspondence should be addressed.
Agriculture 2021, 11(6), 501; https://0-doi-org.brum.beds.ac.uk/10.3390/agriculture11060501
Submission received: 8 April 2021
/
Revised: 11 May 2021
/
Accepted: 25 May 2021
/
Published: 28 May 2021
(This article belongs to the Special Issue Weeds in Diversified Cropping)
Abstract
:The cropping of perennial wildflower mixtures to produce biomass for use in biogas plants is one option for breaking maize’s dominance as a bioenergy feedstock. The aim of this study was to investigate the development of weeds in commercially produced perennial wildflower mixtures. Weed control during the establishment of perennial wildflower mixtures is very difficult to manage and raises the issue of the development of new weed problems when cropping perennial wildflower mixtures. In a three-year field experiment with staggered starts in four sites in northeast Germany, a perennial crop mixture was sown each year. The weeds and sown crops were surveyed annually in June. Plant densities and species numbers were counted and diversity indices calculated. Data were analysed using linear mixed models. Across all sites, weed density decreased significantly over the years of use (=cropping seasons), while weed species richness in the perennial mixture remained unchanged. The sown crop species richness significantly decreased, while the sown crop densities increased with cropping seasons. Weed density did not increase at any of the experimental sites. Although weed densities were high and crop establishment was poor in the first growing seasons, the perennial mix was able to suppress weeds in the following growing season. It was concluded that the cropping of perennial flower mixtures could contribute to biodiversity without causing new weed problems.
1. Introduction
The stated aim of the European Commission is to reduce greenhouse gas emissions by at least 40% compared with 1990 and increase the share of renewable energy to meet its obligations under the Paris Convention and create a fossil-free future. In Germany, the Renewable Energy Act (EEG) provides financial support for the development of the renewable energy sector in order to meet Germany’s climate protection targets. Bioenergy production has increased since the EEG came into force in 2000.
Maize is widely used as a biomass feedstock for bioenergy production. The area cropped with maize has increased over the past twenty years and led to landscape changes. In Germany, the cultivation area for maize for use in biogas plants is 2,720,500 hectares, more than double that in 2000. Maize cultivation often requires higher inputs of agrochemicals [1,2]. Owing to its possible negative effects on the environment, such as soil erosion, nitrate leaching, intensive use of pesticides and fertilisers and declining agrobiodiversity, more maize cropping or even monocropping is being debated throughout Europe [3,4]. It would appear that alternative crops for biogas production are needed to slow this trend for more maize.
The aim of German agricultural policy is to increase biodiversity, improve soil structure and reduce the use of agrochemicals. The negative environmental effects of maize cropping may be reduced by intercropping systems, perennial monoculture and perennial wildflower mixtures specially composed for biomass production. Perennial mixtures could produce biomass yields on marginal agricultural land and contribute to biodiversity protection and conservation [5,6]. Perennial wildflower mixtures are a way for farmers to meet their economic objectives while benefiting the ecology and environment of arable landscapes.
The economic benefits of perennial wildflower mixtures for farmers are due to their differences from annual cropping systems. In general, much less labour, material and management input are required for perennial mixtures than for maize [7,8]. A perennial mixture is cropped for up to five years: once it is sown and established, the mixture is cut annually at harvest and the vegetation regrows the following year. No further mechanical or chemical inputs are necessary, and only a low fertiliser application is recommended [9,10]. The year-round vegetation cover prevents soil erosion and leaching of nutrients and improves the soil’s biological activity [11,12,13,14,15].
The benefits for ecology and the environment of cropping perennial mixtures are due to the absence of certain farming activities on arable land, with less disturbance of biodiversity (plants and wildlife) and fewer fertilisers and pesticides applied [14,15]. With a heterogeneous vegetation structure, wildflower mixtures provide habitats that are scarce on farmland. Wildflower mixtures are therefore regarded as key measures in improving biodiversity [16,17]. The perennial mixtures contain a variety of species with different life cycles. Annual, biennial and perennial species mixed together are more diverse and promise different flowering periods, providing pollen, nectar and shelter for a wide range of flower-visiting insects such as honey bees [18,19,20,21,22,23,24]. The biomass yields of perennial mixtures depend on their species composition, and the establishment success at the location and in the particular year. Methane yields per hectare from perennial mixtures are around half that of maize [7,18,25].
Like maize, perennial wildflower species are slow in emergence and early growth (e.g., Inula helenium L., Verbascum thapsus L.), or their germination is delayed (e.g., Artemisia vulgaris L.) [18]. Therefore, crop competition is poor initially and highly likely to leave room for spontaneous plants (weeds) to colonise among the wildflower species. Weeds generally threaten crops by competing for space, water, nutrients and light, but they also contribute to the biodiversity of arable fields provided they do not overwhelm the crops [26]. Control methods to reduce weeds are hard to implement in perennial crops. Herbicides are not registered for use in perennial mixtures and probably never will be, because selectivity for many crop species is difficult to achieve. Mechanical control is very limited in dense perennial crops. Perennial weeds with deep root systems can present a major problem [27,28]. The fact that perennial wildflower crops can become a source of weed species for the cropping area and neighbouring land may reduce their acceptance by farmers.
In this study, a commercial perennial wildflower mixture was cropped in field experiments at four sites in northeast Germany characterised by sandy soils. The weed vegetation in the perennial wildflower mixture was investigated over three cropping seasons.
It was hypothesised that the cropping of perennial wildflower mixtures: (1) does not lead to greater weed density and (2) increases biodiversity on sandy sites.
2. Materials and Methods
The field trials were established at four sites in two regions in northeast Germany: two sites in the state of Mecklenburg-Western and two in the state of Brandenburg. At the Mecklenburg-Western Pomeranian sites of Rostock (R) and Malchow (M), the experiments ran from 2014 to 2016, while at the Brandenburg sites of Dedelow (D) and Müncheberg (Z), they ran from 2015 to 2017. The agricultural conditions are representative of large parts of northern continental Europe. The geomorphology of all the experimental sites contains deposits from ice ages and post-glacial processes. The climatic conditions of the experimental sites are characterised by a transition between maritime and continental climates. All the sites are typical of climate conditions where there are low levels of precipitation. Information about the field conditions is given in Table 1.
At each site, a field experiment with a staggered start was set up in a completely randomised block design with two experimental factors and four replicates. Six treatments resulted from the experimental factors. At each site, the factor “sowing year” had three levels, referred to by the year in which the perennial mixture was sown (Table 2). The second factor, “seed rate”, was treated in two levels: sowing either at the recommended rate of 10 kg/ha or at a reduced rate of 6.7 kg/ha. The reduced seed rate was intended to simulate the poor establishment of the perennial mixture.
In the first experimental year (2014 in R and M; 2015 in D and Z, Table 2), at the beginning of May, the two seed rates of the perennial mixture were sown in two treatments. The plots not carrying the perennial mixture in the first and second experimental years were sown with rye as an interim crop to prevent weed growth. In the second experimental year, the perennial mixture was sown at the two seed rates in two new treatments. The perennial mixture sown in the first experimental year was in the second year of use (=second cropping season), and the newly sown perennial mixture was in the first year of use (=first cropping season). In the third experimental year, two new treatments were sown at the two seed rates. In the third experimental year, all the plots carried the perennial mixture. Treatments in the first, second and third cropping seasons of perennial mixtures were now growing side by side in the experimental field (Table 2).
The design of the experiments allowed a comparison of weed densities in the treatments in the two set-ups, i.e., a comparison of the same plots in three consecutive cropping seasons and those of different plots in different cropping seasons in the same year (last experimental year). In the first set-up, weed densities were counted on the same plots in the three cropping seasons. As these plots stayed the same over time, this set-up is referred to as same plots/different years (Table 2). In the second set-up, weed densities in three cropping seasons of the perennial wildflower mixture were also monitored but were all investigated in the same year (third experimental year). Thanks to the perennial mixtures being sown year after year, the mixtures sown in the first, second and third cropping seasons were growing side by side in the third experimental year. As these plots were different but the year was the same, this set-up is referred to as different plots/same year (Table 2).
The perennial wildflower mixture “BG 70” [29] was sown in all treatments. Produced and sold by the seed breeding company Saaten Zeller GmbH & Co. KG (Eichenbühl-Guggenberg, Germany), it contains 23 species, including annual, biennial and perennial plant species that have been specially compiled to produce biomass for use in biogas plants (Table 3). The perennial mixture was hand-sown with soy meal or sand to improve seed dispersal. In the autumn, the grown biomass of the perennial mixture was cut and removed from the field.
Plant surveys were conducted annually in June. A distinction was made between sown species, i.e., “crops” from the perennial mixture, and unsown species, i.e., “weeds”. Species and plants per species were counted in four sample quadrats (50 cm × 50 cm) per plot. Where possible, plants were identified at the species level and otherwise at the genus level. The sample quadrats were located with high-precision GPS so that the same areas were always evaluated.
The data from the sample quadrats per plot and year were pooled and diversity indices calculated for one square metre. The diversity was quantified as: (i) total plant density per square metre, (ii) species richness per square metre, (iii) evenness (Shannon’s E) as a measure of equitability, (iv) Shannon index (Shannon’s H) as a measure of species diversity and (v) inverse Berger-Parker dominance index (BPH) as a dominance measure. The higher the BPH index value, the less the most dominant weed species is represented in the total density. More than one species must grow in each plot to calculate Shannon’s E accurately; therefore, all plots with fewer than two plant species were excluded from the analyses. This step caused different sample sizes for weed species and crop species. The cleaned dataset was used for the linear mixed-effects model and the original dataset was used for the boxplots. The data were tested for homogeneity of variance using Levene’s test and tested for normal distribution. The plant density data were square-root-transformed. Due to the staggered start, the sample sizes of the cropping seasons varied. The first cropping season had the largest sample size (n = 96), while the second cropping seasons gave a sample size of n = 64 and the third cropping season a sample size of n = 32.
All statistical analyses were performed in R [30]. Differences in calculated diversity indices between cropping seasons for weeds and crops separately were analysed. A linear mixed effects model was fitted and analysed by ANOVA using Satterthwaite’s method. The full model contained the fixed effects of cropping season (factor level: first, second and third cropping season) and seed rate (factor level: 10 kg/ha and 6.7 kg/ha) and their interaction, and the random factors were the experimental year in which the surveys were carried out (2014–2017) and the block within the plot nested in the site. For linear mixed-effects models, the package ‘lme4’ was used [31]. The ’lmer’ functions from the package ’lme4’ were able to deal with unbalanced designs. Post-hoc pairwise comparisons with Tukey adjustments were performed with a significance level of p < 0.05 using R package ‘emmeans’ [32].
3. Results
3.1. Weed Species
A total of 96 weed species were identified during the three experimental years, including 90 weed species and six weed genera. The species showed considerable regional differences in their frequencies. Of the weed species, 63 were located in R, 61 in M, 36 in D, and 39 in Z (Table A1). The majority of the weed species in the first cropping season across all sites were annual weed species (60%), a few were biennial (10%) and the rest were perennial (30%). Short-lived species decreased from the first cropping season to the third cropping season (Arabidopsis thaliana Heynh., Chenopodium album L., Amaranthus retroflexus L.). The percentage of annual species became smaller and the percentage of perennial species greater in subsequent cropping seasons. In the third cropping season, about 50% of the recorded weed species were perennials, with grass species occurring in higher densities (Anthoxanthum odoratum L., Apera spica-venti Beauv., Poa annua L.). Chenopodium album was the most dominant species at all sites in the first cropping season. In the second cropping season, the density of C. album decreased, while it increased for Erigeron canadensis and Veronica persica.
3.2. Weed Density and Diversity
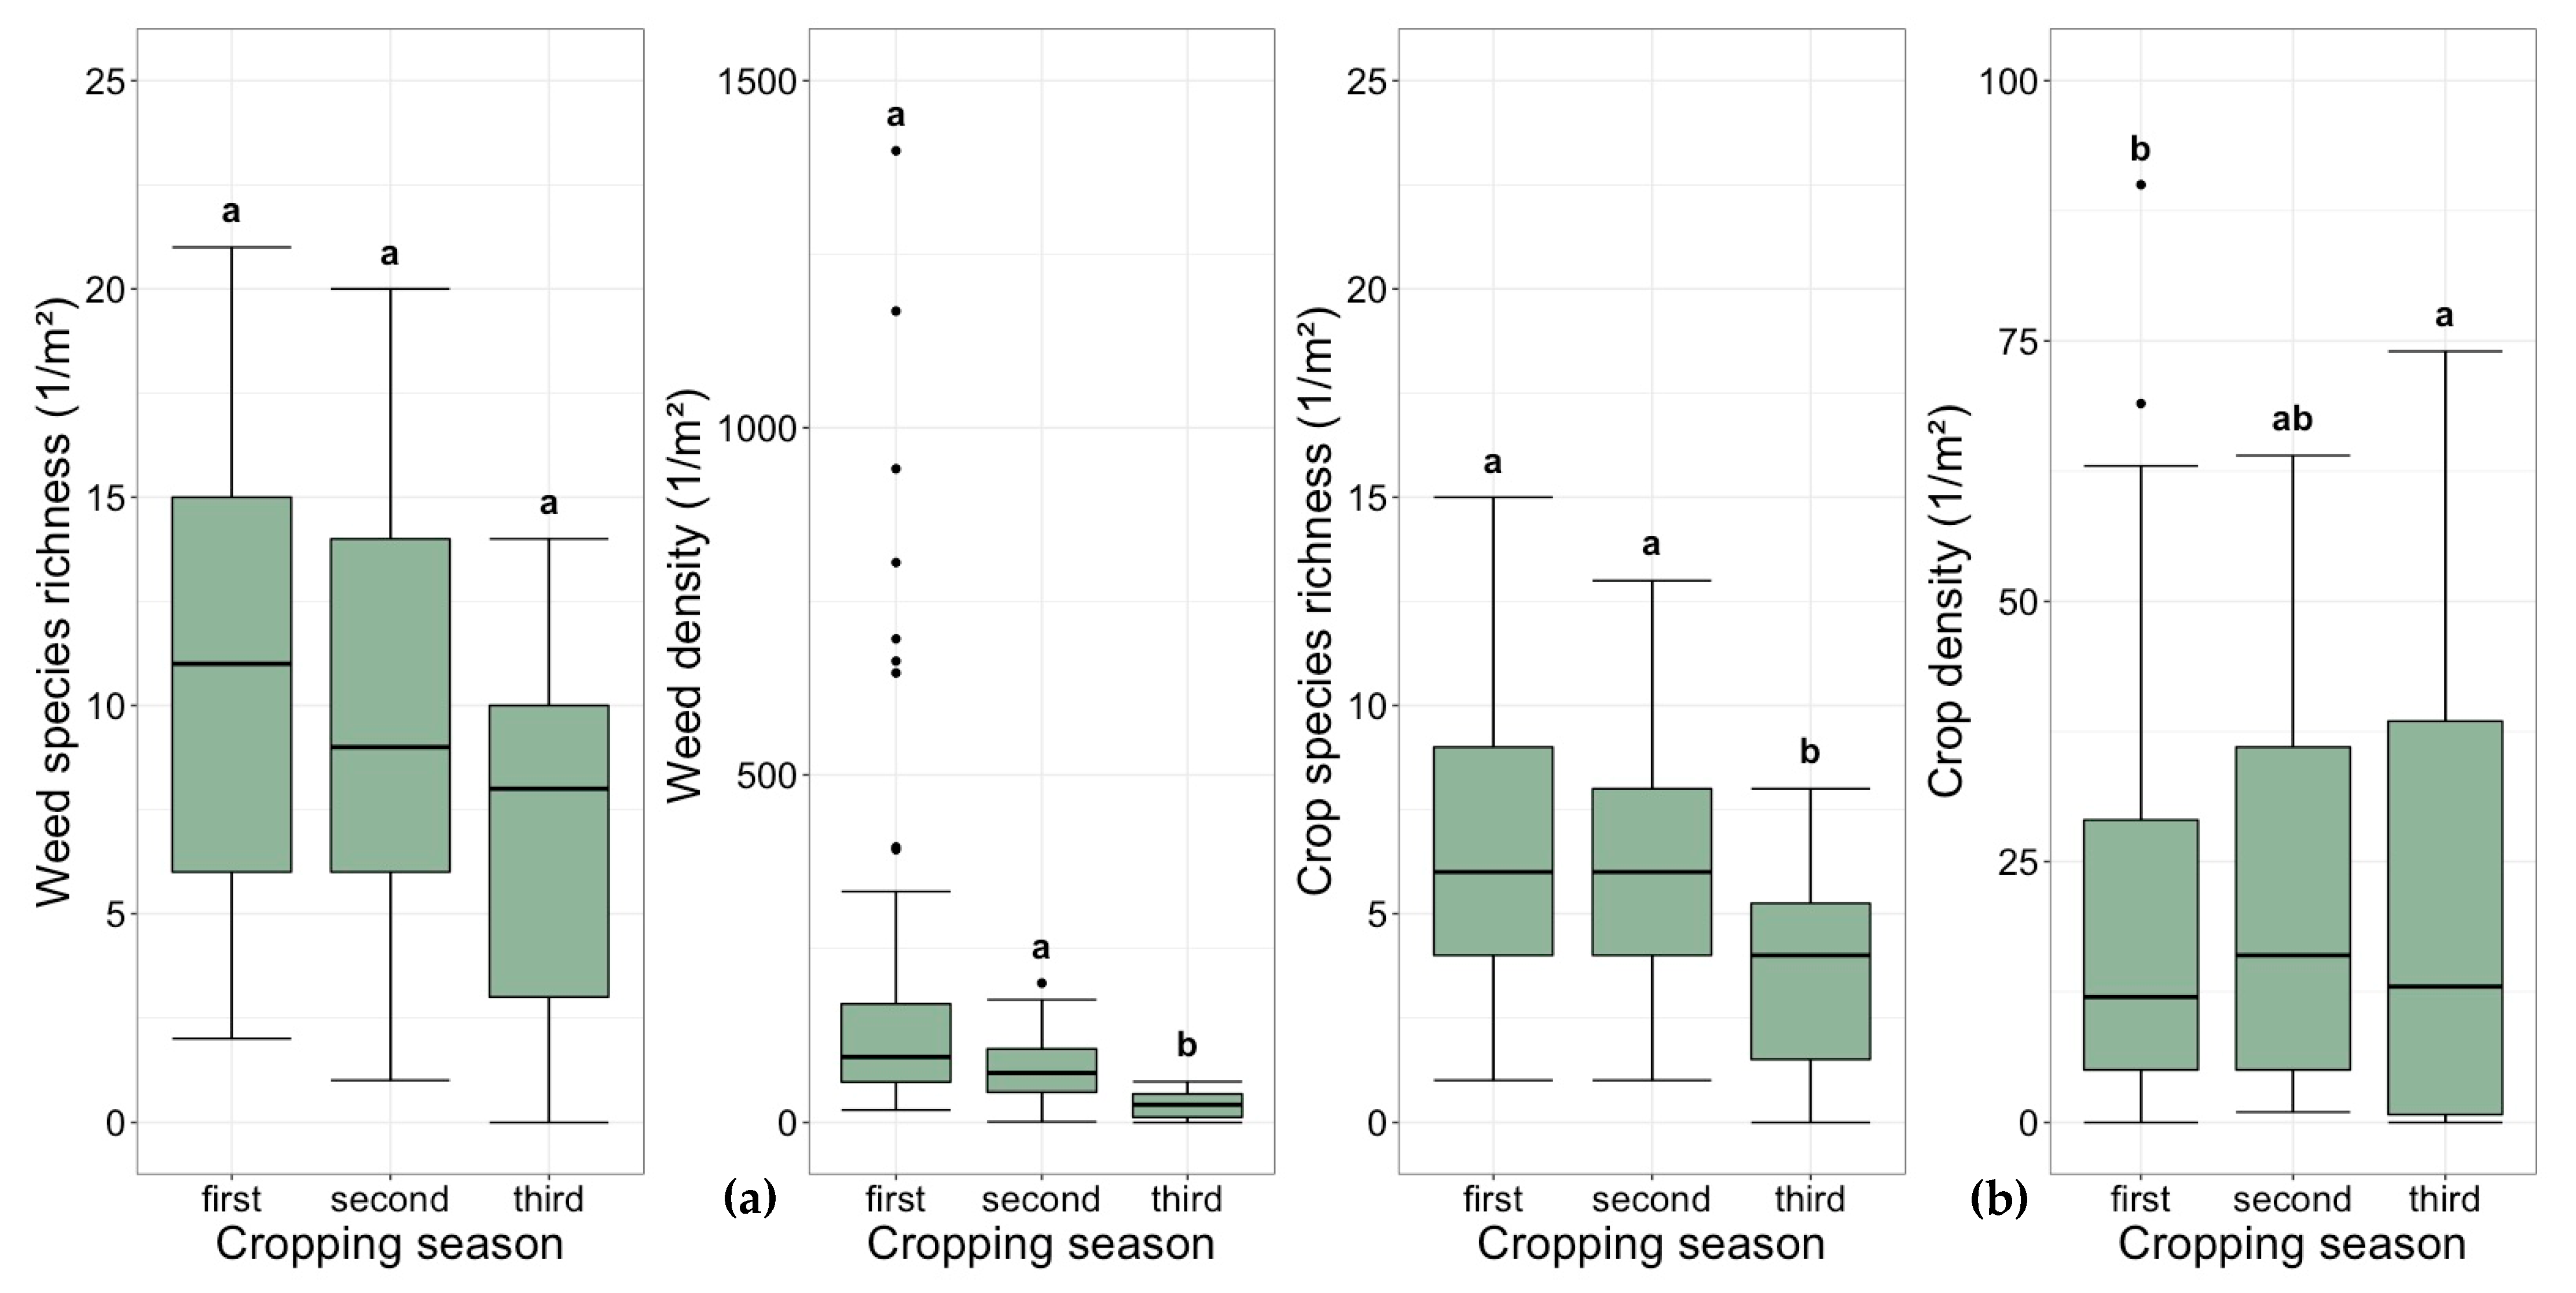
The weed density and diversity indices varied significantly between cropping seasons (Table 4). The weed density halved with each cropping season (Figure 1). The values of the diversity indices increased by cropping season (Table 5). Although the weed species’ richness decreased over the three seasons (Figure 1), the effect was not significant (Table 4). The factor seed rate did not influence weed density, weed species richness or diversity indices (Table 4). Although the weed species richness remained constant, Shannon’s H index changed significantly. The high Shannon’s H index in the third cropping season was not due to a high weed species richness, but rather due to the equal distribution of the weed species (Table 5). In the first and second cropping seasons, the Shannon’s E value ranged from 0.5 to 0.6, indicating that the individual number of weed species was unequally distributed. The value of the BPH index increased with the cropping seasons. In the first cropping season, one weed species (C. album) made up about 50% of the total weed density, whereas in the third cropping season, one weed species (A. spica-venti) made up just 33% of the total weed density.
3.3. Crop Density and Diversity
The variance analyses in the linear mixed effects model showed that the factor cropping season affected crop density, crop species richness and Shannon’s H. The factor seed rate only affected crop density (Table 4). The crop density increased with each cropping season (Figure 1) and was higher in the treatments with the recommended seed rate. The model revealed a significant influence of cropping season on crop species richness (Table 4). In the third cropping season, the perennial mixture had significantly fewer species than in the first and second cropping seasons (Figure 1). At site D, no crops were established in the third cropping season. During the field experiment, an average of five crop species was established and three of the crop species dominated across all years and sites (Tanacetum vulgare, Artemisia vulgaris and Centaurea nigra). Shannon’s H, Shannon’s E and BPH diversity indices did not differ significantly between cropping seasons, although there was a tendency for smaller values in the third cropping season (Table 5).
3.4. Three-Year Weed Densities in the Two Set-Ups
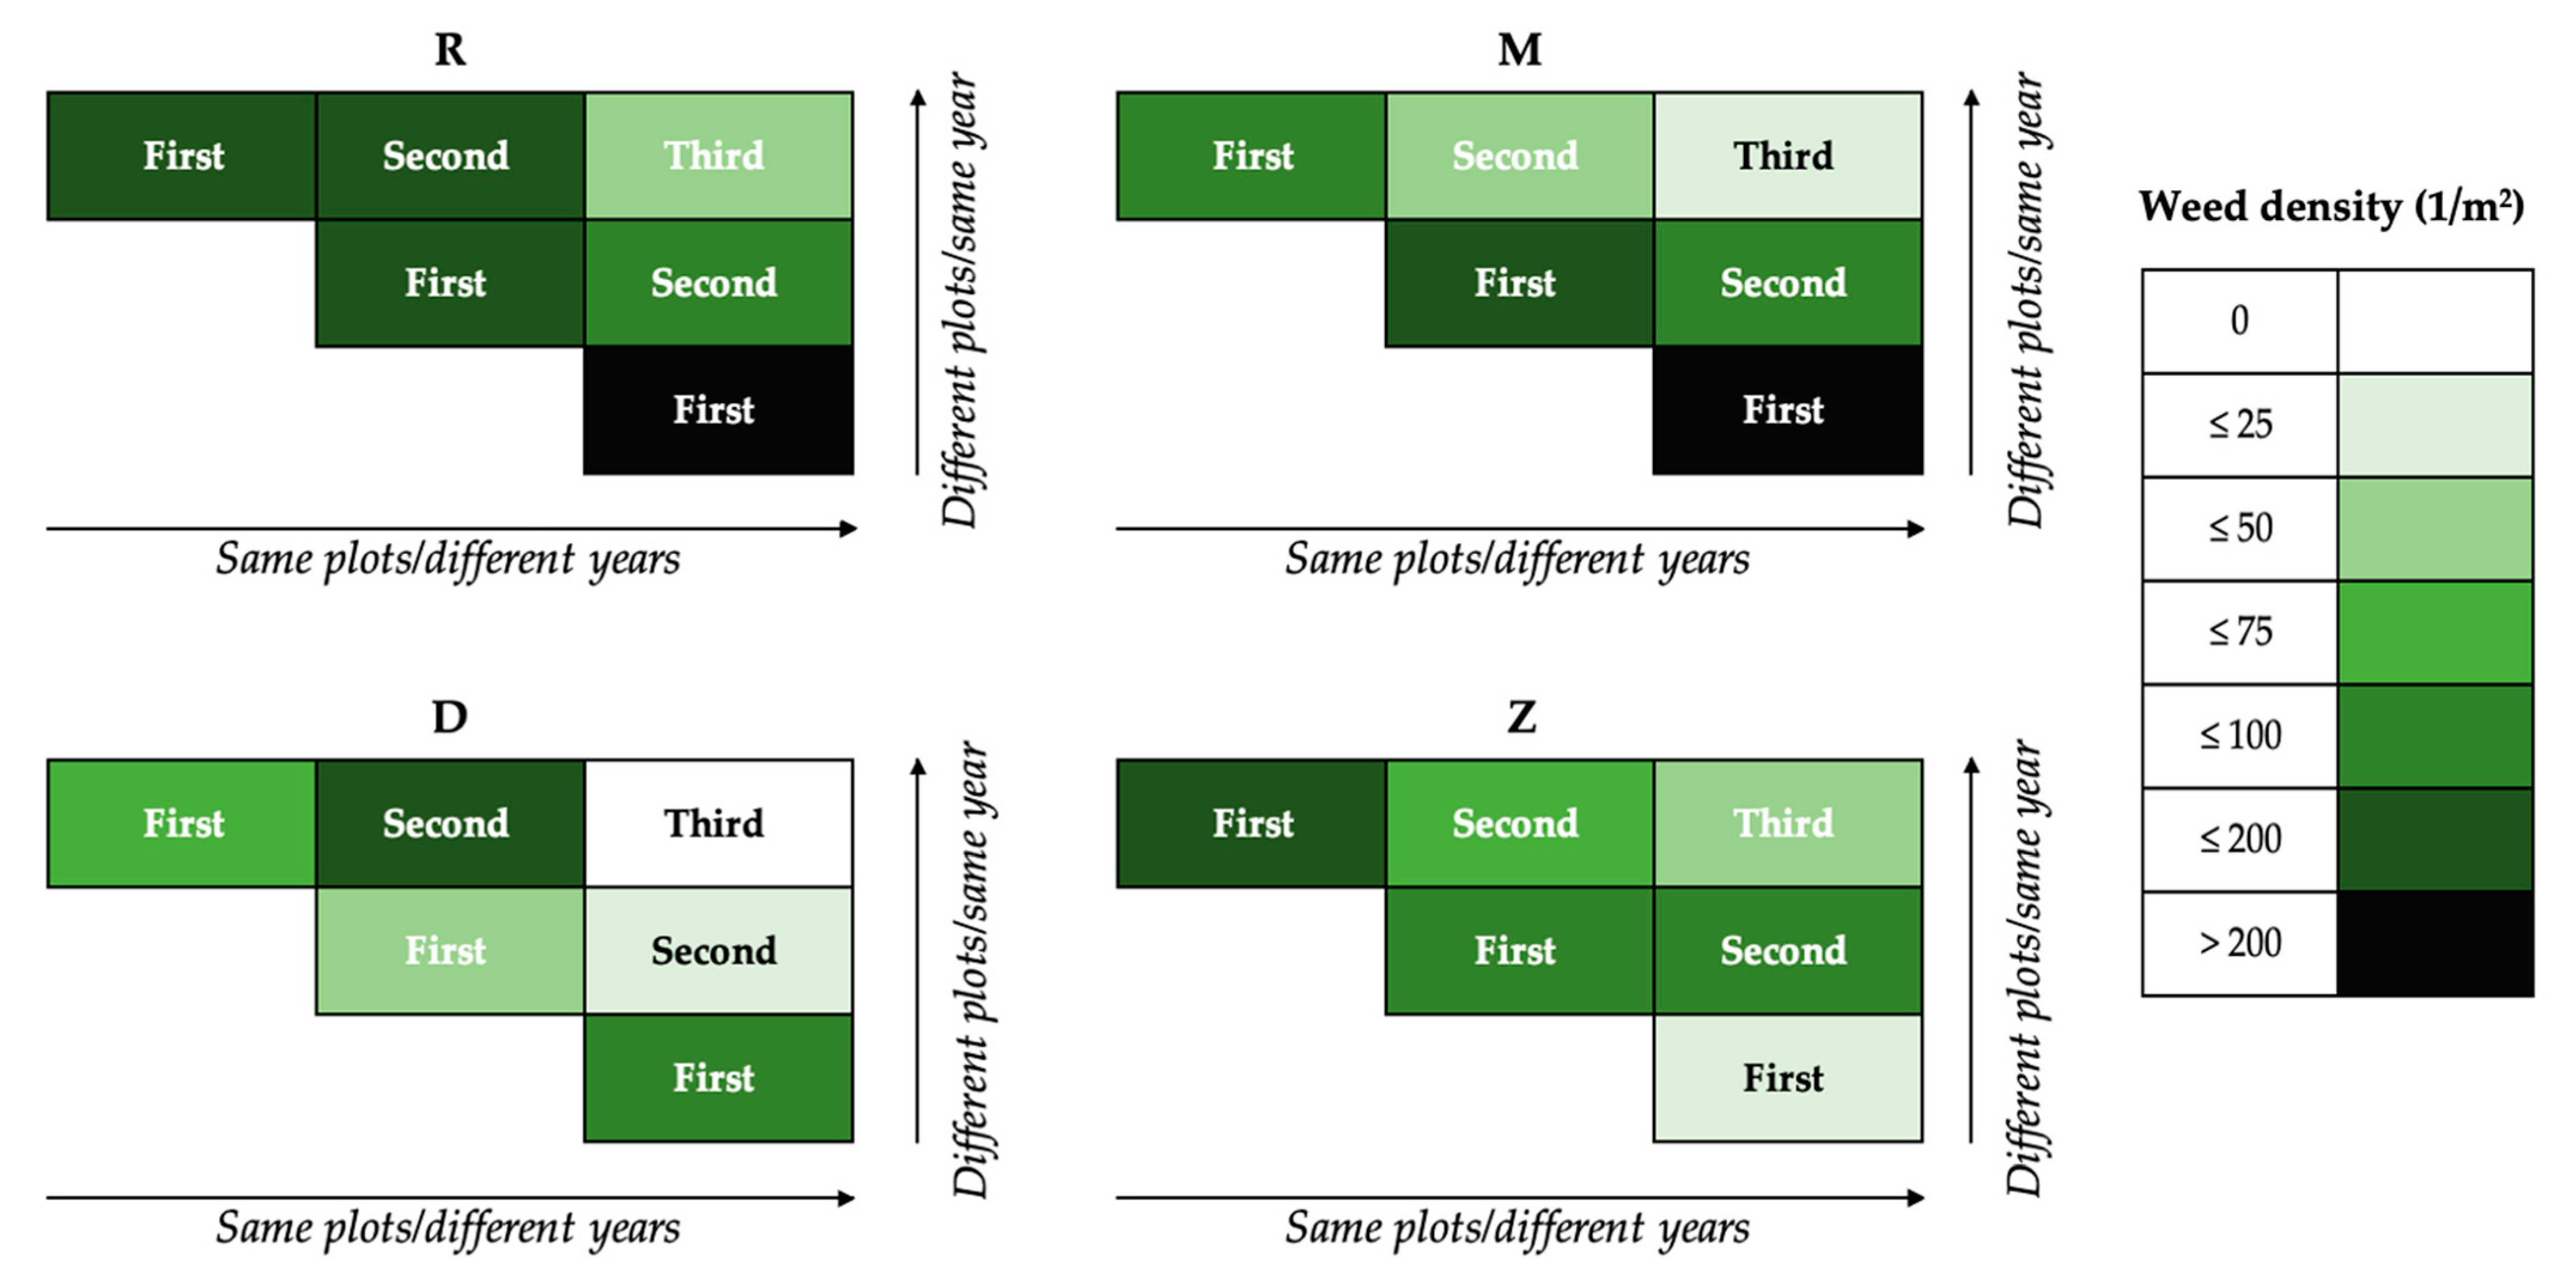
The weed density development at each experimental site in the two set-ups is shown in Figure 2. The intensity of the colour decreases for all sites in two directions: from left to right (same plots/different years) and from bottom to top (different plots/same year). In the same plots/different years set-up, weed densities decreased over the three cropping seasons. The weed densities in the first cropping season were highest at all sites. In the second cropping season, the weed density decreased and was lowest in the third cropping season. In the different plots/same year set-up, weed densities were highest in the first cropping season at three sites (R, M, D), lower in the second cropping season and lower again in the third cropping season. As an exception, weed densities were lowest in the first season at site Z. Both set-ups indicated that weed density decreased as the age of the perennial mixture increased.
4. Discussion
This study investigated the performance of a commercially available perennial wildflower mixture for its interaction with spontaneously occurring weeds during three seasons of cropping at two seed rates. Compared with the traditional practice of cultivating a single crop, a perennial flower mixture in principle increases biodiversity by adding multiple crop species into the system. Of the 23 species in the mixture, an average of only five emerged in the experimental period, raising questions about the suitability of the given mixture on sandy soils in northeast Germany.
The perennial mixture did not establish the expected crop densities either. At sites R and M, the species richness and plant densities of the crops were higher than at sites D and Z. One reason for the low crop densities could be the loss of seeds before emergence. Manual sowing placed the seeds on the soil surface. Seed-predating arthropods such as carabids, mammals such as rodents and birds may have predated some seeds from the surface. Moreover, if the crop seeds did not germinate and anchor with the radicle immediately due to dry weather conditions, strong winds may have blown some of these seeds away from the topsoil. Dry conditions after sowing are detrimental to proliferation; therefore, sowing should be avoided in periods of drought, either forecasted or based on experience. In experiments on the same land as D and Z in the present study, Redwitz et al. [5] introduced a complex method for establishing perennial crop mixtures by sowing the wildflower mixture in autumn with a frost-sensitive cover crop. Initiating species-rich permanent vegetation cover by sowing species mixtures on sandy soil is also problematic in the restoration of dry grasslands. According to Plückers et al. [33], abiotic microsite factors limit the number of species successfully establishing from a seed mixture.
In the first cropping season of the perennial mixture, different crop species germinated and performed better than the majority, specifically the sown perennial crop species A. vulgaris, C. nigra and T. vulgare. From the second cropping season onwards, these were the most dominant crop species across all sites and years. While conducting the plant surveys, it was apparent that these crop species produced a large biomass and covered most of the soil. Schmidt [34] and Von Cossel [25] report similar observations on competition between species in perennial mixtures. The crop species were competing and hampering each other’s establishment and growth. The competition limited the emergence and early growth not only of weeds but of the crops as well. The interspecific competition in the perennial mixture decreased the number of crop species. Shannon’s H illustrated that the perennial mixture was less diverse in the third cropping season. Some studies recommend reducing the number of species in the mixture to the benefit of the best performing ones [7,25,35]. The authors report that cropping these mixtures with a smaller number of wildflower species contributes to the ecological and economic goals being met just as effectively as the original mixture of 23 species. Meanwhile, the performance of T. vulgare has encouraged breeding companies to breed this species in order to optimise the biomass yield for fermentation in biogas plants.
The plots sown at the recommended seed rate had higher crop densities, but the factor seed rate did not affect the number of the weed species or weed density. Thus, even a lower seed rate or a poorly developed perennial wildflower crop did not lead to higher weed infestations in these experiments.
Clear differences in weed species richness were found between the two regions. In Mecklenburg (R and M), more than twice the number of weed species were recorded than was the case in Brandenburg (D and Z). However, neither weed species richness nor weed density increased over the cropping seasons in either region. The majority of the recorded weeds emerged from the seed bank, which provided a stable weed species richness.
The number of seeds in a field’s soil seed bank determine both weed species richness and weed densities. The most common weed species in this study was C. album, an annual weed that grows very fast and tall, producing a large number of seeds that accumulate in the soil seed bank and is the most widely distributed annual weed in maize fields [36,37,38]. During the complete first cropping season, seedlings of this species developed with a high weed density. In the following year, C. album was established in much lower densities. The absence of soil tillage and a single cut per year in all treatments in these experiments were to the detriment of annual weeds. The seeds are not incorporated into the soil and seed predation can effectively reduce the number of weed seeds entering the soil seed bank [39,40]. The surface, which was open in the first cropping season, was now covered by perennial crops and vegetative re-growing weeds. Soil covered with vegetation hinders the emergence of new seedlings and reduces weeds potentially growing in subsequent cropping seasons [41]. In Mecklenburg-Western Pomerania (R and M), in addition to Elymus repens the grass species A. odorantum, A. spica-venti and P. annua were observed crowding between the crops of the perennial mixture. These small grass species were able to slide and grow in gaps or even between the perennial mixtures. Froud-Williams [42] found the same capability of these species in experiments. This may be why perennials and grass species were recorded in higher densities in the third cropping season.
However, despite the occurrence of creeping perennial weeds at the sandy soil sites in all years, the observed densities did not present a threat to subsequent uses after three years of cropping. Brandsæter et al. [43] found that after the perennial cropping period, small to medium infestations of creeping perennials can be managed with stubble cultivation and ploughing in spring without additional chemical control.
A multi-species mixture of plants cropped for perennial use will never establish unique crop stands like traditional crops, e.g., maize or wheat. Instead, a certain spatial and temporal divergence in species and their densities is to be expected. Despite their contribution to biodiversity in arable fields, weed populations should not gain predominance in any crop stand. In this respect, it is promising that the weed densities in the three cropping seasons assessed in the same plots/different years and different plots/same year set-ups largely followed the same trend. The same trend of a decrease in weed density with the duration of cropping was seen at the two sites R and M, which had more weeds overall. At the two Brandenburg sites of D and Z, which had far fewer weed species, the densities fell from the first to the third year, although not continuously in both set-ups. The findings from all four experimental sites demonstrated overall that there was no increase in weed density. Moreover, they indicated no additional risk of weeds arising from the immanent local variation in the diverse crop stands of a multiple-species mixture.
The hypotheses of this study were therefore confirmed. Cropping of the perennial crop mixture did not lead to the problematic development of weeds over the three experimental years, and it could help improve the biodiversity of agricultural landscapes and thus compensate for the negative effects of maize cropping. The combination of sandy soils and low precipitation in northeast Germany was challenging for the perennial wildflower mixture, which demonstrated its robustness.
These results highlight the usefulness of developing a perennial mixture suitable for sandy soils. A mixture of 23 species provides buffers for various environmental conditions, ensuring robustness for cropping on different sites. There should be no expectation of all species emerging on all sites, but some of the 23 species will be able to cope with local environmental conditions. This reinforces having a mixture of several species that are suitable for different conditions. This is not undermined by the complete absence of plants at site D in the third cropping season; as no weeds grew there either, the site was evidently too dry for any plant growth that season. However, improved adaptation of the perennial crop species mixture to the poor conditions of sandy soils and a dry climate would optimise their establishment and biomass production. This wildflower mixture adapted to local conditions could have a greater impact on biodiversity and weed suppression; therefore, preference should be given to fewer, better-performing crop species than a large number of species in the mixture. However, there are two consequences that favour multi-species mixtures: with respect to the small market for perennial flower crops, different mixtures adapted to specific conditions would represent a financial challenge to seed providers and economic pressure would result in a few top-performing species being selected, thus reducing the contribution made to biodiversity.
Author Contributions
Conceptualization, L.T., F.d.M., M.G., and B.G.; methodology, L.T.; Formal analysis, L.T.; Methodology, L.T., F.d.M.; Supervision, F.d.M. and B.G.; Visualization, L.T. and F.d.M.; Writing—original draft, L.T.; Writing—review & editing, F.d.M., M.G., and B.G. All authors have read and agreed to the published version of the manuscript.
Funding
The experiments were financially supported by the Federal Ministry of Food and Agriculture of Germany (BMEL) via the “Fachagentur für Nachwachsende Rohstoffe e.V. (FNR)”, grant number (FKZ) 22401114. The work of Laura Tamms is funded by a Postgraduate Scholarship Programme of the German State of Mecklenburg-Western Pomerania.
Institutional Review Board Statement
Not applicable.
Informed Consent Statement
Not applicable.
Data Availability Statement
Data is available on request.
Acknowledgments
The authors thank Ingolf Gliege, Ines Heyer, Maren Knipping, Rosa Minderlen and Christoph v. Redwitz from the University of Rostock’s Faculty of Agriculture and Environmental Sciences for carefully conducting the field experiments at Rostock and their support while conducting the plant surveys. We thank Dietmar Barkusky, Müncheberg and Gernot Verch, Dedelow from the Leibniz Centre for Agricultural Landscape Research (ZALF) for carefully conducting the field experiments. We thank Evelin Willner and the staff of the experimental station at Malchow/Poel from the Leibnitz Institute of Plant Genetics and Crop Plant Research (IPK) for carefully conducting the field experiments at Malchow.
Conflicts of Interest
The authors declare no conflict of interest.
Appendix A

Table A1.
Weed species recorded at each site during the cropping seasons. Weed species that grew on the site that cropping season are labelled with Rostock (R), Malchow (M), Dedelow (D) and Müncheberg (Z).
Table A1.
Weed species recorded at each site during the cropping seasons. Weed species that grew on the site that cropping season are labelled with Rostock (R), Malchow (M), Dedelow (D) and Müncheberg (Z).
| Weed Species | First Cropping Season | Second Cropping Season | Third Cropping Season |
|---|---|---|---|
| Achillea millefolium L. | Z | R, Z | Z |
| Agrostis stolonifera L. | M | M | M |
| Amaranthus retroflexus L. | D, Z | Z | |
| Anagallis arvensis L. | M | R | |
| Anchusa arvensis M. Bieb. | M, R, D | ||
| Anthemis arvensis L. | R | ||
| Anthoxanthum odoratum | R | R, Z | R, Z |
| Apera spica-venti Beauv. | R | R, D, Z | Z |
| Aphanes arvensis L. | M, R | R, D | |
| Arabidopsis thaliana Heynh. | M, R | M, R | M, R |
| Arenaria serpyllifolia L. | M | M, Z | M, Z |
| Borago officinalis L. | R | ||
| Brassica napus L. | R, D | M | |
| Brassica nigra W. D. J. Koch | D | ||
| Bromus hordeaceus L. | D | ||
| Capsella bursa-pastoris Medik. | R, D, Z | R, Z | |
| Centaurea cyanus L. | R | M, R, Z | |
| Cerastium arvense L. | R, M | M, R | M, R |
| Cereale ssp. | M, R | R | M |
| Chenopodium album L. | M, R, D, Z | M, R, D, Z | R |
| Cirsium arvense Scop. | M, R, D, Z | M, R | M, R |
| Crepis biennis L. | R | R, Z | |
| Crepis tectorum L. | Z | Z | Z |
| Echinochloa crus-galli P. Beauv. | D, Z | D, Z | |
| Elymus repens Gould | R, D, Z | R, D, Z | R, Z |
| Epilobium parviflorum Schreb. | R | M | M |
| Erigeron canadensis L. | M, D | M, D, Z | M, Z |
| Erophila verna Besser | R | ||
| Euphorbia helioscopia L. | M | ||
| Fallopia convolvulus A. Löve | M, R, D, Z | M, R, D, Z | Z |
| Festuca rubra L. | M, R | ||
| Fumaria officinalis L. | M | M | |
| Galinsoga ssp. | M, R | M | |
| Galium aparine L. | M | M | |
| Geranium pusillum L. | R, D | D, Z | |
| Glechoma hederacea L. | M | ||
| Gnaphalium uliginosum L. | M, R, D | ||
| Hieracium ssp. | R | R, Z | |
| Holcus lanatus L. | M | M, R | M, R |
| Hypericum perforatum L. | M, R | M | |
| Hypochaeris glabra L. | D, Z | ||
| Hypochaeris radicata L. | R | R, Z | R, Z |
| Lactuca serriola L. | M | M, R | M, Z |
| Lamium amplexicaule L. | M, R, D | M | |
| Lamium purpureum L. | M, R | M, R | M |
| Leontodon autumnalis L. | Z | ||
| Lolium perenne L. | R | ||
| Lotus corniculatus L. | R | ||
| Lupinus ssp. | M | M | |
| Matricaria chamomilla L. | R | R, D | R |
| Matricaria discoidea DC. | D | D | |
| Matricaria inodora L. | D, Z | D, Z | Z |
| Medicago lupulina L. | M, R | M, R, Z | R |
| Myosotis sylvatica Ehrh. ex Hoffm. | R | M | |
| Oenothera biennis L. | R, D | Z | Z |
| Papaver rhoeas L. | M, R | M, R, Z | Z |
| Persicaria maculosa Gray | M, R, D | ||
| Plantago lanceolata L. | M, R | M, R | M, R |
| Plantago major L. | M, R, D | M, R, D | |
| Plantago media L. | D | ||
| Poa annua L. | M, R, D | M, R, D | M, R |
| Poa trivialis L. | R, M | M, R, Z | M, R |
| Polygonum aviculare L. | M, R, D, Z | M, D, Z | |
| Polygonum lapathifolium L. | M, R | M, R | |
| Ranunculus repens L. | M | ||
| Rorippa sylvestris Besser | M | ||
| Rumex acetosa L. | M, R, Z | R, Z | R, Z |
| Rumex acetosella L. | Z | Z | |
| Rumex crispus L. | M | M, R, Z | M, R |
| Rumex obtusifolius L. | M, R | M, Z | |
| Secale cereale L. | R | Z | |
| Senecio vulgaris L. | M | M | |
| Setaria viridis P. Beauv. | Z | Z | |
| Sinapis arvensis L. | M | ||
| Sisymbrium officinale Scop. | M | ||
| Solanum nigrum L. | M | ||
| Solidago canadensis L. | Z | Z | |
| Sonchus arvensis L. | M, R | R | |
| Spergula arvensis L. | M, R, D | M, D, Z | |
| Stellaria media Vill. | M, R, D, Z | M, R, Z | M, R |
| Taraxacum officinale F. H. Wigg. | M, R, D, Z | M, R, D, Z | M, R, D |
| Thlaspi arvense L. | M, D, Z | M | |
| Tordylium officinale Reichb. | D | ||
| Trifolium ssp. | M, R, D, Z | M, R, D, Z | M, R, D, Z |
| Urtica dioica L. | M | M | M |
| Veronica arvensis L. | M, R, D | M | M |
| Veronica hederifolia L. | M, R | M, R | R |
| Veronica persica Poir. | M, R | M, R | R |
| Vicia ssp. | M, R, D, Z | M, R, D, Z | M, R, Z |
| Viola arvensis Murray | M, R, D, Z | M, R, D, Z | R |
References
- Lüker-Jans, N.; Simmering, D.; Otte, A. The impact of biogas plants on regional dynamics of permanent grassland and maize area—The example of Hesse, Germany (2005–2010). Agric. Ecosyst. Environ. 2017, 241, 24–38. [Google Scholar] [CrossRef]
- German Maize Committee. Fakten—Statistik—Deutschland-Maisanbauflächen in Deutschland. Available online: https://www.maiskomitee.de/fakten.aspx/statistik/deutschland (accessed on 9 December 2020).
- Meissle, M.; Mouron, P.; Musa, T.; Bigler, F.; Pons, X.; Vasileiadis, V.P.; Otto, S.; Antichi, D.; Kiss, J.; Pálinkás, Z.; et al. Pests, pesticide use and alternative options in European maize production: Current status and future prospects. J. Appl. Entomol. 2010, 134, 357–375. [Google Scholar] [CrossRef]
- Pedroli, B.; Elbersen, B.; Frederiksen, P.; Grandin, U.; Heikkilä, R.; Krogh, P.H.; Izakovičová, Z.; Johansen, A.; Meiresonne, L.; Spijker, J. Is energy cropping in Europe compatible with biodiversity?—Opportunities and threats to biodiversity from land-based production of biomass for bioenergy purposes. Biomass Bioenergy 2010, 55, 73–86. [Google Scholar] [CrossRef]
- von Redwitz, C.; Glemnitz, M.; Hoffmann, J.; Brose, R.; Verch, G.; Barkusky, D.; Bellingrath-Kimura, S. Microsegregation in maize cropping—A chance to improve farmland biodiversity. Gesunde Pflanz. 2019, 71, 87–102. [Google Scholar] [CrossRef]
- Kiesel, A.; Wagner, M.; Lewandowski, I. Environmental performance of Miscanthus, switchgrass and maize: Can C4 perenni-als increase the sustainability of biogas production? Sustainability 2017, 9, 5. [Google Scholar] [CrossRef] [Green Version]
- Von Cossel, M.; Lewandowski, I. Perennial wild plant mixtures for biomass production: Impact of species composition dynamics on yield performance over a five-year cultivation period in southwest Germany. Eur. J. Agron. 2016, 79, 74–89. [Google Scholar] [CrossRef]
- Lewandowski, I. The role of perennial biomass crops in a growing bioeconomy. In Perennial Biomass Crops for a Resource-con-Strained World; Barth, S., Murphy-Bokern, D., Kalinina, O., Taylor, G., Jones, M., Eds.; Springer: Cham, Switzerland, 2016; Volume 319, pp. 3–13. [Google Scholar]
- Börjesson, P. Environmental effects of energy crop cultivation in Swedend: Identification and quantification. Biomass Bioenergy 1999, 16, 137–154. [Google Scholar] [CrossRef]
- Netzwerk Lebensraum Feldflur. Energie aus Wildpflanzen Praxisempfehlung für den Anbau von Wildpflanzen zur Biomasseproduktion. Available online: https://www.saaten-zeller.de/rel/images/biogas/praxisratgeber_wildpflanzen_energie.pdf (accessed on 1 April 2021).
- Emmerling, C. Impact of land-use change towards perennial energy crops on earthworm population. Appl. Soil Ecol. 2014, 84, 12–15. [Google Scholar] [CrossRef]
- Emmerling, C.; Schmidt, A.; Ruf, T.; von Francken-Welz, H.; Thielen, S. Impact of newly introduced perennial bioenergy crops on soil quality parameters at three different locations in W-Germany. J. Plant. Nutr. Soil Sci. 2017, 180, 759–767. [Google Scholar] [CrossRef]
- Zhang, Y.; Li, Y.; Jiang, L.; Tain, C.; Li, J.; Xiao, Z. Potential of perennial crops on environmental sustainability of agriculture. Procedia Environ. Sci. 2011, 10, 1141–1147. [Google Scholar] [CrossRef] [Green Version]
- Haughton, A.J.; Bohan, D.A.; Clark, S.J.; Mallott, M.D.; Mallot, V.; Sage, R.; Karp, A. Dedicated biomass crops can enhance biodiversity in the arable landscape. GCB Bioenergy 2016, 8, 1071–1081. [Google Scholar] [CrossRef] [PubMed] [Green Version]
- Werling, B.P.; Dickson, T.L.; Isaacs, R.; Gaines, H.; Gratton, C.; Gross, K.L.; Liere, H.; Malmstrom, C.M.; Meehan, T.D.; Ruan, L.; et al. Perennial grasslands enhance biodiversity and multiple ecosystem services in bioenergy landscapes. Proc. Natl. Acad. Sci. USA 2014, 111, 1652–1657. [Google Scholar] [CrossRef] [PubMed] [Green Version]
- Benton, T.G.; Vickery, J.A.; Wilson, J.D. Farmland biodiversity: Is habitat heterogeneity the key? Trends Ecol. Evol. 2003, 18, 182–188. [Google Scholar] [CrossRef]
- Wagner, C.; Schmidt, C. Blühflächen erhöhen die Tierartenvielfalt in der Feldflur. In Bayerische Landesanstalt für Landwirtschaft (LfL) (ed) Wildtiere in der Agrarlandschaft 14; Kulturlandschaftstag: Freising, Germany; Bayerische Landesanstalt für Landwirtschaft (LfL): Freising-Weihenstephan, Germany, 2016; pp. 53–62. [Google Scholar]
- Vollrath, B.; Werner, A.; Degenbeck, M.; Illies, I.; Zeller, J.; Marzini, K. Energetische Verwertung von Kräuterreichen Ansaaten in der Agrarlandschaft und im Siedlungsbereich-eine Ökologische und Wirtschaftliche Alternative bei der Biogasproduktion. Energie aus Wildpflanzen-Schlussbericht. Available online: https://www.lwg.bayern.de/mam/cms06/landespflege/dateien/energie_aus_wildpflanzhen_fnr_abschlussbericht_22005308_in.pdf (accessed on 1 April 2021).
- Uyttenbroeck, R.; Hatt, S.; Piqueray, J.; Paul, A.; Bodson, B.; Francis, F.; Monty, A. Creating perennial flower strips: Think functional! Agric. Agric. Sci. Procedia. 2015, 6, 95–101. [Google Scholar] [CrossRef] [Green Version]
- Albrecht, H. Suitability of arable weeds as indicator organisms to evaluate species conservation effects of management in agricultural ecosystems. Agric. Ecosyst. Environ. 2003, 98, 201–211. [Google Scholar] [CrossRef]
- Marshall, E.J.P.; Brown, V.K.; Boatman, N.D.; Lutman, P.J.W.; Squire, G.R.; Ward, L.K. The role of weeds in supporting biological diversity within crop fields. Weed Res. 2003, 43, 77–89. [Google Scholar] [CrossRef] [Green Version]
- Kulkarni, S.S.; Dosdall, L.M.; Spence, J.R.; Willenborg, C.J. Field density and distribution of weeds are associated with spatial dynamics of omnivorous ground beetles (Coleoptera: Carabidae). Agric. Ecosyst. Environ. 2017, 236, 134–141. [Google Scholar] [CrossRef]
- Schumacher, M.; Dieterich, M.; Gerhards, R. Effects of weed biodiversity on the ecosystem service of weed seed predation along a farming intensity gradient. Glob. Ecol. Conserv. 2020, 24, e01316. [Google Scholar] [CrossRef]
- Vollrath, B.; Marzini, K. Mehr Vielfalt und rentable Biogasproduktion -mit den richtigen Blühmischungen ist beides möglich. LWG 2016, 5, 1–5. [Google Scholar]
- Von Cossel, M.; Steberl, K.; Hartung, J.; Pereira, L.A.; Kiesel, A.; Lewandowski, I. Methane yield and species diversity dynamics of perennial wild plant mixtures established alone, under cover crop maize (Zea mays L.), and after spring barley (Hordeum vulgare L.). Glob. Chang. Biol. Bioenergy 2019, 11, 1376–1391. [Google Scholar] [CrossRef] [Green Version]
- Feledyn-Szewczyk, B.; Matyka, M.; Staniak, M. Comparison of the Effect of Perennial Energy Crops and Agricultural Crops on Weed Flora Diversity. Agronomy 2019, 9, 695. [Google Scholar] [CrossRef] [Green Version]
- Tørresen, K.S.; Skuterud, R.; Tandsaether, H.J.; Hagemo, M.B. Long-term experiments with reduced tillage in spring cereals. I. Effects on weed flora, weed seedbank and grain yield. Crop Prot. 2003, 22, 185–200. [Google Scholar] [CrossRef]
- Wo´zniak, A.; Soroka, M. Biodiversity of weeds in pea cultivated in various tillage systems. Rom. Agric. Res. 2015, 32, 231–237. [Google Scholar]
- Energie aus Wildpflanzen: Biogas-Mischungen für Innovative Landwirte. Available online: https://www.saaten-zeller.de/landwirtschaft/biogas-i#bg (accessed on 5 November 2020).
- R Development Core Team. R: A Language and Environment for Statistical Computing; R Foundation for Statistical Computing: Vienna, Austria, 2020; ISBN 3-900051-07-0. Available online: http://www.R-project.org (accessed on 12 October 2020).
- Bates, D.; Mächler, M.; Bolker, B.; Walker, S. Fitting Linear Mixed-Effects Models Using lme4. J. Stat. Softw. 2015, 67, 1–48. [Google Scholar] [CrossRef]
- Lenth, R. Emmeans: Estimated Marginal Means, aka Least-Squares Means. R Package Version 1.4.8. Available online: https://CRAN.R-project.org/package=emmeans (accessed on 15 December 2020).
- Plückers, C.; Rascher, U.; Scharr, H.; von Gillhaussen, P.; Beierkuhnlein, C.; Temperton, V.M. Sowing different mixtures in dry acidic grassland produced priority effects of varying strength. Acta Oecol. 2013, 53, 110–116. [Google Scholar] [CrossRef]
- Schmidt, A.; Kirmer, A.; Kiehl, K.; Tischew, S. Seed mixture strongly affects species-richness and quality of perennial flower strips on fertile soil. Basic Appl. Ecol. 2019, 42, 62–72. [Google Scholar] [CrossRef]
- Bonin, C.L.; Fidel, R.B.; Banik, C.; Laird, D.A.; Mitchell, R.; Heaton, E.A. Perennial biomass crop establishment, community characteristics, and productivity in the upper US Midwest: Effects of cropping systems seed mixtures and biochar applications. Eur. J. Agron. 2018, 101, 121–128. [Google Scholar] [CrossRef] [Green Version]
- Redwitz, C.; Gerowitt, B. Which factors support the occurrence of Chenopodium album in maize fields in Northern Germany? In Proceedings of the 26th German Conference on Weed Biology and Weed Control, Braunschweig, Germany, 11–14 March 2014; pp. 165–171. [Google Scholar]
- Brust, J.; Claupein, W.; Gerhards, R. Growth and weed suppression ability of common and new cover crops in Germany. J. Crop Prot. 2014, 63, 1–8. [Google Scholar] [CrossRef]
- Williams, T. A Study of the competitive ability of Chenopodium album L. Weed Res. 1964, 4, 283–295. [Google Scholar] [CrossRef]
- Westerman, P.R.; Hofman, A.; Vet, L.E.M.; van der Werf, W. Relative importance of vertebrates and invertebrates in epigeaic weed seed predation in organic cereal filds. Agric. Ecosyst. Environ. 2003, 95, 417–425. [Google Scholar] [CrossRef]
- Meiss, H.; Le Lagadec, L.; Munier-Jolain, N.; Waldhardt, R.; Petit, S. Weed seed predation increases with vegetation cover in perennial forage crops. Agric. Ecosyst. Environ. 2010, 138, 10–16. [Google Scholar] [CrossRef]
- Van der Putten, W.H.; Mortimer, S.R.; Hedlund, K.; Van Dijk, C.; Brown, V.K.; Lepš, J.; Rodriguez-Barrueco, C.; Roy, J.; Diaz Len, T.A.; Gormsen, D.; et al. Plant species diversity as a driver of early succession in abandoned fields: A multi-site approach. Oecologia. 2000, 124, 91–99. [Google Scholar] [CrossRef]
- Froud-Williams, R.J.; Drennan, D.S.H.; Chancellor, R.J. Influence of Cultivation Regime on Weed Floras of Arable Cropping Systems. J. Appl. Ecol. 1983, 20, 187–197. [Google Scholar] [CrossRef]
- Brandsæter, L.O.; Mangerud, K.; Helgheim, M.; Berge, T.W. Control of perennial weeds in spring cereals through stubble cultivation and mouldboard ploughing during autumn or spring. Crop Prot. 2017, 98, 16–23. [Google Scholar] [CrossRef]
Figure 1.
Boxplots of species richness and density of weeds (a) and crops (b) during the cropping seasons across all sites. The same letter means the difference is not significant (Tukey’s test). Sample size: first cropping season n = 96, second cropping season n = 64, third cropping season n = 32.
Figure 1.
Boxplots of species richness and density of weeds (a) and crops (b) during the cropping seasons across all sites. The same letter means the difference is not significant (Tukey’s test). Sample size: first cropping season n = 96, second cropping season n = 64, third cropping season n = 32.

Figure 2.
Weed density at the four experimental sites in two set-ups. Plots based on the chronological progression of the experiments are given in Table 2. The weed density classes are divided into intervals of 0 to ≤100, 101 to ≤200 and greater than 200, with the interval from 0 to ≤100 subdivided into 25 steps. The intensity of the colour increases with weed density class.

Table 1.
Field conditions at the experimental sites.
| Factor | R | M | D | Z |
|---|---|---|---|---|
| Temperature 1 | 10.5 °C | 9.9 °C | 9.4 °C | 9.9 °C |
| Precipitation 1 | 584 mm | 517 mm | 531 mm | 520 mm |
| Soil type | loamy sand | sandy loam | sandy loam | loamy sand |
| Soil classification 2 | 45 | 56 | 42 | 25 |
| Plot sizes | 30 m2 | 18 m2 | 48 m2 | 64 m2 |
1 Average of the three-year experimental period. 2 German rating index of the soil classification scheme; points range from 1 (poor soil) to 120 (best soil).
Table 2.
Experimental factors, chronological progression of the cropping seasons and set-ups to follow weed density development ( → ).
Table 2.
Experimental factors, chronological progression of the cropping seasons and set-ups to follow weed density development ( → ).

R = Rostock, M = Malchow, D = Dedelow, Z = Müncheberg.
Table 3.
Species list of the perennial mixture BG 70 (Saaten Zeller GmbH & Co. KG). Botanical name and weight proportion (%) in the perennial mixture BG 70.
Table 3.
Species list of the perennial mixture BG 70 (Saaten Zeller GmbH & Co. KG). Botanical name and weight proportion (%) in the perennial mixture BG 70.
| Annual Species | Perennial Species | ||
| Fagopyron esculentum Moench | 8.0 | Althaea officinalis L. | 5.5 |
| Helianthus annuus L. | 8.0 | Anthemis tinctoria L. | 0.1 |
| Malva verticillata L. | 7.5 | Artemisia vulgaris L. | 1.0 |
| Centaurea nigra L. | 20.0 | ||
| Biennial species | Cichorium intybus L. | 2.0 | |
| Daucus carota L. | 0.1 | Foeniculum vulgare Mill. | 4.0 |
| Dipsacus sylvestris Huds. | 0.5 | Inula helenium L. | 5.0 |
| Echium vulgare L. | 0.5 | Malva alcea L. | 0.6 |
| Melilotus albus Medik. | 3.5 | Malva sylvestris L. | 7.0 |
| Melilotus officinalis Lam. | 7.0 | Medicago sativa L. | 2.0 |
| Reseda luteola L. | 0.3 | Onobrychis viciifolia Scop. | 9.0 |
| Verbascum thapsus L. | 0.5 | Silene dioica Clairv. | 0.2 |
| Tanacetum vulgare L. | 5.0 | ||
Table 4.
Significance of the factors and their interactions, separated for weeds and crops. The interaction between cropping season and seed rate was tested, but no interaction was determined. The random factor block had no effect. (source: “emmeans” glm model output).
Table 4.
Significance of the factors and their interactions, separated for weeds and crops. The interaction between cropping season and seed rate was tested, but no interaction was determined. The random factor block had no effect. (source: “emmeans” glm model output).
| Fixed Effects | Random Effects | ||||
|---|---|---|---|---|---|
| Crop. Seas. | Seed Rate | Exp. Year | Site | Plot (Block, Site) | |
| Weeds | |||||
| Density | <0.001 *** | 0.938 | 1.000 | <0.001 *** | 0.542 |
| Species richness | 0.137 | 0.739 | <0.001 *** | <0.001 *** | 0.049 * |
| Shannon’s H | <0.001 *** | 0.553 | <0.001 *** | <0.001 *** | 1.000 |
| Shannon’s E | <0.001 *** | 0.339 | <0.001 *** | <0.001 *** | 0.721 |
| Berger-Parker index | <0.001 *** | 0.583 | <0.001 *** | <0.001 *** | 1.000 |
| Crops | |||||
| Density | <0.043 * | <0.01 ** | <0.032 * | <0.001 *** | <0.01 ** |
| Species richness | <0.049 * | 0.607 | <0.001 *** | <0.001 *** | <0.01 ** |
| Shannon’s H | <0.026 * | 0.769 | <0.001 *** | <0.001 *** | <0.001 *** |
| Shannon’s E | 0.626 | 0.432 | 0.015 * | <0.01 ** | <0.01 ** |
| Berger-Parker index | 0.209 | 0.920 | <0.001 *** | <0.01 ** | 0.184 |
p <0.05, p <0.01 *, p <0.001 **, p <0.00 ***. Crop. seas. = cropping season, Exp. year = experimental year.
Table 5.
Shannon’s H, Shannon’s E and inverse BPH dominance index and the standard error values (SE) of weeds and crops in the perennial mixture over the experimental years. Significantly different results (p < 0.05, Tukey test) are marked with different letters.
Table 5.
Shannon’s H, Shannon’s E and inverse BPH dominance index and the standard error values (SE) of weeds and crops in the perennial mixture over the experimental years. Significantly different results (p < 0.05, Tukey test) are marked with different letters.
| First Crop. Seas. | Second Crop. Seas. | Third Crop. Seas. | |
|---|---|---|---|
| Weeds | |||
| Shannon’s H | 1.27 ± 0.281 a | 1.455 ± 0.065 b | 1.77 ± 0.092 c |
| Shannon’s E | 0.53 ± 0.087 a | 0.59 ± 0.026 a | 0.80 ± 0.038 b |
| BPH index | 2.10 ± 0.434 a | 2.50 ± 0.136 b | 3.00 ± 0.194 c |
| Sample size | N = 96 | N = 56 | N = 24 |
| Crops | |||
| Shannon’s H | 1.50 ± 0.199 a | 1.55 ± 0.047 a | 1.42 ± 0.086 a |
| Shannon’s E | 0.78 ± 0.035 a | 0.79 ± 0.018 a | 0.77 ± 0.030 a |
| BPH index | 2.74 ± 0.348 a | 2.77 ± 0.113 a | 2.48 ± 0.185 a |
| Sample size | N = 76 | N = 57 | N = 19 |
N = sample size, crop. seas. = cropping season.
Publisher’s Note: MDPI stays neutral with regard to jurisdictional claims in published maps and institutional affiliations. |
© 2021 by the authors. Licensee MDPI, Basel, Switzerland. This article is an open access article distributed under the terms and conditions of the Creative Commons Attribution (CC BY) license (https://creativecommons.org/licenses/by/4.0/).
Share and Cite
MDPI and ACS Style
Tamms, L.; de Mol, F.; Glemnitz, M.; Gerowitt, B. Weed Densities in Perennial Flower Mixtures Cropped for Greater Arable Biodiversity. Agriculture 2021, 11, 501. https://0-doi-org.brum.beds.ac.uk/10.3390/agriculture11060501
AMA Style
Tamms L, de Mol F, Glemnitz M, Gerowitt B. Weed Densities in Perennial Flower Mixtures Cropped for Greater Arable Biodiversity. Agriculture. 2021; 11(6):501. https://0-doi-org.brum.beds.ac.uk/10.3390/agriculture11060501
Chicago/Turabian StyleTamms, Laura, Friederike de Mol, Michael Glemnitz, and Bärbel Gerowitt. 2021. "Weed Densities in Perennial Flower Mixtures Cropped for Greater Arable Biodiversity" Agriculture 11, no. 6: 501. https://0-doi-org.brum.beds.ac.uk/10.3390/agriculture11060501
Note that from the first issue of 2016, this journal uses article numbers instead of page numbers. See further details here.