
Impact of Wind Direction on Erodibility of a Hortic Anthrosol in Southeastern Spain


1
Department of Agronomy, Campus of International Excellence (ceiA3), CIAIMBITAL, University of Almeria, 04120 Almeria, Spain
2
Department of Biology and Geology, Campus of International Excellence (ceiA3), CIAIMBITAL, University of Almería, 04120 Almería, Spain
3
Department of Soils, Chapingo Autonomous University, 56230 Texcoco, Mexico
*
Author to whom correspondence should be addressed.
Agriculture 2021, 11(7), 589; https://0-doi-org.brum.beds.ac.uk/10.3390/agriculture11070589
Submission received: 3 June 2021
/
Revised: 21 June 2021
/
Accepted: 23 June 2021
/
Published: 24 June 2021
Abstract
:We tested an efficient, easily and economically manufactured wind-transported particle collector of our own design, called a multidirectional trap (MDt), on fine-tilled Anthrosols. Results from the logs of nine vaned masts, each with four MDt collectors at different heights, showed a clear predominance of northeast and south winds. After analyzing sediment transport rates and their balance, we found that sediments from the south were being deposited rather than lost. A large amount of phyllosilicates, which are highly adhesive sediments, and therefore, increase aggregation, decreasing erodibility, were captured in the upper traps. Moreover, they are rich in calcium carbonate, mainly calcite, which is a powerful aggregate, and therefore, also decreases their wind erodibility. Sediments from the northeast, however, with almost double the total mass transport, contained the largest amount of captured quartz, promoting abrasion and increasing soil erodibility. Nevertheless, large amounts of organic matter found in sediments from the NE led to some aggregation, which balances material lost.
1. Introduction
In arid and semi-arid areas, where winds are often strong and rainfall is scarce, wind erosion of soil causes agronomic, environmental, social and economic problems, impacting adversely on the population [1,2,3,4]. More studies in this area are therefore needed to aid in policy and decision-making [5].
In the absence of tillage, there is more natural vegetation and soil aggregation, which reduce soil loss from wind by slowing down wind speed, further increasing the capacity for capturing lost material [6,7]. Climate and the spatial and temporal variability in threshold wind velocity strongly influence the prediction of the amount and type of wind-blown particles [8,9]. In marginal areas where conservationist strategies are not applied, overgrazing, abandonment of tillage lands, deforestation, and so forth intensify wind erosion and generate considerable soil losses [10]. Cropping results in the loss of organic matter and breakdown of aggregates, which reduces the stability of dry aggregates in medium-textured soils and increases the wind-erodible fraction of the soil [11,12,13]. On the other hand, windy conditions promote soil nutrient loss and drying [14], both influenced by soil surface compaction.
Many dust-trap models have been developed for analyzing wind-blown material [15], but the Big Spring Number Eight (BSNE) [16] and the Modified Wilson and Cook (MWAC) [17] are the most widely used devices [18]. Collector entrapment efficiency depends on average wind-blown particle size. Previous field studies have shown that the efficiency of the BSNE increased with wind speed and smaller particle size [19]. Vertical sediment flow may be analyzed by using traps located at different heights [20]. In this study, we used our own new patented collector, called the Multidirectional trap (MDt), which incorporates several advantages and improvements. It is easily and economically manufactured and not only captures material transported by the wind from the surface of the soil but also differentiates it by direction of origin. By using a group of masts with these new collectors at different heights, overall particle loss or deposit in the study area can be determined, as well as their composition depending on origin. Thus, particles of known origin captured by the MDt may then be analyzed by X-ray diffraction, enabling fast, reliable identification and quantification of the crystalline phases present in a sample. This provides added value as wind-eroded mineral type and amount strongly influence the soil cation exchange capacity and hence soil fertility.
The objectives of this study were to study the amount of material deposited or lost by the wind from different directions, under the same conditions, in agricultural soil in Southeast Spain and to compare the qualitative and semi-quantitative differences between the soil minerals transported from different places and their effects on the soil studied.
2. Materials and Methods
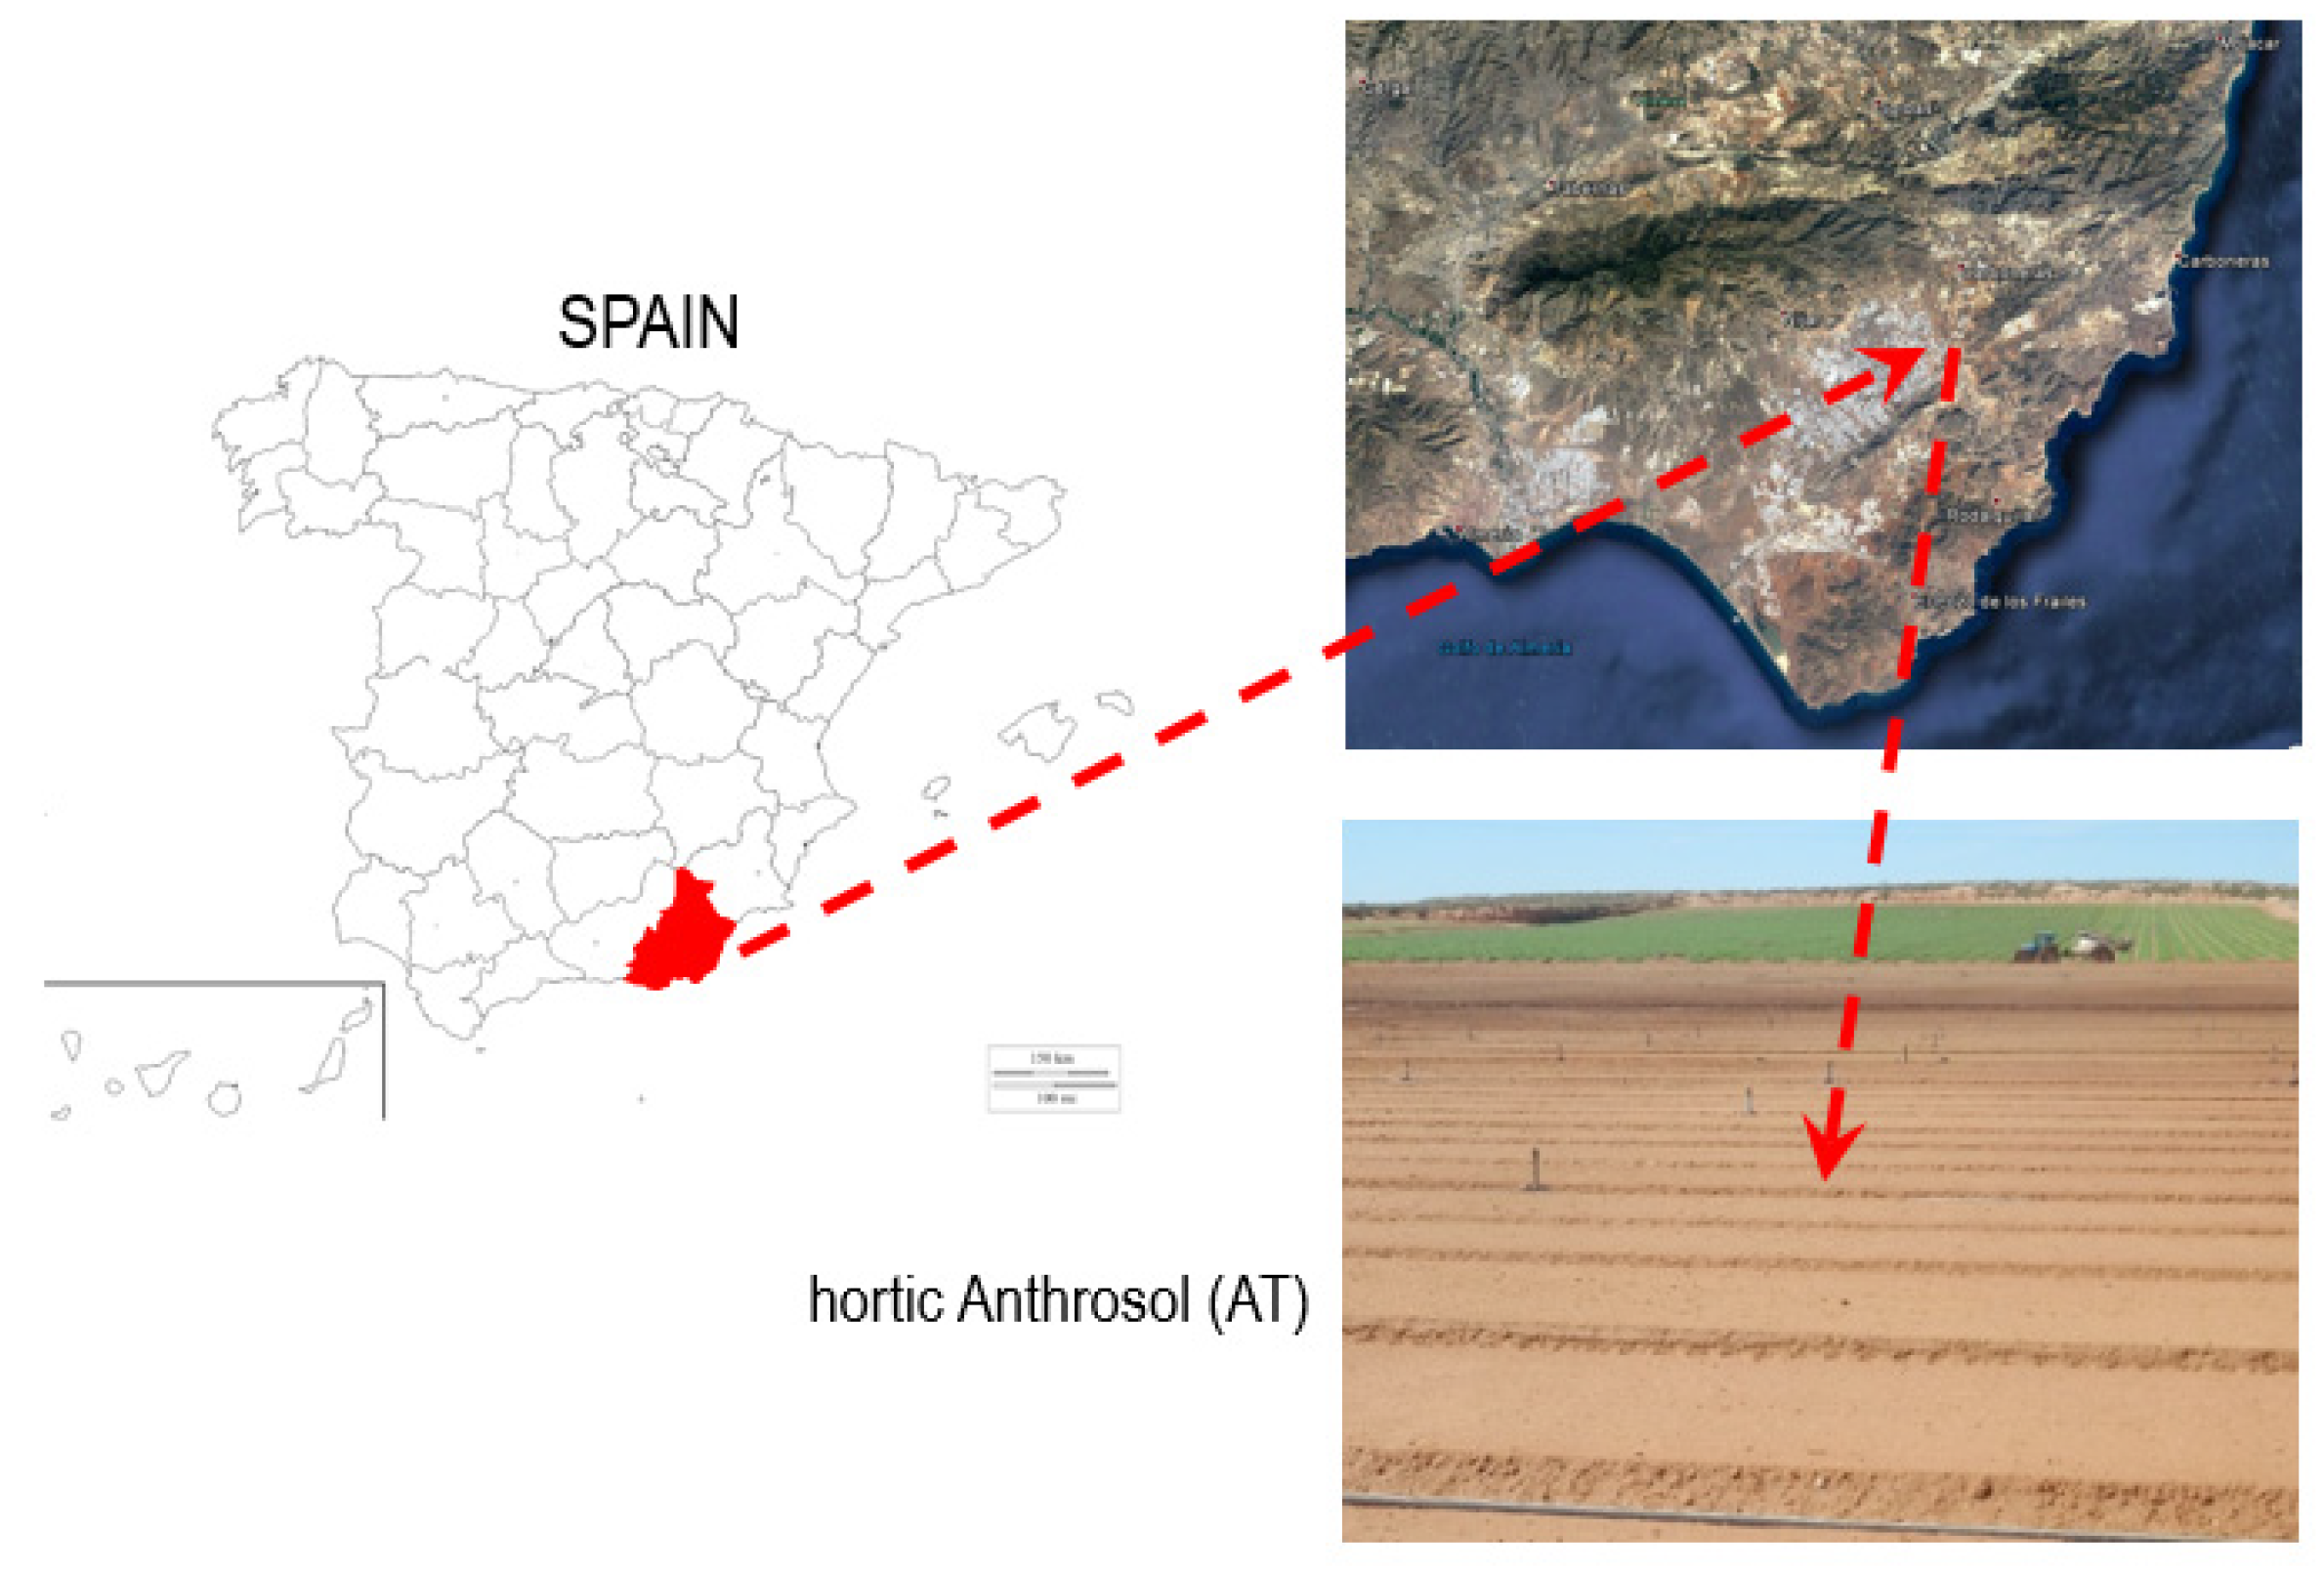
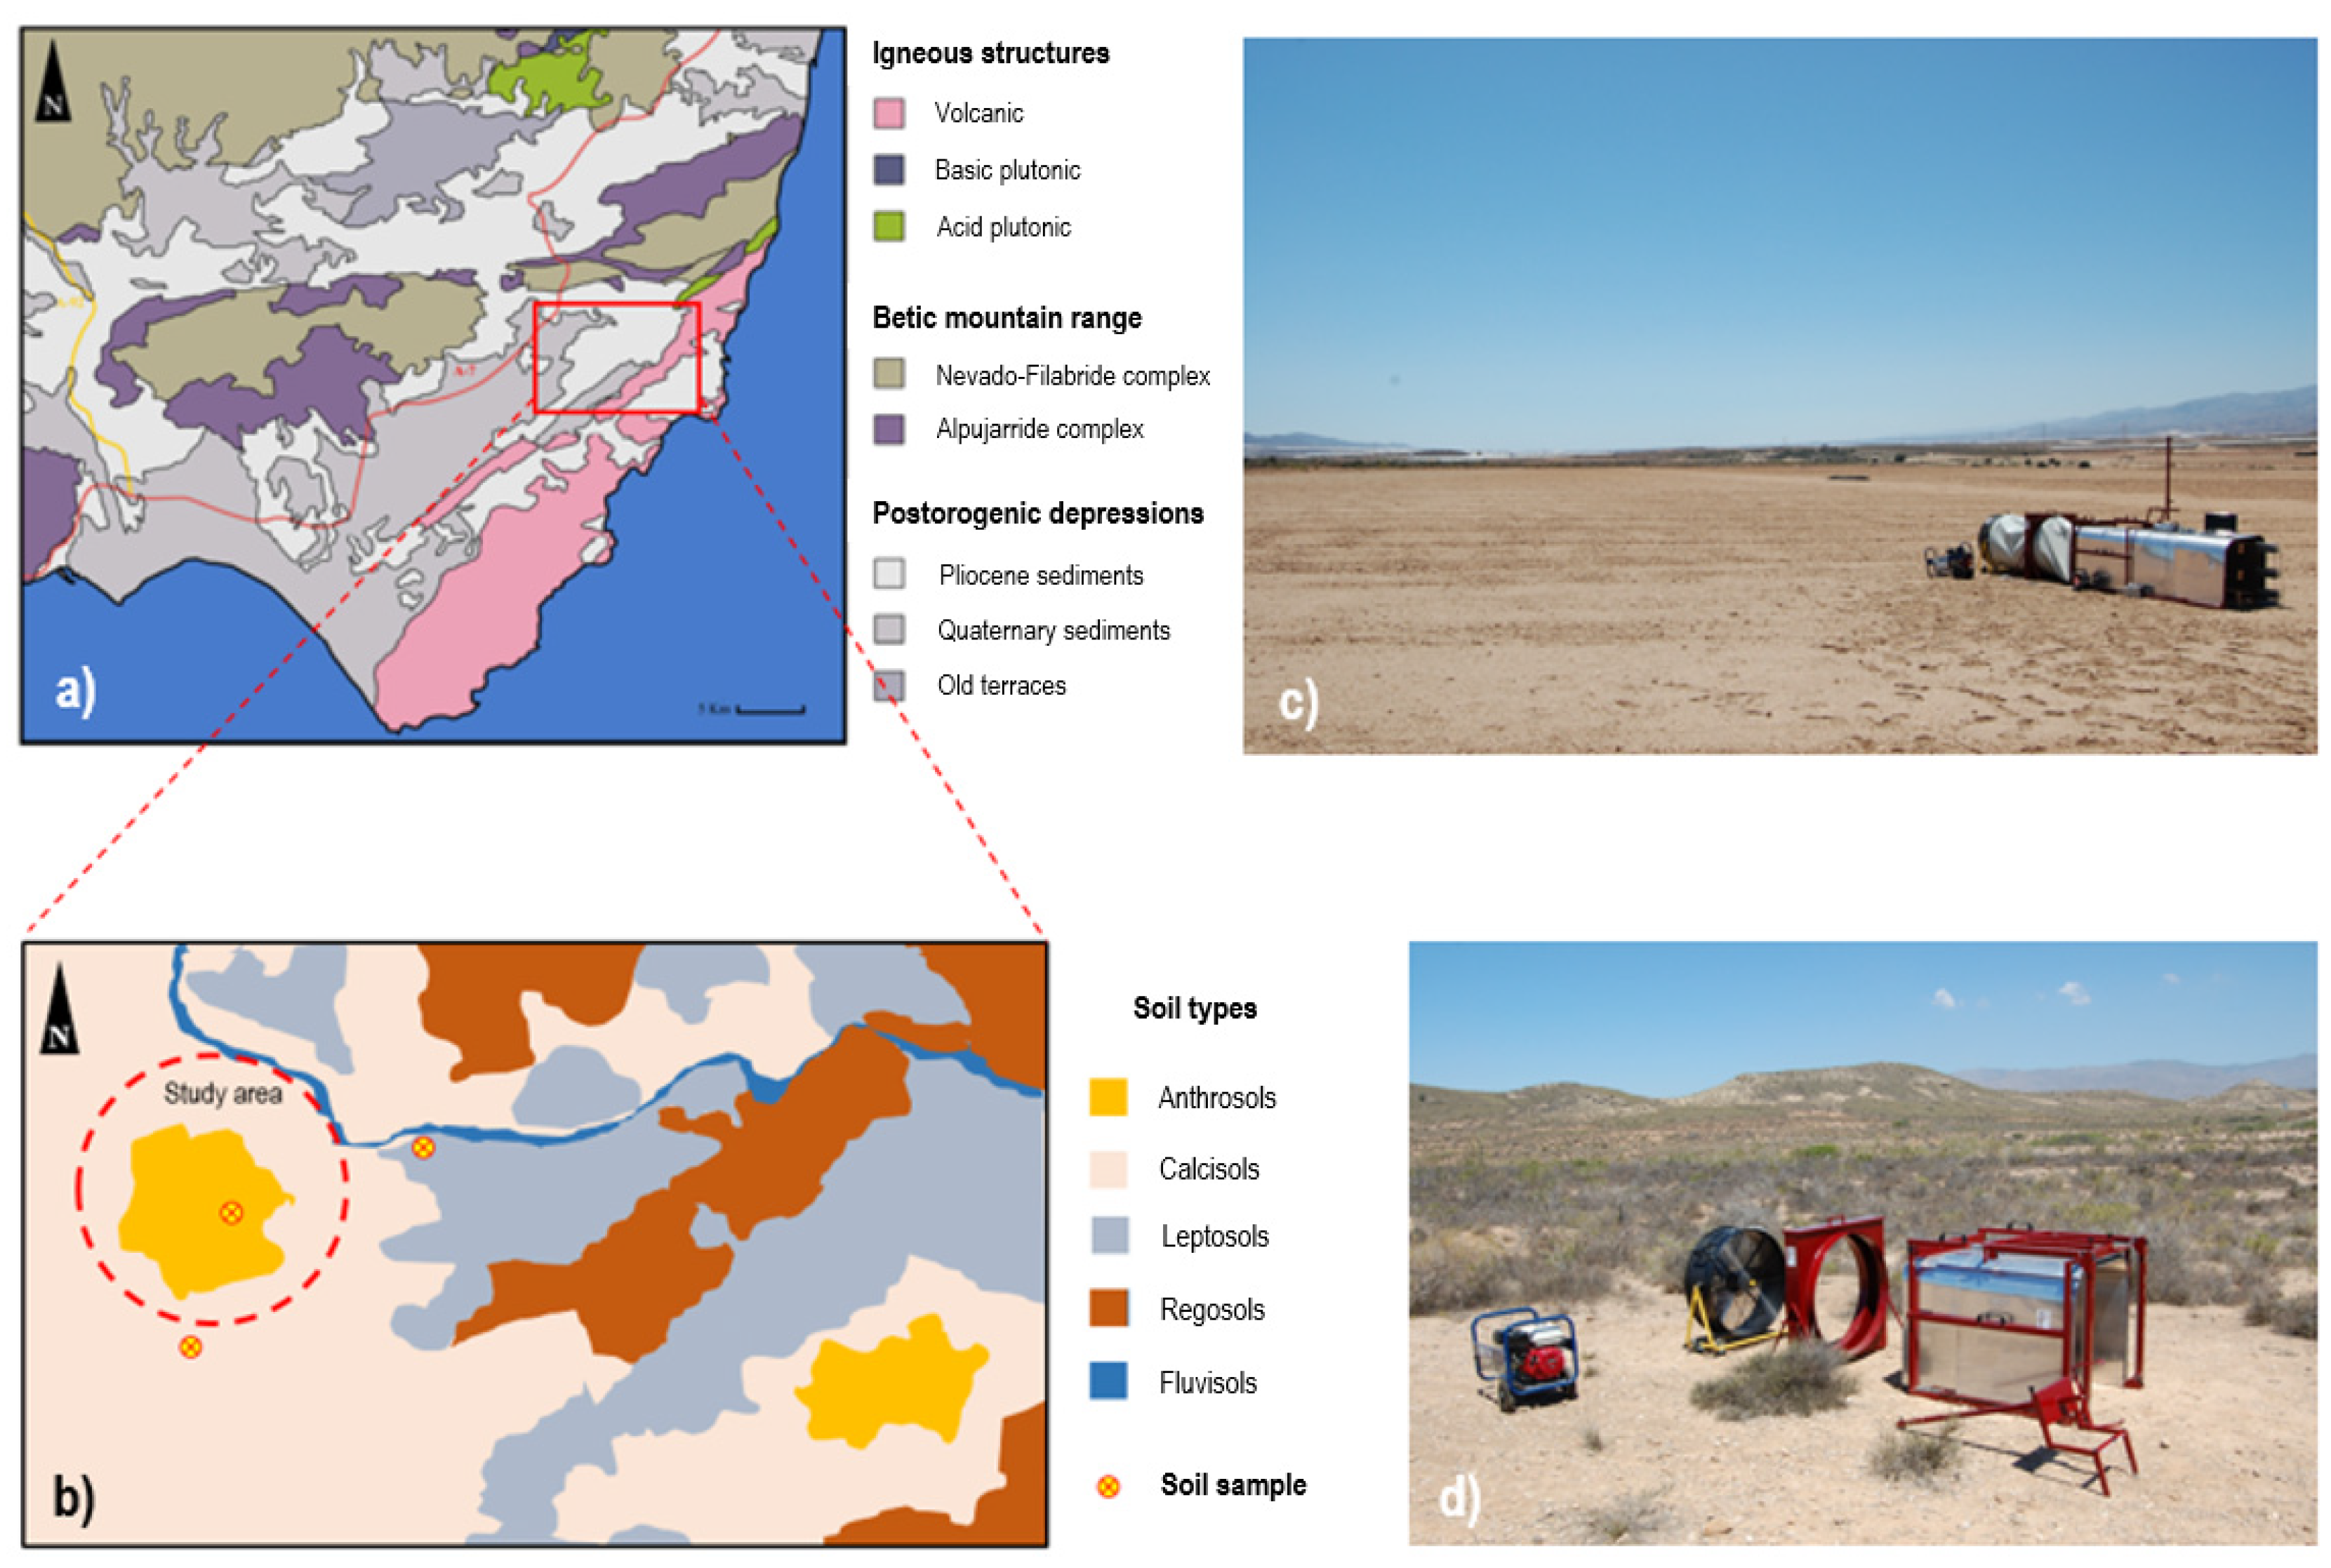
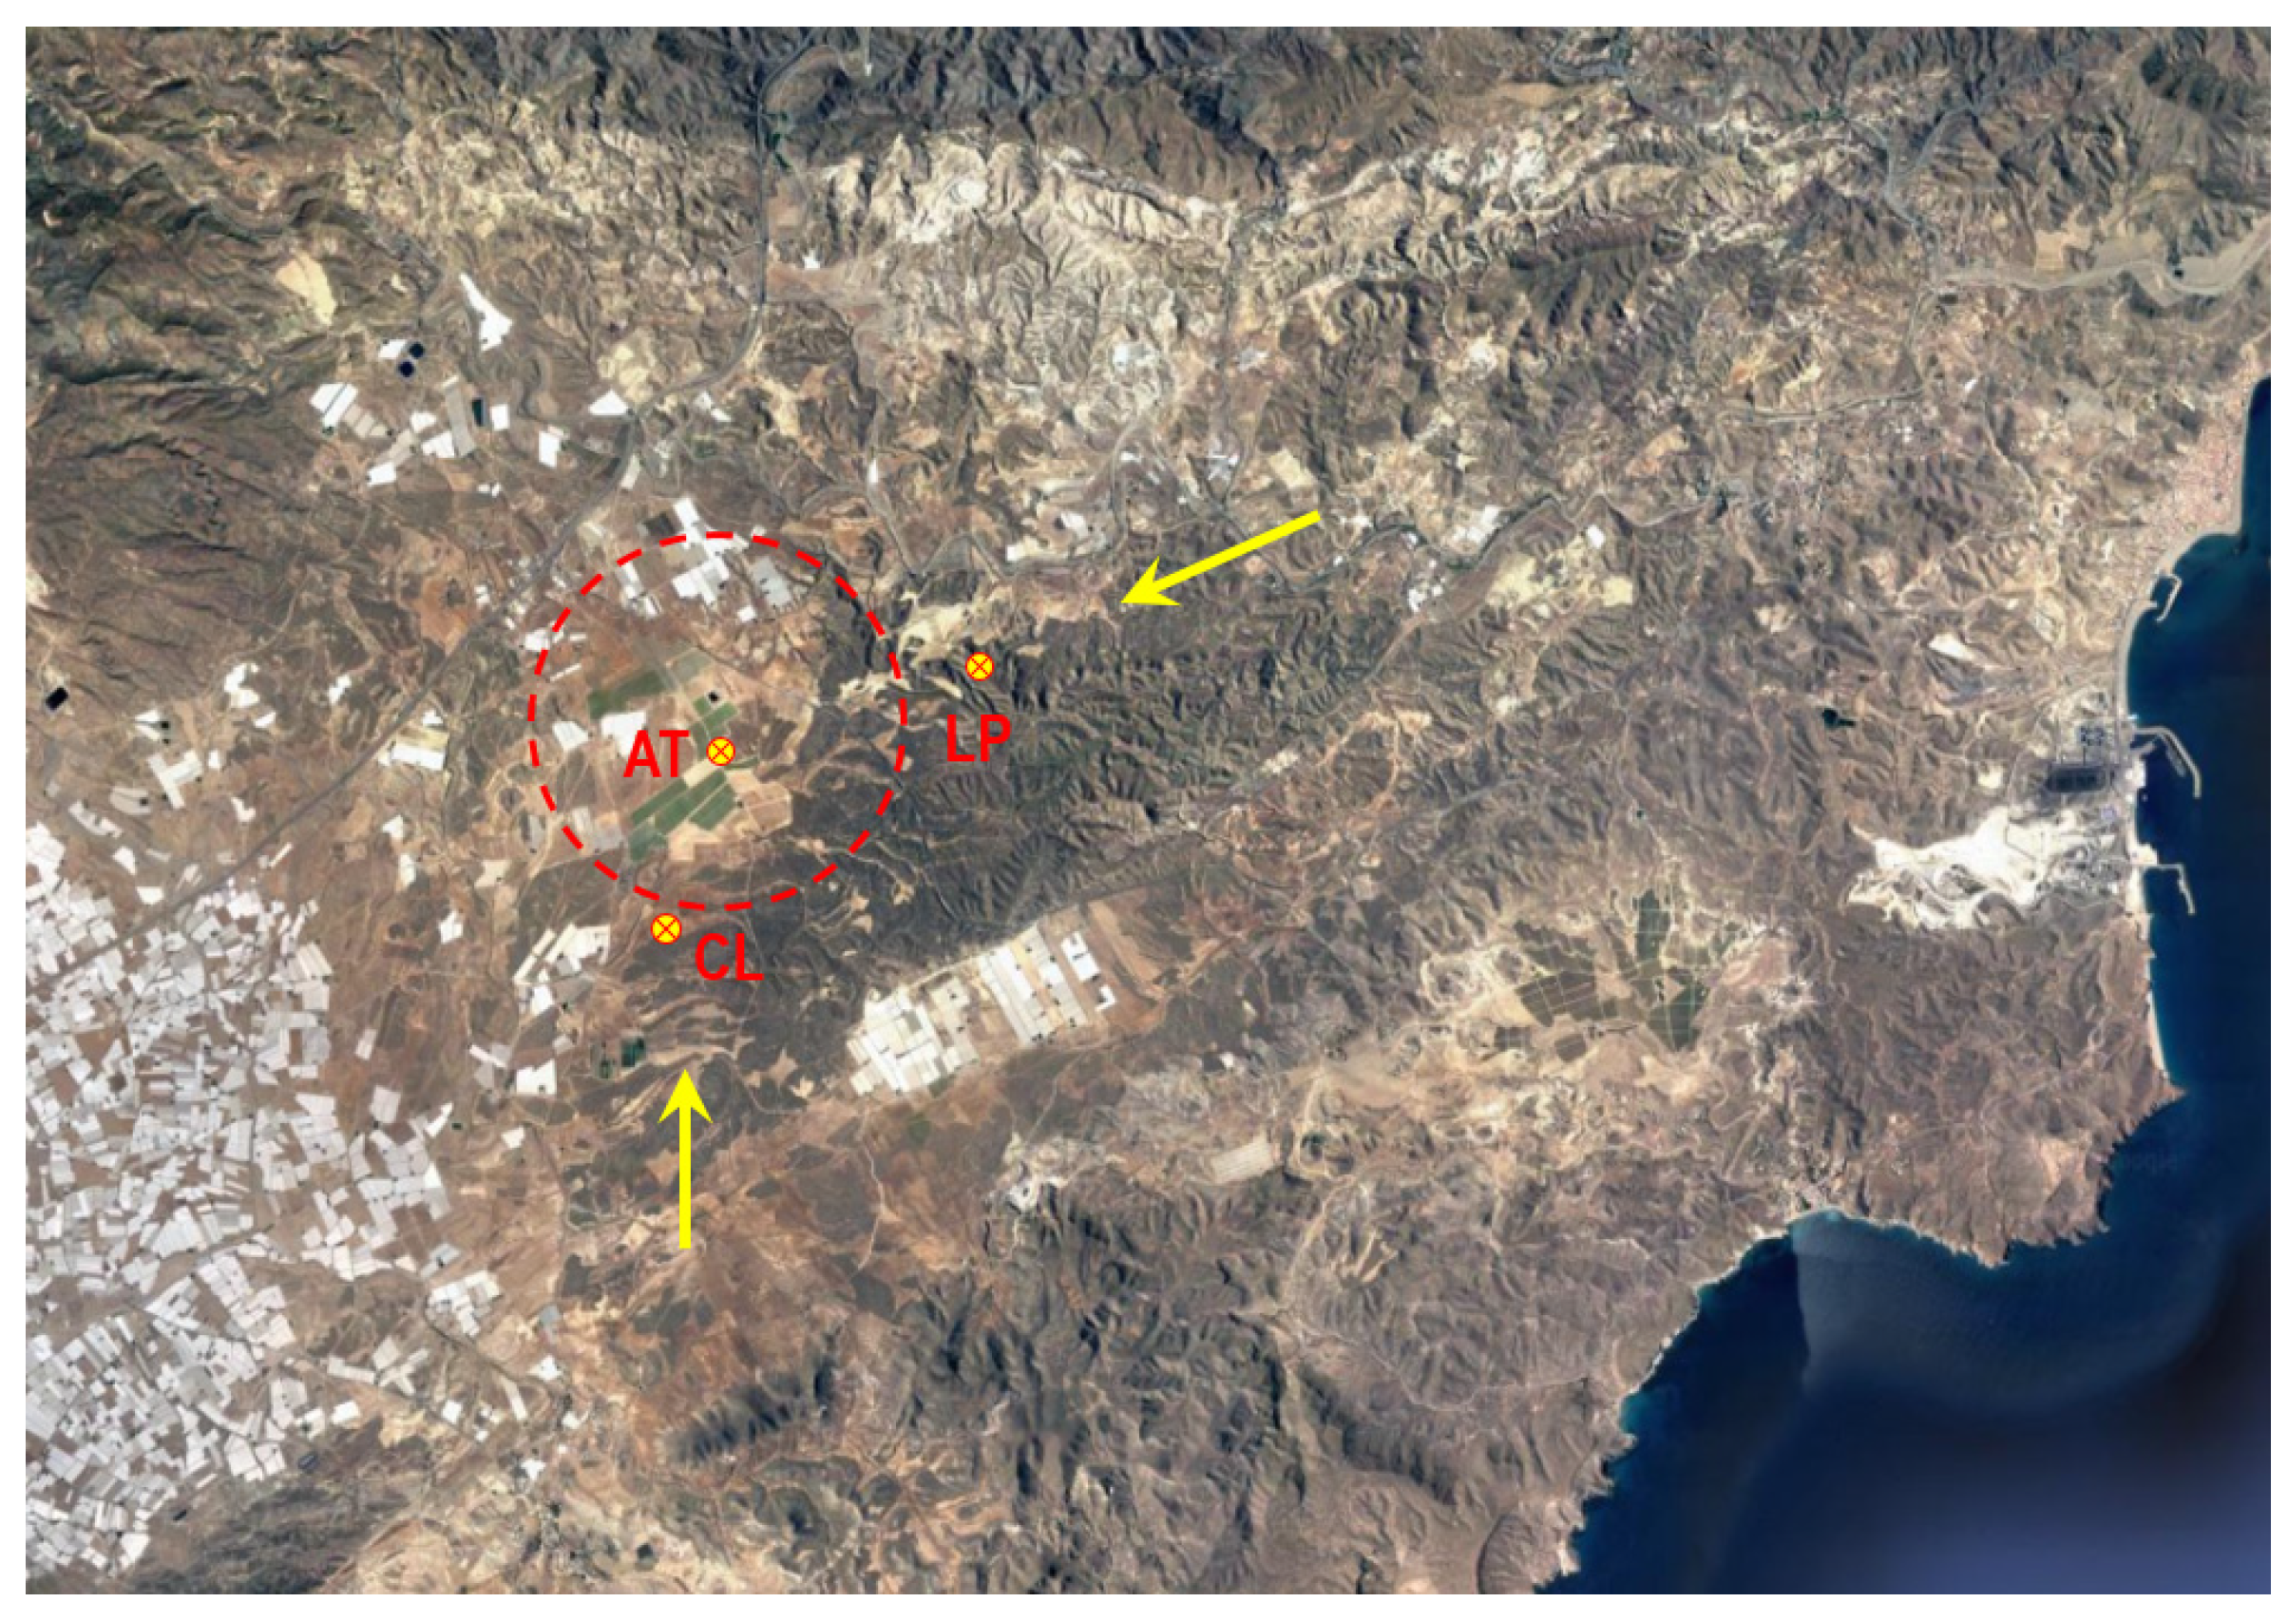
The study area is located in Almeria province in southeastern Spain (36°58′26″ N, 02°03′29″ W), elevation 190 m ASL (Figure 1). The climate is semi-arid thermo-Mediterranean, with a mean annual temperature of 17.8 °C and mean annual precipitation of 249 mm, according to records for the last 20 years from the automatic meteorological station network of the Andalusian regional government. Lithological material is mainly a metamorphic basement separated by Pliocene and Quaternary sedimentation basins [21]. Natural plant communities are made up of isolated native shrubs surrounded by bare soil with colonization by annual plant species. Soils are deeply cropped hortic Anthrosols (ATh), with sandy texture, a weak medium subangular blocky structure and few gravel fragments (sampled 20 January 2020 on intensive commercial farming over 100 ha). We also analyzed (Figure 2) the surrounding eutrophic Leptosols (LPe) and haplic Calcisiols (CLh). By using a PCE-423 hot wire anemometer connected in parallel to a computer for 24 continuous hours, we established that the average wind speed was 4.0 m s−1 with gusts of over 20 m s−1 for no more than 3 min from NE and gusts of over 14 m s−1 for no more than 4 min from S; temperature and relative humidity were 8.2 °C and 75.7%, respectively.
Four replicate samples were taken from the top 5 cm of soils and analyzed, taking into account that wind erosion processes will fundamentally affect the most superficial part of the soils. Texture data were found by the Robinson pipet method. Organic matter content was obtained by applying the Van Bemmelen factor to organic carbon content analyzed with the Walkley–Black wet digestion method. Gas volumetry was used to determine the equivalent carbonate content.
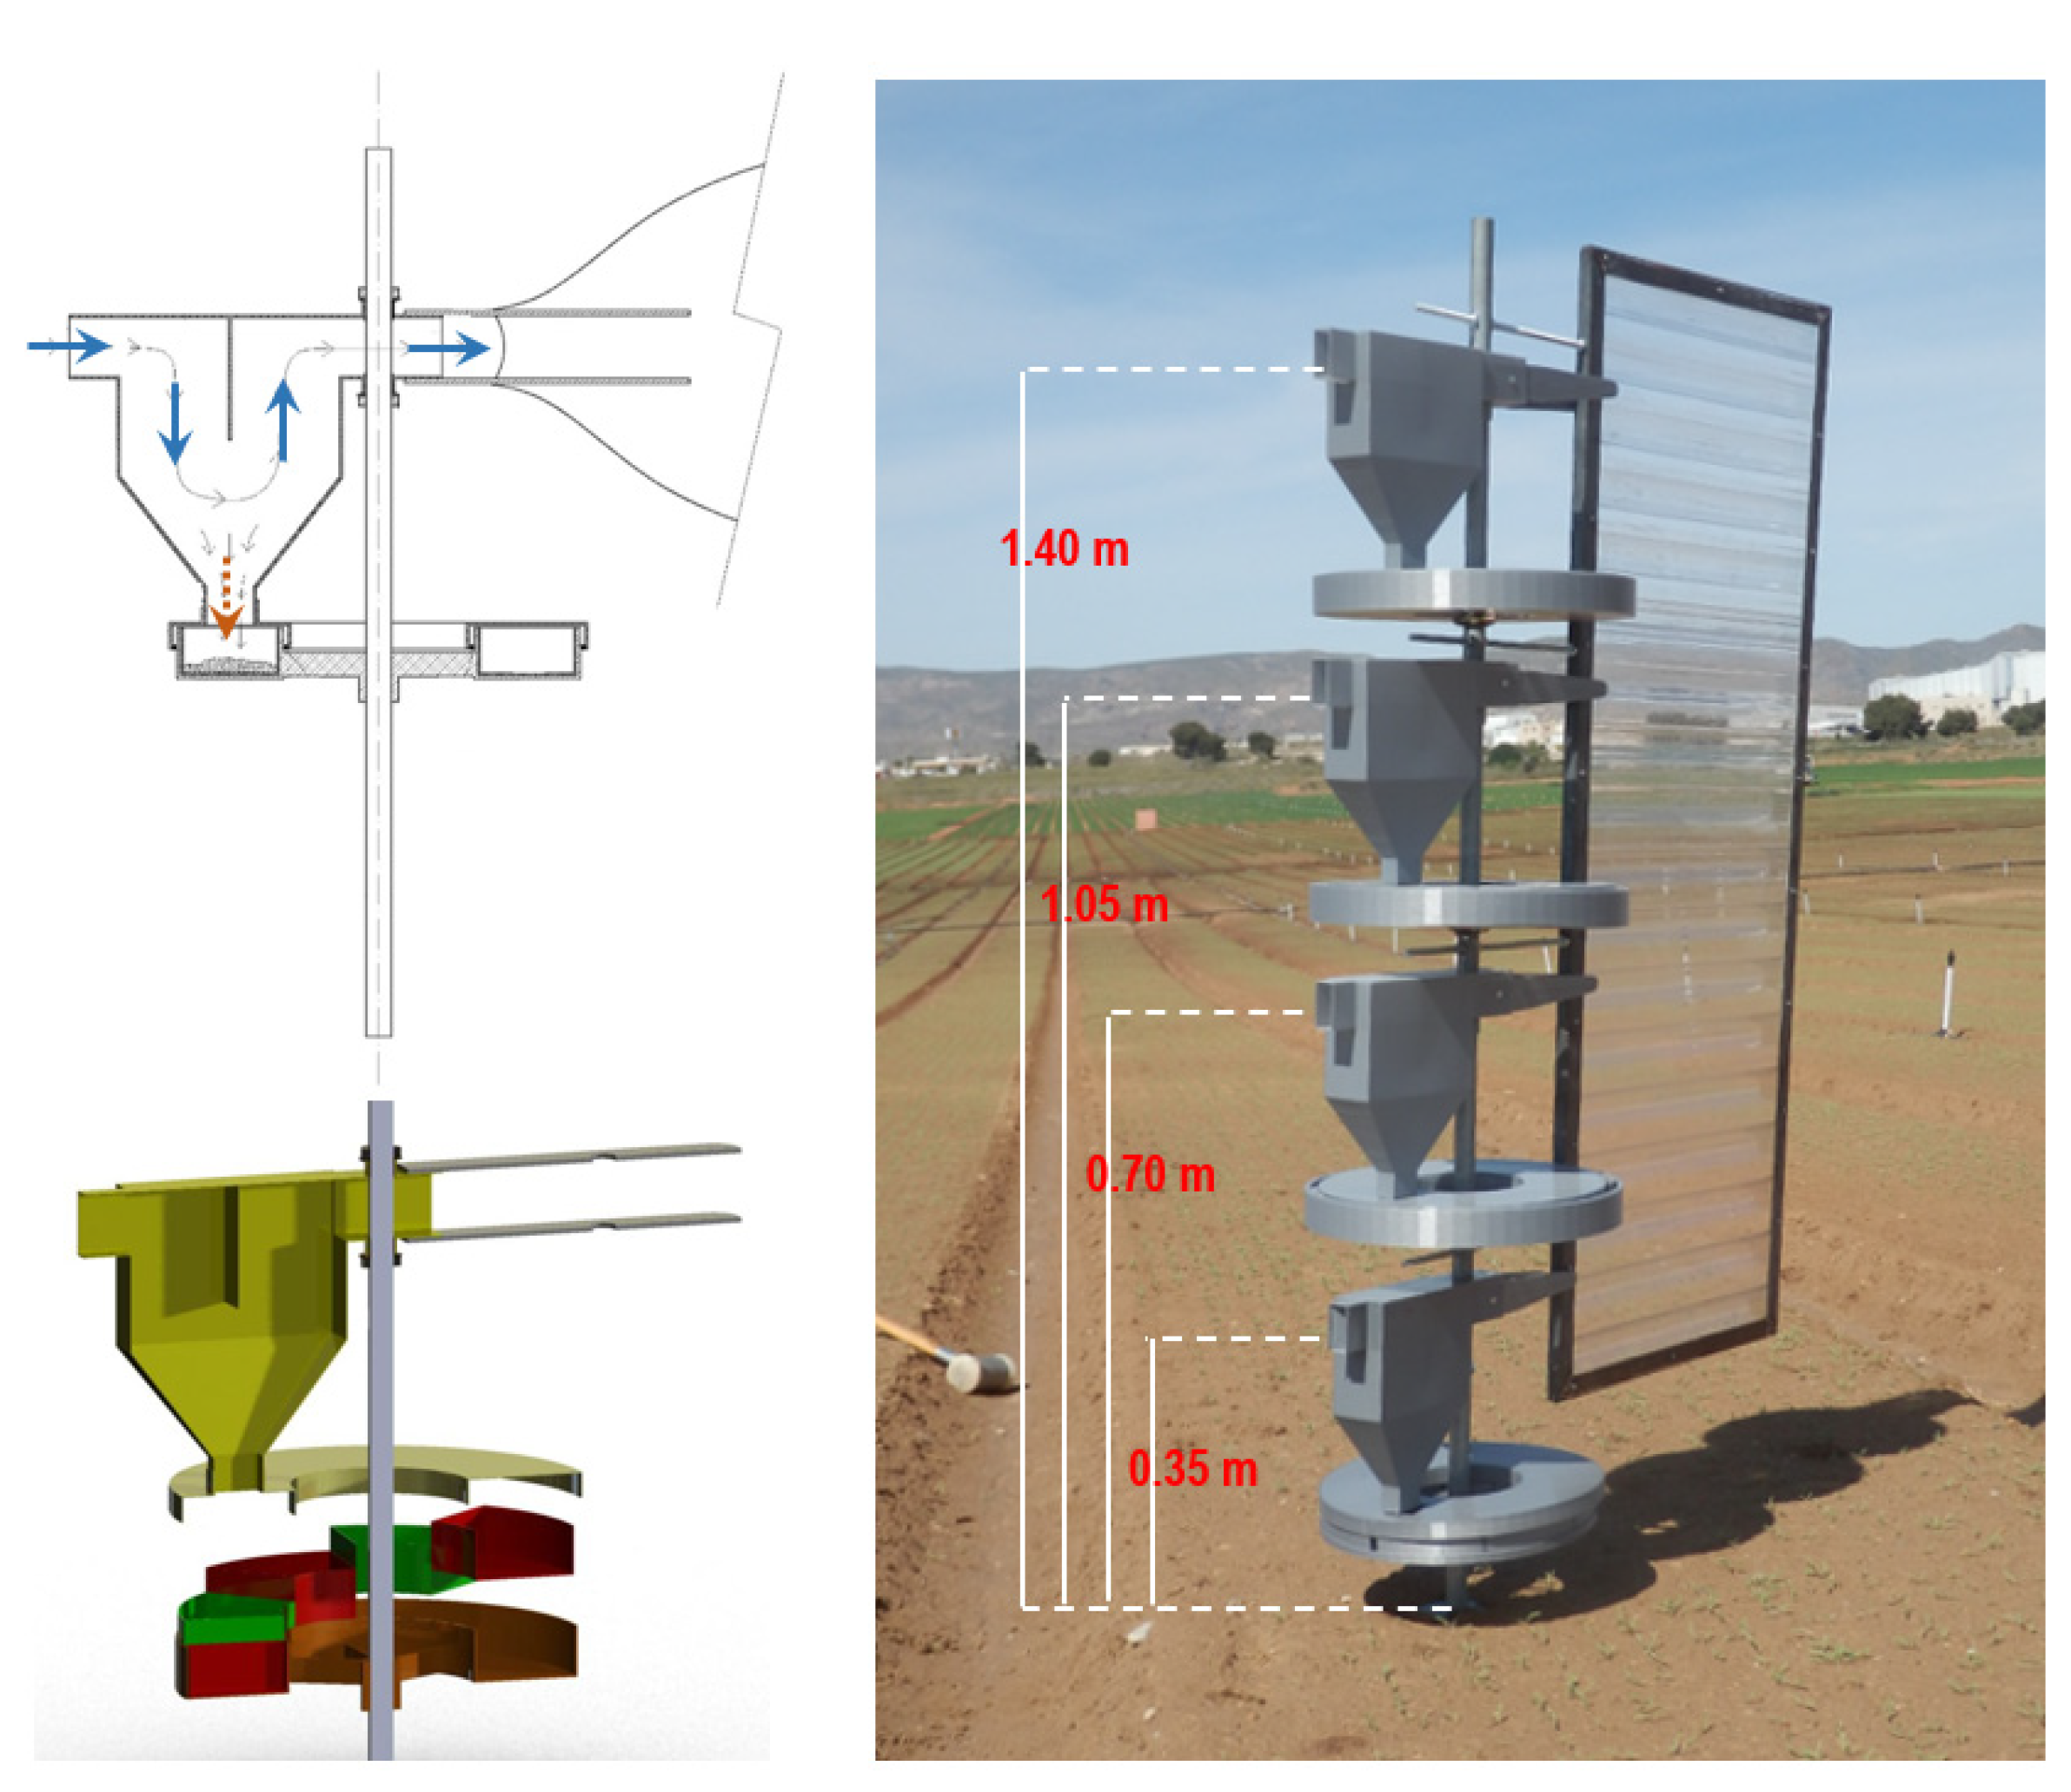
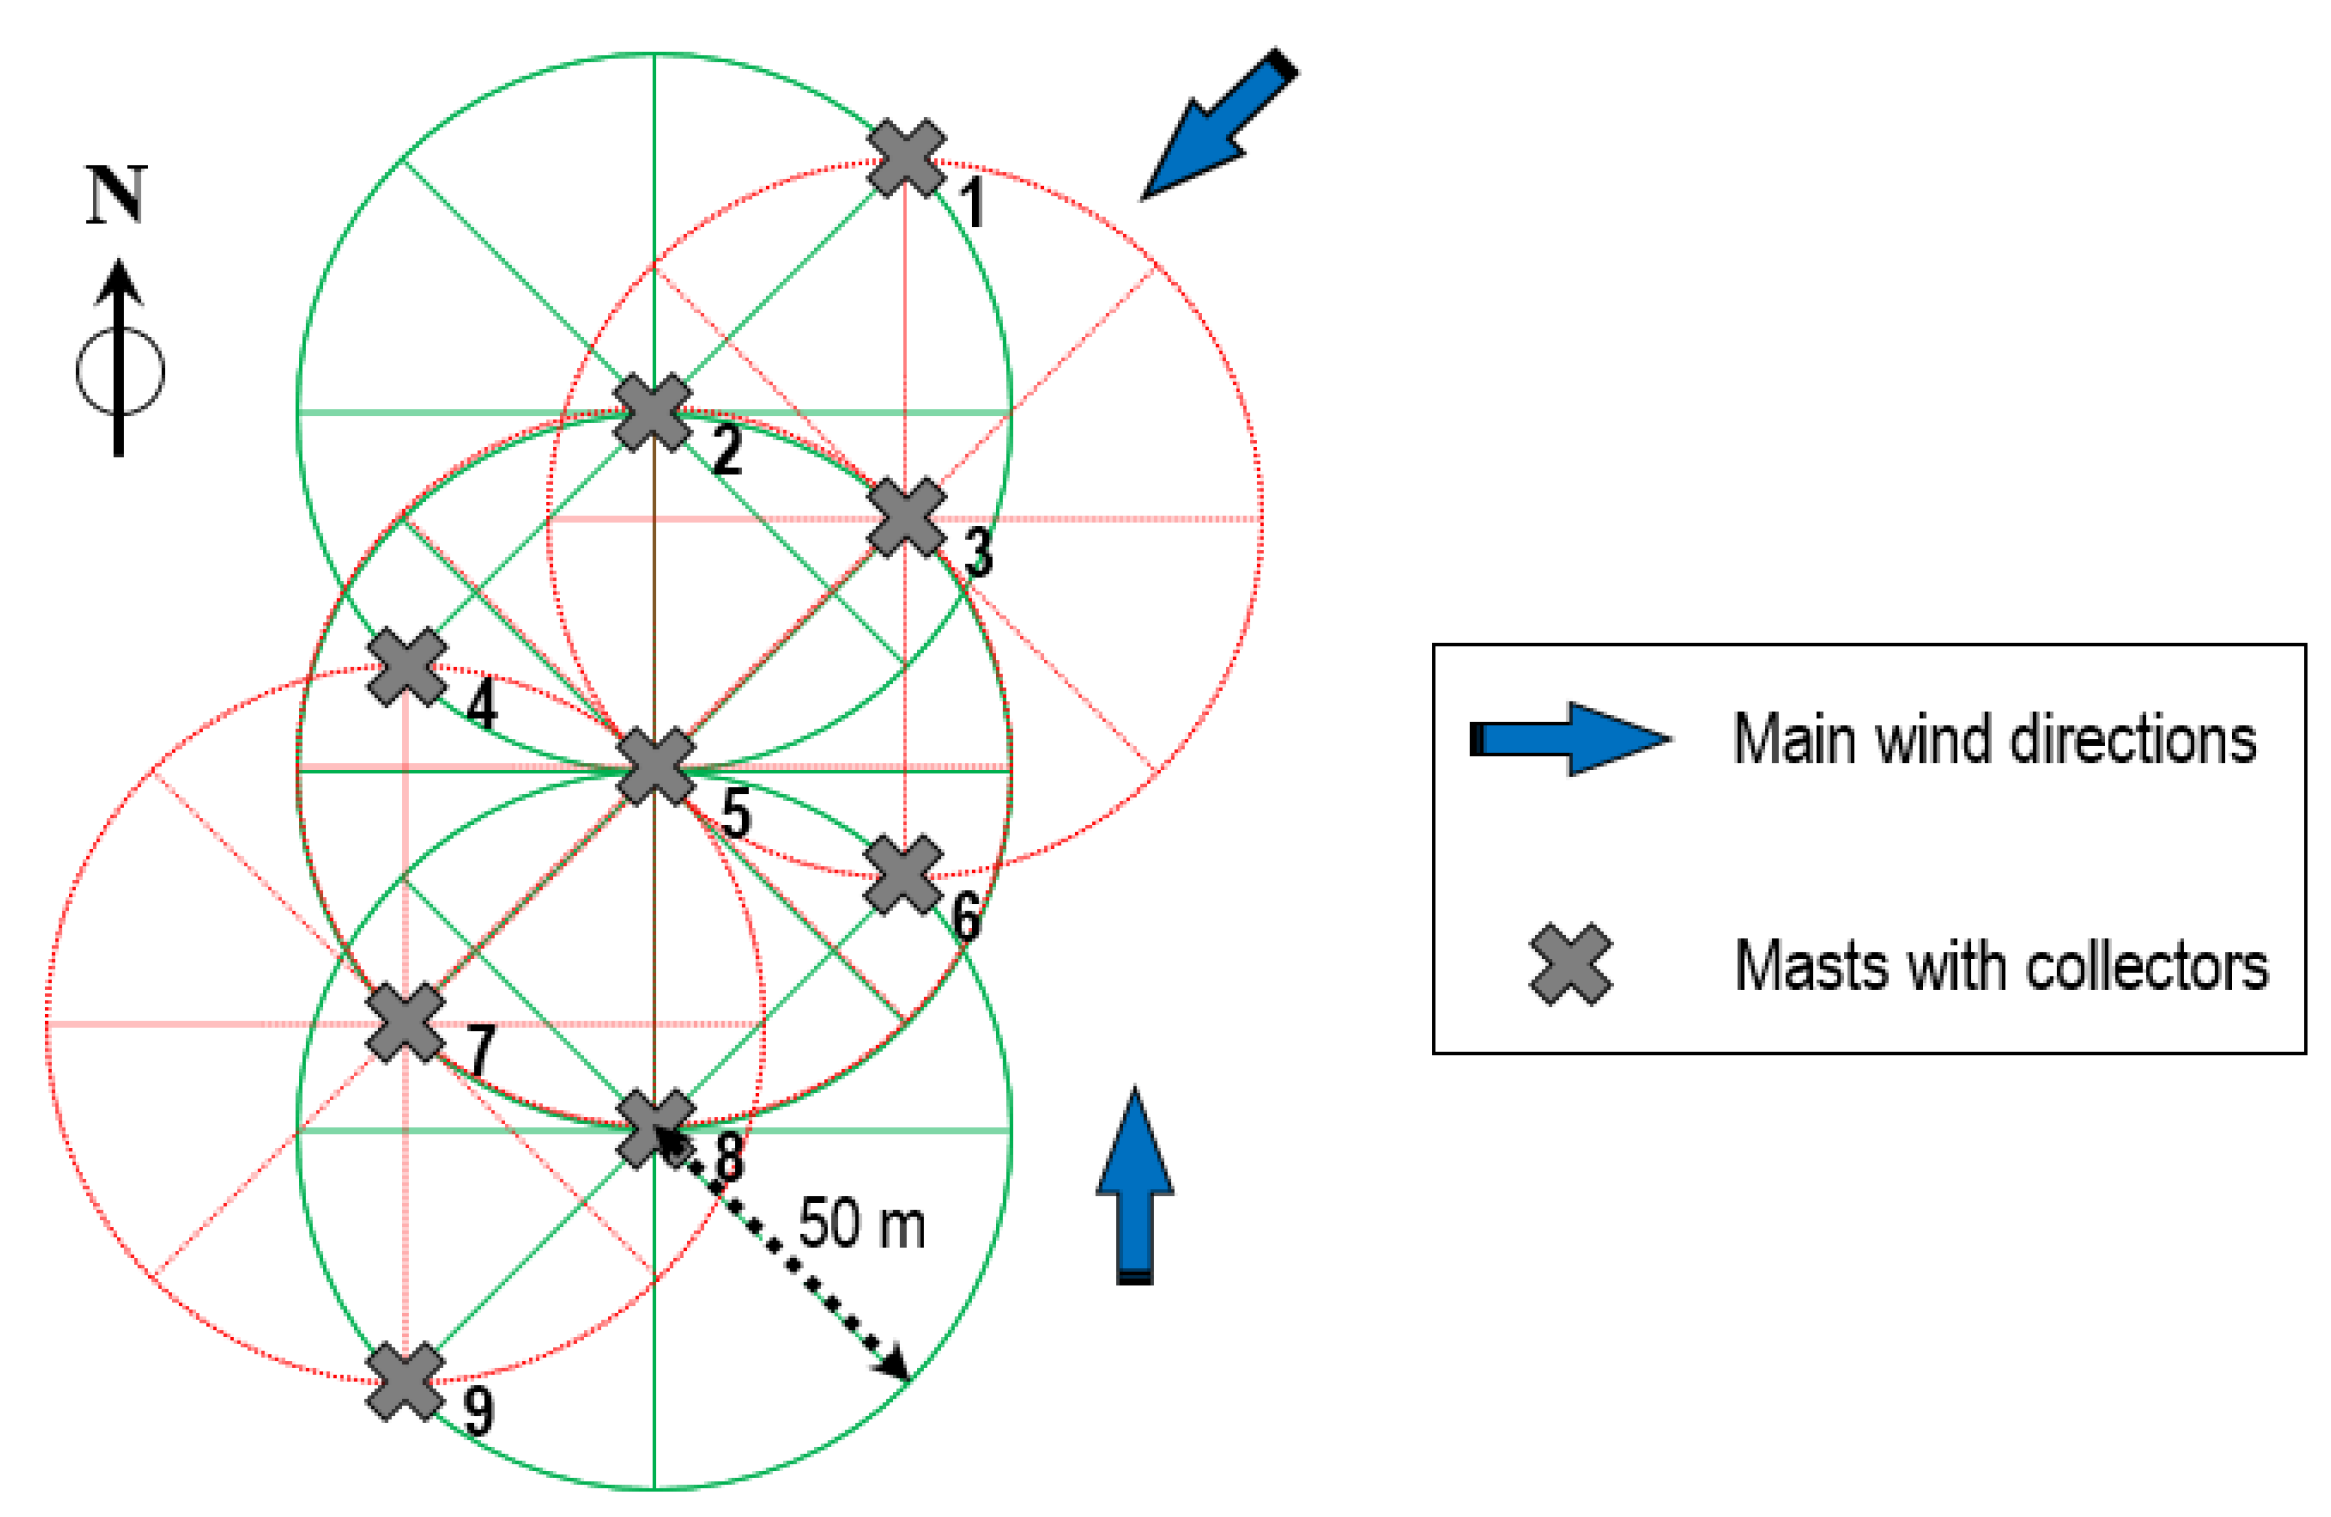
The collectors used were our own patented Multidirectional traps (MDt) [22] fabricated with an industrial 3D printer from a glycol-modified ethylene polyterephthalate (PETg) thermoplastic filament. PETg is a tough, hard, resistant and flexible material, good characteristics for generating devices subjected to mechanical stress. Each of these collectors is attached to a vaned mast (Figure 3). The air with the transported material enters the collectors through a rectangular 2 × 5 cm window where a grill inside slows down its movement, causing the transported material to sediment in a removable structure with a fixed ring-shaped base. Eight north-facing compartments in the ring differentiate the direction of origin of the captured materials. Figure 3 shows a diagram of this new collector design. According to Asensio et al. [7], the efficiency of the MDt collector (74%) is higher for fine grain sizes. Experiments with these collectors were performed for 24 consecutive hours. A network of nine vaned masts was mounted with the MDt traps placed at 0.35, 070, 1.05 and 1.40 m heights, so their inlets faced the main wind direction at all times. The masts were located 50 m apart to avoid interfering with each other. Figure 3 shows field distribution of the masts. Experiments were carried out for 24 h.
As the lowest collectors on the mast were placed at 0.35 m, the rate of soil lost from the ground had to be calculated empirically by using a mathematical model predicting sediment on the soil surface. Sediment flux (qz, kg m−2) at each trap height (z, m) was found by dividing the sediment weight (kg) caught by each collector at a given height by collector inlet area (0.001 m2). Then, total sediment flux was calculated (qz.exp, kg m−2) by an exponential equation, and after integrating the total sediment flux, the sediment transport rate (Qr, kg m−1) was calculated using Equation (1):
where:
h—maximum particle transportation height (m) recorded.
qo—amount of sediment modeled at z = 0 (kg m−2)
α– slope factor of exponential regression equation (m).
Total mass transport (Qt, kg) was calculated by Equation (2):
where:
η—trap efficiency
L—plot width.
The amount of material deposited or lost was calculated as the difference in the sediment transport rate between data from masts located windward and leeward in the main wind direction. Thus, negative differences indicated loss and positive, gains of material.
Although X-ray diffraction (XRD) is a semi-quantitative technique that can produce absolute errors, with standardized experimental conditions and interpretation, relative variations are reproducible. For powder samples, we used a “Davinci D8 Advance” diffractometer (Bruker Corporation, Madison, WI, USA) with copper radiation tube (CuKα, λ = 1.54 Å). The results were analyzed with the XPrep program and data were evaluated with the EVA program, both in the Diffract Evaluation 2.1 software package.
A non-parametric Wilcoxon signed-rank test was completed to determine differences in the amounts of sediments from different masts at the same height. We compared the total amount and the amount collected by the windward-oriented compartments.
3. Results
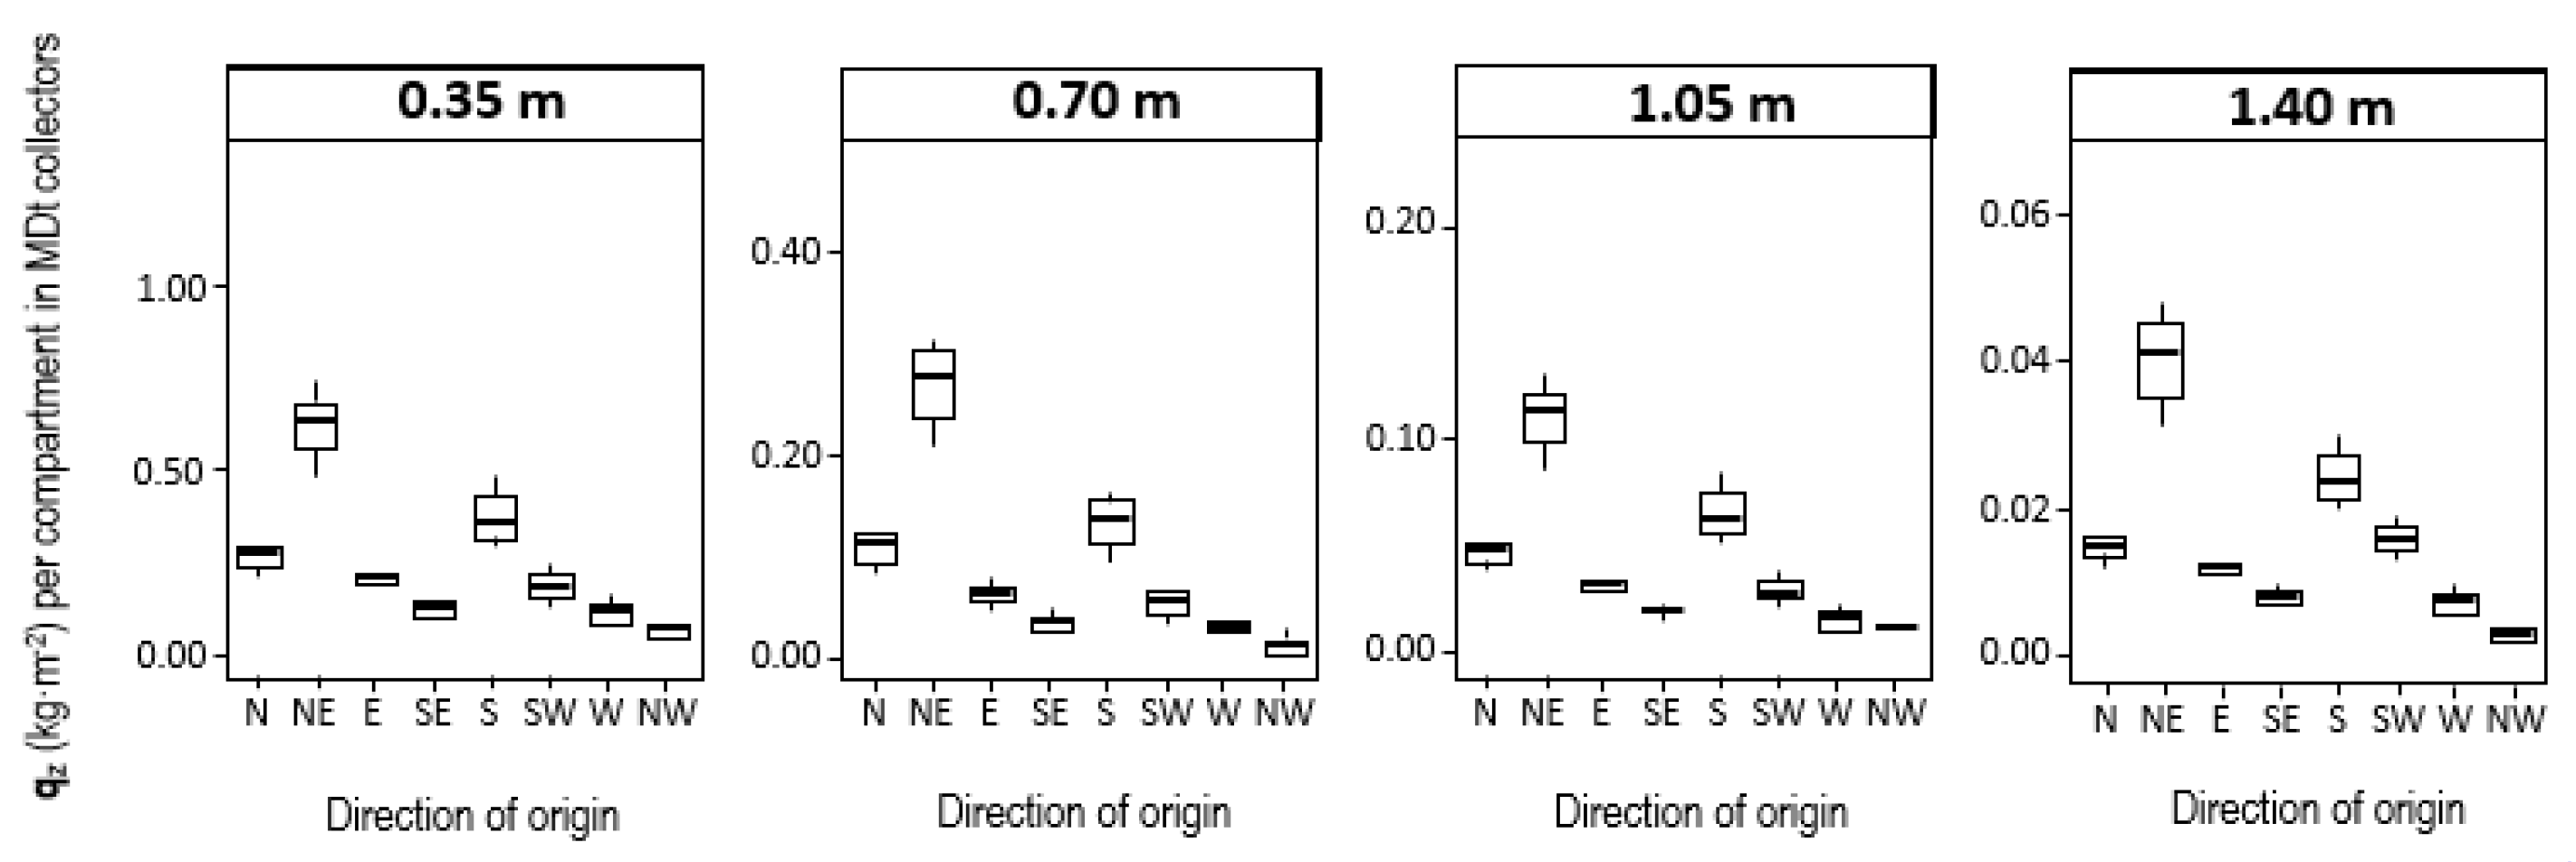
The means of the characteristics recorded for Anthrosols in the study area are shown in Table 1 as the average of four replicate samples. There is little surface stoniness, and gravel averages around 6%. Finely tilled Anthrosols have low silt and clay content. Sampling took place 5 days after tilling. Table 1 also recorded characteristics of surrounding windward soils (Leptosols and Calcisols), not always completely consolidated on the surface. Sediment flux per MDt collector compartment recorded by trap height and direction of origin are shown in Figure 4. Winds from the northeast and south are clearly predominant. Differences between material trapped in windward compartments and the total amount of material trapped by the MDt collectors at each height were not statistically significant (p-value > 0.05).
Table 1 shows the main characteristics for the most outstanding sediments in MDt compartments by direction of origin and catchment height, over Anthrosols.
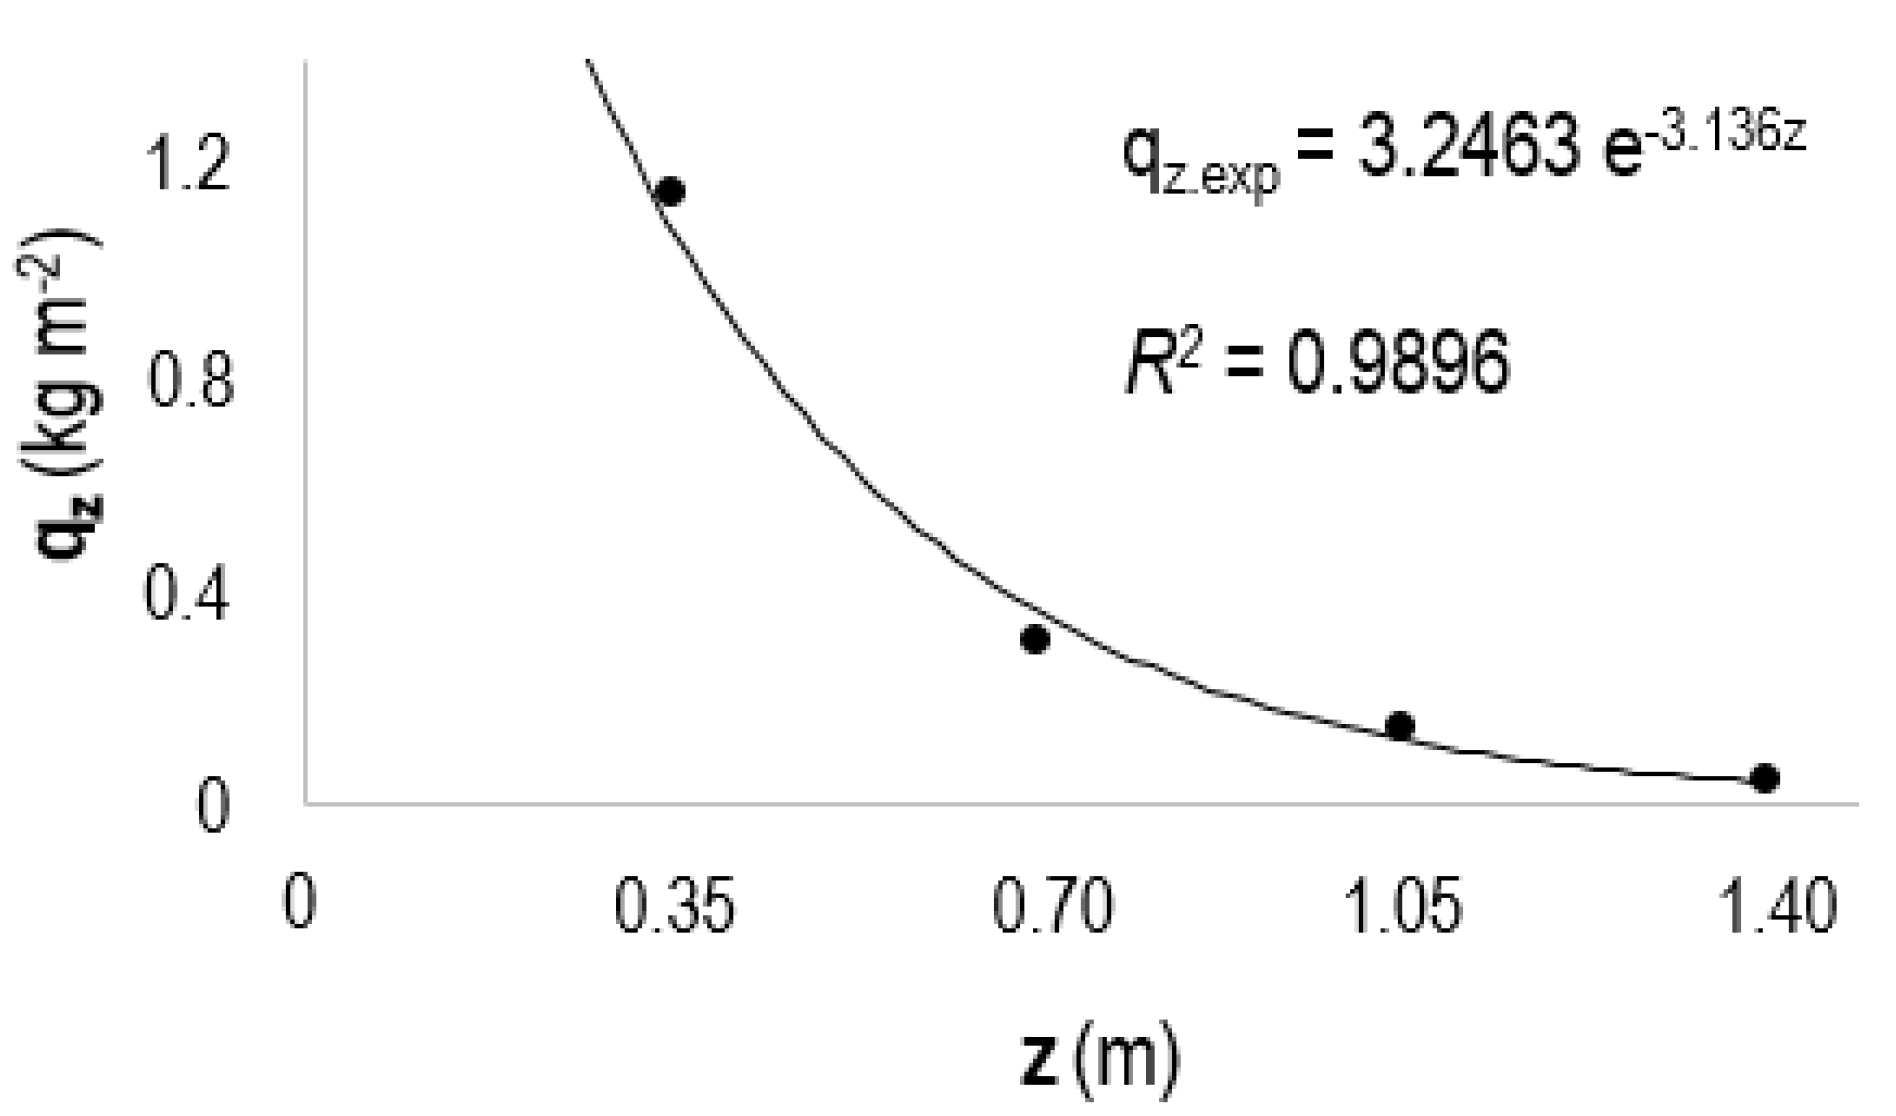
As described above, the MDt collectors (Figure 3) are able to differentiate the direction the trapped particles come from by their internal ring compartments. An example of estimated sediment flux is shown graphically in Figure 5. This is useful for predicting soil particles transported by creep, in this example, 3.2463 kg m−2, because the lowest trap height was 0.35 m. Sediment flux data were determined from the amount recorded in the windward compartments and the total amount corresponding to the whole collector (sum of all compartments). Sediment transport rates were found by integration. Even being aware of the limitations of the vertically integrated sediment flow estimation, we opted for this method because it will allow us to compare results with those obtained by other authors with the same method and similar climatic and edaphic conditions such as [20], in future works. Nevertheless, we assume that the sedimentary material transported into the lower layer is composed of very large grains of soil that cannot be transported very far and that a good estimate of the exported material can be assessed by considering only material transported above 0.35 cm. Thus, we use Equation 1 to integrate the flow of sediment not between 0 and 1.4 m, but between the lowest and the highest measurements completed, i.e., 0.35 and 1.4 m, which show much less uncertainty.
As there were two main wind directions (Figure 4 and Figure 6), northeast and south, we compiled a dataset of the differences between data from the masts located upwind and leeward in the main wind directions. The following differences in sediment transport rate were found for NE and S-oriented internal MDt collector compartments on the nine masts. By mast distribution (Figure 7), for sediments from the NE, the averaged differences were Mast 1 less Mast 2; Mast 2 less Mast 4; Mast 3 less Mast 5; Mast 5 less Mast 7; Mast 6 less Mast 8; Mast 8 less Mast 9. For sediments from the S, Mast 9 less Mast 7; Mast 7 less Mast 4; Mast 8 less Mast 5; Mast 5 less Mast 2; Mast 6 less Mast 3; Mast 3 less Mast 1. Table 2 shows the resulting sediment transport rate balance, which clearly indicates particle deposition when coming from the S (positive balance) and particle loss when from the NE (negative balance). When we take into account not only recorded values in the windward compartments but the TOTAL amount corresponding to the whole collector and related to the main wind direction (NE), the resulting balance denotes the general loss of material. Finally, Table 3 shows the results for the total mass transport.
The soils surrounding the Anthrosols are quite different. Therefore, we tested the mineralogy of the Anthrosols in front of the mast receiving sediments from the NE and S. Due to the small amount of sediment trapped for analysis, we mixed sediments from the nine masts at the same height and direction of origin in order to have enough material.
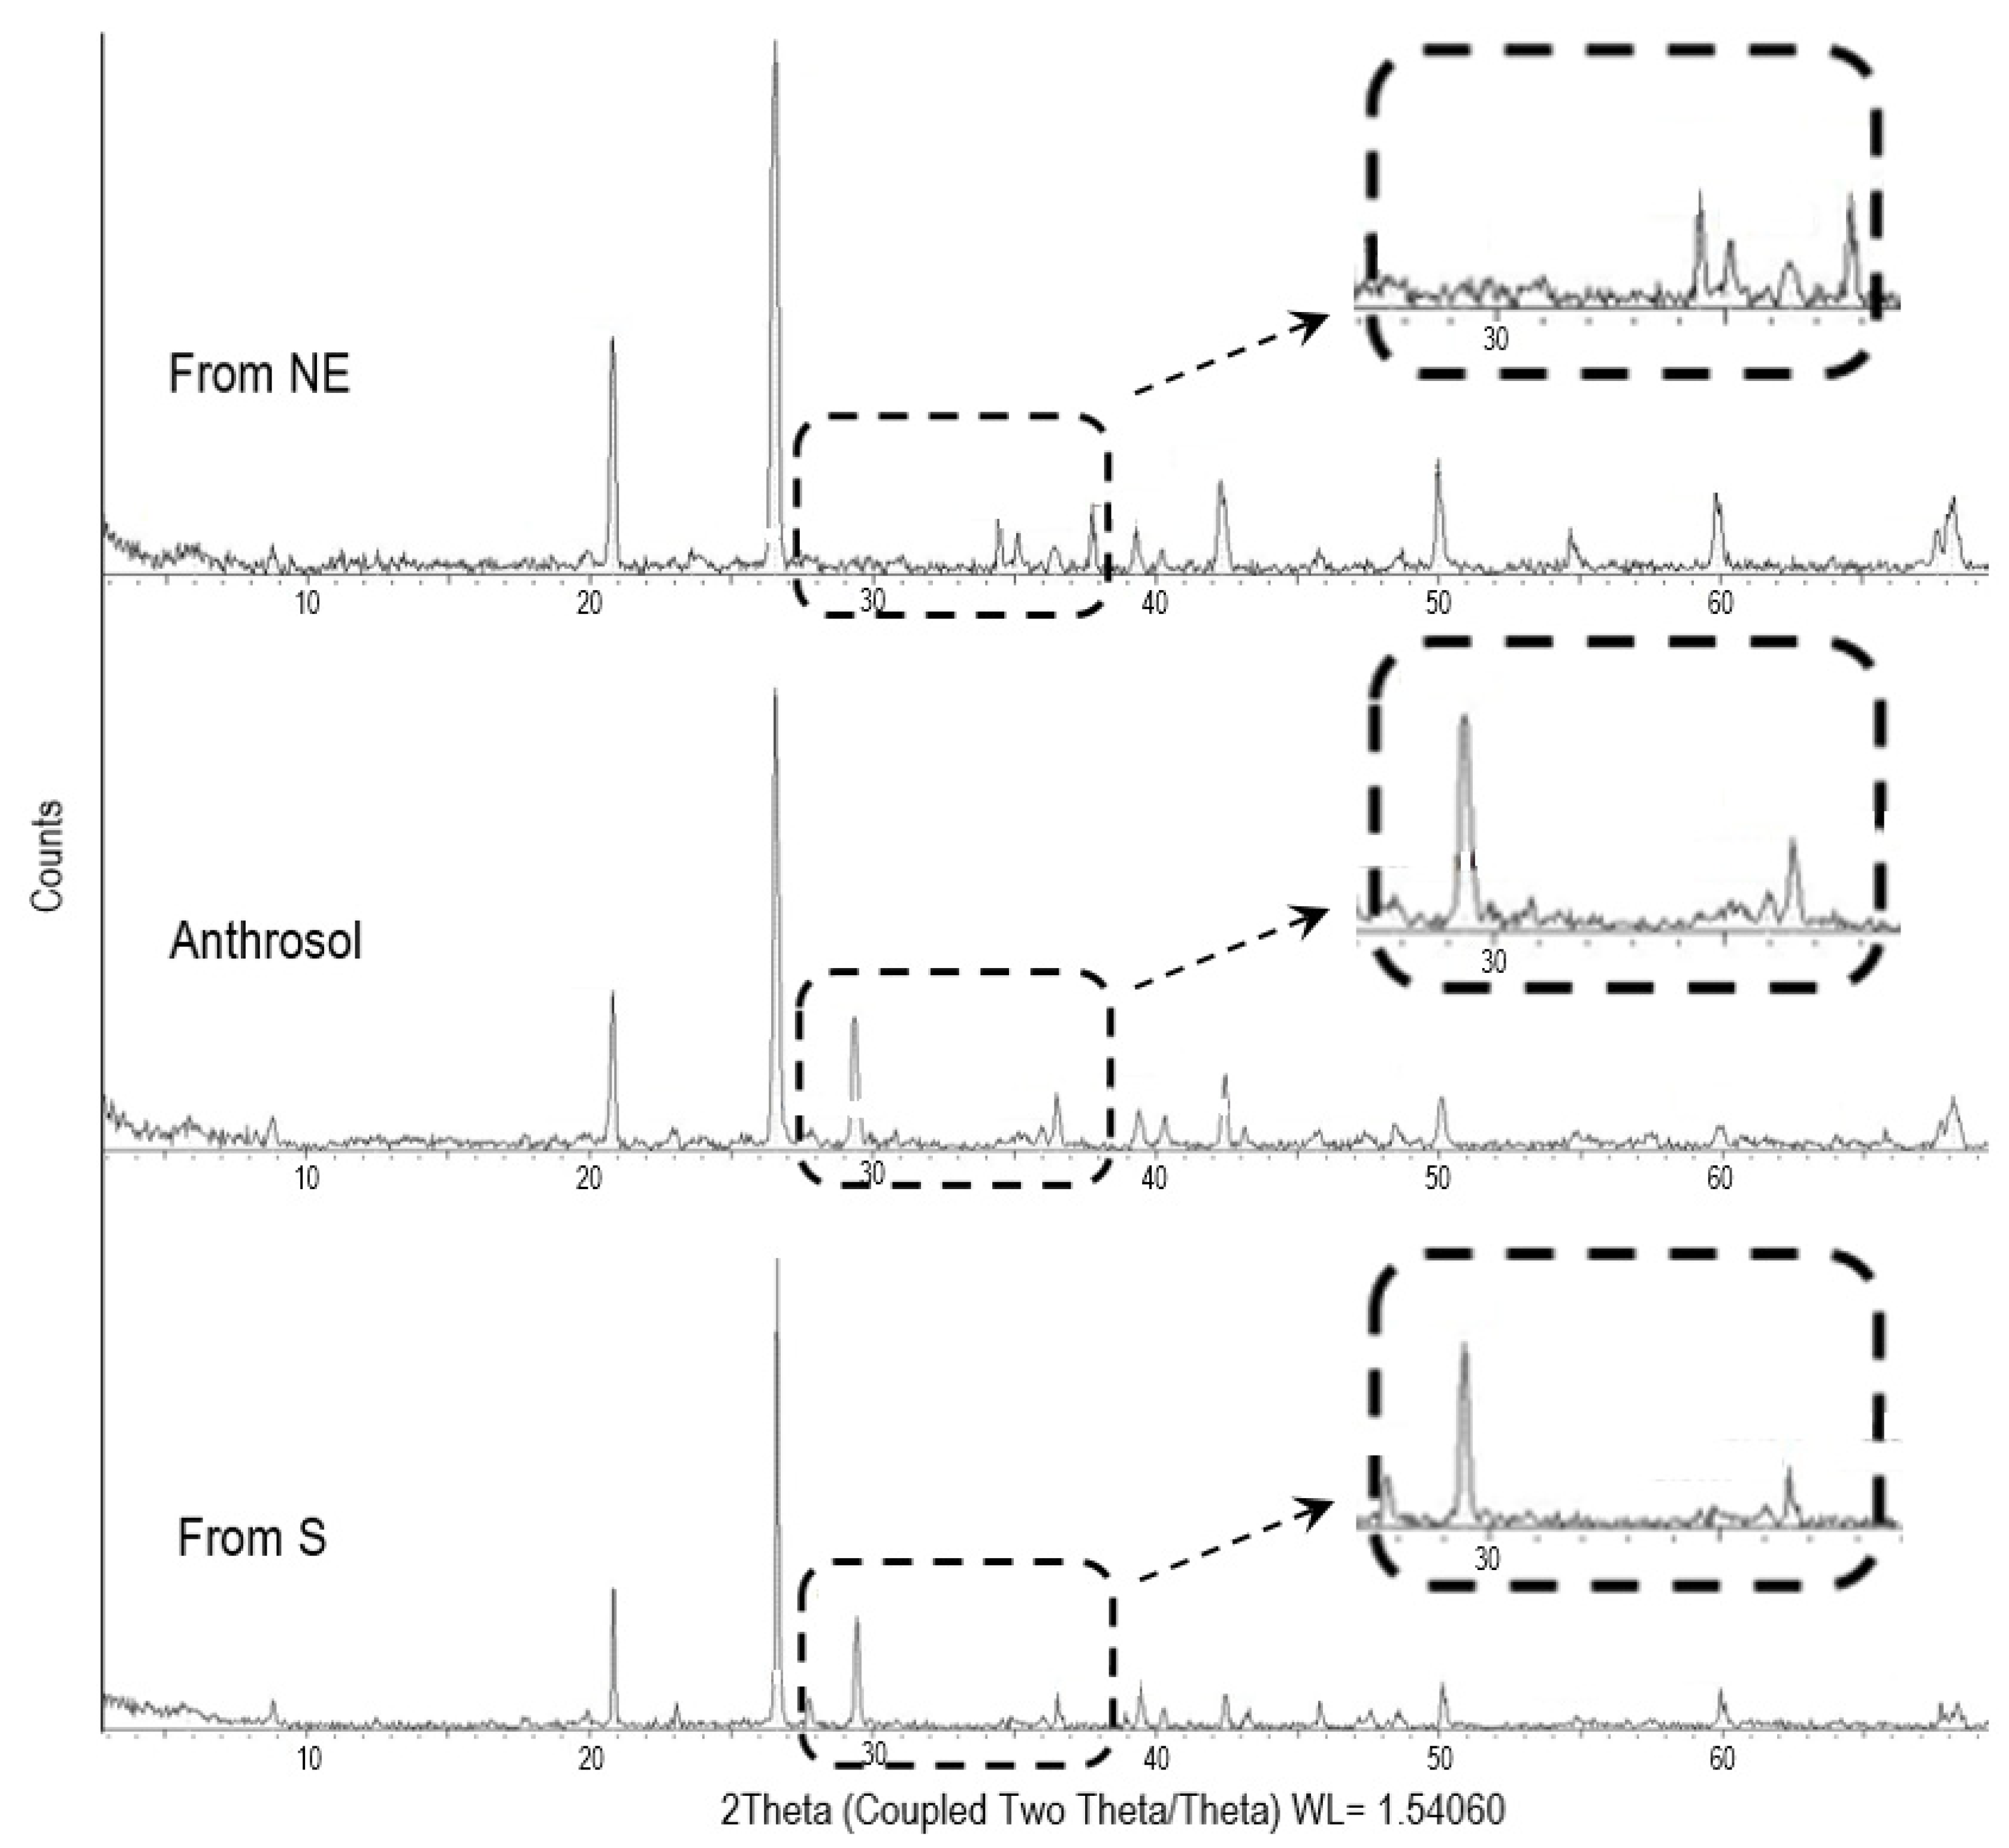
Along with organic matter, various colloidal minerals condition cation-exchange capacity in soils. Thus, loss of these components from wind erosion leads to a lower soil cation-exchange capacity, which requires them to be added as fertilizer to avoid loss of soil productivity [23,24]. It is therefore important to know what and how much of each soil mineral type is lost. When XRD was applied to our samples, a strong difference in the nature of constituents was observed, as shown in both the diffractograms (Figure 8) and in Table 4. Obtained values with the EVA program from the Diffract Evaluation 2.1 software package, although semi-quantitative, allow obtaining a general idea. Mineralogical relationships between Anthrosols and sediments coming through may have been influenced by deposits generated by continuous wind, mainly from the northeast (Figure 5 and Figure 7).
4. Discussion
Freshly plowed Anthrosols produce high emission flux due to partial breakdown of crust and clods, generating a high proportion of non-cohesive substrate, which increases the amount of wind-blown erodible material. As the organic matter content in these finely tilled soils is very low, mechanical reduction of aggregate sizes decreases aggregate stability, particularly under the dry soil conditions [25], increasing wind-erodible material on the soil surface, including nutrients [26]. This situation is aggravated due to the usually long droughts in the area. On the other hand, a physical crust develops within 9–11 days after tillage, decreasing loose soil wind-erodible materials [7].
Analysis of transport rates and balance of sediments from the south indicated that material was being deposited rather than lost. The lower total mass transport of sediments from the south is influenced by their constituents. A large amount of phyllosilicates was captured in the upper traps, which involves stronger sediment adhesiveness, and therefore, increases aggregation while decreasing their erodibility. Moreover, sediments coming from the south are rich in calcium carbonate, mainly calcite, which is a powerful aggregate, also decreasing their wind erodibility.
The opposite is the case of sediments coming from the northeast, with almost double the total mass transport. The higher amount in captured quartz, much more in lower traps, subserves abrasion processes that increase soil erodibility. Nevertheless, higher values of organic matter found in sediments from the NE bring on some aggregation which balances the material loss process.
The balance of loss and gain in organic matter and clay influences soil productivity, mainly responsible for cation-exchange capacity. In the end, the Anthrosols studied were affected by different inputs, depending on the dominant wind direction, either enriched with calcium carbonate by strong south winds or undergoing quartz movement by strong northeast winds.
Due to the total mass transport values found, further studies must be completed to evaluate, for example, the use of windbreaks to reduce soil wind erosion. Asensio et al. [27] used removable windbreaks following tillage, which reduced erosion until surface crusts formed, and also retained sediments transported by wind. They installed mesh with a 13 × 30/cm−2 thread count and 39% porosity, arranged perpendicular to the main natural wind direction, in alternating bands spaced 40 m apart, which reduced erosion by an average up to 72% at a height of 0.4 m in recently tilled olive groves. Due to their easy installation and dismantling, such plastic meshes can be widely employed in windy areas where they are not required permanently. However, that will be the object of further research.
5. Conclusions
The MDt collector is a wind-transported particle collector of our own design, is very efficient, and easily and economically manufactured. Inner compartments allow the main wind direction and its intensity to be found from their windward deposits. The results showed that wind-borne materials differed widely, depending on the main wind direction and height of blown material. In the case of the study of these Anthrosols from southeastern Spain, both calcium carbonate from Calcisols located to the south and quartz from Leptosols located to the northeast were transported close to the ground, while clay minerals were transported higher, so they moved further away. X-ray diffractograms of the sediments captured from the two main wind directions show a great disparity of components. The final balance on Anthrosols characteristics will depend on the intensity of loss or deposit of materials from windward surrounding Calcisols and Leptosols that act as a source of sediments due to the wind effect. The movement of material was qualitative and quantitative, requiring preventive measures to minimize soil degradation.
Author Contributions
Conceptualized, conceived and designed the experiments: R.G. and C.A.; Performed the experiments and formal analysis: R.G., A.I.M. and C.A.; Writing, original draft preparation: R.G., C.A. and J.L.V.; Writing, review and editing: C.A.; Supervision, grant management and funding acquisition, C.A. All authors have read and agreed to the published version of the manuscript.
Funding
This study was funded by the Andalusia Regional Government (P18-RT-5130 grant) and European Union ERDF funds.
Institutional Review Board Statement
Not applicable.
Informed Consent Statement
Not applicable.
Data Availability Statement
Not applicable.
Conflicts of Interest
The authors declare no conflict of interest.
References
- Novara, A.; Gristina, L.; Saladino, S.S.; Santoro, A.; Cerdà, A. Soil erosion assessment on tillage and alternative soil managements in a Sicilian vineyard. Soil Tillage Res. 2011, 117, 140–147. [Google Scholar] [CrossRef] [Green Version]
- Sharifikia, M. Environmental challenges and drought hazard assessment of Hamoun Desert Lake in Sistan region, Iran, based on the time series of satellite imagery. Nat. Hazards 2013, 65, 201–217. [Google Scholar] [CrossRef]
- Kravchenko, Y.S.; Chen, Q.; Liu, X.; Herbert, S.J.; Zhang, X. Conservation practices and management in Ukrainian mollisols. J. Agric. Sci. Technol. 2016, 16, 1455–1466. [Google Scholar]
- Yildiz, S.; Enç, V.; Kara, M.; Tabak, Y.; Acet, E. Assessment of the potential risks of airbone microbial contamination in solid recovered fuel plants: A case study in Istanbul. Environ. Eng. Manag. J. 2017, 16, 1415–1421. [Google Scholar]
- Panagos, P.; Van Liedekerke, M.; Jones, A.; Montanarella, L. European Soil Data Centre: Response to European policy support and public data requirements. Land Use Policy 2012, 29, 329–338. [Google Scholar] [CrossRef]
- Touré, A.A.; Rajot, J.L.; Garba, Z.; Marticorena, B.; Petit, C.; Sebag, D. Impact of very low crop residues cover on wind erosion in the Sahel. Catena 2011, 85, 205–214. [Google Scholar] [CrossRef]
- Asensio, C.; Lozano, F.J.; Ortega, E.; Kikvidze, Z. Study on the effectiveness of an agricultural Technique based on aeoliandeposition, in a semiarid environment. Environ. Eng. Manag. J. 2015, 14, 1143–1150. [Google Scholar] [CrossRef]
- De Oro, L.A.; Buschiazzo, D.E. Threshold wind velocity as an index of soil susceptibility to wind erosion under variable climatic conditions. Land Degrad. Dev. 2009, 20, 14–21. [Google Scholar] [CrossRef]
- Borrelli, P.; Panagos, P.; Ballabio, C.; Lugato, E.; Weynantgs, M.; Montanarella, L. Towards a Pan-European assessment of land susceptibility to wind erosion. Land Degrad. Dev. 2016, 27, 1093–1105. [Google Scholar] [CrossRef]
- Weber, J.; Kocowicz, A.; Debicka, M.; Jamroz, E. Changes in soil morphology of Podzols affected by alkaline fly ash blown out from the dumping site of an electric power plant. J. Soils Sediments 2017, 17, 1852–1861. [Google Scholar] [CrossRef] [Green Version]
- Colazo, J.C.; Buschiazzo, D.E. Soil dry aggregate stability and wind erodible fraction in a semiarid environment of Argentina. Geoderma 2010, 159, 228–236. [Google Scholar] [CrossRef]
- Colazo, J.C.; Buschiazzo, D.E. The impact of agriculture on soil texture due to wind erosion. Land Degrad. Dev. 2015, 26, 62–70. [Google Scholar] [CrossRef]
- Zobeck, T.M.; Baddock, M.; Van Pelt, R.S.; Tatarko, J.; Acosta-Martínez, V. Soil property effects on wind erosion of organic soils. Aeolian Res. 2013, 10, 43–51. [Google Scholar] [CrossRef]
- Molchanov, E.N.; Savin, I.Y.; Yakovlev, A.S.; Bulgakov, D.S.; Makarov, O.A. National approaches to evaluation of the degree of soil degradation. Eurasian Soil Sci. 2015, 48, 1268–1277. [Google Scholar] [CrossRef]
- Goossens, D.; Offer, Z.; London, G. Wind tunnel and field calibration of five aeolian sand traps. Geomorphology 2000, 35, 233–252. [Google Scholar] [CrossRef]
- Fryrear, D.W. A field dust sampler. J. Soil Water Conserv. 1986, 41, 117–120. [Google Scholar]
- Wilson, S.J.; Cook, R.U. Wind erosion. In Soil Erosion; Kirkby, M.J., Morgan, R.P.C., Eds.; Wiley: Chichester, UK, 1980; pp. 217–251. [Google Scholar]
- Zobeck, T.M.; Sterk, G.; Funk, R.; Rajot, J.L.; Stout, J.E.; Van Pelt, R.S. Measurement and data analysis methods for field-scale wind erosion studies and model validation. Earth Surf. Process. Landf. 2003, 28, 1163–1188. [Google Scholar] [CrossRef]
- Mendez, M.J.; Funk, R.; Buschiazzo, D.E. Field wind erosion measurements with Big Spring Number Eight (BSNE) and Modified Wilson and Cook (MWAC) samplers. Geomorphology 2011, 129, 43–48. [Google Scholar] [CrossRef]
- Basaran, M.; Erpul, G.; Uzun, O.; Gabriels, D. Comparative efficiency testing for a newly designed cyclone type sediment trap for wind erosion measurements. Geomorphology 2011, 130, 343–351. [Google Scholar] [CrossRef]
- Marin, C. Estructura y Evolucion Tectonica Reciente del Campo de Dalias y de Nijar en el Contexto del Limite Meridional de las Cordilleras Beticas Orientales. Ph.D. Thesis, Universidad de Granada, Granada, Spain, 2005. [Google Scholar]
- Asensio, C.; López, J.; Lozano, F.J. Colector Multidireccional de Partículas Transportadas por el Viento [Multidirectional Collector of Particles Carried by the Wind]. Spanish Office of the Patents and Brand. Ref. ES 2 470 090 B1, 17 April 2015. [Google Scholar]
- Gallardo, P.; Salazar, J.; Lozano, F.J.; Navarro, M.C.; Asensio, C. Economic impact of nutrient losses from wind erosion of cereal soils in Southeast Spain. Int. J. Environ. Res. 2016, 10, 333–340. [Google Scholar]
- Segovia, C.; Gómez, J.D.; Gallardo, P.; Lozano, F.J.; Asensio, C. Soil nutrients losses by wind erosion in a citrus crop at Southeast Spain. Eurasian Soil Sci. 2017, 50, 756–763. [Google Scholar] [CrossRef]
- Marzen, M.; Iserloh, T.; Fister, W.; Seeger, M.; Rodrigo Comino, J.; Ries, J.B. On-site water and wind erosion experiments reveal relative impact on total soil erosion. Geosciences 2019, 9, 478. [Google Scholar] [CrossRef] [Green Version]
- Katra, I.; Gross, A.; Swet, N.; Tanner, S.; Krasnov, H.; Angert, A. Substantial dust loss of bioavailable phosphorus from agricultural soils. Sci. Rep. 2016, 6, 24736. [Google Scholar] [CrossRef] [PubMed] [Green Version]
- Asensio, C.; Weber, J.; Lozano, F.J.; Mielnik, L. Laser-scanner use into a wind tunnel to quantify soil erosion. Int. Agrophys. 2019, 33, 227–232. [Google Scholar] [CrossRef]
Figure 1.
Location of study area.

Figure 2.
(a) Lithological location [21]; (b) soils map; (c) south view (from Anthrosols), with a wind tunnel of a former study; (d) northeast view.
Figure 2.
(a) Lithological location [21]; (b) soils map; (c) south view (from Anthrosols), with a wind tunnel of a former study; (d) northeast view.

Figure 3.
MDt collector schemes. Photo: mast and vane with collectors at different heights.

Figure 4.
Sediment flux (qz) per MDt collector compartment by trap height and direction of origin.

Figure 5.
Example of estimated sediment fluxes.

Figure 6.
Locations of soil types and main wind directions.

Figure 7.
Field mast distribution and main wind directions.

Figure 8.
Comparative X-ray diffractograms of Anthrosols and sediments in MDt compartments.


Table 1.
Characteristics of soils and sediments in MDt compartments.
| Sample | Very Coarse Sand (2000–1000 µm) | Coarse Sand (1000–500 µm) | Medium Sand (500–250 µm) | Fine Sand (250–100 µm) | Very Fine Sand (100–50 µm) | Coarse Silt (50–20 µm) | Fine Silt (20–2 µm) | Clay (<2 µm) | O.M. | CO3= |
|---|---|---|---|---|---|---|---|---|---|---|
| (g·kg−1) | (%) | |||||||||
| LPe | 15.1 | 13.8 | 21.9 | 23.7 | 6.2 | 5.3 | 3.8 | 10.2 | 43.4 | 18 |
| ATh | 5.6 | 11.4 | 23.2 | 29.2 | 20.3 | 0.7 | 2.4 | 7.2 | 29.0 | 24 |
| CLh | 6.6 | 6.2 | 9.3 | 18.8 | 22.1 | 7.1 | 12.3 | 17.6 | 16.8 | 41 |
| NE-35 | 0.1 | 0.7 | 5.8 | 11.9 | 30.3 | 18.3 | 11 | 21.9 | 42.4 | 16 |
| NE-70 | 0 | 0.2 | 1.2 | 6.3 | 36.1 | 20.5 | 13.5 | 22.2 | 43.4 | 15 |
| NE-105 | 0 | 0 | 0 | 0.5 | 37.2 | 21.3 | 15.4 | 25.6 | 39.1 | 13 |
| NE-140 | 0 | 0 | 0 | 0 | 18.3 | 23.8 | 26.6 | 31.3 | 34.7 | 11 |
| S-35 | 0 | 0.1 | 1.8 | 3.1 | 17.9 | 21.8 | 27 | 28.3 | 19.3 | 41 |
| S-70 | 0 | 0 | 0.4 | 2.7 | 19.9 | 23.6 | 27.5 | 25.9 | 16.9 | 39 |
| S-105 | 0 | 0 | 0 | 0 | 14.3 | 27.6 | 30.2 | 27.9 | 15.5 | 39 |
| S-140 | 0 | 0 | 0 | 0 | 7.6 | 29.8 | 32.4 | 30.2 | 14.7 | 37 |
Note: MDt compartment sediment labels include direction of origin and catchment height in cm.
Table 2.
Sediment transport rate (Qr) balance.
| Sample | Qr Balance |
|---|---|
| From NE | −0.0103 |
| From S | 0.0079 |
| TOTAL | −0.0154 |
Table 3.
Total mass transport (Qt).
| Sample | Qt (kg) | |||||||||
|---|---|---|---|---|---|---|---|---|---|---|
| 1 | 2 | 3 | 4 | 5 | 6 | 7 | 8 | 9 | Average | |
| From NE | 5.2630 | 5.6465 | 5.2825 | 6.1257 | 6.4422 | 5.7794 | 7.0211 | 6.5873 | 7.2174 | 6.1517 |
| From S | 3.0560 | 3.3691 | 3.1766 | 3.5059 | 3.8438 | 3.4755 | 4.0768 | 3.7701 | 4.1908 | 3.6072 |
| TOTAL | 16.9775 | 18.8218 | 17.8462 | 19.2632 | 21.4739 | 19.5251 | 22.6488 | 20.7148 | 23.2820 | 20.0615 |
Table 4.
Mineralogical components for Anthrosols and sediments in MDt compartments.
| Sample | Smectite/ Vermiculite (%) | Illite (%) | Kaolinite (%) | Calcite (%) | Dolomite (%) | Quartz (%) | Feldspar (%) | Others (%) |
|---|---|---|---|---|---|---|---|---|
| ATh | 13 | 18 | 12 | 16 | 3 | 27 | 6 | 5 |
| NE-35 | 11 | 13 | 15 | 5 | 2 | 47 | 5 | 2 |
| NE-70 | 12 | 12 | 18 | 3 | 1 | 45 | 7 | 2 |
| NE-105 | 16 | 14 | 17 | 2 | 1 | 39 | 10 | 1 |
| NE-140 | 16 | 18 | 19 | 1 | 0 | 34 | 12 | 0 |
| S-35 | 21 | 14 | 7 | 26 | 5 | 17 | 6 | 4 |
| S-70 | 24 | 19 | 7 | 23 | 3 | 15 | 5 | 4 |
| S-105 | 27 | 27 | 9 | 14 | 2 | 16 | 4 | 1 |
| S-140 | 30 | 28 | 10 | 11 | 1 | 15 | 4 | 1 |
Note: Sediment trap data labels include direction of origin and catchment height in cm.
Publisher’s Note: MDPI stays neutral with regard to jurisdictional claims in published maps and institutional affiliations. |
© 2021 by the authors. Licensee MDPI, Basel, Switzerland. This article is an open access article distributed under the terms and conditions of the Creative Commons Attribution (CC BY) license (https://creativecommons.org/licenses/by/4.0/).
Share and Cite
MDPI and ACS Style
Guerrero, R.; Valenzuela, J.L.; Monterroso, A.I.; Asensio, C. Impact of Wind Direction on Erodibility of a Hortic Anthrosol in Southeastern Spain. Agriculture 2021, 11, 589. https://0-doi-org.brum.beds.ac.uk/10.3390/agriculture11070589
AMA Style
Guerrero R, Valenzuela JL, Monterroso AI, Asensio C. Impact of Wind Direction on Erodibility of a Hortic Anthrosol in Southeastern Spain. Agriculture. 2021; 11(7):589. https://0-doi-org.brum.beds.ac.uk/10.3390/agriculture11070589
Chicago/Turabian StyleGuerrero, Rocío, Juan L. Valenzuela, Alejandro I. Monterroso, and Carlos Asensio. 2021. "Impact of Wind Direction on Erodibility of a Hortic Anthrosol in Southeastern Spain" Agriculture 11, no. 7: 589. https://0-doi-org.brum.beds.ac.uk/10.3390/agriculture11070589
Note that from the first issue of 2016, this journal uses article numbers instead of page numbers. See further details here.