Article

Scheduling Regulated Deficit Irrigation with Leaf Water Potential of Cherry Tomato in Greenhouse and its Effect on Fruit Quality

by
Leontina Lipan
1,†,
Hanán Issa-Issa
1,†,
Alfonso Moriana
2,3,
Noemí Medina Zurita
2,
Alejandro Galindo
2,3,
María José Martín-Palomo
2,3,
Luis Andreu
2,3,
Ángel A. Carbonell-Barrachina
1,
Francisca Hernández
4 and
Mireia Corell
2,3,*
1
Research Group “Food Quality and Safety”, Centro de Investigación e Innovación Agroalimentaria y Agroambiental (CIAGRO-UMH), Miguel Hernández University, Carretera de Beniel, km 3.2, 03312 Orihuela, Spain
2
Departamento de Agronomía, ETSIA, Universidad de Sevilla, Carretera de Utrera, km 1, 41004 Sevilla, Spain
3
Unidad Asociada al CSIC de Uso Sostenible del Suelo y el Agua en la Agricultura (US-IRNAS), Carretera de Utrera, km 1, 41004 Sevilla, Spain
4
Grupo de Investigación en Fruticultura y Técnicas de Producción, Centro de Investigación e Innovación Agroalimentaria y Agroambiental (CIAGRO-UMH), Miguel Hernández University, Carretera de Beniel, km 3.2, 03312 Orihuela, Spain
*
Author to whom correspondence should be addressed.
These authors contribute equal to work.
Submission received: 31 May 2021 / Revised: 9 July 2021 / Accepted: 12 July 2021 / Published: 15 July 2021
(This article belongs to the Special Issue Future of Irrigation in Agriculture)

Abstract

:
The tomato cultivated surface is one of the most important surfaces in the world. This crop needs a sufficient and continuous supply of water during vegetative growth. Therefore, production may be at risk in warm and water-scarce areas. Therefore, the implementation of irrigation alternatives such as regulated deficit irrigation (RDI) is of great importance to reduce the use of water and improve the production of the quality of tomatoes. The objective of this work was to evaluate the deficit irrigation scheduling using plant water status as a tool in deficit irrigation. Experimental design was a randomized design with four replications per treatment. Two irrigation treatments were applied: Control (125% of crop evapotranspiration (ETc)) and Regulated Deficit Irrigation (RDI). This latter treatment considered different threshold values of midday leaf water depending on crop phenological stage. No differences were observed in yield, with RDI treatment being more efficient in the use of irrigation water than the control. Besides, RDI tomatoes presented, in general, greater weight, size, Total soluble solids (TSS), sugars, antioxidant activity, lycopene, β-Carotene, and redder color with more intense tomatoes flavor. Finally, it might be said that RDI strategy helped to reduce 53% of irrigation water and to improve the nutritional, functional, and sensory quality of tomatoes.

1. Introduction

Currently, horticulture is affected by climatic changes such as heatwaves, droughts, hailstorms, heavy rains, etc. Semi-arid and Mediterranean climates are affected by the decrease in the availability of water for irrigation due to the deep intensity of droughts [1]. In addition, in these semi-arid areas, they are generally characterized by increased evapotranspiration, higher soil salinity, and limited water availability, which is why an increase in the efficiency of water use is necessary [2].
Therefore, water is becoming the main limitation for agricultural recreation in many regions worldwide, particularly in arid and semi-arid areas. Irrigated agriculture consumes approximately 70% of the water that is extracted in the world. However, crops represent less than 60% of the water that is used for irrigation. The world population is increasing more and more. This implies that there is an increase in food consumption, which, consequently, produces a greater consumption of water in agriculture. As a result of this water, resources are being pushed to the limit, causing a serious problem in the world. Thus, Wu et al. argue that there is an urgent need to efficiently use water in agriculture [3].
For this reason, to ensure this essential resource, it will be of great importance to implement strategies that help to optimize the use of water in those irrigated areas. This water sustainability will help to ensure that agricultural activity maintains its development and competitiveness for a long time. A good alternative may be the incorporation of those crops that are more tolerant to drought and the implementation of deficit irrigation (DI) strategies [4].
Deficit irrigation (DI) is a system that is generally applied to create a relationship between the amount of water used for irrigation and the crop optimal performance. This consists of applying water below the plant water requirements, which is marked by evapotranspiration (ETc) [5]. There are many types of DI, of which the most used are: (i) Sustainable Deficit Irrigation (SDI)—continuous reduction of water throughout the cultivation period and (ii) Regulated Deficit Irrigation (RDI)—reduction conducted during a specific period or stage of the crop phenology [2]. This irrigation system can be achieved by providing less than 100% crops evapotranspiration (ETc) either during the growth period (sustained DI) or during the less sensitive phase of the growing cycle [6]. Overall, producing fruits and vegetables using DI will positively contribute to the sustainability of this natural resource.
The tomato plant (Lycopersicon esculentum) is native to Latin America, and more specifically to countries with tropical climates such as Peru and Ecuador. Its name is derived from the Aztec word xitomate or zitotomate. At the beginning of the 16th century, it was brought to Europe, and in the 18th century to North America, and from there, it spread throughout the world. It belongs to the Solanaceae family and is one of the most widely consumed fruits worldwide [7]. According to the FAO, 2020, in 2016, it exceeded 177 million tons of world production, and in 2018, Spain was the eighth largest producer worldwide, reaching a production of approximately 5,000,000 tons [8].
The importance of water reduction in tomato crop is of high importance as this fruit is the second most consumed vegetable crop worldwide after potato, and because it is a model crop in the research of the physiology of fleshy fruits [9]. Their consumption is mainly based on the tomato sensory properties and on its health-promoting compounds. Tomatoes contain a large content of antioxidant components that can be nutritional (vitamins A, C, and E) and non-nutritional (carotenoids, flavonoids, flavone, total phenolic compounds, etc.) compounds. One of these antioxidants is lycopene, which is a natural carotenoid responsible for providing the red color of tomatoes and helps to prevent cardiovascular diseases and cancer. For this reason, tomato consumption has increased, since consumers are fully aware of these benefits [10].
Similarly, the contents of biochemical compounds are key elements in determining the sensory quality of the fruit, which is determined by its appearance (morphology and color) and flavor, including aroma and taste (volatile compounds, organic acids, and sugars). Two of the quality factors that have the most significance for the food industry and for consumers are sourness and sweetness, which are related to the content mainly of glucose and fructose (sugars) and of citric and malic acid (organic acids). The interaction between volatile compounds, sugars, and organic acids, results in the typical flavor of fresh tomatoes. Although more than 400 volatile compounds have been identified, only a small group contributes to the characteristic odor and aroma (perception of volatile compounds with the food outside and inside the mouth, respectively) of tomato [11].
Cherry tomatoes (Solanum lycopersicum var. cerasiforme) are one of the most valuable and consumed types of tomatoes because of their small size, easiness to be eaten and intense flavor. This variety has been found to have a higher content of volatile compounds, organic acids, and sugars than regular tomatoes [12].
Tomatoes are cultivated in open field and as a greenhouse crop. However, for achieving optimum climatic conditions for growth within greenhouses, a lot of inputs required such as energy, water, and fertilizers. The water requirements are not differed significantly with other crops such as cucumber. In semi-arid regions such as the Mediterranean basin, there is a need for deficit irrigation to optimize the use of water and the productivity of these crops.
Therefore, there is a need to optimize the use of irrigation water to maintain or even increase the quality and production of cherry tomato plants, cultivar “Summerbrix” by implementing the most appropriate deficit irrigation strategy.

2. Materials and Methods

2.1. Plant Material and Experimental Design

Experiment was carried out in spring 2020 (January 30 to June 24) in a greenhouse at Escuela Técnica Superior Agronomic Engineering (E.T.S.I.A.) located at the University of Sevilla (Seville, Spain, 37° 21′09.71” Lat. N, 5° 56′19.13” Long. W, 33m a.s.l.). The greenhouse was a multi-tunnel with side and overhead ventilation. Covered with a multilayer sheet of EVA/EBA copolymers (INSASOL PLUS, from Solplast. Lorca, Murcia, Spain). The tomato plants, cultivar Summerbrix (Fito®), were grown in clay loam soil characterized by 28% sand; 33% silt and 38% clay; pH 7.36; total nitrogen 0.32%; organic matter 2.08%; electric conductivity 356 µS/cm (1:5pV); phosphorus 221 mg/Kg. Climatic conditions were monitored inside the greenhouse. Two sensors recorded mean, maximum and minimum values of temperature (T, °C) and relative humidity of the air (RH%). These sensors were linked to a data logger (CD-1000 from Campbell Scientific, Logan, UT, USA). The experiment comprised a randomized complete-block design, with two irrigation treatments and four repetitions per treatment. The trial had eight plots, with 30 plants per plot and a density of 2 plants per square meter. Irrigation was done by dripping (4 L·h−1), with 2 drippers per square meter, with two daily irrigations. Amount of water was controlled by solenoid valves in each plot. For the irrigation cuts that had the Regulated Deficit Irrigation (RDI) treatment, they were made using the stopcocks placed in each irrigation line.
Irrigation treatments applied were:
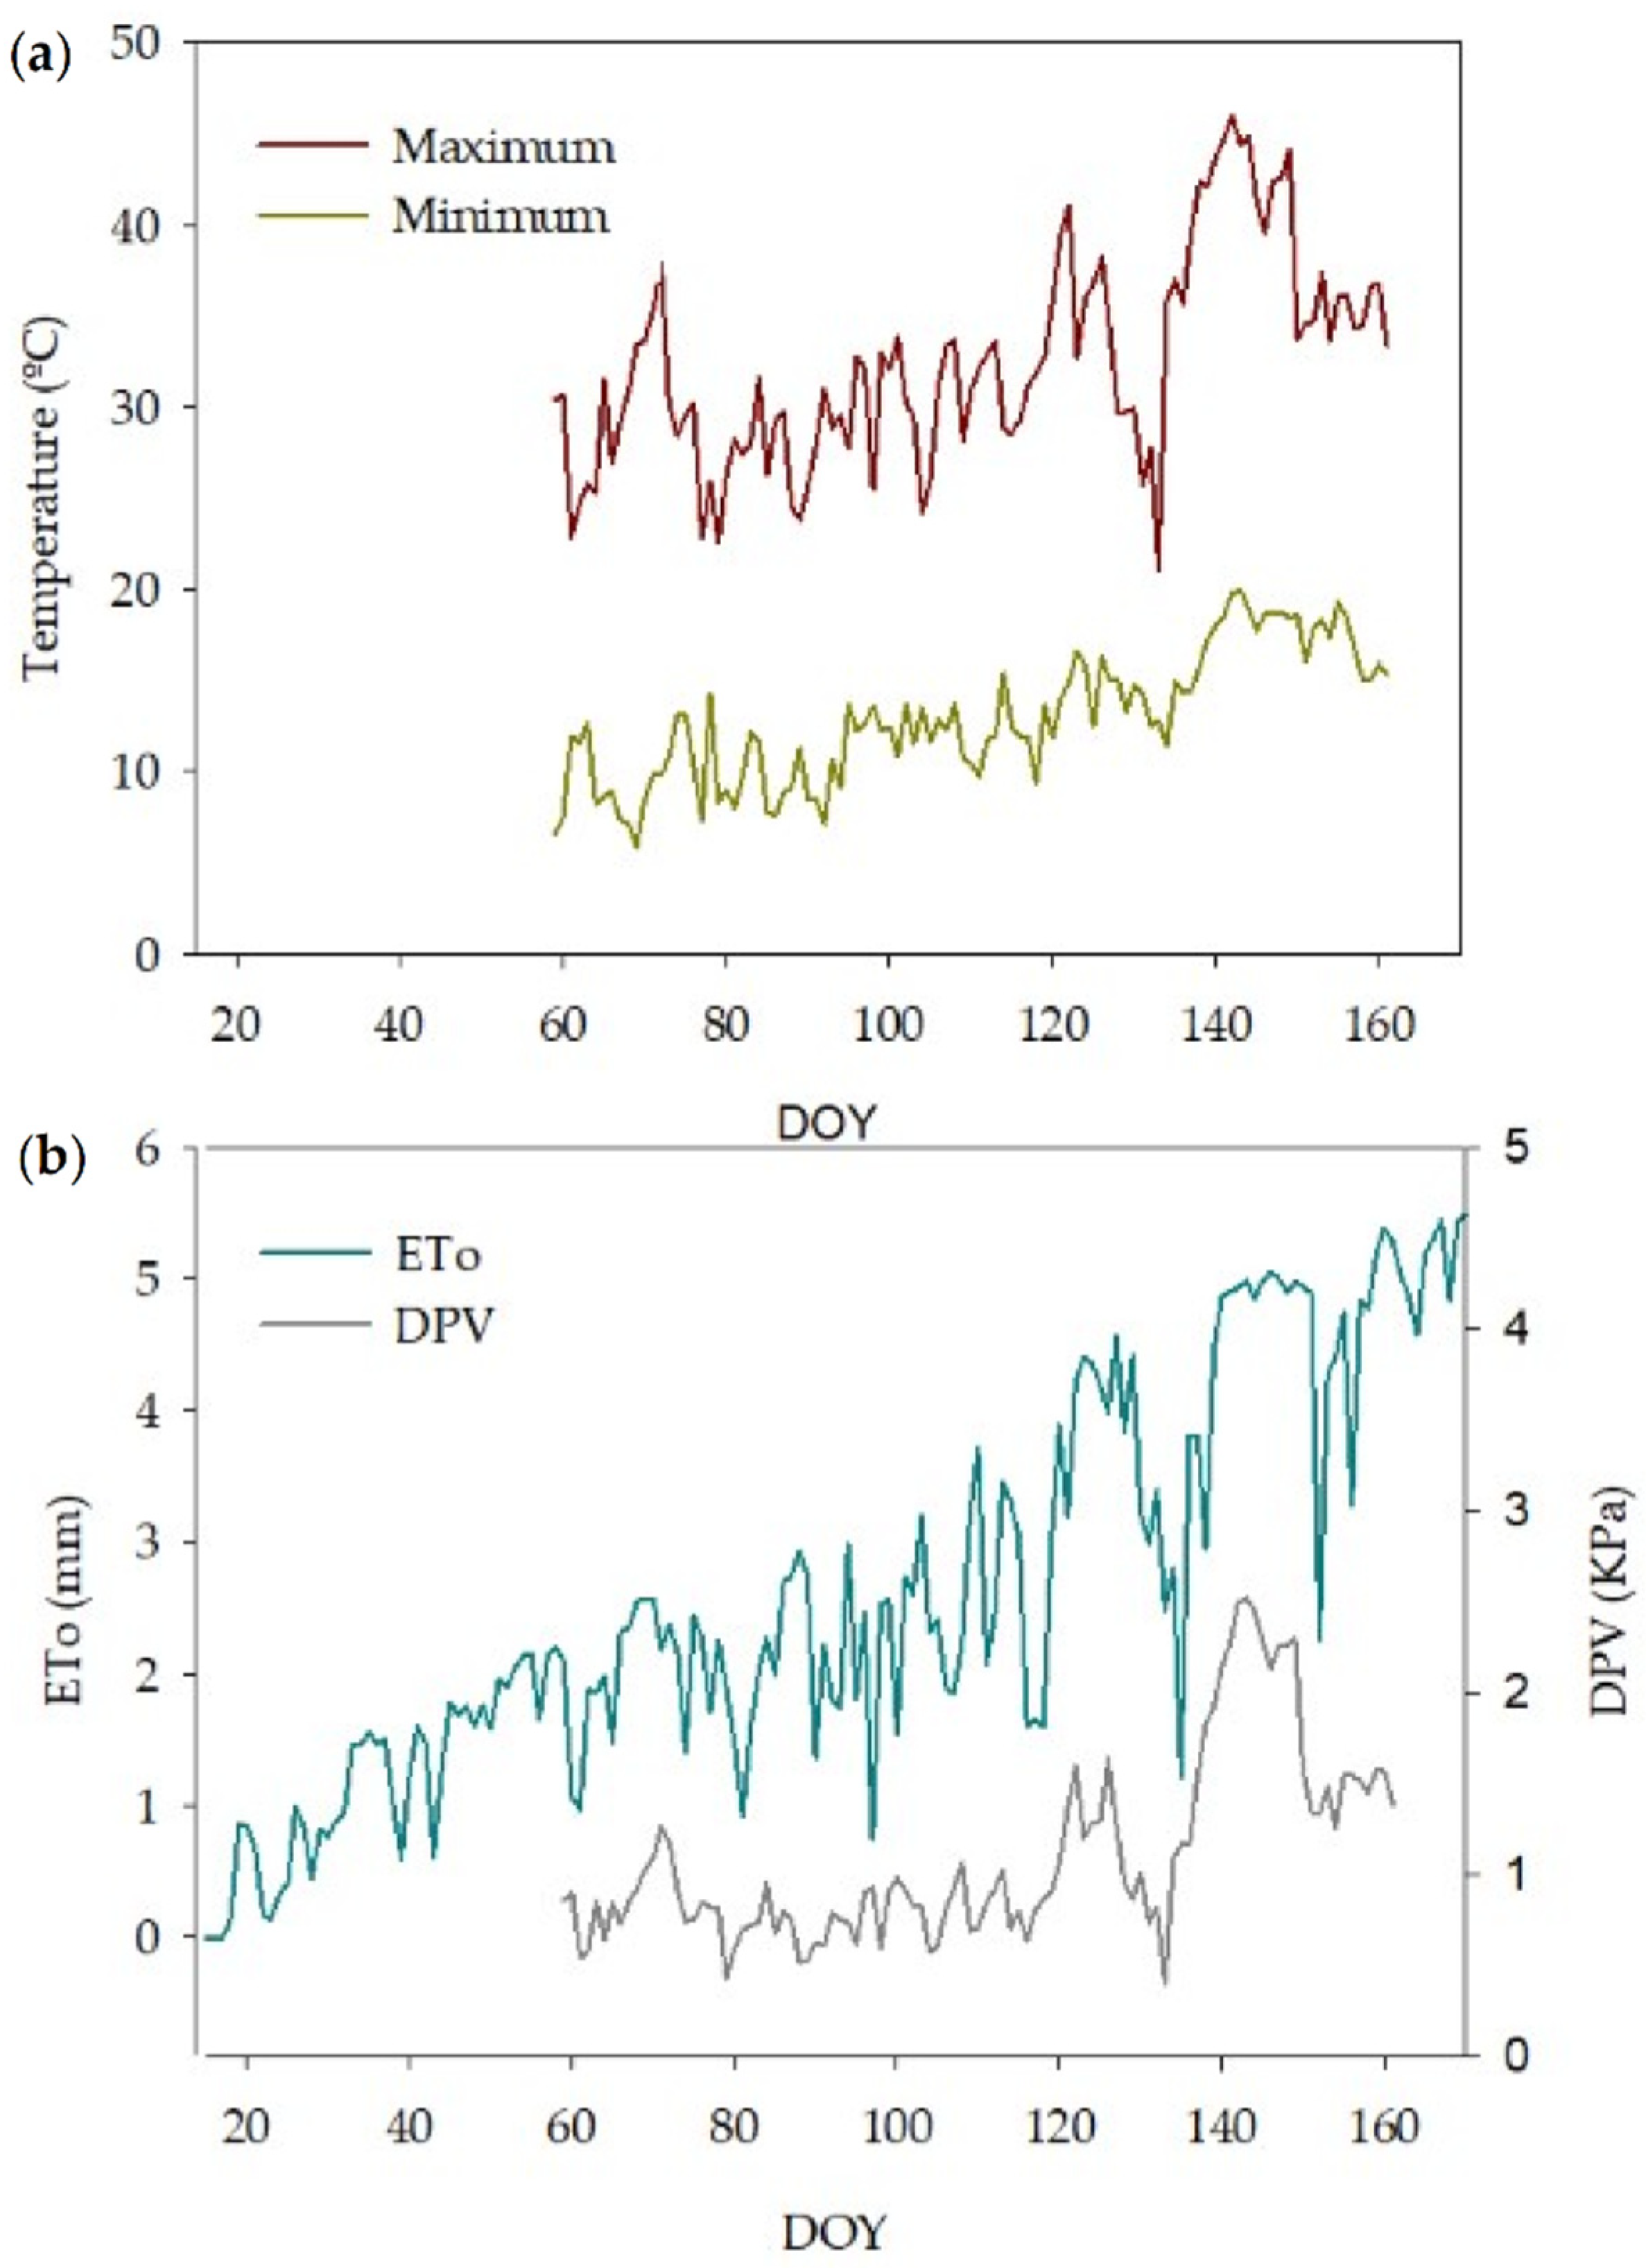
Control: 125% of the crop evapotranspiration (ETc). Reference evapotranspiration (ETo) was estimated according to radiation model for greenhouses [13]. This simple model is well adapted to greenhouse structures in southern Spain [13]. The cultivation coefficients (Kc) of the FAO Manual 56, Allen et al. [14] were used.
Regulated Deficit Irrigation (RDI): This treatment was based on crop water status, with leaf water potential. Treatment started from Day of the Year (DOY) 50, when the first inflorescence appeared. Then, RDI treatments were irrigated according to plant water status.
For each phenological state of the crop, different irrigation thresholds:
  • PHASE I: From transplantation to the appearance of the second inflorescence. For this phase, a threshold of −1 MPa was established according to Fortes et al. [15].
  • PHASE II: From the appearance of the second inflorescence until pink tomatoes are observed in the middle of the inflorescences. In this phase, an irrigation threshold of −0.85 MPa was established according to Coyago-Cruz et al. [13].
  • PHASE III: From the end of phase III until harvest. For this third and last phase, an irrigation threshold of −1 MPa was established according to Fortes et al. [15].
Leaf water potential was measured using a pressure chamber (PMS Instrument Company, Albany, OR, USA). Fully developed and sunny leaves were measured, on one central plant per plot, at solar midday, weekly. Irrigation amount was applied depending on the distance of the water potential of the leaf of each plot to the said threshold, with a maximum limit of 5 mm day−1. ETc maximum estimated for the entire crop. If the reduction was less than 10%, an irrigation dose of 25% of control irrigation was applied. If the reduction was between 10 and 30%, a 50% dose of control treatment was provided. Total amount of water applied in control irrigation treatment was 614 mm and 290 mm for RDI.
In order to describe the accumulative effect of the water deficit, the water stress integral (SI) was calculated from the Ψ data [16] during the period of water stress (Equation (1)). Equation (1) used a reference of −0.2 MPa. The expression used was:
SI = |Σ(Ψ − (−0.2))| ∗ n
(Ψ: average midday stem water potential for any interval, n: days number in the interval).
The first harvest took place on 30 April 2020 and was held weekly until 24 June 2020. Commercial mature fruits (about 80–100% red stage) were collected weekly from 8 control plants, central line of each plot.

2.2. Morphology and Color

The morphological fruit analyses were carried out using a digital caliper (model 500-197-20 150 mm; Mitutoyo Corp., Aurora, IL, USA) to measure longitudinal and equatorial diameter; a scale (model AG204 scale; Mettler Toledo, Barcelona, Spain), with a precision of 0.1 mg, was used to weight samples. Three CIELab color coordinates L*, a* and b* were measured using a Minolta colorimeter model CR-300 (Minolta, Osaka, Japan). Analyses were run in forty fruits/replications (n = 40), and three lectures were taken in each fruit.

2.3. Titratable Acidity and Total Soluble Solids

The content of total soluble solids (TSS) was determined using an Atago digital refractometer (model 101 N-20; Atago, Bellevue, WA, USA) at 20 °C, and results were expressed as °Brix. pH and titratable acidity (TA) were analyzed using an acid-base potentiometer (877 Titrino plus; Metrohm CH9101 ion analysis, Herisau, Switzerland), using 0.1 N NaOH for titration and phenolphthalein as indicator until pH 8.1; results were expressed as g of citric acid L−1.

2.4. Sugars and Organic Acids

Profiles were identified and quantified according to Carbonell-Barrachina et al. [17], with slight modifications. Five milliliters of tomato juice (from 10 tomatoes) were centrifuged for 10 min at 15,000 rpm. Then, 1 mL of the supernatant was filtered through a 0.45 µm Millipore filter. The extracts were injected into a Hewlett-Packard 1100 series high performance HPLC chromatograph (Wilmington, DE, USA). The elution buffer consisted of 0.1% phosphoric acid at a flow rate of 0.5 mL min−1. Organic acids were isolated using a Supelco column (30 cm × 7.8 mm, SupelcogelTM C-610H column) and Supelguard (5 cm × 4.6 mm (Supelco, Inc., Bellefonte, PA, USA) and absorbance was measured at 210 nm using a diode array detector. For sugars, these same HPLC conditions were used, but detection was performed using a refractive index detector (RID). Calibration curves were prepared using standards of (i) oxalic, citric, tartaric, malic, and ascorbic acids, and (ii) glucose, fructose, sucrose, and maltose, obtained from Sigma (Poole, Dorset, UK), and showed good linearity (R2 ≥ 0.999). The analyses were conducted in for replicates (n = 4) and results were expressed as g kg−1.

2.5. Antioxidant Activity (AA) and Total Phenolic Content (TPC)

Were determined using a Helios gamma, UVG1002E UV-vis spectrophotometer (Helios, Cambridge, UK). For the extraction, 5 mL of tomato juice (from 10 tomatoes) were mixed with 5 mL of extractant (methanol/water (80:20, v/v) + 1% HCl) this mix were sonicated for 15 min; then, the mixture was left overnight at 4 °C. Samples were sonicated again for 15 min and later centrifuged for 10 min at 10,000 rpm. Then, the supernatant was collected and placed in vials for the corresponding analyses. For the antioxidant activity, 3 methods were carried out: DPPH (2,2-diphenyl-1-picrylhydrazyl), ABTS•+ [2,2-azinobis- (3-ethylbenzothiazoline-6-sulfonic acid)] and FRAP (ferric reducing antioxidant power), following the protocol written by Brand-Williams et al. [18]. Results were calculated based on a Trolox calibration curve and expressed as mmol Trolox kg−1.
For the determination of the TPC, 100 μL of supernatant was taken and mixed with 200 μL of Folin–Ciocâlteu reagent and 2 mL of ultrapure water. Mixtures were stored for 3 min at 22 °C. Then, 1 mL of 20% Na2CO3 was added, and samples were left to stand for 1 h at room temperature. After the time had elapsed, the determination was made using the spectrophotometer. Results were calculated based on a gallic acid calibration curve and expressed as GAE (gallic acid equivalents), g GAE kg−1.

2.6. The Lycopene and β-Carotene

Contents were determined using the method described by NAGATA, M., & YAMASHITA, I. [19] using a Helios gamma, UVG1002E UV-vis spectrophotometer. Measurements were carried out at 663 nm, 645 nm, 505 nm, and at 453 nm. Results were calculated based on lycopene and β-carotene calibration curves and expressed as mg 100 g−1.

2.7. The Volatile Compounds

Volatile compounds were isolated, identified, and semi-quantified in cherry tomatoes using HS-SPME (headspace solid-phase micro-extraction). Briefly, 15 mL of tomato juice (obtained from 10 tomatoes) were placed in 50 mL SPME-vials together with 1.5 g of NaCl and 10 μL of benzyl acetate (internal standard of 1000 mg L−1). Samples were equilibrated for 15 min at 40 °C. Then, a DVB/CAR/PDMS fiber of 1 cm long (Supelco, Bellefonte, PA, USA) was then introduced into the sample headspace at 40 °C for 40 min, with constant stirring (600 rpm) on a magnetic stirrer (IKA C-MAG HS 4, IKA-Werke GmbH & Co. KG, Staufen, Germany). Desorption of volatile compounds from the fiber coating was done at the chromatograph injection port for 3 min. A gas chromatograph (GC-MS), Shimadzu GC-17A (Shimadzu Corporation, Kyoto, Japan), coupled with a Shimadzu mass spectrometer detector (GC-MS QP-5050A) was used for the volatile analysis. The separation was carried out on a fused silica capillary column SLB-5ms (30 m (length) × 0.25 mm (inner diameter) × 0.25 µm (film thickness)) made of 5% diphenyl and 95% dimethylsiloxane (Supelco Analytical). Helium was used as gas at a flow rate of 1.0 mL min−1. The splitless mode was selected, and the oven program was (i) 80 °C; (ii) rate of 3.0 °C min−1 until 170 °C; (iii) rate of 25 °C min−1 until 300 °C and held for 5.8 min. The injector and detector temperatures were 250 and 300 °C, respectively. Identification of most volatile compounds was performed using 3 different analytical methods: (i) retention indexes, (ii) retention times of standards, and (iii) comparison of mass spectra using both standards Wiley’s Spectral Library Collection). Analyses were conducted in four replicates and results were expressed as mg L−1.

2.8. Sensory Analysis (Trained Panel)

The descriptive sensory analysis was conducted using a highly trained panel, consisting of 12 panelists (6 women and 6 men; aged between 25 and 55 years), belonging to the research group Food Quality and Safety of the Miguel Hernández University of Elche. The panel was selected and trained according to the ISO standard 8586-1 [20]. The final profile of the cherry tomatoes consisted of the following sensory attributes (i) appearance: size, form, color, brightness; (ii) flavor: sweet, sour, tomato ID, fruity, green, aftertaste and (iii) texture: hardness, juiciness, amount of pulp, and amount of skin. The intensity of each attribute was measured using a structured scale ranging from 0 (low or no intensity) to 10 (extremely high intensity), with 0.5 increments 0.5. The sensory analysis was carried out in a normalized sensory room with 14 independent test booths and with controlled temperature and lighting. Samples were individually provided to each panelist, coded with a 3-digit number, in a random order. Water and crackers were provided for palate cleansing.

2.9. Statistical Analysis

Data is presented as mean ± standard error and was initially subjected to analysis of variance (ANOVA), and then to Tukey’s multiple range test to check the mean differences. Statistically significant differences were established at p < 0.05. Pearson’s correlation coefficients (R) were calculated to determine the relationships among all the analyzed parameters (stress integral (SI), color (coordinates L*, a* and b*), TSS, pH, titratable acidity, maturity index, organic acid, sugars, antioxidant activity, TPC, lycopene and β-carotene) and time effect. Subsequently, a dendrogram analysis (using the Euclidean distance by Ward method) and a principal component analysis (PCA) were conducted to group all the above-mentioned parameters with the irrigation treatments (control and RDI) for each of the harvesting time. The software used to perform all statistical analyses was XLSTAT Premium 2016.

3. Results and Discussion

3.1. Agronomic Parameters

Tomatoes conditions and fruits were monitored for 6 weeks. Climatic conditions, temperature, ETo and VPD were the usual ones in the area in spring, suitable for tomato cultivation (Figure 1). Temperature increased slightly around DOY 140 until values greater than 40 °C but, most of the experiment maximum were between 30–35 °C. Minimum temperatures were greater than 10 °C at the beginning and slightly increase during the experiment until 20 °C. ETo and VPD presented a similar pattern to temperature. Minimum values were measured at the beginning of the experiment, and progressive increase occurred from DOY 120.
Table 1 presents data of applied water and water status from the first week of harvest. The amount of applied water in RDI treatment at the first week was approximately half of the control. Applied water in the control was increased according to ETo along the period of harvest until 614 mm. The increase of applied water in RDI was slower than control with periods of no irrigation. At the end of the harvest (6th week) RDI was 47.2% of the applied water compared to the control. However, crop water status did not show significant differences in water potential measurements or stress integral. The only significantly different parameter was in the last week of crop monitorization. In the same way, the weekly harvest in grams per each plant was similar in both irrigation treatments because although there are some oscillations in the values, no statistically significant differences were observed. Maximum yield was measured at Week 4 in both treatments. Cumulative yield was also not significantly different between treatments (3014.37 control vs. 2709.25 RDI g plant−1) with a slight trend of reduction in RDI around 10%. These results are similar to those shown in previous works [21] but with lower levels of stress, which have resulted in 10.1% less but not significant cumulative production in the 6 weeks of experiment (3014.37 control vs. 2709.25 RDI g plant−1). Water stress level in RDI treatment was more positive than −0.91 MPa of minimum midday water potential, which was likely an adequate threshold during harvest. Pulupol et al. [22] reported a great decrease of yield with water stress level more negative than −1 MPa over the whole season.

3.2. Deficit Irrigation Effect on the Morphological and Physico-Chemical Characteristics of Tomato

The primary factors that have an impact in the quality of tomatoes are the morphology, color, total soluble solids (TSS) and titratable acidity (TA) [23]. On the other hand, the functional quality is mainly given by the lycopene, carotenoids, polyphenols, and antioxidant activity, among others. While the sensory quality it is predominantly given by the color, sugars, organic acids, and the volatile compounds [24]. All these parameters are influenced by the cultivar, development stage, agronomic and environmental conditions [25].
Even though cumulated yield was not different, the individual tomatoes weight was significantly higher in RDI treatments for 1st and 2nd week of deficit irrigation and became similar to the control in the following weeks (Table 2). The same phenomenon was also observed in size for the second and third week, while similar values between treatments were registered for the other weeks. Authors working with DI in tomatoes concluded that fresh weight of larger fruits tended to be more negatively affected by the water deficit compared to smaller fruits [26,27]. Apparently, due to the lower osmotic and water potential of smaller fruits could compete more effectively for water in response to a reduced water supply. Other authors reported that weight was most likely to be influenced by grafted technique than water supply [28]. As observed, the cultivar “Summerbrix” was characterized by a high variability of weight from an initial mean value of 18.3 g (week 1) down to 8.3 g in the last week 6. This tendency was also reported by other authors in the same cultivar but also for others such as “Lazarino” in which weight variability depending on the harvest position of the cluster part was detected [29]. For instance, tomatoes with higher weights were found in the proximal part of the cluster, and a decrease was reported when the tomatoes were harvested from the medium and distal part of the cluster. The position factor also could influence the size and weight although in the present study all fruits, both from control and RDI treatments, were harvested from the whole spotted plants.
The color of tomatoes is mainly linked to the lycopene content and is by far the most important quality parameter as is the first characteristic to be evaluated by consumers. This is because color is the single most important product-intrinsic sensory indicator when it comes to setting people’s expectations regarding the likely taste and flavor of tomatoes [30]. In the present study, in general, higher red color was found in tomatoes growth under water stress conditions, as shown by higher values of the color coordinates a* and Chroma (C). A higher increase in red color notes was also reported in the scientific literature, in which the authors found a significantly increase in red color of tomatoes with the increase in water deficit of tomatoes (Lycopersicon sculentum Mill. cultivar Ryna®) [31]. Besides tomatoes, other crops such as almond increased their red skin color due to the increment in polyphenols content (responsible for color) as a consequence of water deficit conditions [4]. These changes in the red color can be linked to an advance of the ripening process of the tomatoes, reduction of the turgor pressure, a burst in ethylene production and synthesis of lycopene; this hypothesis will be checked along in the next sections.
Overall, it is important to highlight that RDI increased the red color as well as size and weight of the tomatoes, which means a greater marketable success because the most important aspects in consumers choice were reported to be color, together with juice and size [31].

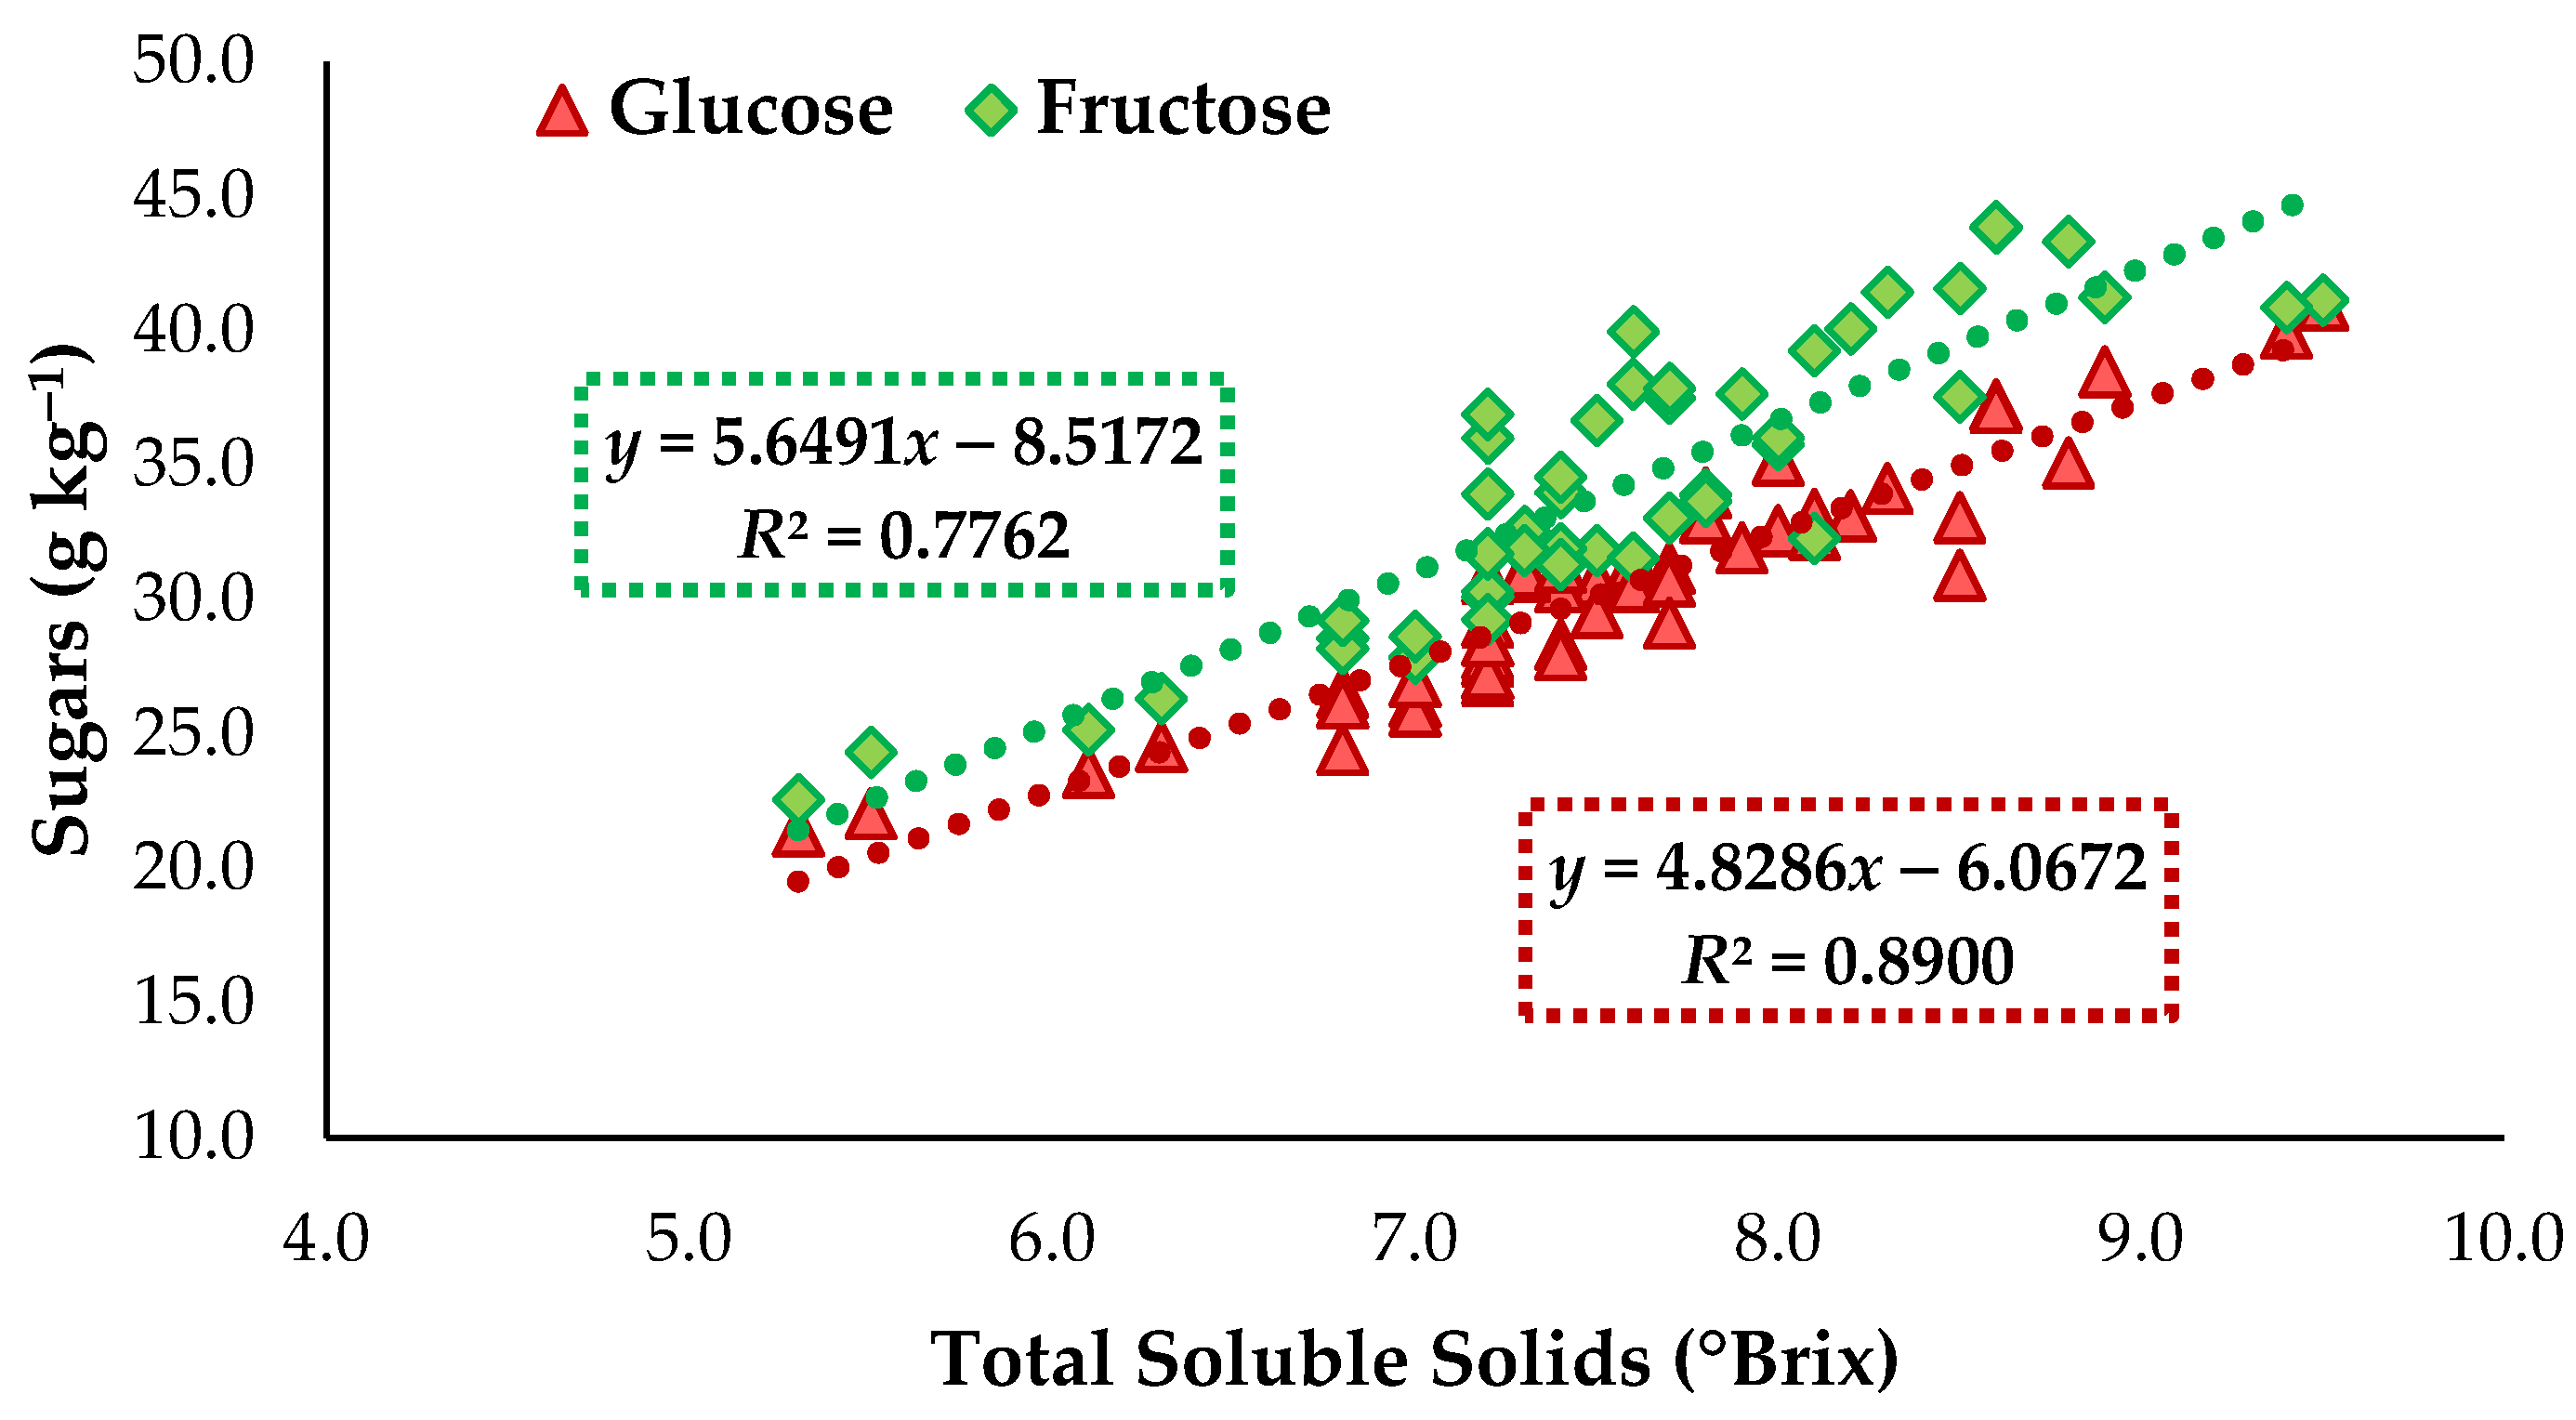
3.3. Deficit Irrigation Effect on Titratable Acidity, Total Soluble Solids, Sugars, and Organic Acid

RDI fruits were characterized by higher TSS values mainly due to a greater accumulation of both fructose and glucose and lower content of citric acid (Table 3). As expected, a significant positive correlation was observed among TSS and contents of fructose (R2 = 0.89, p < 0.001), and glucose (R2 = 0.78, p < 0.001) (Figure 2). It is important to highlight that sugars are the most abundant solute, representing approximately 50% of their dry matter content. Moreover, cultivated tomatoes (Lycopersicon esculentum) contains mainly glucose and fructose, and only traces of sucrose; while Lycopersicon chmielewskii, the wild tomato species, is more abundant in sucrose [7,9,32]. This statement was affirmed by the present study in which the main sugars were glucose with values of 30 and 32 g kg−1 for control and RDI, respectively; fructose with values of 35 and 36 g kg−1; while sucrose was only found in traces for both treatments. Regarding the titratable acidity, this was not significantly affected by the RDI, even though differences were found for the organic acids. According to the literature, organic acids accounts for about 13% of fruit dry weight and citric, tartaric, malic were the main organic acids [9,32]. This was confirmed by the present study in which citric (9.1 g kg−1), tartaric (2.0 g kg−1), ascorbic (0.9 g kg−1) and only traces of oxalic acids were found. The only organic acid affected by the water stress was citric acid which decreased 0.4 g kg−1 with RDI. Finally, ascorbic acid or vitamin C ranged between 0.29 in control samples and 0.35 g kg−1 in RDI in the 1st week of harvest, 0.82–1.02 g kg−1 in 2nd week, 0.96–1.03 g kg−1 in 3rd week, 1.22–1.17 g kg−1 in 4th week, 0.98–0.93 g kg−1 in 5th week, and 0.97–1.04 g kg−1 in the 6th week. It can be observed a small increase in Vitamin C in almost all weeks, although without statistical significance. These values were higher than those reported in cultivar Ryna® (~0.24 g kg−1) and are considered among the tomato cultivar with the highest content, as the Vitamin C level of tomatoes was reported to range between 0.08 and 1.2 g kg−1 [31,33]. Regarding deficit irrigation, authors reported an increase in this compound with the reduction in the volume of irrigation water in cultivar Ryna® (0.17, 0.23, and 0.29 g kg−1 in 1.0, 0.8 and 0.6 ETc, which meant 460, 390, and 320 mm of water through the growth period). Using a greater volume of irrigation water than in the present study, the authors reported an increase in the Vitamin C content, which was not clearly observed in this study; this might suggest that Vitamin C level can be affected by water stress in a different way depending on the cultivar.
The increase in sugars in stress conditions were related to the restricted water uptake into the fruit, lower content of water in the fruit and thus, a greater solute concentration [31]. Authors also reported a simultaneous increase in fruit fresh weight and TSS under water deficit conditions, suggesting additional active sugar accumulation under limited water supply [9]. On the other hand, fruit acidity accumulation with water stress has been mainly attributed to a simple concentration effect through the literature [9]. Additionally, the osmotic adjustments which involves active synthesis of sugars and organic acids under water stress, was another mechanism likely to affect fruit acidity. Other authors found that citrate content increased as tomato fruit approached maturity under both irrigated and mild drought conditions (50% of crop ETc). The trends describing the effect of the RDI on the organic acids and sugars profile seem to agree with the hypothesis established before, reinforcing the idea of an advanced ripening process for RDI tomatoes cultivar “Summerbrix”.
Overall, the metabolism of sugars and acids largely determines the sugar: acid ratio and are responsible for the simultaneous sweet and sour taste of tomatoes. A balance between these compounds produces the best flavor; because all the following combinations (i) low sugar–high acid; (ii) high sugar–low acid; and both (iii) low sugar–low acid concentrations) generates bitter-taste, bland-taste, and tasteless fruits, respectively.
Finally, Vitamin C in plant it is necessary to balance the oxidative stress while in humans is thought to lower the risk of cardiovascular diseases and certain cancers. According to European Commission (EC) the nutrition claim “high in vitamin C” can be only used if the product contains 0.24 g kg−1 Vitamin C [34,35]. In this case, it can be said that the tomatoes of cultivar “Summerbrix” can be sold as high in Vitamin C, because presented a higher content of this antioxidant than the threshold established by the EC. Vitamin C is an important antioxidant helping in detoxifying reactive oxygen species due to its ability to donate an electron in many enzymatic and non-enzymatic reactions [31]. Finally, this compound content was maintained in the present study except for the 1st week in which was increased by the RDI treatment, as well as reported by other authors [31]. However, some components involved in the antioxidants generation it might be contradictory [34]; for instance, water deficit during cropping may increase the Vitamin C and perhaps reduce the lycopene. This happens, because direct sunlight may enhance the accumulation of vitamin C and polyphenols, whereas crop foliage may favor lycopene development. This compound was reported to be cultivar and season dependent.

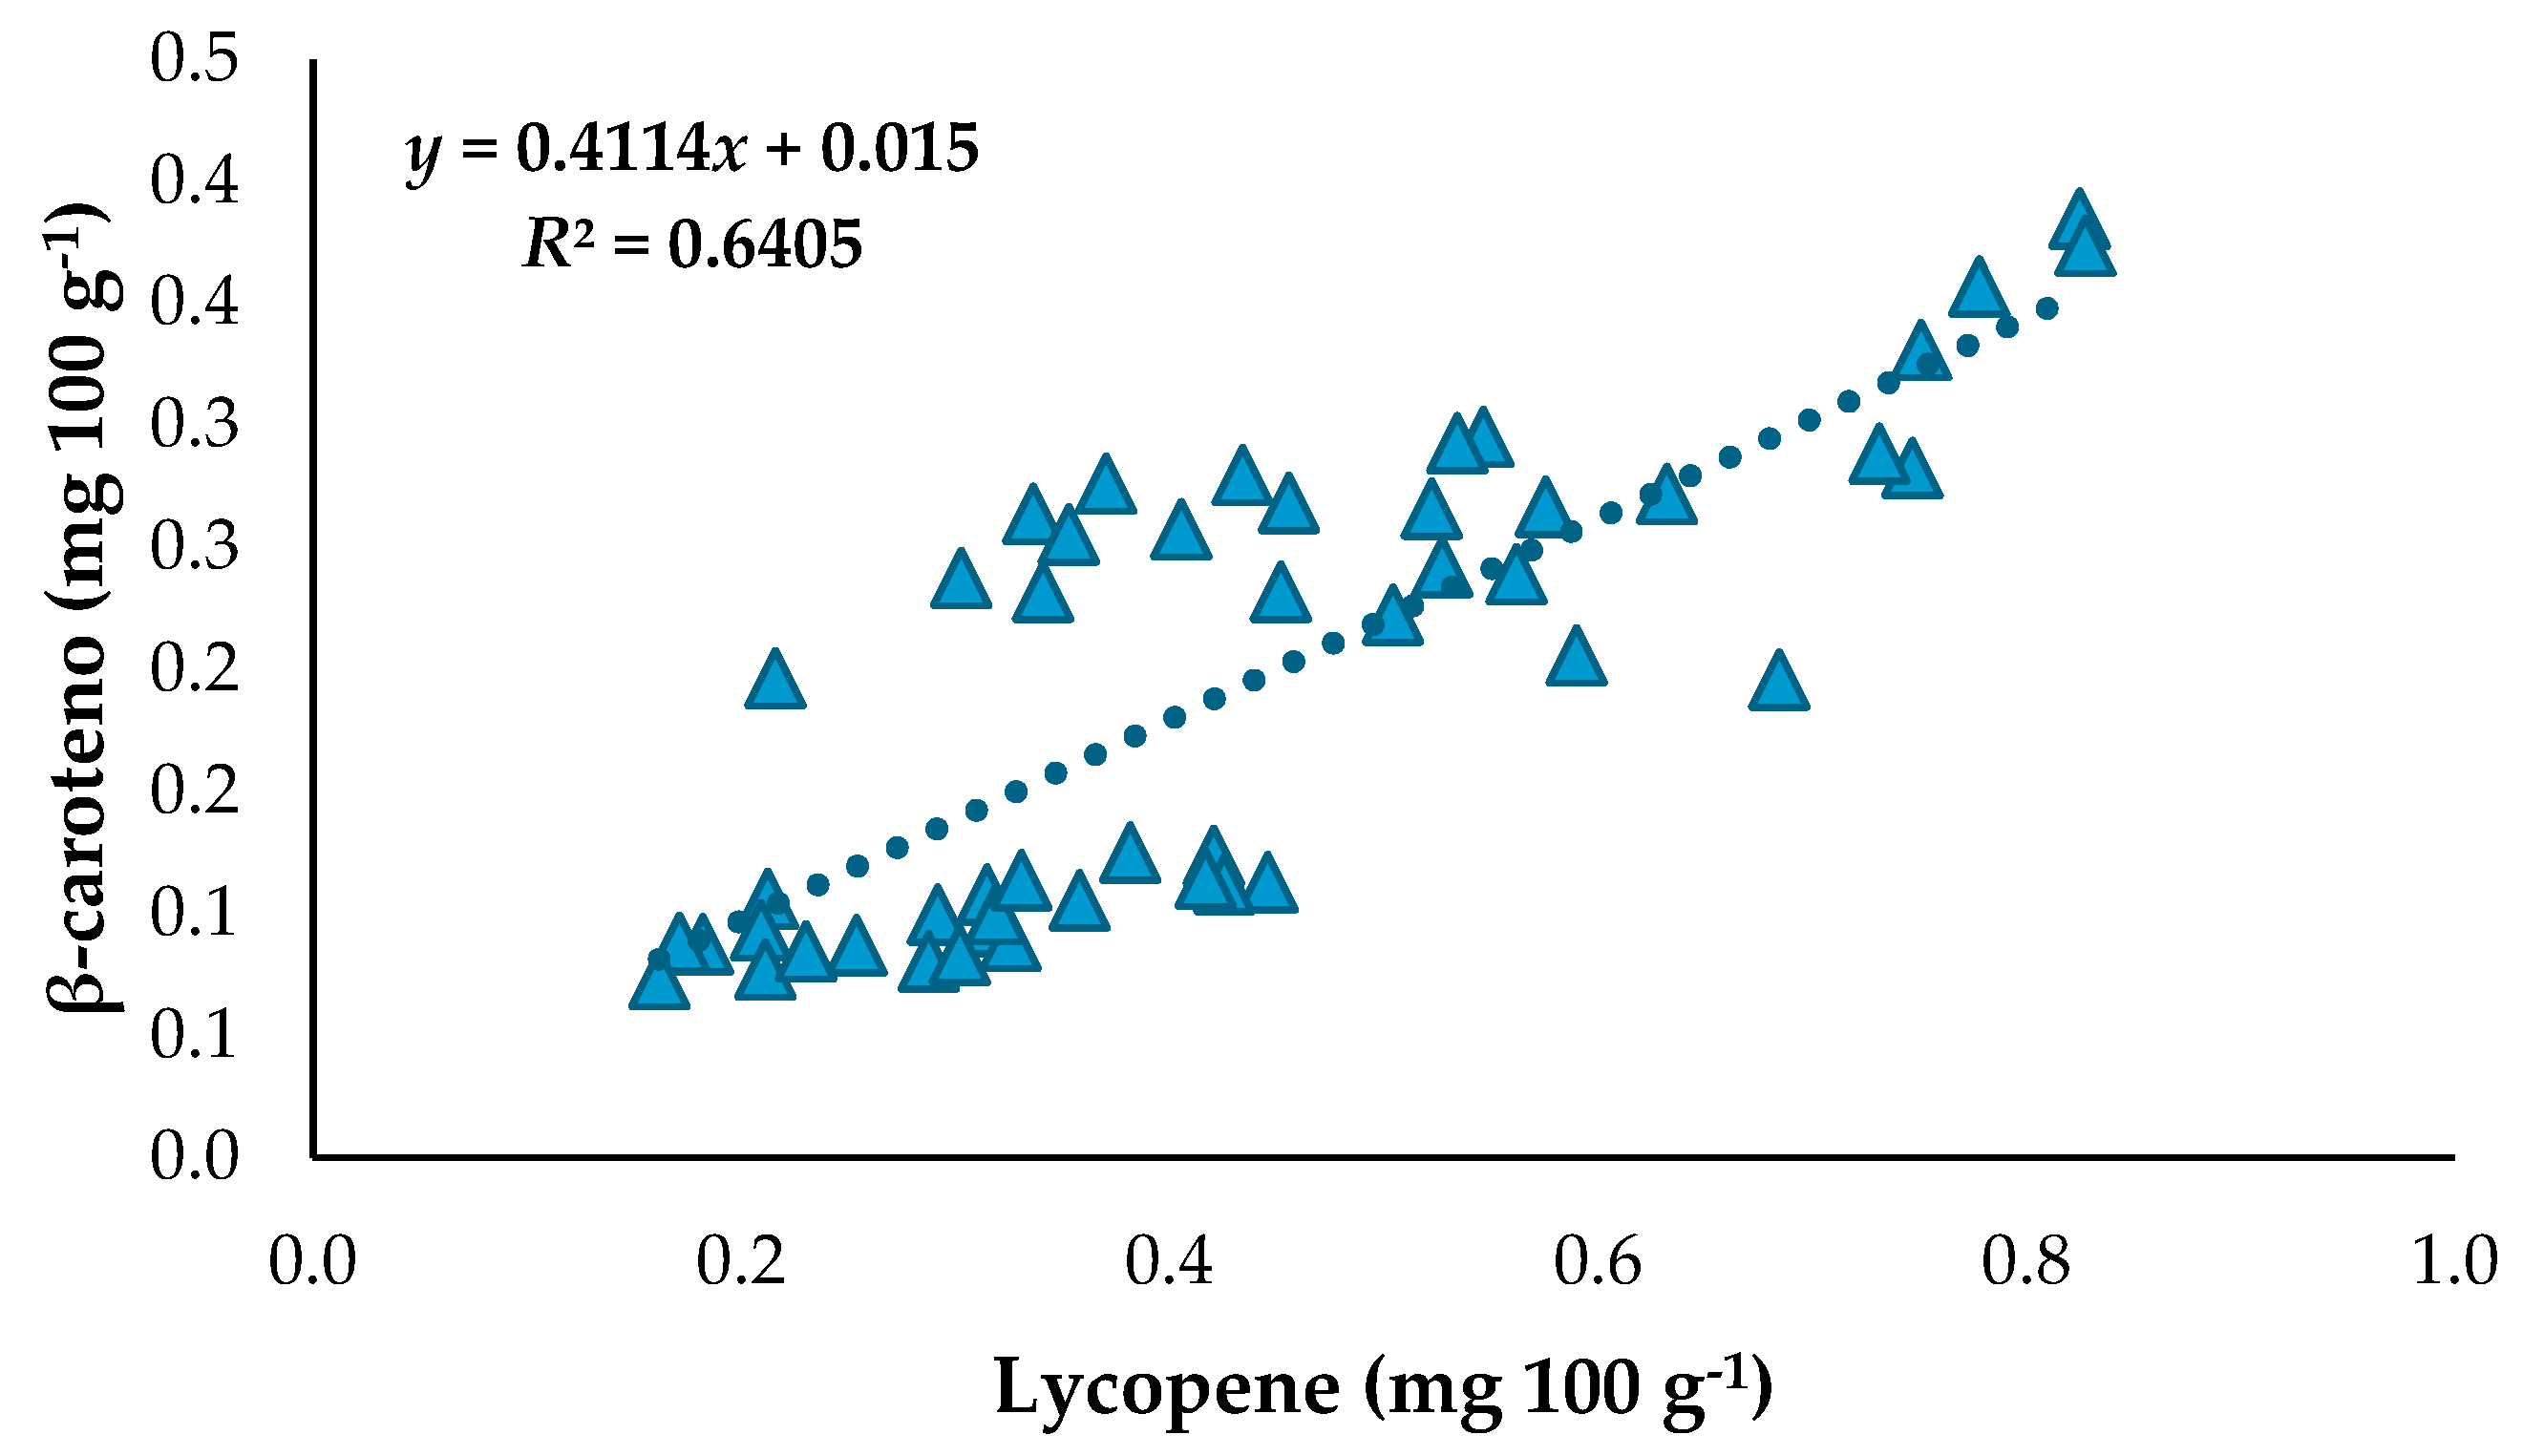
3.4. Deficit Irrigation Effect on Antioxidant Activity (AA), Total Phenolic Content (TPC), Lycopene and β-Carotene

For the determination of AA, three tests were used: ABTS•+, DPPH, and FRAP, because each one has different mechanisms of action; these radicals can be neutralized by direct reduction (electronic transfer) or radical extinction (transfer of hydrogen atoms) [36]. The results showed that RDI had only minimal effects on the AA values, although some positive effects were observed for DPPH (week 4) with 1.2 and 2.1 mmol Trolox kg−1 for control and RDI treatments, and for FRAP method (week 1) with 1.1 and 1.3 mmol Trolox kg−1 for control and RDI treatments (Table 4). Authors also reported that the methanol extracts of tomato cultivated under DI conditions inhibited DPPH by 35–75% [31]. They reported that water stress during flowering-cum- fruiting stage presented the strongest DPPH inhibitory activity. Which help to explain that a strategy of RDI in which the stress is applied in a certain period of the growing cycle help to increase the AA. This was barely confirmed in the present work (only in 2 weeks), although the difference was lower than in the reported study. This leads to the conclusion that “Summerbrix” variety might need higher intensity of water stress to produce a greater content of compounds with antioxidant activity.
In a similar way, the RDI treatment led to an increase of the lycopene (weeks 1, 5 and 6) and β-carotene (week 6). The lycopene levels for these significant weeks were 0.51–0.72, 0.34–0.44, and 0.34–0.55 mg 100 g−1 for control compared to RDI treatment, respectively; while the β-Carotene for the last week ranged between 0.10 and 0.20 mg 100 g−1 for the control and RDI, respectively. In general, the lycopene mean value were 0.38 mg 100 g−1 for control and 0.48 mg 100 g−1 for RDI; while for β-carotene were 0.17 and 0.21 mg 100 g−1 in “Summerbrix” cultivar. Results lower than those reported by Kumar et al. [31] in Ryna® cultivar, which were reported to increase within the deficit irrigation levels (1.19, 11.1, and 13.8 mg 100 g−1 lycopene content; 0.82, 2.67, and 3.44 mg 100 g−1 β-Carotene). On the other hand, a study by Marti et al. [37] reported, in four tomatoes cultivars, that controlled deficit irrigation did not affect the accumulation of carotenoids and concluded that a higher water stress should be applied to produce an accumulation of these compounds, including lycopene and β-carotene.
Carotenoids, which include both lycopene and β-Carotene are reported to be the most effective naturally existing radical sequesters for oxygen radicals [31]. They are pigments that are mainly synthetized during fruit ripening and their bioavailability is dependent on the irrigation, for instance they decreased with the increase in irrigation water. Lycopene is the responsible for 90% of the tomato color and highly dependent on the cultivar, season and agronomic practices [33]. This compound, as mentioned before is of high importance as establish the color of tomato, the most important driver of liking for consumers. Additionally, its highly biological activity has generated attention due to the lycopene rich diets relationship with lower risk of certain cancers, heart disease, and age-related diseases [33]. Because this noncyclic carotenoid found in tomatoes, was reported to be the most effective free radical scavenger of all carotenoids; thus, can protect DNA, lipids, and other macromolecules with its antioxidant activity [38]. Is important to highlight that European Food Safety Authority [39], adopted the decision on 30 of April 2009, authorizing the “Synthetic lycopene… may be placed on the market in the Community as a Novel Food ingredient to be used in the foods listed in Annex II” under Regulation (EC) No 258/97 of the European Parliament and of the Council.
A clear relationship was found for the contents of lycopene and β-carotene (R2 = 0.64, p < 0.001), demonstrating a similar accumulation pattern of these two carotenoids in tomatoes (Figure 3).
Finally, the TPC presented a mean value of 0.66 g GAE kg−1 without significant differences between treatments. The amount was higher than that reported by Kumar et al. [31]. in Ryna® cultivar in the most stressed treatment (0.55 g GAE kg−1); and same authors showed an increase of TPC under deficit irrigation conditions (0.40–0.55 g GAE kg−1) which was not observed in the present work.

3.5. Volatile Compounds

The volatile compounds are responsible for the characteristic aroma of tomato. Although approximately 400 identified volatile compounds have been identified, only a small group plays an important role in the aroma of fresh tomato: hexanal, 1-penten-3-one, cis-3-hexenal, trans-2-hexenal, cis- 3-hexenol, 3-methylbutanal, 6-methyl-5-hepten-2-one, 2-isobutylthiazole, β-ionone and methyl salicylate in suitable concentrations contribute to the tomato aroma [40]. Twenty-five volatile compounds were found in the volatile profile of cherry tomatoes cultivar “Summerbrix”, which can be classified into 8 chemical families: aldehydes (n = 10), terpenoids (n = 6), ketones (n = 3), alcohols (n = 2), terpenes (n = 1), thiazoles (n = 1), esters (n = 1), and acids (n = 1) (Table 5). The predominant compounds were (E)-2-hexenal (V2), hexanol (V3), hexanal (V1), 6-methyl-5-hepten-2-one (V7), and 2-isobutylthiazole (V10) (Table 6). These compounds have been previously reported as being odor-active compounds and essential for the tomato flavor [12,41]. There was no significant and clear effect of the irrigation treatment on the contents of the volatile compounds present in these tomatoes.

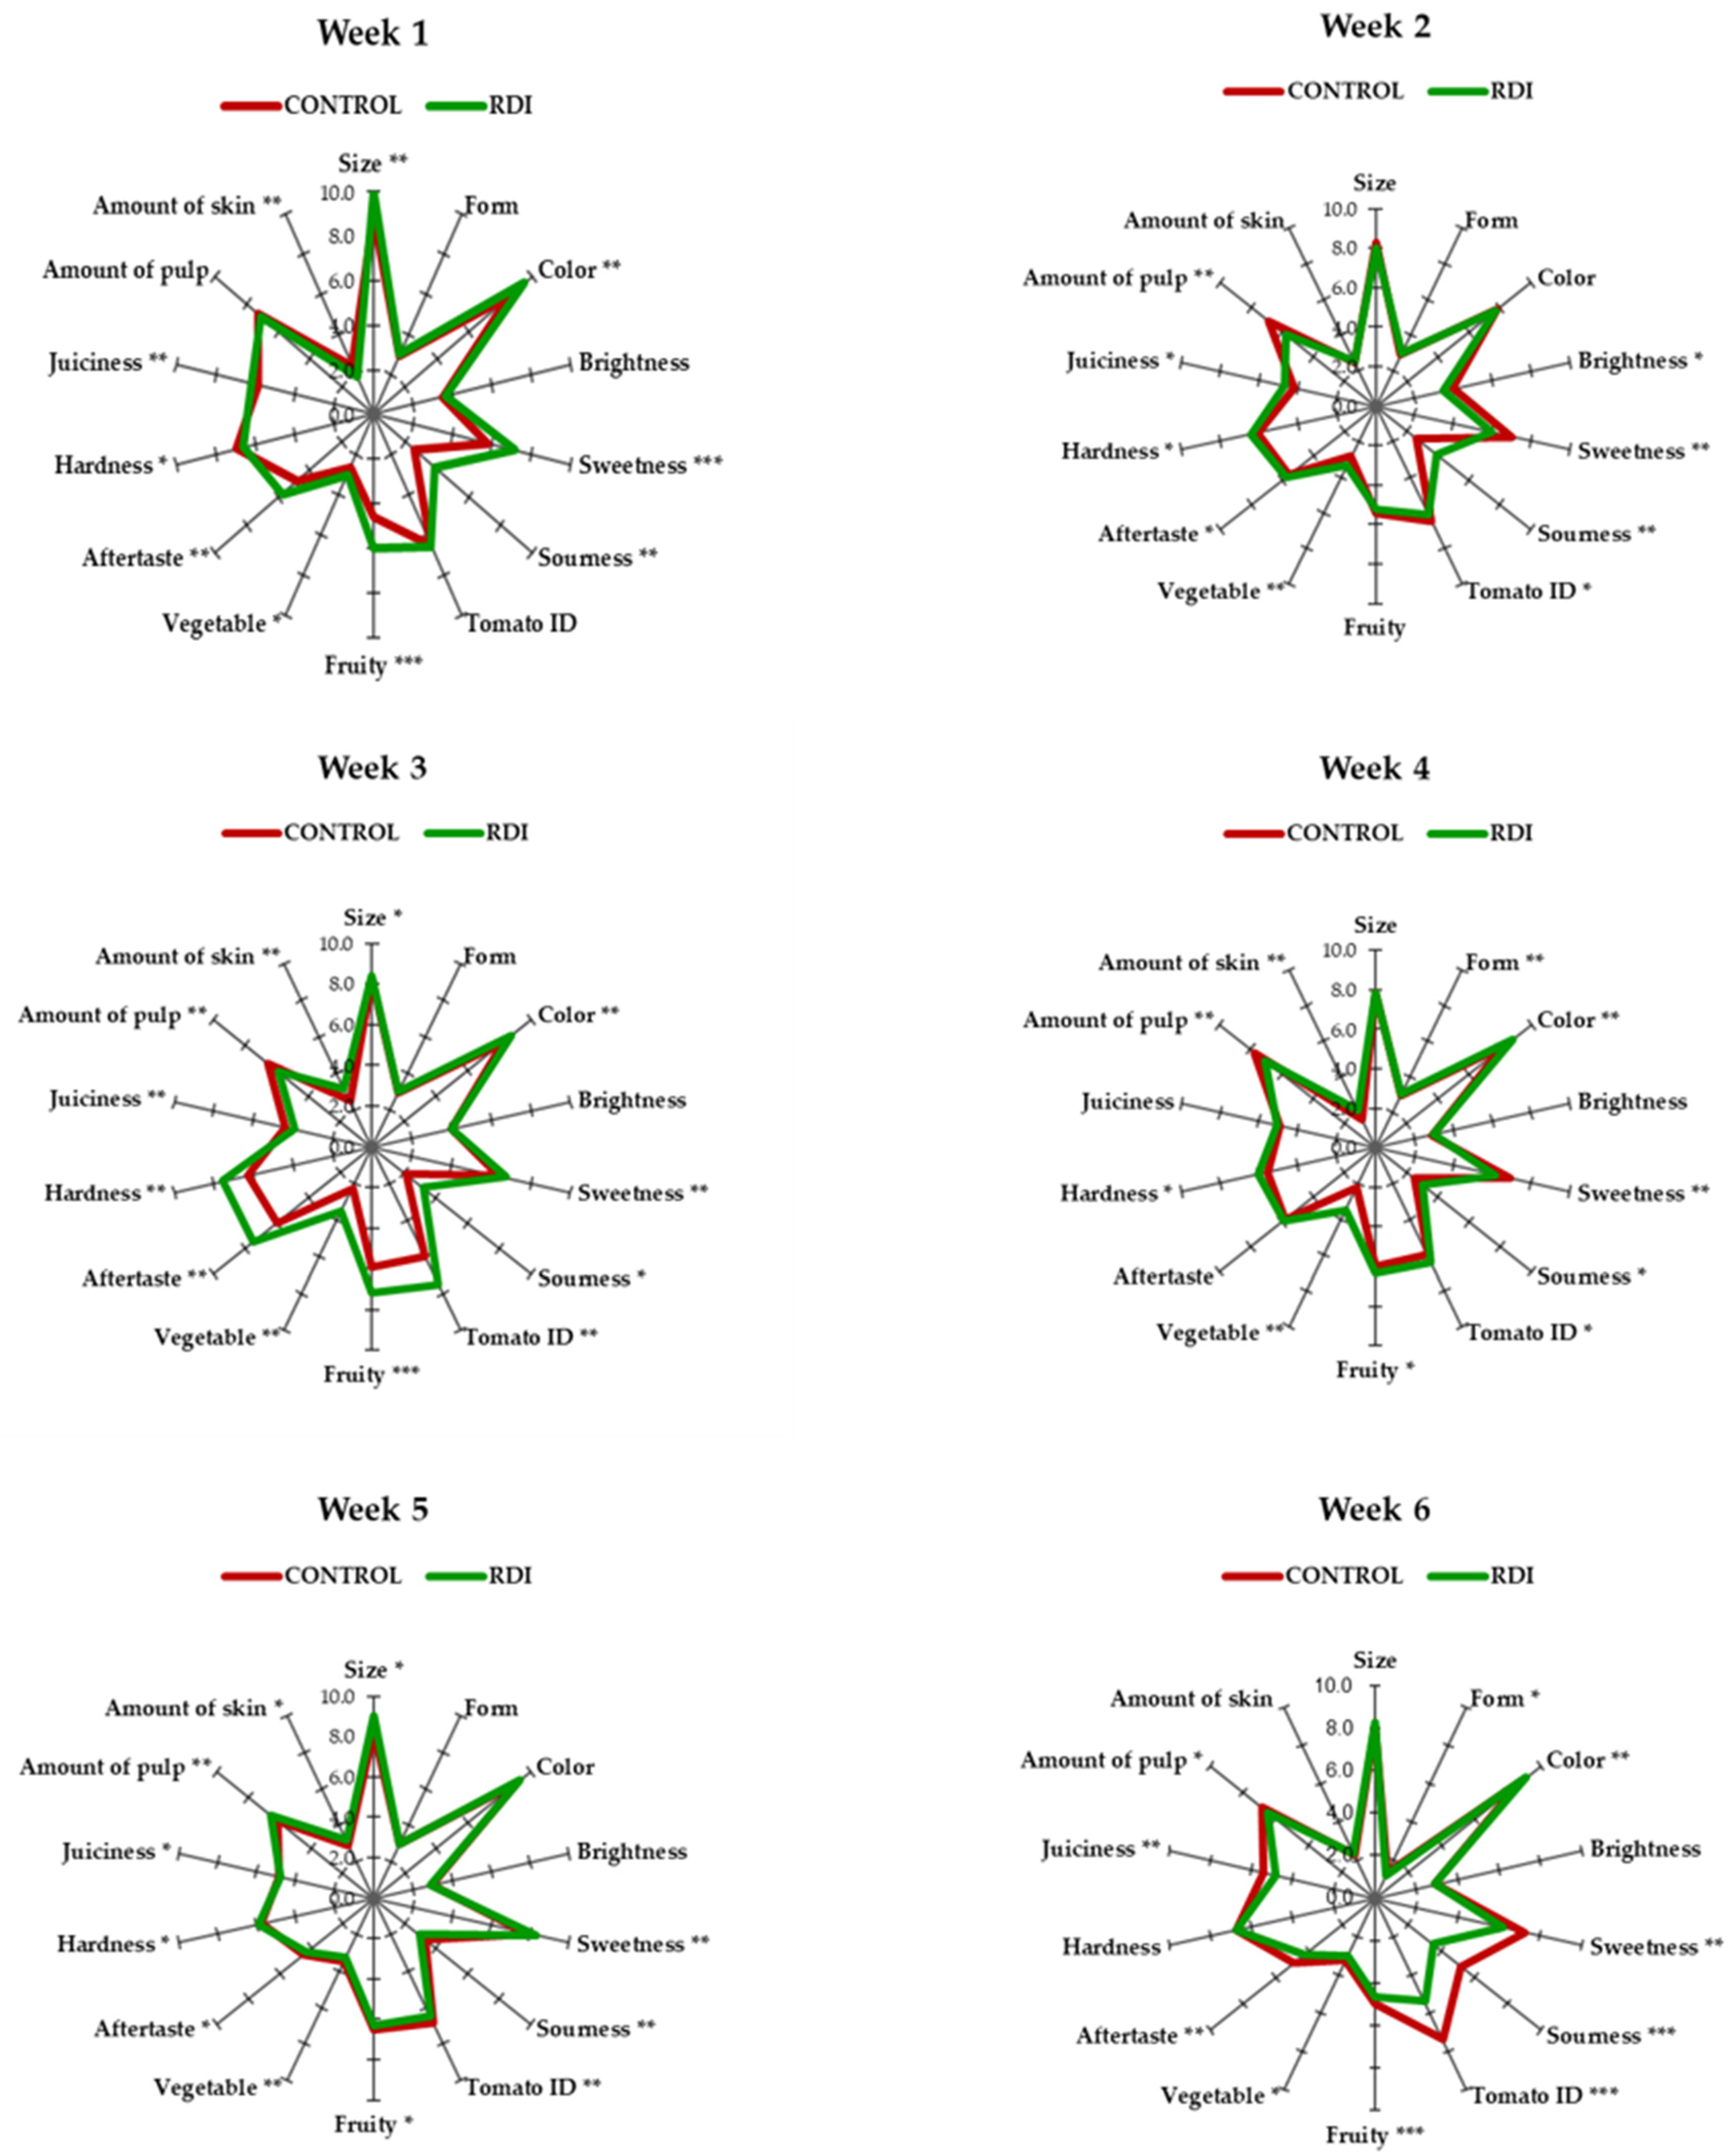
3.6. Sensory Analysis (Trained Panel)

In general, the sensory profiles of RDI tomatoes at weeks 1–3, were characterized by higher intensity of key attributes, such as sweetness, sourness, fruit and green notes, aftertaste, and hardness (Figure 4). On the other hand, this trend was reversed at week 6, where control fruits presented a more intense tomato flavor (higher intensity of sweetness, sourness, and tomato-ID) than RDI fruits, probably at this week the stress suffered by RDI plants was extremely strong and plants were highly affected. In this way, the proposed deficit irrigation treatment led to tastier cherry tomatoes from 1 to 5 weeks of water deficit. Pérez-Marín et al. [12] also reported that the most characteristic descriptors were sweetness, fruity, hardness, in a study carried out for samples of cherry tomatoes (pear and round) of different varieties.
Figure 5a shows that the component (F1) explained 28.64% of the total variance of the data and the second (F2) explained 24.85% of the total variance. While in the dendrogram presented in Figure 5b it can be observed how the samples are grouped into 3 main groups.
The PCA analysis is by far the most used technique for dimensionality reductions, meant to reduce the number of variables while preserving as much information as possible, and provide an accurate and simple view of total results. In this case, PCA basically showed that the “harvesting time” was more relevant than the factor “irrigation treatment”. In this way, all samples (both control and RDI treated) from weeks 1 and 2 were grouped together and characterized by high contents of lycopene, β-carotene, high size, intense hardness, juiciness, tomato-ID, and long aftertaste. On the other hand, all samples collected at weeks 4–6, independently of the RDI treatment, were characterized by high values of TPC, antioxidant activity (ABTS•+, DPPH, and FRAP), high contents of both sugars (also TSS) and organic acids (also titratable acidity) leading to red, sweet, and sour fruits with a high content of pulp. However, it can be seen that RDI tomatoes were mainly surrounded by tomato ID, hardness, juiciness, sweetness and redder color.

3.7. Pearson’s Correlations among Plant Stress, Quality, and Composition Parameters

Figure 6 seems to establish relationships among the stress integral (SI) and TPC (a) as well as between TPC and the FRAP values (b). In this way, the higher the stress integral (more intense the water stress), the higher the accumulation of phenolic compounds (higher values of TPC), leading to higher antioxidant activity as showed by the FRAP values. This general trend is supported by the following Pearson’s correlation coefficients and significance (Table 6): (i) SI vs. TPC, R = 0.60, p < 0.001; and (ii) TPC vs. FRAP, R = 0.87, p < 0.001.

4. Conclusions

Irrigation management styles proposed were adequate to maintain a water stress level with no limitations for yield. Leaf water potential more positive than −0.9MPa and stress integral of 30 MPa day−1 seem like adequate stress threshold values. There was a 10% decrease in cumulative production, which was not statistically significant. This allowed a saving of 53% of water. It also allowed improvements in the nutritional, functional, and sensory quality of tomatoes. RDI tomatoes presented, in general, greater weight, size, TSS, sugars, antioxidant activity, lycopene, β-Carotene, and redder color with more intense tomatoes flavor.

Author Contributions

Conceptualization, A.M. and M.C.; methodology, L.L. and H.I.-I.; software, L.L. and H.I.-I.; validation, Á.A.C.-B., F.H., M.J.M.-P., A.G. and L.A.; formal analysis, N.M.Z., A.G. and M.C.; investigation, F.H., A.M. and M.C.; resources, M.C. and M.J.M.-P.; data curation, A.M. and N.M.Z.; writing—original draft preparation, H.I.-I.; writing—review and editing, L.L.; visualization, M.C.; supervision, Á.A.C.-B., F.H. and A.M. All authors have read and agreed to the published version of the manuscript.

Funding

This research received no external funding.

Institutional Review Board Statement

Not applicable.

Informed Consent Statement

Not applicable.

Data Availability Statement

Not applicable.

Conflicts of Interest

The authors declare no conflict of interest.

References

  1. Blanco, V.; Zoffoli, J.P.; Ayala, M. Eco-physiological response, water productivity and fruit quality of sweet cherry trees under high tunnels. Sci. Hortic. 2021, 286. [Google Scholar] [CrossRef]
  2. El Jaouhari, N.; Abouabdillah, A.; Bouabid, R.; Bourioug, M.; Aleya, L.; Chaoui, M. Assessment of sustainable deficit irrigation in a Moroccan apple orchard as a climate change adaptation strategy. Sci. Total Environ. 2018, 642, 574–581. [Google Scholar] [CrossRef]
  3. Wu, Y.; Yan, S.; Fan, J.; Zhang, F.; Xiang, Y.; Zheng, J.; Guo, J. Responses of growth, fruit yield, quality and water productivity of greenhouse tomato to deficit drip irrigation. Sci. Hortic. 2021, 275. [Google Scholar] [CrossRef]
  4. Lipan, L.; Cano-Lamadrid, M.; Hernández, F.; Sendra, E.; Corell, M.; Vázquez-Araújo, L.; Moriana, A.; Carbonell-Barrachina, Á.A. Long-term correlation between water deficit and quality markers in hydrosostainable almonds. Agronomy 2020, 10, 1470. [Google Scholar] [CrossRef]
  5. Willett, W.; Rockström, J.; Loken, B.; Springmann, M.; Lang, T.; Vermeulen, S.; Garnett, T.; Tilman, D.; DeClerck, F.; Wood, A.; et al. Food in the Anthropocene: The EAT–Lancet Commission on healthy diets from sustainable food systems. Lancet 2019, 393, 447–492. [Google Scholar] [CrossRef]
  6. Jamshidi, S.; Zand-Parsa, S.; Niyogi, D. Physiological responses of orange trees subject to regulated deficit irrigation and partial root drying. Irrig. Sci. 2021, 39, 441–455. [Google Scholar] [CrossRef]
  7. Yilmaz, E. The Chemistry of Fresh Tomato Flavor. Turk. J. Agric. For. 2001, 25, 149–155. [Google Scholar]
  8. FAO. Food and Agriculture Organization of the United Nations. FAOSTAT Statistical Database. Available online: http://www.fao.org/faostat/en (accessed on 20 April 2021).
  9. Hou, X.; Zhang, W.; Du, T.; Kang, S.; Davies, W.J. Responses of water accumulation and solute metabolism in tomato fruit to water scarcity and implications for main fruit quality variables. J. Exp. Bot. 2020, 71, 1249–1264. [Google Scholar] [CrossRef]
  10. Chang, C.H.; Liu, Y.C. Study on lycopene and antioxidant contents variations in tomatoes under air-drying process. J. Food Sci. 2007, 72, E532–E540. [Google Scholar] [CrossRef]
  11. Selli, S.; Kelebek, H.; Ayseli, M.T.; Tokbas, H. Characterization of the most aroma-active compounds in cherry tomato by application of the aroma extract dilution analysis. Food Chem. 2014, 165, 540–546. [Google Scholar] [CrossRef]
  12. Pérez-Marín, J.; Issa-Issa, H.; Clemente-Villalba, J.; García-Garví, J.M.; Hernández, F.; Carbonell-Barrachina, Á.A.; Calín-Sánchez, A.; Noguera-Artiaga, L. Physicochemical, Volatile, and Sensory Characterization of Promising Cherry Tomato (Solanum lycopersicum L.) Cultivars: Fresh Market Aptitudes of Pear and Round Fruits. Agronomy 2021, 11, 618. [Google Scholar] [CrossRef]
  13. Fernández, M.D.; Bonachela, S.; Orgaz, F.; Thompson, R.; López, J.C.; Granados, M.R.; Gallardo, M.; Fereres, E. Measurement and estimation of plastic greenhouse reference evapotranspiration in a Mediterranean climate. Irrig. Sci. 2010, 28, 497–509. [Google Scholar] [CrossRef] [Green Version]
  14. Allen, R.G.; Pareira, L.S.; Raes, D.; Smith, M. Evapotranspiración del Cultivo: Guías para la Determinación de los Requerimientos de Agua de los Cultivos; FAO: Roma, Italy, 2006; pp. 298–392. [Google Scholar]
  15. Fortes, R.; Prieto, M.; González, J.; Campillo, C. Estrategias de Riego Deficitario Controlado en el Cultivo de Tomate de Industria. Vida RURAL. Available online: https://www.agronegocios.es/estrategias-de-riego-deficitario-controlado-en-el-cultivo-de-tomate-de-industria/ (accessed on 9 July 2021).
  16. Myers, B.J. Water stress integral a link between short-term stress and long-term growth. Tree Physiol. 1988, 4, 315–323. [Google Scholar] [CrossRef] [PubMed]
  17. Carbonell-Barrachina, A.A.; Calín-Sánchez, A.; Bagatar, B.; Hernández, F.; Legua, P.; Martínez-Font, R.; Melgarejo, P. Potential of Spanish sour-sweet pomegranates (cultivar C25) for the juice industry. Food Sci. Technol. Int. 2012, 18, 129–138. [Google Scholar] [CrossRef] [PubMed]
  18. Brand-Williams, W.; Cuvelier, M.E.; Berset, C. Use of a free radical method to evaluate antioxidant activity. LWT Food Sci. Technol. 1995, 28, 25–30. [Google Scholar] [CrossRef]
  19. Nagata, M.; Yamashita, I. Simple method for simultaneous determination of chlorophyll and carotenoids in tomato fruit. Jpn. Soc. Food Sci. Technol. 1992, 39, 925–928. [Google Scholar] [CrossRef] [Green Version]
  20. AENOR, I. ISO 8586-1:1993. Sensory Analysis—General Guidance for the Selection, Training and Monitoring of Assessors—Part 1: Selected Assessors; ISO: Geneva, Switzerland, 1993. [Google Scholar]
  21. Coyago-Cruz, E.; Meléndez-Martínez, A.J.; Moriana, A.; Girón, I.F.; Martín-Palomo, M.J.; Galindo, A.; López-Pérez, D.; Torrecillas, A.; Beltrán-Sinchiguano, E.; Corell, M. Yield response to regulated deficit irrigation of greenhouse cherry tomatoes. Agric. Water Manag. 2019, 213, 212–221. [Google Scholar] [CrossRef]
  22. Pulupol, L.U.; Behboudian, M.H.; Fisher, K.J. Growth, yield, and postharvest attributes of glasshouse tomatoes produced under deficit irrigation. HortScience 1996, 31, 926–929. [Google Scholar] [CrossRef] [Green Version]
  23. Huang, C.; Peng, F.; You, Q.; Xue, X.; Wang, T.; Liao, J. Growth, yield and fruit quality of cherry tomato irrigated with saline water at differente developmental stages. Acta Agric. Scand. 2015, 66, 317–324. [Google Scholar] [CrossRef]
  24. Figàs, M.R.; Prohens, J.; Raigón, M.D.; Fita, A.; García-Martínez, M.D.; Casanova, C.; Borràs, D.; Plazas, M.; Andújar, I.; Soler, S. Characterization of composition traits related to organoleptic and functional quality for the differentiation, selection and enhancement of local varieties of tomato from different cultivar groups. Food Chem. 2015, 187, 517–524. [Google Scholar] [CrossRef] [Green Version]
  25. Khapte, P.S.; Kumar, P.; Burman, U.; Kumar, P. Deficit irrigation in tomato: Agronomical and physio-biochemical implications. Sci. Hortic. 2019, 248, 256–264. [Google Scholar] [CrossRef]
  26. Constantinescu, D.; Memmah, M.M.; Vercambre, G.; Génard, M.; Baldazzi, V.; Causse, M.; Albert, E.; Brunel, B.; Valsesia, P.; Bertin, N. Model-assisted estimation of the genetic variability in physiological parameters related to tomato fruit growth under contrasted water conditions. Front. Plant Sci. 2016, 7. [Google Scholar] [CrossRef] [PubMed] [Green Version]
  27. Diouf, I.A.; Derivot, L.; Bitton, F.; Pascual, L.; Causse, M. Water deficit and salinity stress reveal many specific QTL for plant growth and fruit quality traits in tomato. Front. Plant Sci. 2018, 9. [Google Scholar] [CrossRef] [PubMed] [Green Version]
  28. Fernández-García, N.; Martínez, V.; Carvajal, M. Effect of salinity on growth, mineral composition, and water relations of grafted tomato plants. J. Plant Nutr. Soil Sci. 2004, 167, 616–622. [Google Scholar] [CrossRef]
  29. Coyago-Cruz, E.; Corell, M.; Moriana, A.; Hernanz, D.; Stinco, C.M.; Meléndez-Martínez, A.J. Effect of the fruit position on the cluster on fruit quality, carotenoids, phenolics and sugars in cherry tomatoes (Solanum lycopersicum L.). Food Res. Int. 2017, 100, 804–813. [Google Scholar] [CrossRef]
  30. Oltman, A.E.; Jervis, S.M.; Drake, M.A. Consumer attitudes and preferences for fresh market tomatoes. J. Food Sci. 2014, 79, S2091–S2097. [Google Scholar] [CrossRef]
  31. Kumar, P.S.; Singh, Y.; Nangare, D.D.; Bhagat, K.; Kumar, M.; Taware, P.B.; Kumari, A.; Minhas, P.S. Influence of growth stage specific water stress on the yield, physico-chemical quality and functional characteristics of tomato grown in shallow basaltic soils. Sci. Hortic. 2015, 197, 261–271. [Google Scholar] [CrossRef]
  32. Agius, C.; von Tucher, S.; Poppenberger, B.; Rozhon, W. Quantification of sugars and organic acids in tomato fruits. MethodsX 2018, 5, 537–550. [Google Scholar] [CrossRef]
  33. Dumas, Y.; Dadomo, M.; Di Lucca, G.; Grolier, P. Effects of environmental factors and agricultural techniques on antioxidant content of tomatoes. J. Sci. Food Agric. 2003, 83, 369–382. [Google Scholar] [CrossRef]
  34. 1169/2011, R.U.N. Sobre la Información Alimentaria Facilitada al Consumidor y por el que se Modifican los Reglamentos (CE) no 1924/2006 y (CE) no 1925/2006 del Parlamento Europeo y del Consejo, y por el que se Derogan la Directiva 87/250/CEE de la Comisión, la Directiva 90/496/CEE del Consejo, la Directiva 1999/10/CE de la Comisión, la Directiva 2000/13/CE del Parlamento Europeo y del Consejo, las Directivas 2002/67/CE, y 2008/5/CE de la Comisión, y el Reglamento (CE) no 608/2004 de la Comisión. 2011. Available online: https://www.boe.es/doue/2011/304/L00018-00063.pdf (accessed on 5 April 2021).
  35. 1924/2006, R.C.N. Relativo a las Declaraciones Nutricionales y de Propiedades Saludables en los Alimentos. 2006. Available online: https://www.boe.es/doue/2006/404/L00009-00025.pdf (accessed on 12 April 2021).
  36. Flores, I.R.; Vásquez-Murrieta, M.S.; Franco-Hernández, M.O.; Márquez-Herrera, C.E.; Ponce-Mendoza, A.; del Socorro López-Cortéz, M. Bioactive compounds in tomato (Solanum lycopersicum) variety saladette and their relationship with soil mineral content. Food Chem. 2021, 344, 128608. [Google Scholar] [CrossRef]
  37. Martí, R.; Valcárcel, M.; Leiva-Brondo, M.; Lahoz, I.; Campillo, C.; Roselló, S.; Cebolla-Cornejo, J. Influence of controlled deficit irrigation on tomato functional value. Food Chem. 2018, 252, 250–257. [Google Scholar] [CrossRef] [PubMed]
  38. Anlar, H.G.; Bacanli, M. Chapter 24—Lycopene as an antioxidant in human health and diseases. Pathol. Oxidative Stress Diet. Antioxid. 2020, 247–254. [Google Scholar] [CrossRef]
  39. EFSA. Authorising the Placing on the Market of Lycopene as Novel Food Ingredient under Regulation (EC) No 258/97 of the European Parliament and of the Council. Available online: https://eur-lex.europa.eu/legal-content/EN/TXT/HTML/?uri=CELEX:32009D0362&from=EN#d1e32-57-1 (accessed on 4 July 2021).
  40. Carbonell-Barrachina, A.A.; Agustí, A.; Ruiz, J.J. Analysis of flavor volatile compounds by dynamic headspace in traditional and hybrid cultivars of Spanish tomatoes. Eur. Food Res. Technol. 2006, 222, 536–542. [Google Scholar] [CrossRef]
  41. Alonso, A.; Vázquez-Araújo, L.; García-Martínez, S.; Ruiz, J.J.; Carbonell-Barrachina, Á.A. Volatile compounds of traditional and virus-resistant breeding lines of Muchamiel tomatoes. Eur. Food Res. Technol. 2009, 230, 315–323. [Google Scholar] [CrossRef]
Figure 1. Climatic conditions in the greenhouse. (a): Maximum (brown) and minimum (yellow) temperature; (b): Evapotranspiration (ETo) (blue) and vapor pressure deficit (VPD) (grey).
Agriculture 11 00669 g001
Figure 2. Quadratic correlation between: Sugars (glucose and fructose) and total soluble solids (TSS). Four repetitions per treatment were used for the correlation.
Agriculture 11 00669 g002
Figure 3. Quadratic correlation between β-carotene and lycopene content. Four repetitions per treatment were used for the correlation.
Agriculture 11 00669 g003
Figure 4. Descriptive sensory analysis in cherry tomato samples * p < 0.05, ** p < 0.01 and *** p < 0.001.
Agriculture 11 00669 g004
Figure 5. (a) PCA and (b) cluster maps prepared using, (◆) Stress Integral, (●) color, (−) TSS, pH, titratable acidity, maturity index, organic acids, and sugars, (■) antioxidant activity, lycopene¸ β-Carotene and total polyphenol content, (Δ) sensory profile, and (◆) volatile compounds in cherry tomato samples.
Agriculture 11 00669 g005
Figure 6. Quadratic correlation between: (a) Total phenolic content (TPC) and stress integral (SI) and (b) Antioxidant activity content (FRAP). Four repetitions per treatment were used for the correlation.
Agriculture 11 00669 g006
Table 1. Fruit yield and crop water status.
Accumulate
Applied
Water
Leaf Water
Potential
Stress
Integral
Minimum
Potential
Harvest
mmMPaMPa day−1MPag plant −1
ANOVA Test
Week
1*NSNSNSNS
2*NSNSNSNS
3*NSNSNSNS
4*NSNSNSNS
5*NSNSNSNS
6*NSNS*NS
Tukey Multiple Range Test
Week 1
Control350 a−0.4113.4−0.68190
RDI180 b−0.3819.4−0.90219
Week 2
Control392 a−0.6514.7−0.68253
RDI181 b−0.6921.8−0.90247
Week 3
Control438 a−0.6716.6−0.68669
RDI226 b−0.7325.3−0.90511
Week 4
Control502 a−0.5818.7−0.681039
RDI290 b−0.5328.4−0.90969
Week 5
Control558 a−0.4420.0−0.68570
RDI290 b−0.5830.3-0.90422
Week 6
Control614 a−0.6321.6−0.70 b294
RDI290 b-0.7532.9−0.91 a340
NS = not significant at p < 0.05; * significant at p < 0.05. The values (mean of 4 replications) followed by the same letter within the same column do not present statistically significant differences (p < 0.05) according to the Tukey Multiple Range Test. RDI, Regulated deficit irrigation.
Table 2. Morphology and color coordinates of cherry tomatoes as affected by irrigation treatment and time.
Weight (g)Size (mm)Color
LengthWidthL *a *b *CHue
ANOVA Test
Week
1*NS****NS****
2********NS********
3NS*NS**NS**
4NSNSNS*NSNSNSNS
5NS*NSNSNSNSNSNS
6NSNSNSNS*NSNSNS
Tukey Multiple Range Test
Week 1
Control17.8 b39.527.4 b37.0 b14.0 b24.028.0 b59.8 a
RDI18.7 a40.028.6 a37.6 a16.0 a24.429.3 a57.0 b
Week 2
Control17.6 b38.7 b27.7 b37.5 b16.926.0 a31.3 a56.4 a
RDI19.9 a42.1 a28.6 a38.6 a16.223.0 b28.1 b55.2 b
Week 3
Control16.536.4 b27.738.0 b15.1 b24.128.6 b57.8 a
RDI16.737.5 a27.139.1 a16.1 a24.129.1 a56.4 b
Week 4
Control14.134.226.237.5 a19.722.329.848.6
RDI14.634.626.336.7 b20.122.330.048.0
Week 5
Control11.932.3 a24.837.821.022.731.047.3
RDI10.931.2 b23.938.120.722.230.446.9
Week 6
Control8.5325.921.537.522.525.734.248.8
RDI8.1726.020.937.023.526.135.148.1
NS = not significant at p < 0.05; *, **, and *** significant at p < 0.05, 0.01, and 0.001, respectively. The values (mean of 40 replications) followed by the same letter within the same column do not present statistically significant differences (p < 0.05) according to the Tukey Multiple Range Test. RDI, Regulated deficit irrigation.
Table 3. Total soluble solids (TSS, °Brix), pH, titratable acidity (TA, g L−1), maturity index (MI), and content (g kg−1) of organic acids and sugars in the cherry tomatoes as affected by irrigation treatment and time.
TSS°BrixpHTAMIOrganic Acids (g kg−1)Sugars (g kg−1)
(g L−1)CitricTartaricAscorbicTotalGlucoseFructoseTotal
ANOVA Test
Week
1**NSNSNS***NS*********
2*NSNSNS***NS***********
3*NSNS*NSNSNSNS**NS**
4NSNSNS*NS*NS******
5NSNSNSNS**NS*NSNSNS
6*NSNSNS*NSNSNS*****
Tukey Multiple Range Test
Week 1
Control5.80 b4.752.9619.77.97 b1.54 b0.29 b9.8022.89 b24.6 b47.5 b
RDI6.95 a5.263.3520.88.56 a1.70 a0.35 a10.626.39 a28.2 a54.6 a
Week 2
Control7.30 b5.422.7128.18.85 a2.07 b0.8711.8 a28.6 b31.1 b59.7 b
RDI7.48 a5.702.6928.16.70 b2.56 a1.0210.3 b38.5 a40.4 a78.9 a
Week 3
Control7.48 b6.182.5329.7 a8.191.990.9611.131.1 b31.662.7 b
RDI7.63 a6.262.8127.4 b8.212.021.0311.332.1 a32.264.3 a
Week 4
Control8.805.873.6324.3 b10.72.51 a1.2214.4 a37.5 a39.9 b77.4 b
RDI8.435.923.2426.3 a9.992.32 b1.1713.5 b36.1 b42.2 a78.3 a
Week 5
Control8.105.773.0326.89.16 a2.14 a0.9812.3 a32.439.471.8
RDI8.186.882.9827.68.91 b2.00 b0.9311.8 b31.939.171.0
Week 6
Control7.28 b6.443.3122.19.72 b1.730.9712.427.6 b33.7 b61.3 b
RDI7.38 a5.973.4921.510.1 a1.701.0412.828.2 a36.3 a64.5 a
NS = not significant at p < 0.05; *, **, and *** significant at p < 0.05, 0.01, and 0.001, respectively. The values (mean of 4 replications) followed by the same letter within the same column do not present statistically significant differences (p < 0.05) according to the Tukey Multiple Range Test. RDI, Regulated deficit irrigation.
Table 4. Antioxidant activity (ABTS•+, DPPH, and FRAP) and content of lycopene, β-Carotene and total polyphenol content (TPC) in cherry tomatoes as affected by irrigation treatment and time.
ABTS•+DPPHFRAPTPCLycopeneβ-Carotene
(mmol Trolox kg−1)(g GAE kg−1)(mg 100 g−1)
ANOVA Test
Week
1NSNS*NS**NS
2NSNSNSNSNSNS
3NSNSNSNSNSNS
4NS*NSNSNSNS
5NSNSNSNS*NS
6NSNSNSNS***
Tukey Multiple Range Test
Week 1
Control0.661.551.07 b0.390.51 b0.22
RDI0.671.531.27 a0.450.72 a0.29
Week 2
Control0.861.621.730.550.380.26
RDI0.961.821.800.540.310.24
Week 3
Control1.121.812.090.590.520.26
RDI1.271.842.270.600.590.27
Week 4
Control1.471.88 b2.410.720.190.09
RDI1.252.06 a2.270.680.250.09
Week 5
Control1.492.112.640.750.34 b0.11
RDI1.402.002.300.830.44 a0.17
Week 6
Control1.411.912.660.920.34 b0.10 b
RDI1.392.052.720.990.55 a0.20 a
NS = not significant at p < 0.05; * and ** significant at p < 0.05 and 0.01, respectively. The values (mean of 4 replications) followed by the same letter within the same column do not present statistically significant differences (p < 0.05) according to the Tukey Multiple Range Test. RDI, Regulated deficit irrigation.
Table 5. Retention indices and sensory descriptors of the volatile compounds in cherry tomato samples.
CodeVolatile
Compounds
Chemical
Family
RT (min)Retention Indexes Descriptors
ExpLit
V1HexanalAldehyde3.054851820Fatty, green
V2(E)-2-HexenalAldehyde3.583883874Green, sweet, vegetable
V3HexanolAlcohol3.693890888Herbaceous, woody, sweet
V4HeptanalAldehyde4.090914914Oily, fruity, nutty
V5(E)-2-HeptenalAldehyde5.031970970Lemon, green, vegetable
V6BenzaldehydeAldehyde5.325988986Nutty, floral
V76-Methyl-5-hepten-2-oneKetone5.5161000995Oily, herbaceous, green
V8OctanalAldehyde5.89510151014Honey, fruity, fatty, citrus
V9LimoneneTerpene6.54110401039Lemon, orange, citrus
V102-Isobutyl thiazoleThiazole6.81010511043Green
V112-OctenalAldehyde7.33610721071Spicy, herbaceous, green
V12LinaloolTerpenoid8.52111141112Lemon, floral, citrus, sweet
V13NonanalAldehyde8.61611171114Grape, lemon, lime
V14Phenylethyl alcoholAlcohol9.25711361135Honey, rose
V15trans-2-NonenalAldehyde10.55011751169Waxy, fatty
V16Ethyl octanoateEster11.70512081209Apricot, floral, pineapple
V17α-TerpineolTerpenoid11.99012151215Terpene, citrus, floral
V18DecanalAldehyde12.13512191216Waxy, floral, citrus, sweet
V19β-CyclocitralTerpenoid12.89512381234Tropical, herbal, rose, sweet
V20NeralTerpenoid13.53712551256Lemon
V21GeraniolTerpenoid14.41612781277Apricot, berry, rose, sweet
V22GeranialTerpenoid14.69912851279Lemon
V23Nonanoic acidAcid15.36613021293Cheese, waxy
V24Geranyl acetoneKetone22.00814641461Fresh rose leaf, floral, fruity
V25β-IononeKetone23.45514991500Almond, sweet, vegetable
RT = retention time; Exp = experimental; Lit = literature. National Institute of Standards and Technology, NIST (2020); SAFC (2012).
Table 6. Volatile compounds present in the cherry tomato samples.
Volatile Compounds (mg L−1)
CodeV1V2V3V4V5V6V7V8V9V10V11V12V13V14V15V16V17V18V19V20V21V22V23V24V25
ANOVA Test
Week
1NSNSNSNSNSNSNSNSNSNSNSNSNSNSNSNSNS*NSNSNSNSNSNSNS
2NSNSNSNSNSNSNSNSNSNSNSNSNSNSNSNSNSNSNSNSNSNSNSNSNS
3NSNSNSNSNSNSNSNSNSNS*NSNS*NSNS*NSNSNSNSNS**NSNS
4NSNSNSNSNSNSNSNSNSNSNSNSNSNSNSNSNSNSNSNSNSNSNSNSNS
5NSNSNSNSNSNSNSNSNSNSNSNSNSNSNSNSNSNSNSNSNSNSNSNSNS
6NSNSNS*NSNSNSNSNSNSNSNSNSNSNSNSNS*NSNSNSNSNSNSNS
Tukey Multiple Range Test
Week 1
Control0.480.820.610.100.030.060.260.090.240.160.030.080.140.10.020.030.010.04 a0.040.020.010.050.050.110.04
RDI0.180.650.640.020.020.040.280.080.170.100.010.090.110.060.000.060.040.02 b0.020.010.040.030.010.040.01
Week 2
Control0.010.330.070.020.160.030.280.040.220.140.030.070.120.090.010.140.020.040.020.020.010.040.020.030.02
RDI0.000.330.120.020.030.160.100.090.090.050.050.040.070.050.010.020.020.020.010.010.010.020.010.010.01
Week 3
Control0.261.531.760.050.390.210.650.121.141.240.14 a0.160.301.88 a0.030.120.03 a0.090.040.040.030.080.22 a0.220.08
RDI0.120.370.110.010.110.070.250.060.340.310.04 b0.080.130.62 b0.010.090.01 b0.040.010.020.000.030.03 b0.070.01
Week 4
Control0.270.520.110.010.060.030.360.070.080.130.020.020.410.350.030.020.010.060.010.120.080.320.010.380.08
RDI0.460.870.300.050.040.180.550.220.220.230.050.050.470.290.080.020.010.100.030.090.290.230.010.400.04
Week 5
Control0.270.570.100.040.020.060.190.050.070.300.020.050.130.250.010.010.000.040.020.030.010.080.040.190.03
RDI0.660.741.260.090.150.260.580.150.430.830.110.160.741.30 a0.070.020.080.080.080.110.120.300.280.540.88
Week 6
Control0.070.290.080.02 a0.020.040.130.030.150.170.020.040.100.220.010.010.000.02 a0.010.010.030.030.040.050.09
RDI0.100.230.080.00 b0.020.020.080.040.060.080.010.020.090.190.010.000.000.01 b0.010.010.010.030.010.060.01
Note: Code volatile compounds representations Table 4. NS = not significant at p < 0.05; * and ** significant at p < 0.05 and 0.01, respectively. The values (mean of 4 replications) followed by the same letter within the same column do not present statistically significant differences (p < 0.05) according to the Tukey Multiple Range Test. RDI, Regulated deficit irrigation.
Publisher’s Note: MDPI stays neutral with regard to jurisdictional claims in published maps and institutional affiliations.

