Article

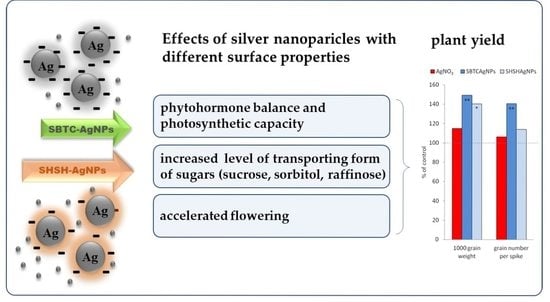
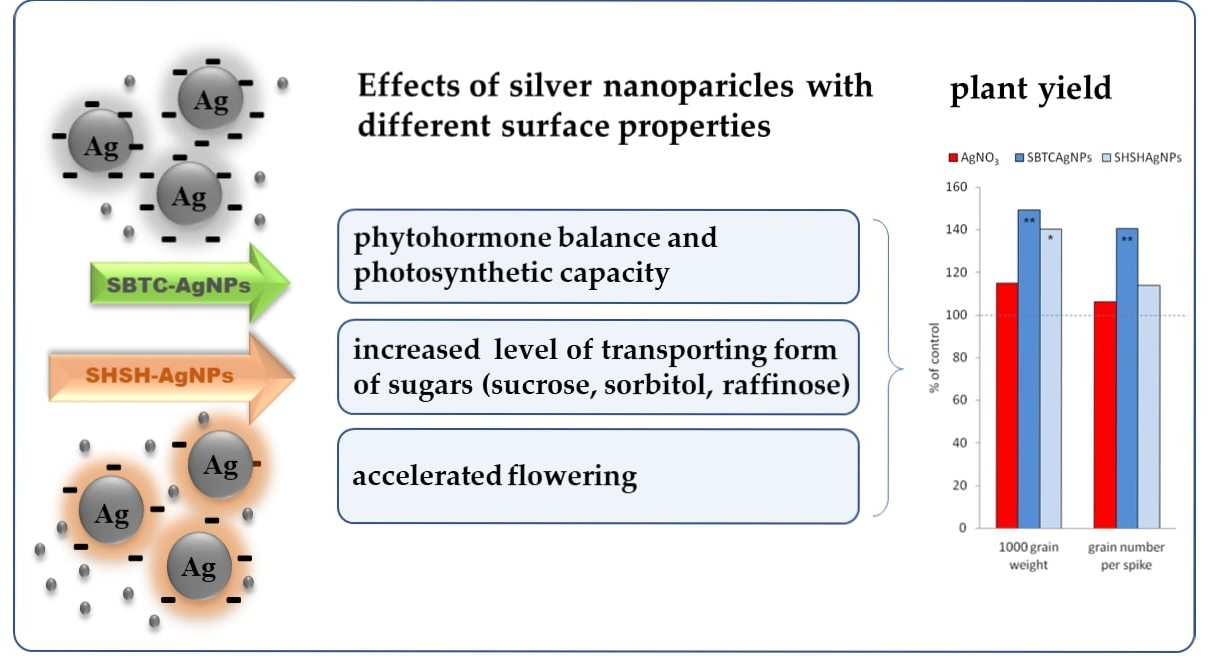
Silver Nanoparticles and Silver Ions Differentially Affect the Phytohormone Balance and Yield in Wheat

1
Department of Plant Breeding, Physiology and Seed Science, University of Agriculture in Krakow, Podłużna 3, PL-30239 Krakow, Poland
2
Department of Microbiology and Biomonitoring, University of Agriculture in Krakow, Mickiewicz Avenue 21, PL-31120 Krakow, Poland
3
Franciszek Górski Institute of Plant Physiology Polish Academy of Sciences, Niezapominajek 21, PL-30239 Krakow, Poland
4
Jerzy Haber Institute of Catalysis and Surface Chemistry Polish Academy of Sciences, Niezapominajek 8, PL-30239 Krakow, Poland
*
Author to whom correspondence should be addressed.
Submission received: 1 July 2021 / Revised: 27 July 2021 / Accepted: 28 July 2021 / Published: 31 July 2021
(This article belongs to the Special Issue The Role of Metallic Nanoparticles in Crop Growth and Development)

Abstract

:
This study aimed to examine the hypothesis that silver nanoparticles (AgNPs) and silver ions might induce specific changes and thereby affect plant development and final yield. The experiment was performed on spring wheat, cultured hydroponically with two types of negatively charged AgNPs of an average size of 13–15 nm and silver ions for 14 days and then transplanted to pots with soil. Our results indicated that treatment with the AgNPs stabilized by specific compounds resulted in growth promotion and a reduced number of days to flowering, while that with the ionic form of Ag only caused greater growth in height without influencing the time to heading. Accelerated flowering was caused by changes in phytohormone balance, with GA6 found to be especially favorable. Nanoparticles and silver ions affected the function of photosystem II and the transport and partitioning of assimilates. Increases in the transport form of sugars such as sucrose, raffinose and sorbitol were associated with a considerable improvement in wheat yield, especially in the case of plants treated with the nanoparticle forms, which were more stable and resistant to oxidative dissolution.

Graphical Abstract

1. Introduction

Nanotechnology has great potential to transform agriculture and food production by influencing the development of sustainable systems of land cultivation. The application of nanoparticles may increase production and allow plants to make better use of nutrients [1,2,3]. Nanotechnology may be used to limit or eliminate the adverse impact of modern agriculture on the environment and in the remediation of arable lands and recovery of its use value [2,4,5,6]. To avoid risks, nanoparticles must be used carefully and all used products should be thoroughly tested and described. Even the smallest changes in the structure or profile of the release of ions from nanoparticles can have completely different consequences for the metabolism of the whole plant.
The phytotoxicity of nanoparticles is caused by oxidative stress, lipid peroxidation and damage to nucleic acids and proteins [7]. They also disturb physiological processes such as photosynthesis, seed germination and transpiration [8,9]. However, this toxic effect of silver nanoparticles on living cells cannot be generalized. The interaction of nanoparticles with living organisms and the environment depends mainly on the way they are transported and their properties, i.e., their size, chemical composition, surface structure, catalytic processes, shape, water and fat solubility and most importantly, the dose [10].
A frequently observed effect caused by nanoparticles is inhibition of growth [11,12]. Many aspects of plant growth and development, including germination and growth in height, are regulated by phytohormones. Inhibition of growth by AgNPs could possibly be an indirect effect of their influence at the level of phytohormones. Phytohormones are natural growth regulators and their accumulation is different in particular stages of growth. They exhibit signal interactions with other phytohormones and with environmental and developmental signaling pathways [13]. Crosstalk of hormonal and environmental signals determines plant phenotype. Moreover, changes in hormonal balance caused by environmental stress factors can also affect the level of other phytohormones [14]. However, the relationship between stress caused by nanoparticles and phytohormone balance is not widely acknowledged.
Photosynthesis is very sensitive to environmental changes in plants exposed to stress. One of the toxicity of nanoparticles could be manifested in the form of reduced photochemical performance of PSII [15]. Chlorophyll a fluorescence reflects the reactions in thylakoid membranes induced by different environmental factors. After absorbing light energy, chlorophyll enters its excited state and then decays through any of the three following pathways: (1) photosynthesis (photochemistry); (2) dissipation as heat or (3) re-emission as chlorophyll a fluorescence or delayed fluorescence [16]. When photosynthetic energy input exceeds its utilization (i.e., when there is an excess of energy), the plant may increase the fraction of absorbed energy that is dissipated as heat in a process known as non-photochemical quenching (NPQ) [17,18].
The plant yield under stress conditions is supported by increased carbon fixation and enzymes responsible for sucrose biosynthesis, such as sucrose phosphate synthase (SPS) and sucrose synthase (SS) [19]. The increase in photosynthesis may increase the number of assimilates that can be used to build a larger yield. Wheat yield and grain weight are restricted by the capacity of source tissues to produce photoassimilates and by their transport to acceptor tissues. The main transported form of photoassimilates are sucrose and raffinose. However, in some cases, the transporting form is also polyol sorbitol [20].
This study aimed to explore the significance of silver ions and AgNPs with different surface properties for the modulation of phytohormone balance, utilization of photoassimilates and photosynthesis process. The overarching issue addressed was to examine the hypothesis that AgNPs and silver ions might induce specific changes and thereby affect plant development and plant yield.

2. Materials and Methods

2.1. AgNP Preparation and Characteristics

Two AgNPs suspensions, obtained by a chemical reduction method, were used in the tests. The first type of AgNPs, indicated as SBTCAgNPs, was obtained by the reduction of silver ions in the mixture of trisodium citrate (TC) and sodium borohydride (SB). The details regarding this synthesis and the purification of the suspension were described by Oćwieja and Adamczyk [21]. SHSHAgNPs were synthesized in the presence of sodium hexametaphosphate (SH) using sodium hypophosphite (SH) [21,22]. The AgNP concentrations in the purified suspensions were determined using a DMA5000M densitometer (Anton Paar, Graz, Austria) according to the procedure described by Oćwieja et al. [23]. The electric conductivity and pH of the suspensions were measured using a CPC-505 multifunctional device (Elmetron, Zabrze, Poland). The sizes and morphology of the AgNPs were determined using a JEOL JSM-7500F scanning electron microscope (JEOL, Peabody, MA, USA) working in transmission mode. The size distribution and average size of AgNPs were determined using MultiScan Base software (Computer Scanning System, Warszawa, Poland). The average size of AgNPs in the suspensions, their stability and electrophoretic mobility were determined using ZetaSizer Nano ZS apparatus (Malvern Panalytical, Malvern, UK) according to the procedure described by Oćwieja et al. [23]. The amount of leached silver ions from the SBTCAgNPs and SHSHAgNPs was determined using a spectrometer PinAAcle 900Z (PerkinElmer, Waltham, MA, USA) and an ion selective electrode perfectI ON™ silver/sulphide electrode, according to the approaches given in works [24,25].
Finally, the stock AgNP suspensions were diluted to a concentration of 10 mg L−1. The pH of diluted suspensions was 6.3. The properties of nanoparticles, respectively, for SHSHAgNPs and SBTCAgNPs were: particle size 13 ± 4 and 15 ± 4 nm; Zeta potential −54 ± 2 and −66 ± 3 mV (at pH 6.3 and ionic strength 10−3 M) and concentration of silver ions released from the suspensions of AgNPs after 10 days 1.04 ± 0.06 and 0.63 ± 0.05 mg L−1. SBTCAgNPs were more stable and resistant to oxidative dissolution than SHSHAgNPs.

2.2. Experimental Design

The experiment was performed on spring wheat (Triticum aestivum L.). The seeds of cv. Tybalt were obtained from the Research Centre for Cultivar Testing (Słupia Wielka, Poland). The sterilization of the surface of seeds was done using a 5% sodium hypochlorite solution for 5 min and then they were rinsed thoroughly several times with deionized water. The seeds were subsequently placed in plastic containers, filled with the AgNPs suspension, silver nitrate solution of Ag+ concentration of 10 mg L−1 or water (control). Four containers containing 100 seeds each were used per treatment. The plants were cultured for 14 days in a greenhouse at 22 °C under natural light (in June, at latitude: 50°03′ N; longitude: 19°55′ E) supplemented with sodium lamps (AGRO Philips sodium lamps, 250 µmol m−2 s−1 PPFD) under 12 h photoperiod. The amount of water/AgNPs suspensions/silver nitrate solutions was 100 mL per one container. After 14 days, the seedlings were transplanted to pots (six pots per treatment, nine plants per pot) (15 cm × 15 cm × 38 cm) containing a mixture of soil, sand and peat in equal volumes and placed in a roofed vegetation hall without sidewalls. The plants were watered to maintain soil moisture at 70% (optimal watering) until the end of the experiment. All analyses were carried out after the transfer of plants to soil, and the observed effects were the result of earlier Ag uptake during the two-week growth in hydroponic culture. PSII efficiency was measured and leaf-tissue samplings—for extractions and measurements to determine the profile of soluble sugars and phytohormones—were taken each week for 3 weeks from the time of transfer to soil. The number of days required to heading of particular plants were recorded. Finally, yield-related parameters were determined.

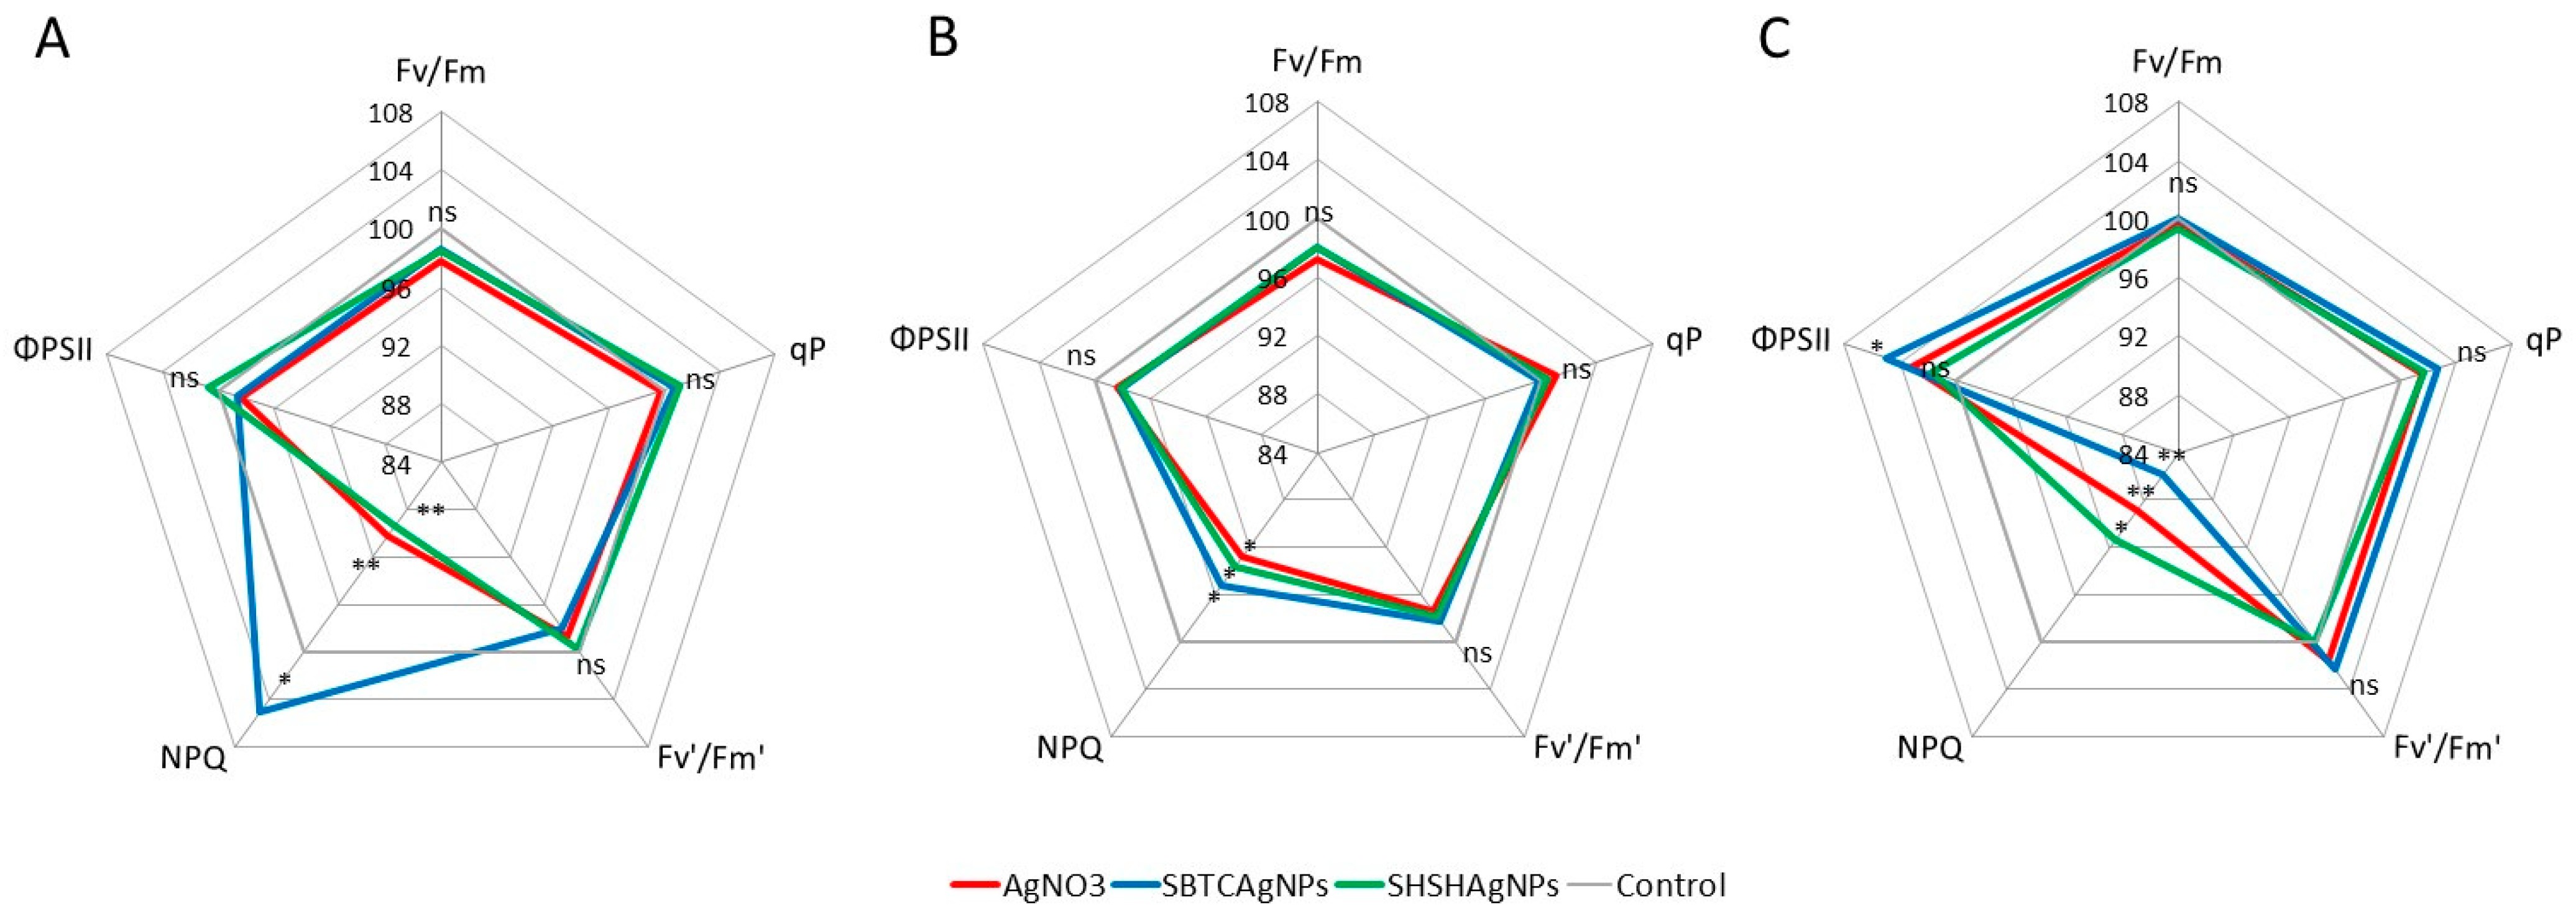
2.3. Slow Kinetic Fluorescence of Chlorophyll a

The slow kinetic fluorescence parameters of chlorophyll a were measured using an FMS2 fluorometer (Hansatech, Kings Lynn, UK). After dark-adaptation of leaves held in clips for 20 min, the following measurements were obtained: the maximum quantum yield of PSII (Fv/Fm), fluorescence when all PSII reaction centers are closed (Fm) and fluorescence when all PSII reaction centers are open (Fo). From light-adapted leaves, the following measurements were obtained: the maximum quantum yield of PSII (Fv′/Fm′) with fluorescence when all PSII reaction centers are closed (Fm′). Steady-state fluorescence (Fs) was recorded after achieving stable values of Fs after re-exposure to light. Current quantum yield (ϕPSII), (Fm′ − Fs)/Fm′, was calculated according to Genty et al. [26]. Photochemical quenching (qp), (Fm′ − Fs)/(Fm′ − Fo′), where Fo′ is the fluorescence in leaves previously exposed to light and darkened just before measurement, was calculated according to Schreiber et al. [27]. NPQ was calculated as (Fm − Fm′)/Fm′ according to Bilger and Björkman [17].

2.4. Soluble Sugars Profiling

Sugars were analyzed according to Pociecha and Dziurka [28] with some modifications. Lyophilized and homogenized samples were extracted in 1 mL of ultra-pure water from Elga Option R (ELGA LabWater, High Wycombe, UK) by shaking for 15 min at 30 Hz (Mixer Mill MM 400, Retsch, Haan, Germany). Then samples were centrifuged for 5 min at 2100× g (Universal 32R, Andreas Hettich, Tuttlingen, Germany). Supernatant was collected, diluted with 1:1 (v/v) acetonitrile, filtered (0.22 um nylon membrane, Costar Spin-X, Corning, NY, USA) and analyzed by HPLC for soluble sugar content. An Agilent 1200 chromatograph (Agilent, Waldbronn, Germany) coupled to an ESA Coulochem II electrochemical detector (ESA, Chelmsford, MA, USA) with an analog-to-digital converter was used. Separation of soluble sugars (glucose, fructose, sucrose and other fructans) was performed on an RCX-10; 100Å; 7 µm; 4.1 × 250 mm column (Hamilton, Reno, NV, USA) at a flow rate of 1.5 cm3 min−1 in gradient mode. Mobile phase A: 75 mM aqueous NaOH solution, B: 500 mM sodium acetate in 75 mM aqueous NaOH solution, 0% A (0–3.5 min), 0–35% B (3.5–19 min), then 0% B (19–20 min). Injection volume was 0.01 cm3, column temperature 40 °C; integration time 20 min. Pulsed Amperometric Detection was employed (analytical potential 200 mV; oxidizing potential 700 mV, reducing potential—900 mV).

2.5. Estimation of Endogenous Phytohormones

Endogenous phytohormone measurements were conducted as described by Hura et al. [29]. Phytohormones (auxins, cytokinins, gibberellins, abscisic acid, jasmonates and salicylic acid) were analyzed by ultrahigh performance liquid chromatography (UHPLC) using an Agilent Infinity 1260 coupled to a 6410 Triple Quad LC/MS ion source with ESI (Electrospray Interface) (Agilent Technologies, Santa Clara, CA, USA). Separation was performed on an Ascentis Express RP-Amide analytical column (2.7 μm, 2.1 mm × 150 mm; Supelco, Bellefonte, PA, USA) at a linear gradient of H2O vs. acetonitrile with 0.01% of HCOOH, in both cases. The monitored hormones were: trans-zeatin (tZ) and cis-zeatin (cZ), [15N4]dihydrozeatin (DHZ-N15, used as ISTD), [15N4]kinetin (K-N15, ISTD) and kinetin (K), [2H5]trans-zeatin riboside (tZR-D5, used as ISTD) and trans-zeatin riboside (tZR), cis-zeatin riboside (cZR), kinetin riboside (KR), gibberellic acid (GA3), [2H5]indole-3-acetic acid (IAA-D5, ISTD) and indole-3-acetic acid (IAA), [2H4]salicylic acid (SA-D4, ISTD), salicylic acid (SA), [2H2]gibberellin A1 (GA1-D2, ISTD), gibberellin A1 (GA1), gibberellin A6 (GA6), [2H6]cis,trans-abscisic acid (ABA-D6, ISTD), cis,trans-abscisic acid (ABA), [2H5]jasmonic acid (JA-D5), jasmonic acid (JA), 2H2]gibberellin A4 (GA4-D2, ISTD), gibberellin A4 (GA4). Multiple reaction monitoring (MRM) transitions were used for the identification and quantification of all compounds of interest (details given by Hura et al. [29] and Płażek et al. [30]). MassHunter software was used to control the LC–MS/MS system and for data analysis. MassHunter Optimizer was used for the optimization of MRM parameters. All standards except JA-D5 (supplied by CND Isotopes (Pointe-Claire, QC, Canada)) and dinorOPDA-D5 (supplied by Cayman Chem. Comp. (Ann Arbor, MI, USA)) were supplied by OlChemim (Olomouc, Czech Republic) at the highest available purity, whereas all solvents were of HPLC-grade from Sigma-Aldrich (Merck KGaA, Darmstadt, Germany).

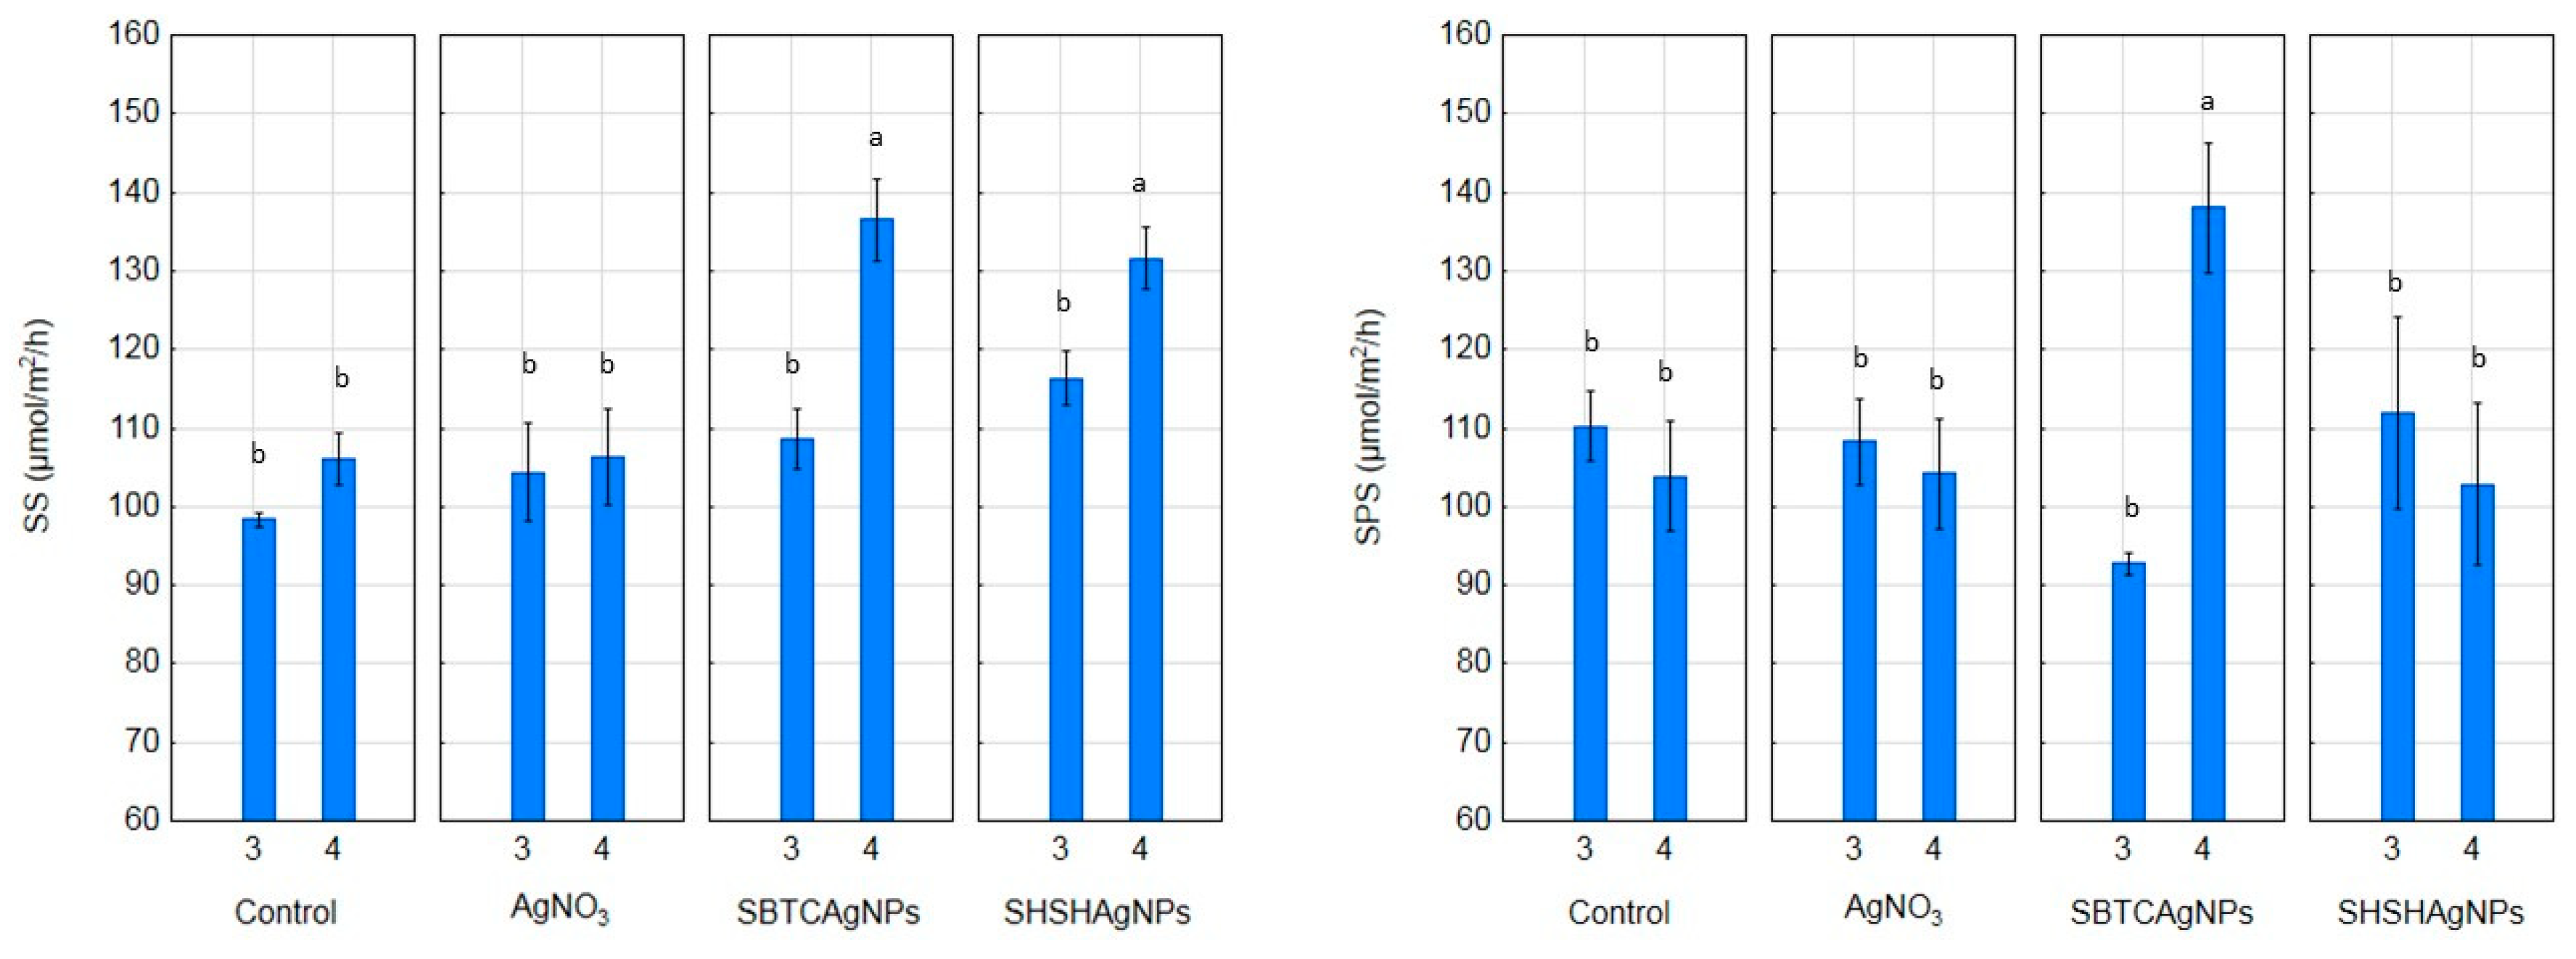
2.6. SS (EC 2.4.1.13) and SPS (EC 2.4.1.14) Activity

SS (EC 2.4.1.13) and SPS (EC 2.4.1.14) activity was measured according to the method of Kalt–Torres and Huber [31]. The extraction buffer contained 50 mM Hepes-NaOH (pH 7.5), 10 mM MgCl2, 1 mM EDTA, 5 mM DTT and 0.5% (w/v) BSA. Enzyme activity was measured at 33 °C by quantitation of sucrose formation using the resorcinol method. Assays contained 7.0 µmol fructose and 3.5 µmol UDP-glucose (SS) or 3.5 µmol fructose and 8.75 µmol UDP-glucose (SPS) dissolved in 50 mM Hepes-NaOH (pH 7.5), 15 mm MgCl2 and 135 µL desalted extract. The reaction was terminated by removing a 70 µL aliquot of the reaction mixture and placing it in a tube containing 70 µL 1 N NaOH. Tubes were boiled to destroy any remaining fructose, then 250 µL 0.1% (w/v) resorcinol in 95% ethanol plus 750 µL 30% (v/v) HCI were added. Tubes were incubated at 80 °C for 8 min and after cooling, the absorbance was measured using an LKB Ultrospec II spectrophotometer (Pharmacia, Sweden) at λ = 520 nm. Sucrose formation was quantitated by comparison to a sucrose standard curve.

2.7. Statistical Analysis of the Results

To validate the use of parametric tests, the normality assumption of ANOVA was verified by the Shapiro–Wilk test. Data was analyzed by multifactor analysis of variance (MANOVA). Graphs were plotted using the means and standard errors (SE) for each data point. A post hoc comparison was conducted using Duncan’s multiple range test (p = 0.05). All calculations were carried out using the STATISTICA 12.0 (TIBCO Software Inc., Palo Alto, CA, USA) software package.

3. Results

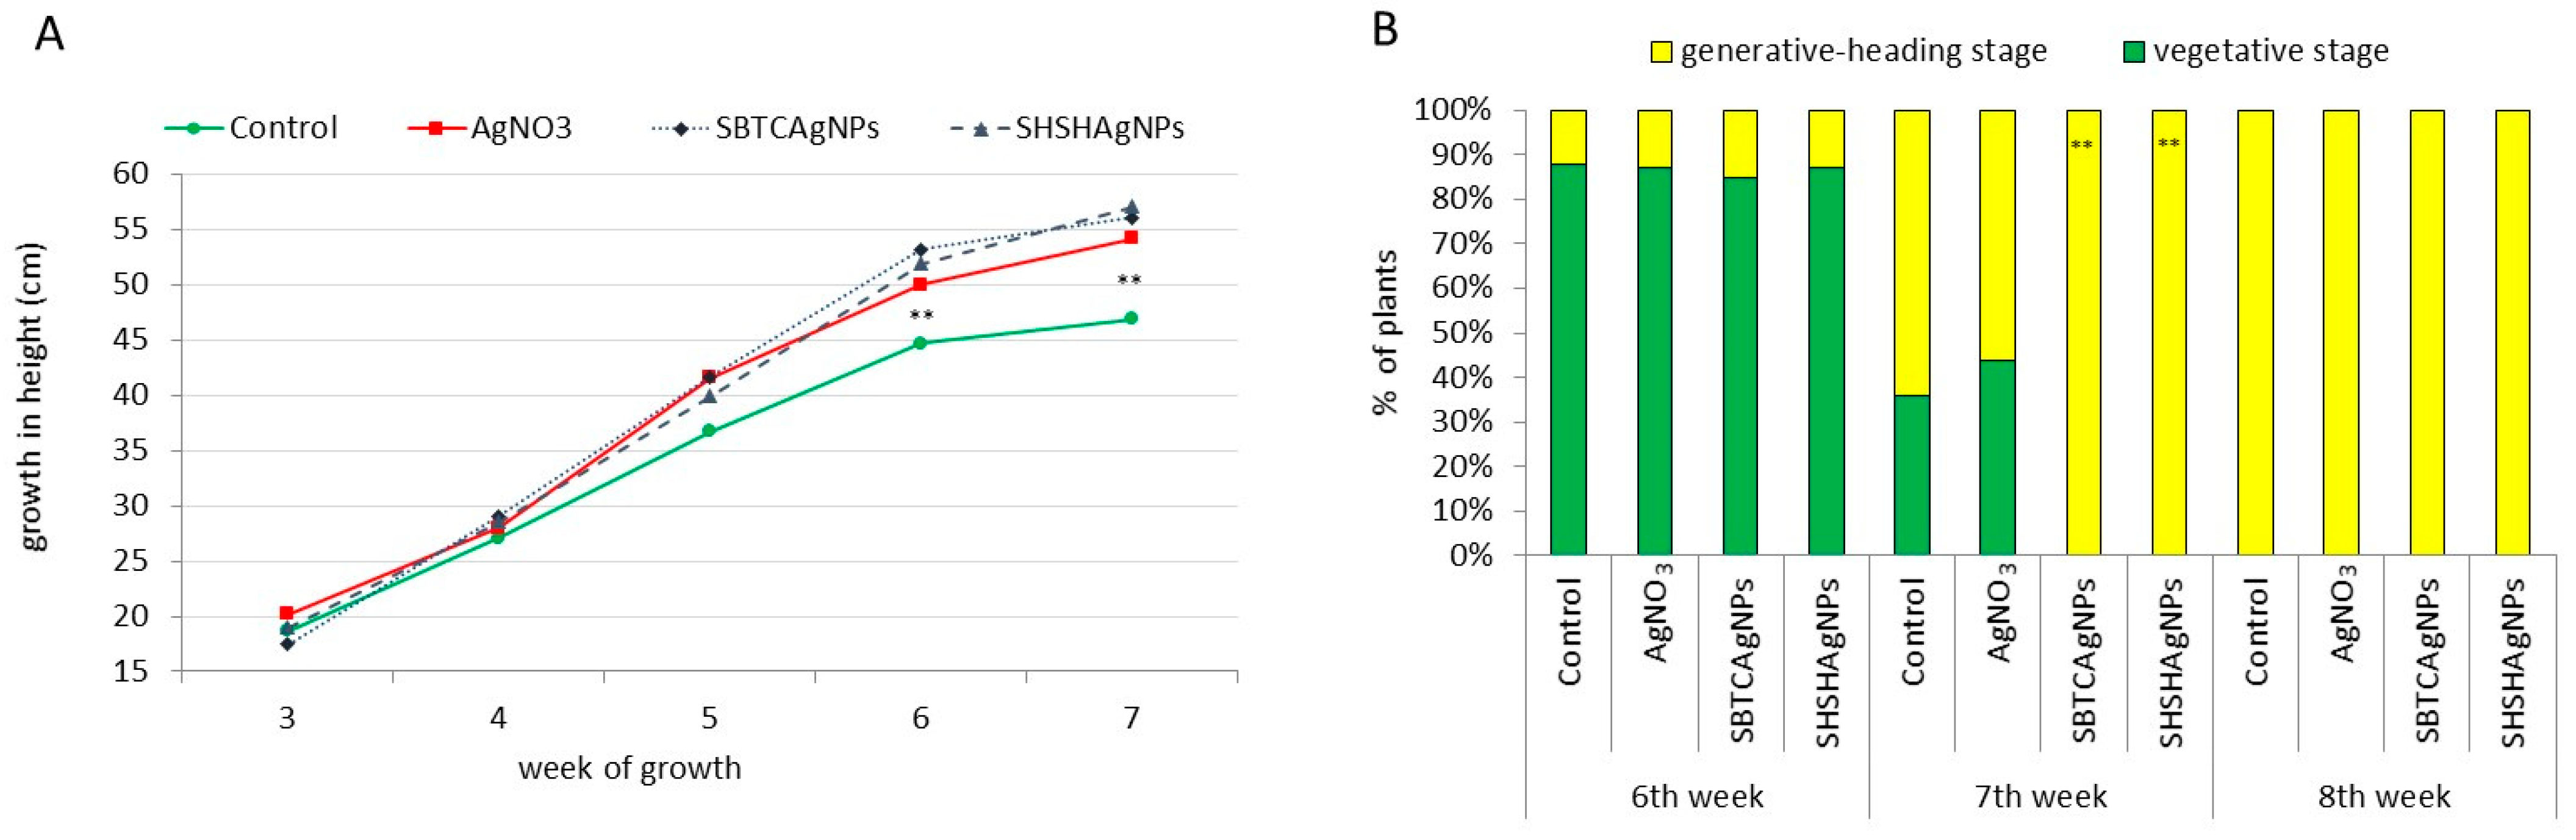
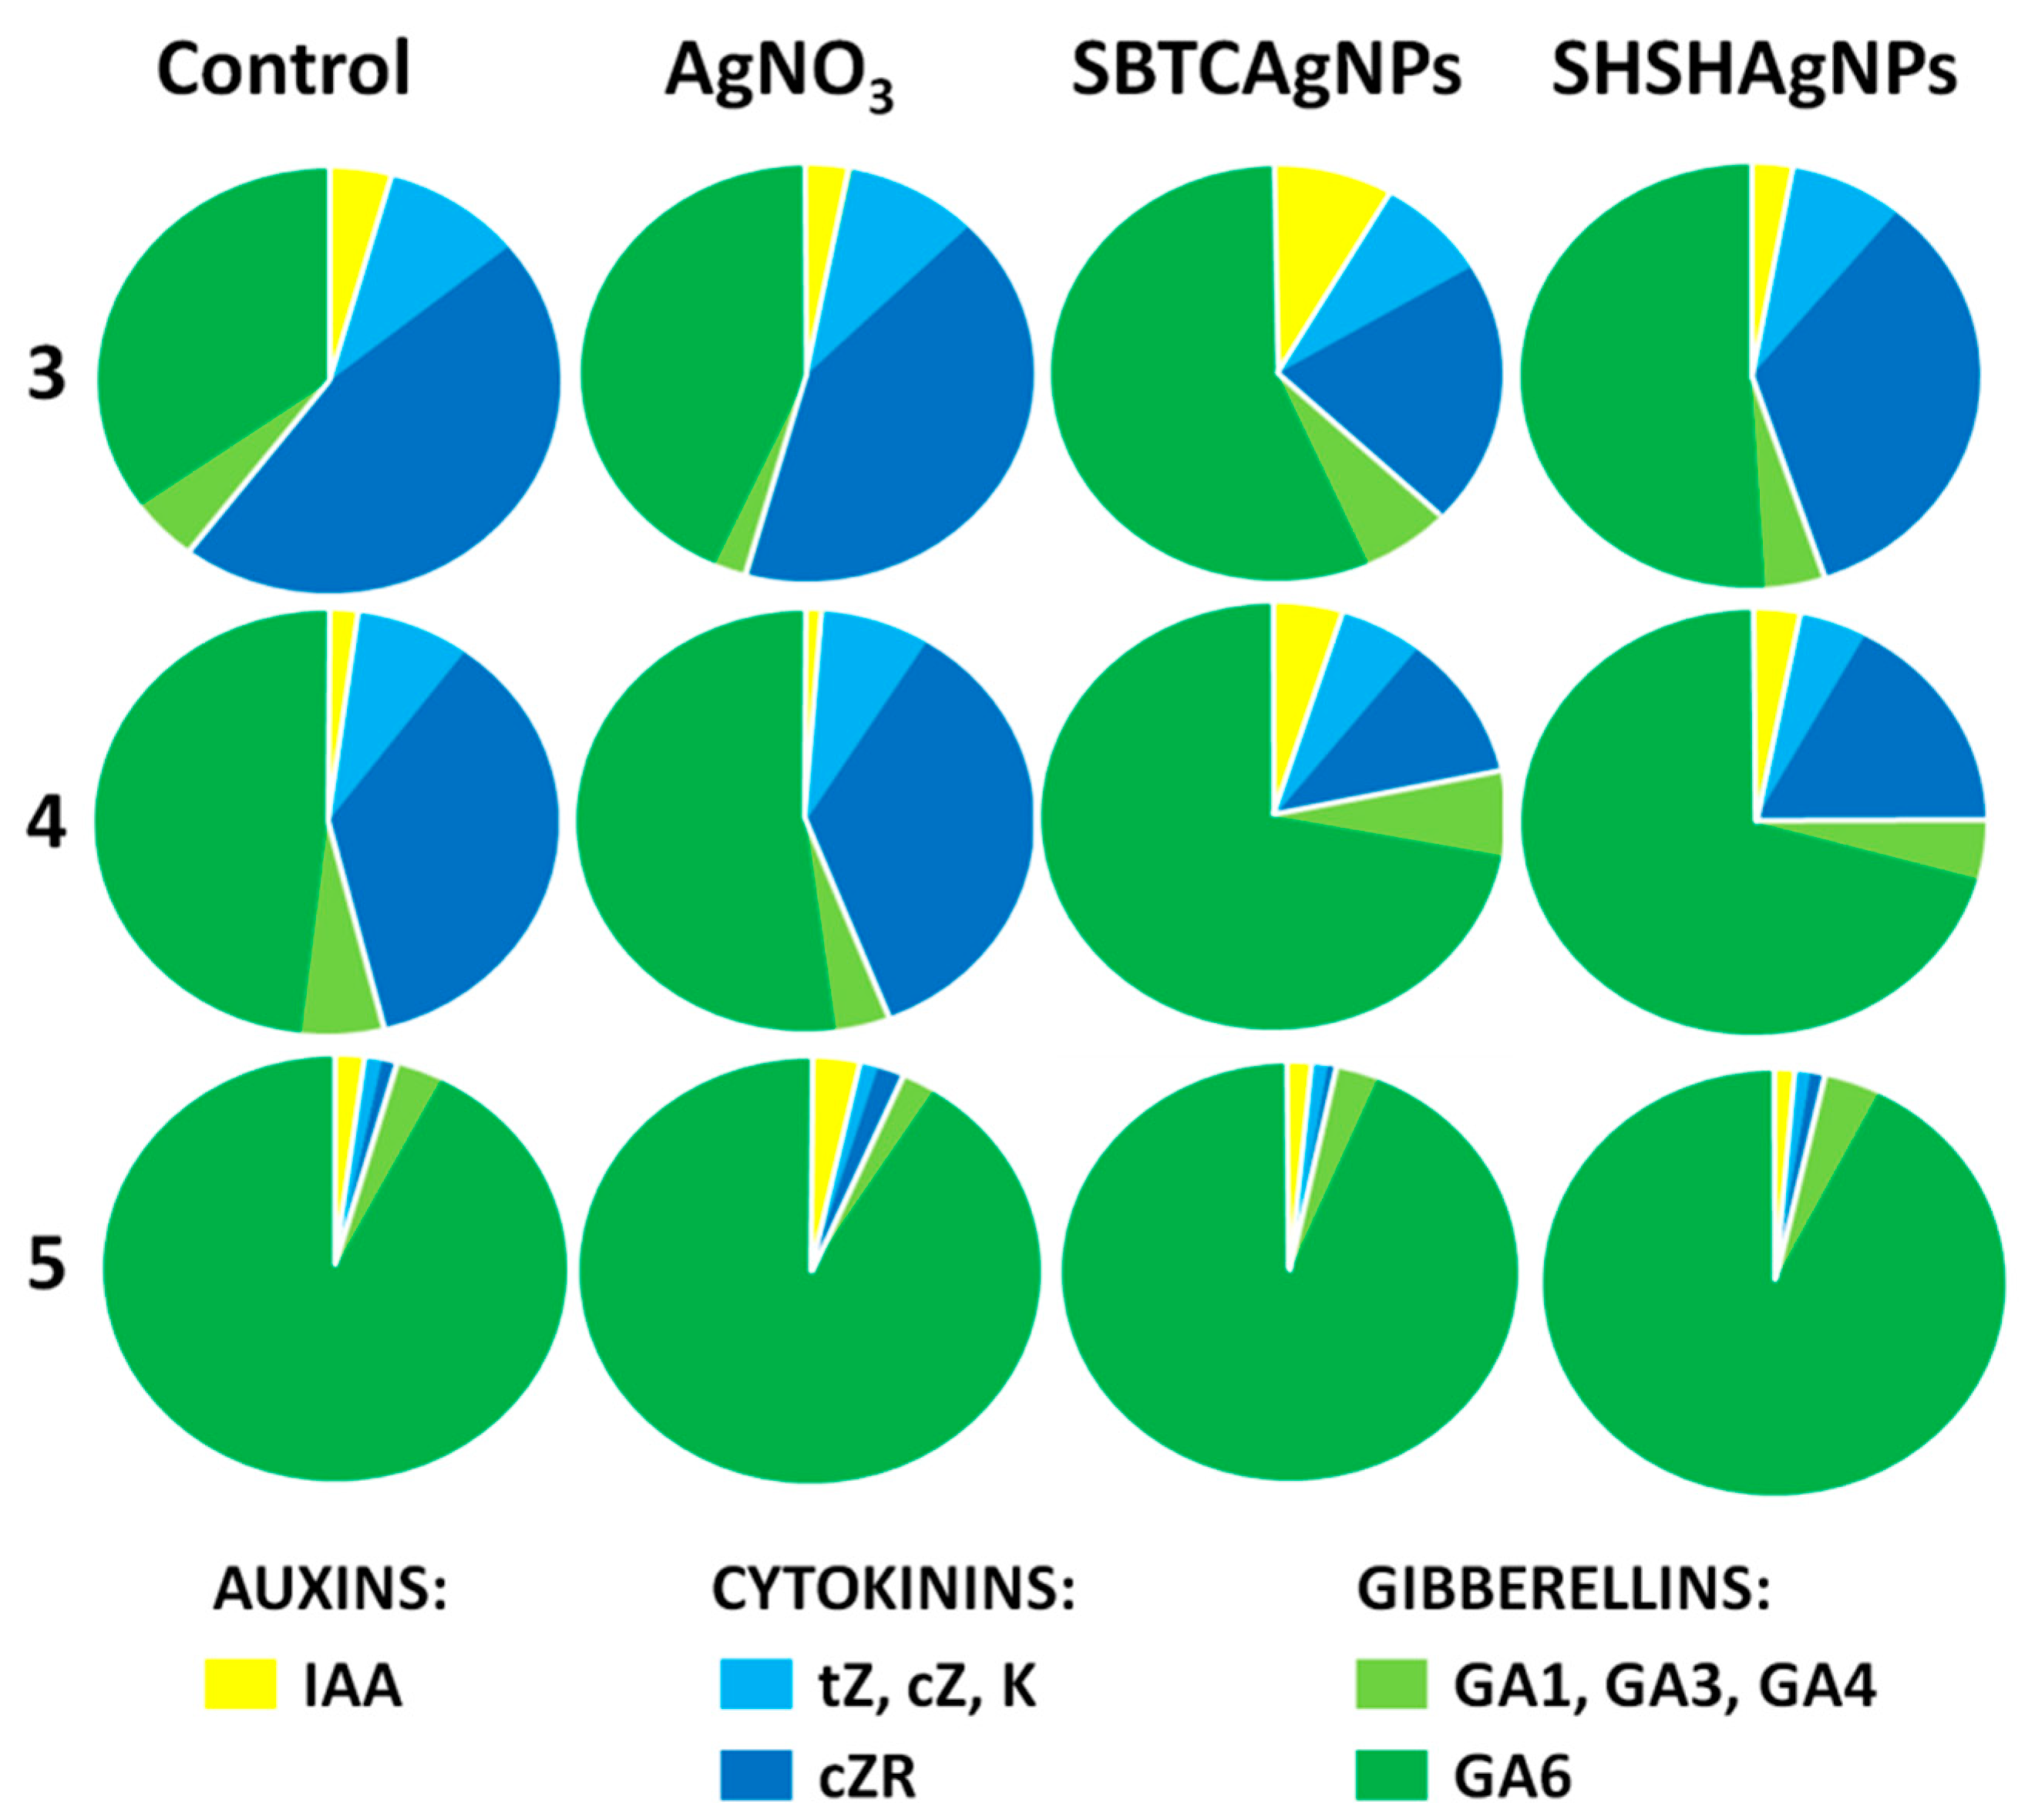
3.1. Influence of the Surface Properties of Charge-Stabilized AgNPs and Silver Ions on Height of Plants, Phytohormone Balance and Time of Flowering

To examine the impacts of silver on plants, the wheat seedlings were cultured with silver ions (Ag+) and AgNPs, the nonionic form of silver, for two weeks in hydroponic culture and, close to the end of experiment, cultured in pots with soil. For testing, the silver ions were delivered in the form of silver nitrate (AgNO3) and two suspensions of SBTCAgNPs and SHSHAgNPs, representing different ion release profiles, were applied. It is worth mentioning that both types of AgNPs exhibited spherical shape and comparable size distribution [21] which was confirmed based on the recorded TEM micrographs. Due to the application of trisodium citrate (TC) and sodium hexametaphosphate (SH) as stabilizing agents, the AgNPs were negatively charged in broad ranges of pH and ionic strengths [21]. The citrate-stabilized AgNPs, herein marked as SBTCAgNPs, were selected for the research due to the fact that this type of AgNPs has been widely applied in diverse branches of science and industry. Citrate-stabilized AgNPs prepared by the Lee and Meisel method were especially dedicated for spectroscopic and catalytic purposes. In the case of diverse biological studies, citrate-stabilized AgNPs are considered a model system used to compare the biological activity or toxicity of other AgNPs characterized by, e.g., opposite surface charge. SHSHAgNPs, obtained under acidic condition with the use of two inorganic phosphate derivatives, belong to the less common type of AgNPs. Nevertheless, it was proven that the presence of sodium hexametaphosphate, which is a well-known permeabilizer of biological membranes, in the stabilizing layer of AgNPs, enhanced their toxicity towards pro- and eukaryotic cells [21,22]. In this way, two types of AgNPs of comparable shape, size and surface charge but diverse chemistry of stabilizing layers and, consequently, of diverse ion release profile, were selected for study. Based on the previous literature and evidence focused on the biological activity of these AgNPs [21,22], it was hypothesized that phytotoxicity of SBTCAgNPs and SHSHAgNPs should be correlated with properties of their stabilizing agents; namely, trisodium citrate and sodium hexametaphosphate.
After the transfer from hydroponic culture to soil, the silver ions and suspensions of SBTCAgNPs and SHSHAgNPs promoted growth in height compared to corresponding untreated control plants (Figure 1A). The differences became apparent after 6 weeks and were the most pronounced after 7 weeks of growth in soil.
As growth rate is controlled by endogenous growth regulators, we examined the levels of these (Table 1). The AgNPs affected hormone balance and caused changes in the proportions of the three main groups of phytohormones, i.e., cytokinins, auxins and gibberellins (Figure 2). After three weeks, the control and AgNO3-treated plants had groups of 56% and 51% of the different cytokinins, about 40% and 46% of gibberellins and 4% and 3% of auxins, respectively. In plants treated with the SBTCAgNPs and SHSHAgNPs, the proportions of cytokinins (29%, 42%) and gibberellins (63%, 55%), respectively, were reversed in comparison to the control. In all treatments, cis-zeatin riboside (cZR) dominated the cytokinins’ spectra, especially in the control and AgNO3-treated plants. In turn, GA6 strongly exceeded the combined amount of GA1, GA3 and GA4, especially in plants treated with the SBTCAgNPs and SHSHAgNPs. After four weeks, the cZR level declined but the decrease was much stronger in plants treated with the SBTCAgNPs and SHSHAgNPs. In parallel, an increase in the level of gibberellins with greater abundance of GA6 was noted, especially in plants treated with the SBTCAgNPs and SHSHAgNPs. It was only the following week that the percentage of cytokinins and auxins decreased significantly in favor of gibberellin (91–95%), represented mainly by GA6. This was similar in all treatments.
The time to flowering of the wheat plants that were treated with either the SBTCAgNPs or SHSHAgNPs was accelerated, while that of the plants treated with silver in ionic form remained unchanged. As shown in Figure 1B, the period of days required to complete flowering was shorter for wheat plants treated with the SBTCAgNPs and SHSHAgNPs. However, those treated with SBTCAgNPs flowered earlier and in larger quantities than those treated with SHSHAgNPs. In the case of ionic silver-treated seedlings, the time to flowering was similar to the control.

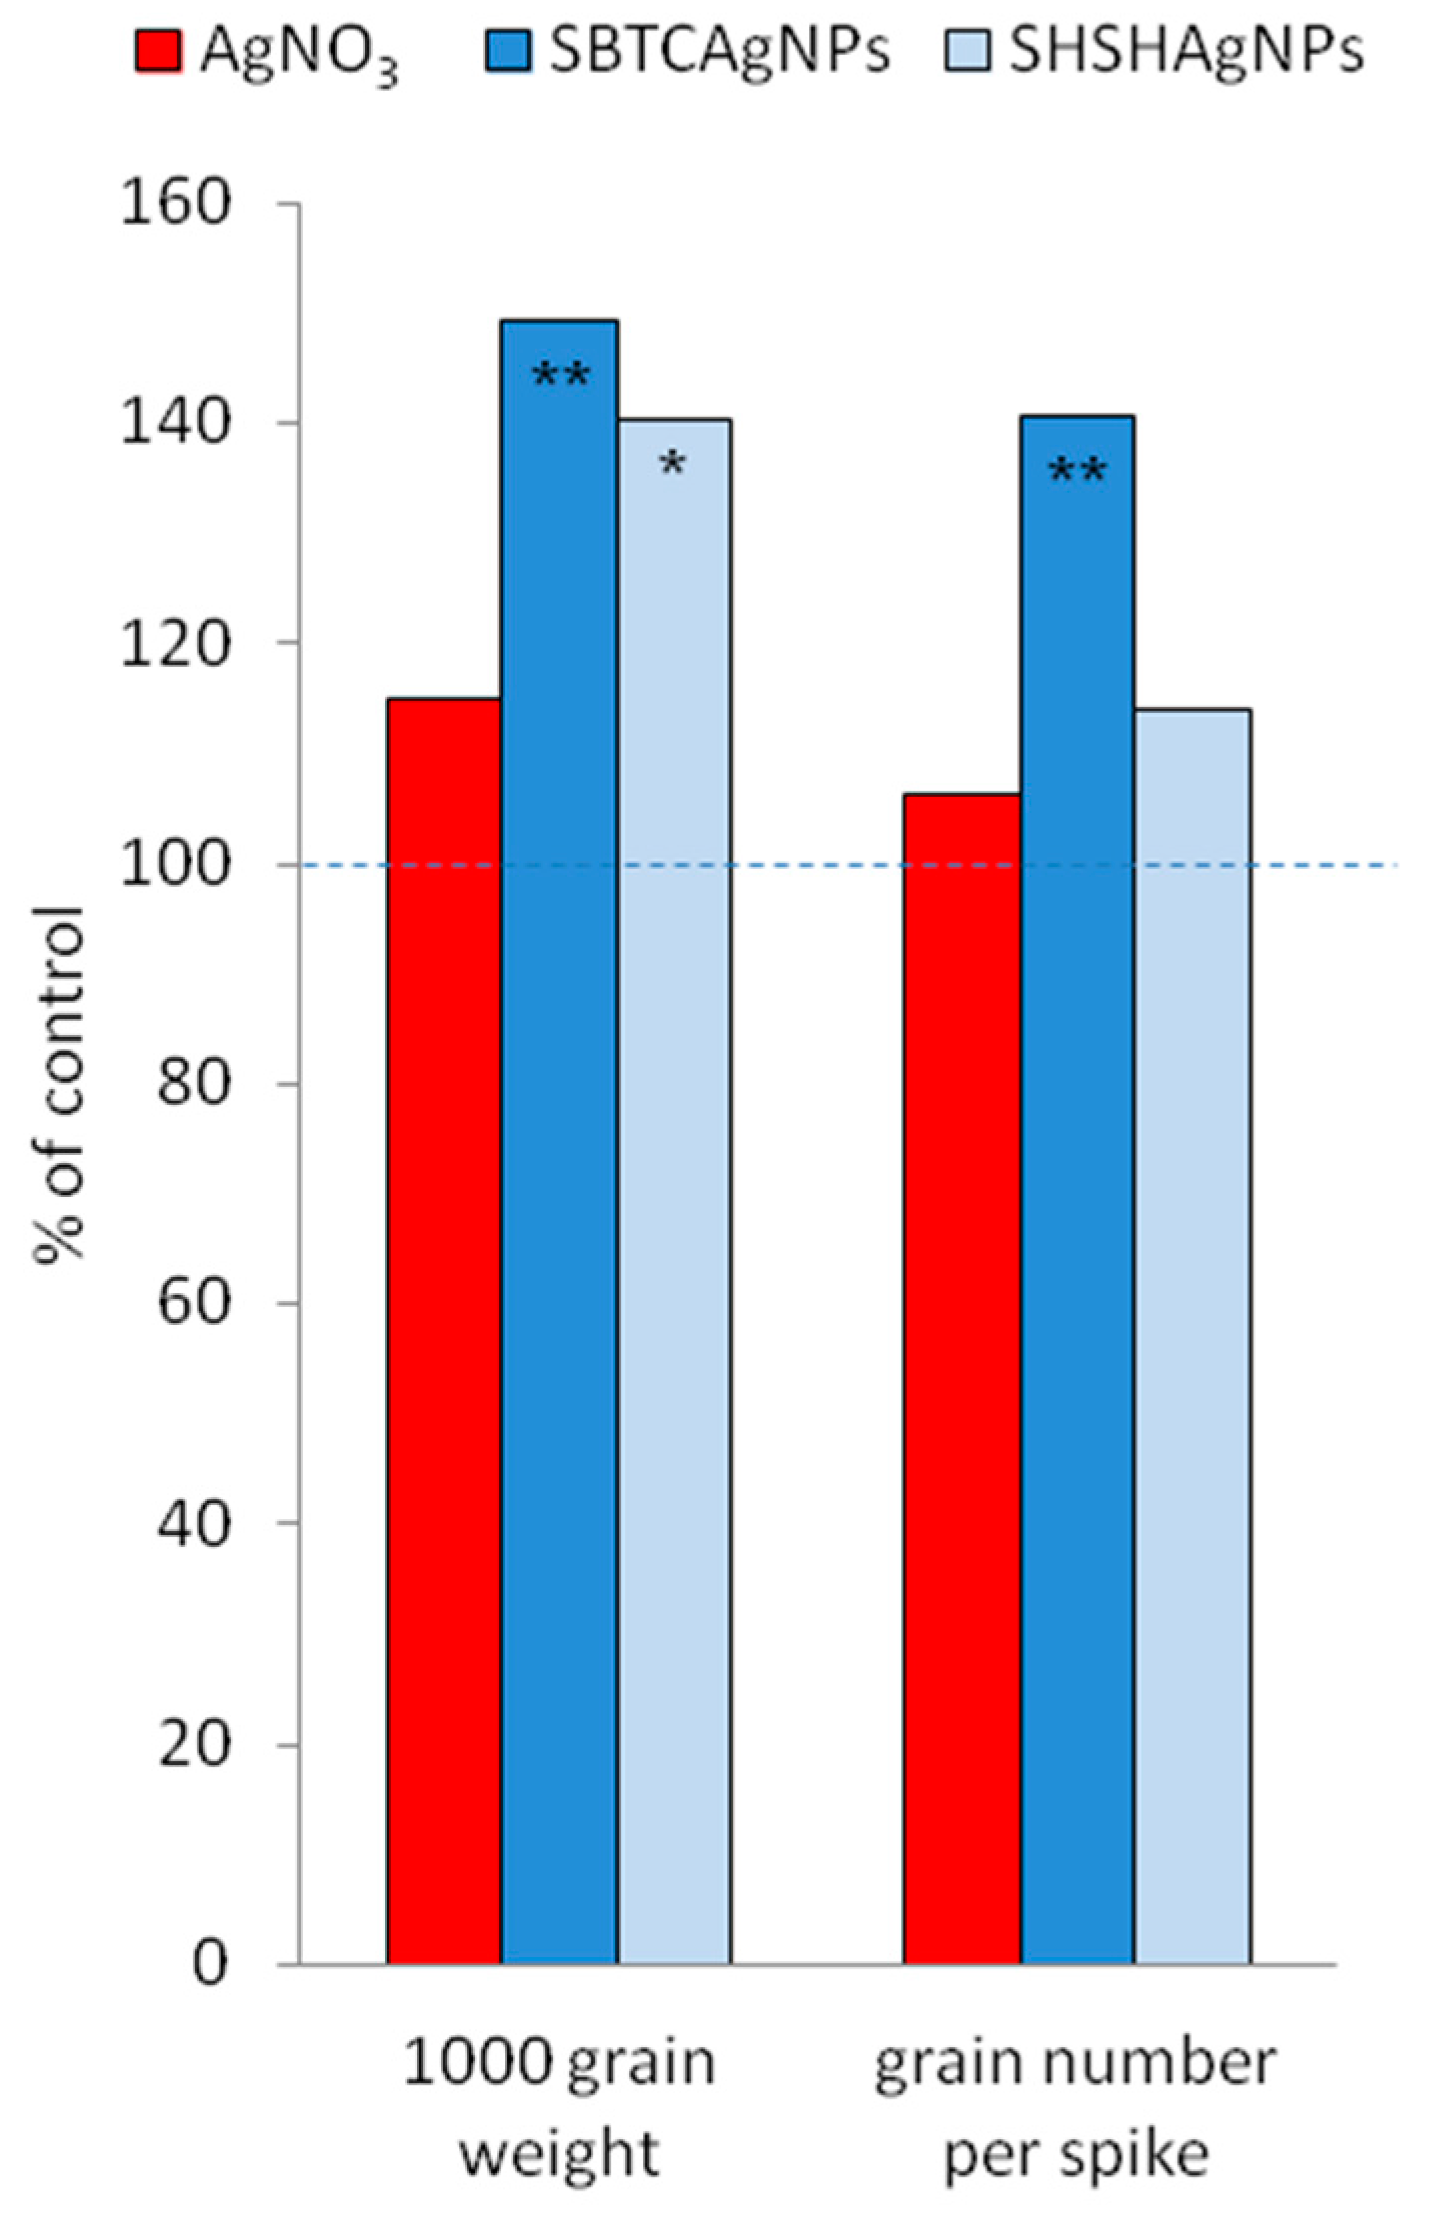
3.2. Influence of the Surface Properties of Charge-Stabilized AgNPs and Silver Ions on Photosynthesis, Soluble Carbohydrates, SPS and SS Activity and Yield

To provide an insight into the physiological mechanisms underlying the growth promotion effect of AgNP treatment, some parameters characterizing the functioning of photosystem II were examined. As shown in Figure 3, photosynthetic efficiency varied with the form of silver (silver ions and AgNPs) and with the surface properties of AgNPs (SBTCAgNPs and SHSHAgNPs). After one week of growth in pots with soil, non-photochemical quenching (NPQ) increased to a greater extent in response to SBTCAgNPs, while in the AgNO3- and SHSHAgNPs-treated plants, a substantial decrease was noted.
This tendency did, however, reverse and, the following week, NPQ values were recorded that were less than the control for all treatments. After a further week of treatment with SBTCAgNPs, the NPQ was much lower, but this was accompanied by an increase in the quantum efficiency of PSII (ϕPSII). At the same time, the lowest values for ϕPSII were noted in response to SHSHAgNPs, indicating a dependence of the aforementioned changes on surface properties. The values for plants treated with ionic silver showed an effect that fell between those treated with SBTCAgNPs and SHSHAgNPs.
The comparison of soluble carbohydrates during growth in soil revealed trends in the quantity of carbohydrates between treatments (Table 2). The control, SBTCAgNPs and SHSHAgNPs plants revealed enhanced levels of glucose, though its levels decreased thereafter. Under treatment with AgNO3, the glucose levels did not differ; however, a tendency to decrease was noted. The fructose level was the highest for the control plants and generally did not differ between the treatments. Sucrose responded with an increase for the duration of the experiment in all treatments, however, its level in the end was much higher in response to treatment with the SBTCAgNPs and SHSHAgNPs. Plants treated with AgNPs also exhibited an enhanced sorbitol level. Interestingly, in the control plants, sugar was detected only at the latter stage of the experiment, in contrast to the plants treated with AgNO3 and both suspensions.
The levels of the transporting forms of sugars, i.e., sorbitol and raffinose, increased in the following weeks of the experiment. Over time, the content of the oligosaccharide kestose, also increased, with the lowest observed increase, significantly, in the control. The increase in sucrose content and export from leaves was confirmed by an increase in SS and SPS activity under the influence of SBTCAgNPs and SHSHAgNPs (Figure 4).
The changes in yield parameters are shown in Figure 5. On average, thousand-grain weight was significantly higher (by 150% and 140%, respectively) for SBTCAgNPs and SHSHAgNPs. The increase for the ionic silver treatment was not significant. The increase in the number of grains per spike was significant only for the SBTCAgNPs-treated plants (140%). The overall yield increase in the case of treatment with AgNPs was due to the increased thousand-grain yield, which was associated with a trend toward an increase in sucrose and sorbitol level.

4. Discussion

There are many questions to be answered in biology concerning the effects of AgNPs on plant metabolism. It is still unclear whether the effects of the use of AgNPs are positive or negative especially since their action may depend on many factors such as size, concentration and surface properties. Here, we focused on the role of the chemical structures of the stabilizing layer around nanoparticles. AgNPs may function differently to ionic silver within the phytohormone regulatory network and therefore may play a significant role in plant metabolism and development. Our research indicated the regulatory role of AgNPs in balancing phytohormones and the functioning of the photosynthetic system, which led to earlier flowering and an increase in yield.
In the present study, the differences in growth in height were probably brought about by means of changes in phytohormones like cytokinins, gibberellins and auxins. In particular, the increase in gibberellin content and the accompanying decrease in cytokinins—observed under influence of both forms of silver nanoparticles and AgNO3—may have been responsible for the increased growth in height.
Positive effects on plant growth were previously found after the application of ZnO NPs [32]. The plant height and biomass of root and shoot of cotton plants increased with the increasing dose of ZnO NPs with no toxicity effects [32]. It was also found that distribution and accumulation of various metal oxide-based nanoparticles in the different plant parts could lead to beneficial and adverse impacts on the synthesis and regulation phytohormones [33]. For example, CeO2 affected IAA, cytokinins (t-ZR) and GA levels while SiO2 affected ABA levels. In turn, CuO NPs treatments resulted in elevated levels of IAA, ABA, and GA relative to control.
The transition between vegetative and reproductive development was accelerated only by AgNPs (not by ionic silver), which induced specific changes in gibberellins’ and cytokinins’ spectra, especially in relation to GA6 and cZR. GA6 strongly exceeded the combined amount of GA1, GA3 and GA4. The earliest (in the 3rd week of growth) and the greatest abundance of GA6 occurred in the SBTCAgNPs-treated plants. The SHSHAgNPs-treated plants also showed a clear predominance of GA6 over other gibberellins, starting from the 4th week of growth. As a consequence, the SBTCAgNPs- and SHSHAgNPs-treated plants recorded the shortest time to flowering compared to the AgNO3-treated and control plants, which is indicative of the role that surface properties play in phytohormone regulation. Gibberellins comprise a large group of members which promote germination, stem elongation and developmental changes such as induction of flowering [34]. The most common active forms responsible for growth promotion are GA1, GA3 GA4 [35]. They stimulate stem elongation much more effectively than GA5. In turn, GA5 (which may be converted into GA6) and GA6 play an important role in flowering [36]. In Lolium temulentum, endogenous GA5 and GA6, produced in the leaves in response to long days and then transported to the apex, have been suggested to control early events of floral initiation [37].
The study revealed that the cis-isomer of zeatin dominated the cytokinins’ spectrum, especially in the control and AgNO3 plants after the 3rd and 4th week of growth, in contrast to the SBTCAgNPs- and SHSHAgNPs-treated plants. Cytokinins are a class of phytohormones responsible for cell division. They include kinetin, trans-zeatin, cis-zeatin, trans-zeatin riboside (tZR) and cis-zeatin riboside (cZR). tZR exhibits higher cell division-promoting activity compared to the much less active cZR [36,38]. Domination of cZR in the cytokinins’ profile (in the control and under treatment with AgNO3) and lack of kinetin at the early stage in the control may explain their lower growth compared to AgNPs. Although AgNO3 did not enhance the growth of plants as much as AgNPs, they were significantly higher than the control, probably due to presence of kinetin in the early stages of the experiment. Kinetin is reported to have anti-stress properties due to the prevention of ROS formation [39]. A smaller amount of less-active cZR under treatment with AgNPs allowed for a greater increase to occur, especially in the SBTCAgNPs-treated plants in which the level of cZR was the lowest.
In the present study, the pattern of phytohormone changes induced by AgNPs was clearly associated with the time of flowering. In turn, the earlier onset of the transition between vegetative and generative developmental stages was linked to higher yield. The final yield was shaped by the following components: the thousand-grain weight (TGW), in response to SBTCAgNPs and SHSHAgNPs treatment and the number of grains per spike resulting from the number of fertile florets [40], in response to SBTCAgNPs treatment.
One strategy to explain the increase in the yield potential of wheat is that it optimized photosynthetic performance and the partitioning of assimilates to grains. Our results suggest that the treatments with AgNPs positively affected both the functioning of photosystem II and the utilization of assimilates. Optimizing photosynthesis under unfavorable conditions requires an adjustment in energy partitioning in photosystem II (PSII) between photochemical and non-photochemical processes. Non-photochemical quenching (NPQ) gives an indication of the portion of absorbed energy that is dissipated as heat and not trapped by reaction centers. Excess dissipation of energy indicates the effects of stress on the components of the PSII [41]. In contrast, the increase in the NPQ parameter is indicative of the photoprotection function [42,43], since energy absorbed in excess leads to photooxidative damage to the thylakoid membrane resulting from formation of hazardous reactive oxygen species [44,45].
One week after transfer from hydroponic culture (during which plants were having to make more of an effort to cope with stress) to soil, some changes in photosynthesis were triggered. The greater NPQ values, in response to SBTCAgNPs reflected photoprotection from photooxidative damages while SHSHAgNPs and AgNO3, caused a fall in this parameter. After the second week, all forms of silver led to a decrease in the NPQ values below the control and this trend deepened in the following week. At the same time, an increase in quantum efficiency of PSII and antennae efficiency of PSII, especially under treatment with SBTCAgNPs, was observed.
The main forms of photoassimilates’ transport are sucrose and raffinose. Together with sucrose and raffinose, the polyols, such as sorbitol, are used for long-distance transport in phloem. Increased transport and phosphorylation of sucrose reflects higher SPS activity [46,47]. In turn, SS is responsible for the reaction of sucrose synthesis in leaves and sucrose degradation in grains [48,49]. The availability of sucrose translates into higher seed yield, since seed filling is largely dependent on assimilate supply [40]. Feeding sucrose through the flag leaf significantly increased the number of fertile florets in wheat when compared to the control [40]. Lastly, in sink tissues, sucrose is converted to starch. The increase in photosynthetic efficiency was accompanied by an increase in sucrose and sorbitol content starting from the fourth week of growth, but only in the case of AgNPs, and not in plants treated with ionic silver. Moreover, AgNPs stimulated the activity of the regulatory enzyme in sucrose synthesis. SS and SPS activities were upregulated by SBTCAgNPs and SHSHAgNPs. Our previous studies showed that AgNPs applied in a hydroponic culture are taken up by the roots and then moved into the above-ground parts of plants [11]. The transport of nanoparticles takes place mainly via the xylem, but nanoCuO has also been detected in the phloem in Zea mays L. [50]. Moreover, leaves exposed to NPs accumulated them in the stomata instead of in the xylem and translocated them to other parts of the plant via the phloem [51]. We suppose that it is precisely the presence of AgNPs in the phloem that may have an effect on the increased proportion of sugars with a transport function—and in turn, a favorable effect on yield.

5. Conclusions

Our results indicate that treatment with AgNPs stabilized by specific compounds resulted in growth promotion and a reduced number of days to flowering, while that with the ionic form of Ag caused only greater growth in height without influencing the time to heading. Accelerated flowering was caused by changes in phytohormone balance, with GA6 found to be especially favorable. Our study also proved that the surface properties of AgNPs play a profound role in the functioning of photosystem II and the transport and partitioning of assimilates. Increases in transport sugars such as sucrose, raffinose and sorbitol were associated with enhanced wheat yield, especially in plants treated with SBTCAgNPs, which were more stable and resistant to oxidative dissolution than SHSHAgNPs.

Author Contributions

E.P. and A.G. conceived and planned the research; E.P., A.G., M.D., E.M. and M.O. collected and analyzed the data; E.P. interpreted the data and wrote the manuscript. A.G. and M.O. revised and edited the manuscript. All authors have read and agreed to the published version of the manuscript.

Funding

The study was financed by the Polish Government e Ministry of Science and Higher Education grant to the Faculty of Agriculture and Economics, University of Agriculture in Krakow, no. DS3113 and DS3143. The ion release measurements were carried out thanks to financial support from the Polish Ministry of Science and Higher Education (MNiSW) under Iuventus Plus No. IP 2015 055974 grant.

Institutional Review Board Statement

Not applicable.

Informed Consent Statement

Not applicable.

Data Availability Statement

Data sharing not applicable.

Acknowledgments

The authors would like to thank Stanislaw Walas from the Jagiellonian University for the AAS measurements.

Conflicts of Interest

The authors declare no conflict of interest. The funders had no role in the design of the study; in the collection, analyses, or interpretation of data; in the writing of the manuscript, or in the decision to publish the results.

References

  1. Chen, H.; Yada, R. Nanotechnologies in agriculture: New tools for sustainable development. Trends Food Sci. Technol. 2011, 22, 585–594. [Google Scholar] [CrossRef]
  2. Liu, R.; Lal, R. Potentials of engineered nanoparticles as fertilizers for increasing agronomic productions. Sci. Total Environ. 2015, 514, 131–139. [Google Scholar] [CrossRef] [PubMed]
  3. Elemike, E.E.; Uzoh, I.M.; Onwudiwe, D.C.; Babalola, O.O. The Role of Nanotechnology in the Fortification of Plant Nutrients and Improvement of Crop Production. Appl. Sci. 2019, 9, 499. [Google Scholar] [CrossRef] [Green Version]
  4. Sekhon, B.S. Nanotechnology in agri-food production: An overview. Nanotechnol. Sci. Appl. 2014, 7, 31–35. [Google Scholar] [CrossRef] [PubMed] [Green Version]
  5. Guerra, F.D.; Attia, M.F.; Whitehead, D.C.; Alexis, F. Nanotechnology for environmental remediation: Materials and applications. Molecules 2018, 23, 1760. [Google Scholar] [CrossRef] [Green Version]
  6. Rajput, V.D.; Minkina, T.; Kumari, A.; Singh, V.K.; Verma, K.K.; Mandzhieva, S.; Sushkova, S.; Srivastava, S.; Keswani, C. Coping with the Challenges of Abiotic Stress in Plants: New Dimensions in the Field Application of Nanoparticles. Plants 2021, 10, 1221. [Google Scholar] [CrossRef]
  7. Arruda, S.C.C.; Silva, A.L.D.; Galazzi, R.M.; Azevedo, R.A.; Arruda, M.A.Z. Nanoparticles applied to plant science: A review. Talanta 2015, 131, 693–705. [Google Scholar] [CrossRef] [PubMed]
  8. Tripathi, D.K.; Shweta Singh, S.; Singh, S.; Pandey, R.; Singh, V.P.; Sharma, N.C.; Prasad, S.M.; Dubey, N.K.; Chauhan, D.K. An overview on manufactured nanoparticles in plants: Uptake translocation accumulation and phytotoxicity. Plant Physiol. Biochem. 2017, 110, 2–12. [Google Scholar] [CrossRef]
  9. Yin, L.; Colman, B.P.; McGill, B.M.; Wright, J.P.; Bernhardt, E.S. Effects of silver nanoparticle exposure on germination and early growth of eleven wetland plants. PLoS ONE 2012, 7, e47674. [Google Scholar] [CrossRef] [Green Version]
  10. Wang, J.; Koo, Y.; Alexander, A.; Yang, Y.; Westerhof, S.; Zhang, Q.; Schnoor, J.L.; Colvin, V.L.; Braam, J.; Alvarez, P.J.J. Phytostimulation of Poplars and Arabidopsis Exposed to Silver Nanoparticles and Ag+ at Sublethal Concentrations. Environ. Sci. Technol. 2013, 47, 5442–5449. [Google Scholar] [CrossRef]
  11. Gorczyca, A.; Pociecha, E.; Kasprowicz, M.J.; Niemiec, M. Effect of nanosilver in wheat seedlings and Fusarium culmorum culture systems. Eur. J. Plant Pathol. 2015, 142, 251–261. [Google Scholar] [CrossRef]
  12. Vinković, T.; Štolfa-Čamagajevac, I.; Tkalec, M.; Goessler, W.; Domazet-Jurašin, D.; Vinković-Vrček, I. Does plant growing condition affects biodistribution and biological effects of silver nanoparticles? Span. J. Agric. Res. 2019, 16, e0803. [Google Scholar] [CrossRef]
  13. Gray, W.M. Hormonal regulation of plant growth and development. PLoS Biol. 2004, 9, 1270–1273. [Google Scholar] [CrossRef] [PubMed] [Green Version]
  14. Tarkowská, D.; Strnad, M. Plant ecdysteroids, plant sterols with intriguing distributions biological effects and relations to plant hormones. Planta 2016, 244, 545–555. [Google Scholar] [CrossRef] [PubMed]
  15. Gao, J.; Xu, G.; Qian, H.; Liu, P.; Zhao, P.; Hu, Y. Effects of nano-TiO2 on photosynthetic characteristics of Ulmus elongata seedlings. Environ. Pollut. 2013, 176, 63–70. [Google Scholar] [CrossRef]
  16. Govindjee. Chlorophyll fluorescence. In Chlorophyll a Fluorescence: A Signature of Photosynthesis, 1st ed.; Papageorgiou, G.C., Govindjee, Eds.; Springer: Berlin/Heidelberg, Germany, 2004; pp. 1–42. [Google Scholar]
  17. Bilger, W.; Björkman, O. Temperature-dependence of violaxanthin deepoxidation and nonphotochemical fluorescence quenching in intact to leaves Gossypium hirsutum L. & Malva parviflora L. Planta 1991, 184, 226–234. [Google Scholar] [CrossRef] [PubMed]
  18. Maxwell, K.; Johnson, G.N. Chlorophyll fluorescence—A practical guide. J. Exp. Bot. 2000, 51, 659–668. [Google Scholar] [CrossRef]
  19. Counce, P.A.; Gravois, K.A. Sucrose synthase activity as a potential indicator of high rice grain yield. Crop Sci. 2006, 46, 1501–1507. [Google Scholar] [CrossRef] [Green Version]
  20. Pommerrenig, B.; Papini-Terzi, F.S.; Sauer, N. Differential regulation of sorbitol and sucrose loading into the phloem of Plantago major in response to salt stress. Plant Physiol. 2007, 144, 1029–1038. [Google Scholar] [CrossRef] [Green Version]
  21. Oćwieja, M.; Adamczyk, Z. Monolayers of silver nanoparticles obtained by chemical reduction methods. Surf. Innov. 2014, 2, 160–172. [Google Scholar] [CrossRef]
  22. Barbasz, A.; Czyżowska, A. Is there a way to protect human immune cells against nanocytotoxicity? Mol. Simulat. 2019, 45, 585–594. [Google Scholar] [CrossRef]
  23. Oćwieja, M.; Adamczyk, Z.; Morga, M.; Michna, A. High density silver nanoparticle monolayers produced by colloid self-assembly on polyelectrolyte supporting layers. J. Colloid Interface Sci. 2011, 364, 39–48. [Google Scholar] [CrossRef] [PubMed]
  24. Adamczyk, Z.; Oćwieja, M.; Mrowiec, H.; Walas, S.; Lupa, D. Oxidative dissolution of silver nanoparticles: A new theoretical approach. J. Colloid Interface Sci. 2016, 469, 355–364. [Google Scholar] [CrossRef]
  25. Gorczyca, A.; Przemieniecki, S.W.; Kurowski, T.; Oćwieja, M. Early plant growth and bacterial community in rhizoplane of wheat and flax exposed to silver and titanium dioxide nanoparticles. Environ. Sci. Pollut. Res. 2018, 25, 33820–33826. [Google Scholar] [CrossRef] [PubMed] [Green Version]
  26. Genty, B.; Briantais, J.-M.; Baker, N.R. The relationship between the quantum yield of photosynthetic electron transport and quenching of chlorophyll fluorescence. Biochem. Biophys. Acta 1989, 990, 87–92. [Google Scholar] [CrossRef]
  27. Schreiber, U.; Bilger, W.; Neubauer, C. Chlorophyll fluorescence as a non intrusive indicator for rapid assessment of in vivo photosynthesis. In Excophysiology of Photosynthesis; Schultze, E.-D., Caldwell, M.M., Eds.; Springer: Berlin, Germany, 1994; p. 4970. [Google Scholar] [CrossRef]
  28. Pociecha, E.; Dziurka, M. Trichoderma interferes with cold acclimation by lowering soluble sugars accumulation resulting in reduced pink snow mould (Microdochium nivale) resistance of winter rye. Environ. Exp. Bot. 2015, 109, 193–200. [Google Scholar] [CrossRef]
  29. Hura, T.; Dziurka, M.; Hura, K.; Ostrowska, A.; Dziurka, K.; Gadzinowska, J. Wheat and rye genome confer specific phytohormone profile features and interplay under water stress in two phenotypes of triticale. Plant Physiol. Biochem. 2017, 118, 494–509. [Google Scholar] [CrossRef]
  30. Płażek, A.; Dubert, F.; Kopeć, P.; Dziurka, M.; Kalandyk, A.; Pastuszak, J.; Waligórski, P.; Wolko, B. Long-Term Effects of Cold on Growth; Development and Yield of Narrow-Leaf Lupine May Be Alleviated by Seed Hydropriming or Butenolide. Int. J. Mol. Sci. 2018, 19, 2416. [Google Scholar] [CrossRef] [PubMed] [Green Version]
  31. Kalt-Torres, W.; Huber, S.C. Diurnal changes in Maize leaf photosynthesis. Plant Physiol. 1987, 83, 294–298. [Google Scholar] [CrossRef] [PubMed] [Green Version]
  32. Venkatachalam, P.; Priyanka, N.; Manikandan, K.; Ganeshbabu, I.; Indiraarulselvi, P.; Geetha, N.; Muralikrishna, K.; Bhattacharya, R.C.; Tiwari, M.; Sharma, N.J.; et al. Enhanced plant growth promoting role of phycomolecules coated zinc oxide nanoparticles with P supplementation in cotton (Gossypium hirsutum L.). Plant Physiol. Biochem. 2017, 110, 118–127. [Google Scholar] [CrossRef]
  33. Singh Brar, R.; Kumar, A.; Kaur, S. Impact of metal oxide nanoparticles on cotton (Gossypium hirsutum L.): A physiological perspective. J. Cotton Res. 2021, 4, 16. [Google Scholar] [CrossRef]
  34. Hedden, P.; Thomas, S.G. Gibberellin biosynthesis and its regulation. Biochem. J. 2012, 444, 11–25. [Google Scholar] [CrossRef] [Green Version]
  35. Davies, P.J. (Ed.) The plant hormones: Their nature, occurrence, and functions. In Plant Hormones, 3rd ed.; XIV,802; Springer: Dordrecht, The Netherlands, 2010; pp. 1–15. [Google Scholar] [CrossRef]
  36. King, R.W.; Mander, L.N.; Asp, T.; MacMillan, C.P.; Blundell, C.A.; Evans, L.T. Selective Deactivation of Gibberellins below the Shoot Apex is Critical to Flowering but Not to Stem Elongation of Lolium. Mol. Plant 2008, 1, 295–307. [Google Scholar] [CrossRef] [PubMed]
  37. King, R.W.; Evans, L.T.; Mander, L.M.; Moritz, T.; Pharis, R.P.; Twitchin, B. Synthesis of gibberellin GA6 and examination of its role in flowering of Lolium temulentum. Phytochemistry 2003, 62, 77–82. [Google Scholar] [CrossRef]
  38. Schäfer, M.; Brütting, C.; Meza-Canales, I.D.; Großkinsky, D.K.; Vankova, R.; Baldwin, I.T.; Meldau, S. The role of cis-zeatin-type cytokinins in plant growth regulation and mediating responses to environmental interactions. J. Exp. Bot. 2015, 66, 4873–4884. [Google Scholar] [CrossRef] [Green Version]
  39. Ahanger, M.A.; Alyemeni, M.N.; Wijaya, L.; Alamri, S.A.; Alam, P.; Ashraf, M.; Ahmad, P. Potential of exogenously sourced kinetin in protecting Solanum lycopersicum from NaCl-induced oxidative stress through up-regulation of the antioxidant system, ascorbate-glutathione cycle and glyoxalase system. PLoS ONE 2018, 13, e0202175. [Google Scholar] [CrossRef] [PubMed]
  40. Fischer, R.A. Wheat. In Potential Productivity of Field Crops under Different Environments; Smith, W.H., Banta, J.J., Eds.; IRRI: Los Baños, CA, USA, 1984; pp. 129–154. [Google Scholar]
  41. Strasser, R.J.; Srivastava, A.; Tsimilli-Michael, M. The fluorescence transient as a tool to characterize and screen photosynthetic samples. In Probing Photosynthesis, Mechanism, Regulation and Adaptation; Yunus, M., Pathre, U., Mohanty, P., Eds.; Taylor and Francis: London, UK, 2000; Chapter 25; pp. 443–480. [Google Scholar]
  42. Osmond, C.B. What is photoinhibition? Some insights from comparisons of shade and sun plants. In Photoinhibition of Photosynthesis, from Molecular Mechanisms to the Field; Baker, N.R., Bowyer, J.R., Eds.; Bios Scientific Publishers: Oxford, UK, 1994; pp. 1–24. [Google Scholar]
  43. Pociecha, E.; Dziurka, M.; Waligórski, P.; Krępski, T.; Janeczko, A. 24-Epibrassinolide pre-treatment modifies cold-induced photosynthetic acclimation mechanisms and phytohormone response of perennial ryegrass in cultivar-dependent manner. J. Plant Growth Regul. 2017, 36, 618–628. [Google Scholar] [CrossRef] [Green Version]
  44. Barber, J.; Andersson, B. Too much of a good thing, light can be bad for photosynthesis. Trends Biochem. Sci. 1992, 12, 61–66. [Google Scholar] [CrossRef]
  45. Huner, N.P.A.; Öquist, G.; Sarhan, F. Energy balance and acclimation to light and cold. Trends Plant Sci. 1998, 3, 224–230. [Google Scholar] [CrossRef]
  46. Huber, S.C.; Huber, J.L. Role and regulation of sucrose-phosphate synthase in higher plants. Ann. Rev. Plant Biol. 1996, 47, 431–444. [Google Scholar] [CrossRef]
  47. Winter, H.S.; Huber, C. Regulation of Sucrose Metabolism in Higher Plants, Localization and Regulation of Activity of Key Enzymes. Crit. Rev. Biochem. Mol. Biol. 2000, 35, 253–289. [Google Scholar] [CrossRef] [PubMed]
  48. Wang, L.; Lu, Q.; Wen, X.; Lu, C. Enhanced Sucrose Loading Improves Rice Yield by Increasing Grain Size. Plant Physiol. 2015, 169, 2848–2862. [Google Scholar] [CrossRef] [PubMed] [Green Version]
  49. Wang, B.; Ma, M.; Lu, H.; Meng, Q.; Li, G.; Yang, X. Photosynthesis sucrose metabolism and starch accumulation in two NILs of winter wheat. Photosynth. Res. 2015, 126, 363–373. [Google Scholar] [CrossRef]
  50. Wang, Z.; Xie, X.; Zhao, J.; Liu, X.; Feng, W.; White, J.C.; Xing, B. Xylem- and phloem-based transport of CuO nanoparticles in maize (Zea mays L.). Environ. Sci. Technol. 2012, 46, 4434–4441. [Google Scholar] [CrossRef] [PubMed]
  51. Eichert, T.; Goldbach, H.E. Equivalent pore radii of hydrophilic foliar uptake routes in stomatous and astomatous leaf surfaces—Further evidence for a stomatal pathway. Physiol. Plant. 2008, 132, 491–502. [Google Scholar] [CrossRef]
Figure 1. Growth in height of the control and the AgNO3-, SBTCAgNPs- and SHSHAgNPs-treated wheat plants from the 3rd to 7th week of growth (A). The percentage of wheat plants at vegetative and generative (heading) stages of development in control and the AgNO3-, SBTCAgNPs- and SHSHAgNPs-treated wheat plants at the 6th, 7th and 8th week of growth (B). Significant differences to the control within the term are given by asterisks: ** p < 0.01.
Agriculture 11 00729 g001
Figure 2. Proportions between three main group of phytohormones of the control and the AgNO3, SBTCAgNPs and SHSHAgNPs treated wheat plants from the 3rd to 5th week of growth.
Agriculture 11 00729 g002
Figure 3. Parameters of slow kinetic fluorescence of chlorophyll a in leaves of the control and the AgNO3-, SBTCAgNPs- and SHSHAgNPs-treated wheat plants after the 3rd (A), 4th (B) and 5th (C) week of growth. The following parameters were measured: maximum quantum yield in dark-adapted (Fv/Fm) and light-adapted (Fv′/Fm′) leaves, current quantum yield (ϕPSII), photochemical quenching (qp) and non-photochemical quenching (NPQ). The presented data (arbitrary units) are mean values for the silver-treated plants, expressed as a percentage of the control values based on 10 replicates. Significant differences to the control are given by asterisks: ** p < 0.01; * p < 0.05.
Agriculture 11 00729 g003
Figure 4. Sucrose Synthase (SS) and Sucrose Phosphate Synthase (SPS) activity in leaves of the control and the AgNO3, SBTCAgNPs and SHSHAgNPs treated wheat plants after the 3rd and 4th week of growth. The presented data are mean values based on five replicates. Mean values marked with the same letter within a treatment did not differ significantly according to Duncan’s test at p ≤ 0.05.
Agriculture 11 00729 g004
Figure 5. Yield-related parameters of the control and the AgNO3-, SBTCAgNPs- and SHSHAgNPs-treated wheat plants shown as percentages of the control plants (100%). Significant differences to the control are given by asterisks: ** p < 0.01; * p < 0.05.
Agriculture 11 00729 g005
Table 1. Endogenous phytohormone content (ng/g DW) in the leaves of the control and the AgNO3-, SBTCAgNPs- and SHSHAgNPs-treated wheat plants after 3, 4 and 5 weeks of growth. The presented data are the mean values based on 5 replicates ± SE. The mean values marked with the same letter within a parameter (phytohormone) did not differ significantly according to Duncan’s test, where p ≤ 0.05 (nd—not detected).
ControlAgNO3SBTCAgNPsSHSHAgNPs
tZ329.35 ± 5.99 a30.59 ± 4.32 a22.44 ± 1.14 b28.63 ± 1.90 ab
47.63 ± 1.34 c7.65 ± 1.93 c6.05 ± 0.43 c5.90 ± 1.38 c
54.21 ± 0.6 c3.74 ± 0.62 c4.84 ± 0.79 c4.62 ± 0.11 c
cZ3117.89 ± 7.25 a116.06 ± 11.00 a52.19 ± 6.52 bc85.08 ± 3.13 ab
4114.19 ± 25.61 a103.96 ± 34.13 a42.56 ± 9.82 cd48.97 ± 4.41 bc
513.66 ± 3.01 cd15.00 ± 4.46 cd7.32 ± 1.69 d6.74 ± 0.39 d
K3nd3.52 ± 0.47 a4.28 ± 0.34 a3.94 ± 0.03 a
43.48 ± 1.38 a2.41 ± 0.01 a3.67 ± 0.01 a3.36 ± 0.01 a
54.52 ± 0.01 a3.07 ± 0.01 a4.55 ± 0.40 a4.64 ± 0.49 a
tZ(R)312.57 ± 5.06 a16.28 ± 0.24 a13.79 ± 1.79 a16.72 ± 1.85 a
43.73 ± 0.16 b3.90 ± 1.29 b2.20 ± 0.40 b1.84 ± 0.28 b
51.30 ± 0.01 b1.50 ± 0.01 b1.58 ± 0.09 b1.60 ± 0.14 b
cZ(R)3698.17 ± 107.64 a668.32 ± 79.37 ab203.12 ± 21.83 d510.48 ± 58.08 c
4574.12 ± 25.42 abc535.35 ± 52.70 bc103.78 ± 10.01 de203.49 ± 17.95 d
520.64 ± 7.10 e29.35 ± 11.59 e9.19 ± 2.72 e17.72 ± 5.58 e
GA435.26 ± 1.47 bcd8.00 ± 1.27 ab8.79 ± 1.10 a7.07 ± 0.91 abc
42.96 ± 0.87 d4.77 ± 1.42 bcd4.69 ± 1.11 bcd3.88 ± 1.37 cd
53.23 ± 1.08 d4.05 ± 0.77 cd2.71 ± 0.09 d3.25 ± 0.63 d
GA3341.61 ± 5.58 a16.71 ± 9.56 a32.67 ± 0.01 a33.83 ± 6.75 a
455.85 ± 26.05 a35.83 ± 12.29 a37.07 ± 16.26 a31.52 ± 0.01 a
527.75 ± 7.78 a17.77 ± 3.00 a24.38 ± 8.95 a30.83 ± 0.19 a
GA1326.08 ± 5.86 ab16.67 ± 1.50 b21.43 ± 2.73 b24.54 ± 3.31 ab
435.02 ± 0.01 a18.34 ± 1.04 b16.99 ± 1.25 b19.64 ± 3.43 b
522.29 ± 1.64 b16.77 ± 1.16 b22.00 ± 4.49 b22.00 ± 2.14 b
GA63454.30 ± 40.10 b652.73 ± 124.22 b494.16 ± 83.39 b704.15 ± 68.94 b
4677.67 ± 120.75 b731.55 ± 161.38 b614.24 ± 156.35 b798.03 ± 103.83 b
51513.78 ± 88.50 a1417.05 ± 135.90 a1443.15 ± 353.70 a1314.17 ± 86.25 a
ABA3919.41 ± 34.33 cd195.15 ± 42.98 d683.67 ± 92.59 bcd562.35 ± 56.66 bcd
4423.79 ± 173.62 cd629.44 ± 17.42 bcd664.69 ± 115.39 bcd749.77 ± 117.54 bcd
5843.01 ± 44.67 cd620.632 ± 80.67 bcd1561.19 ± 230.69 a1142.39 ± 182.83 ab
JA33280.87 ± 434.59 b784.73 ± 164.89 c8456.72 ± 358.65 a744.84 ± 137.38 c
471.70 ± 25.84 c492.02 ± 15.00 c223.47 ± 59.61 c8782.62 ± 728.12 a
565.12 ± 7.97 c276.96 ± 8.71 c303.12 ± 52.65 c179.31 ± 22.17 c
IAA365.53 ± 14.89 ab51.04 ± 16.41 abc82.53 ± 6.37 a47.20 ± 34.36 abc
436.36 ± 7.34 bc19.65 ± 3.38 c46.54 ± 12.52 abc37.18 ± 1.59 bc
532.41 ± 4.01 bc53.51 ± 11.41 abc25.48 ± 5.80 bc20.86 ± 3.38 c
Table 2. The carbohydrate composition (µg/mg DW) in the leaves of the control and the AgNO3-, SBTCAgNPs- and SHSHAgNPs-treated wheat plants after 3, 4 and 5 weeks of growth. The presented data are the mean values based on 5 replicates ± SE. The mean values marked with the same letter within a parameter (sugar) did not differ significantly according to Duncan’s test, where p ≤ 0.05 (nd—not detected).
WeekGlucoseFructoseSucroseSorbitolRafinoseMaltoseKestose
CONTROL325.01 ± 4.63 bcd20.12 ± 3.77 bc22.38 ± 3.38 cnd0.99 ± 0.1 c3.16 ± 0.61 c1.90 ± 0.3 e
441.13 ± 6.15 a32.21 ± 5.34 a36.96 ± 7.39 cnd1.67 ± 0.2 bc3.95 ± 0.49 c5.80 ± 0.94 d
518.46 ± 2.48 cd21.05 ± 2.5 bc60.24 ± 7.56 b13.74 ± 1.54 b1.67 ± 0.98 bc4.59 ± 0.68 bc8.14 ± 0.56 cd
AgNO3327.40 ± 4.09 bcd22.14 ± 2.32 b20.01 ± 2.47 cnd0.93 ± 15 c3.19 ± 0.33 c2.06 ± 0.29 e
427.74 ± 4.41 bcd24.45 ± 3.2 b59.10 ± 6.1 b10.70 ± 0.1 bc1.30 ± 0.1 c4.19 ± 0.7 bc6.76 ± 2.17 d
516.60 ± 0.96 d18.38 ± 0.7 bc64.52 ± 4.7 b9.96 ± 0.2 c2.52 ± 0.1 ab7.06 ± 3.05 a12.91 ± 0.51 b
SBTCAgNPs317.95 ± 2.7 cd12.56 ± 2.23 c28.67 ± 10.07 cnd1.01 ± 0.2 c3.40 ± 0.48 c2.27 ± 0.44 e
428.57 ± 2.06 bc19.82 ± 1.34 bc97.79 ± 6.51 a0.98 ± 0.11 d1.31 ± 0.28 c4.02 ± 0.12 c6.47 ± 1.06 d
520.64 ± 1.98 cd20.22 ± 0.91 bc102.94 ± 6.25 a19.25 ± 1.31 a2.74 ± 0.27 a4.79 ± 0.53 bc10.94 ± 0.22 bc
SHSHAgNPs322.13 ± 2.23 bcd18.68 ± 1.2 bc27.73 ± 2.78 cnd0.92 ± 0.05 c3.39 ± 0.2 c1.68 ± 0.13 e
432.73 ± 2.78 ab21.04 ± 0.76 bc83.63 ± 6.77 a0.64 ± 0.04 d1.21 ± 0.04 c3.53 ± 0.14 c4.96 ± 0.82 de
516.88 ± 2.43 d17.74 ± 1.77 bc94.96 ± 1.07 a17.75 0.08 a2.39 ± 0.52 ab6.14 ± 0. 16 ab16.50 ± 0.67 a
Publisher’s Note: MDPI stays neutral with regard to jurisdictional claims in published maps and institutional affiliations.

