
Potential Ecological Risks of Heavy Metals in Agricultural Soil Alongside Highways and Their Relationship with Landscape


1
College of Landscape Architecture, Nanjing Forestry University, Nanjing 210037, China
2
College of Land Management, Nanjing Agricultural University, Nanjing 210095, China
*
Author to whom correspondence should be addressed.
Agriculture 2021, 11(8), 800; https://0-doi-org.brum.beds.ac.uk/10.3390/agriculture11080800
Submission received: 29 July 2021
/
Revised: 12 August 2021
/
Accepted: 19 August 2021
/
Published: 22 August 2021
(This article belongs to the Special Issue Challenges and Side Effects of Heavy Metals in Agriculture)
Abstract
:The agricultural soil alongside highways has experienced multiple potential ecological risks from human activities. In this study, 100 soil samples near the highways were collected in Lishui District, Nanjing City. Using the single-factor pollution index, the Nemerow comprehensive pollution index, and the potential ecological risk index, the study investigated the heavy metal contents and distribution in roadside agricultural soil. PCA and a multiple regression model were applied to quantitatively analyze the spatial relationships between sampling soil heavy metal accumulation and the surrounding man-made landscape. The mean contents of Cu and Pb exceeded the background, while Cd, Cr, and Zn were lower than that. The potential ecological risk index exhibited a very low ecological hazard and only Cr in soils rarely showed moderate risk. Furthermore, quantitative analysis for the sources of contamination revealed that agricultural practices were the dominant contributors to the heavy metals, including Cd, Cu, and Zn, while road and heavy industrial practices contributed to Cr and Pb. The study provides sources of heavy metal pollution from human activities in roadside agricultural land and serves as a reference for ecological restoration.
1. Introduction
Rapid urban expansion, industrialization, and boost of GDP are the drivers of economic and social development. Road networks, especially the highway, play a significant role in the flow of production factors. With the frequency of human activities, roadside soil heavy metal contamination has attracted great concern during the last several decades. Many studies have demonstrated that roadside soils could reserve the traffic-derived pollutants and affect human health directly or indirectly [1,2,3]. Roadsides of the highway are generally agricultural land; the excessive accumulation of heavy metals in the soil could increase the potential health risk to human beings because of the input of unsafe agricultural products to the food chain [4,5,6]. It is important to analyze the content, distribution, and risk assessment of heavy metals in roadside agricultural soil. It has been proved that heavy metal accumulation in soil differs by soil texture, physical properties, and chemical properties [7]. Additionally, ecological processes such as biological metabolism and surface runoff and human activity, such as industrial emission, waste pollution, agricultural pollution, and traffic emission particles, can affect heavy metal accumulation in soil [8,9]. Heavy metals in the roadside agricultural soil are more likely to be linked to complex human activities. Numerous studies have been devoted to the heavy metals in roadside soil, including the contents, spatial distribution, and correlation among different metals, source analysis, and risk assessment [10,11,12]. Since the surrounding man-made landscapes such as the city, village, industry, and the highway could be a potential source of heavy metal contamination, the analysis of the spatial relationship between heavy metal contents and the surrounding landscape could help find the source of contamination [13,14].
In previous studies, multivariate statistical analyses such as cluster analysis (CA) and principal component analysis (PCA) were used to identify the sources of heavy metal pollution in soil [15,16]. However, the relationship between the soil heavy metal contents and the surrounding man-made landscape could not be identified accurately and quantified. Multiple regression (MR) was usually used to investigate the influence factors of the dependent variable, and it could be applied to the quantitative analysis of the spatial relationships between sampling soil heavy metal accumulation and the surrounding man-made landscape.
In the present study, 100 agricultural soil samples (15–30 cm) within 1 km alongside the highway of Lishui District, Nanjing City, were collected. The total contents of heavy metals in agricultural soil alongside the highway were determined to analyze their distribution, potential ecological risks, and relationship with the landscape, as the total origins could be derived from nature or human activities. To fully understand the status of potential ecological risks and the origins, the objectives of the present study are to (1) investigate the heavy metal contents and distribution in roadside agricultural soil; (2) quantitatively analyze the spatial relationships between sampling soil heavy metal accumulation and the surrounding man-made landscape. The hypotheses tested were as follows: (1) parts of the heavy metals in roadside agricultural soil originate from nature, whereas some others from anthropogenic activities; (2) man-made landscape plays a critical role in roadside agricultural soil accumulation. The results of the present study provided references for heavy metal pollution reduction and ecological restoration in roadside agricultural land.
2. Materials and Methods
2.1. Study Area
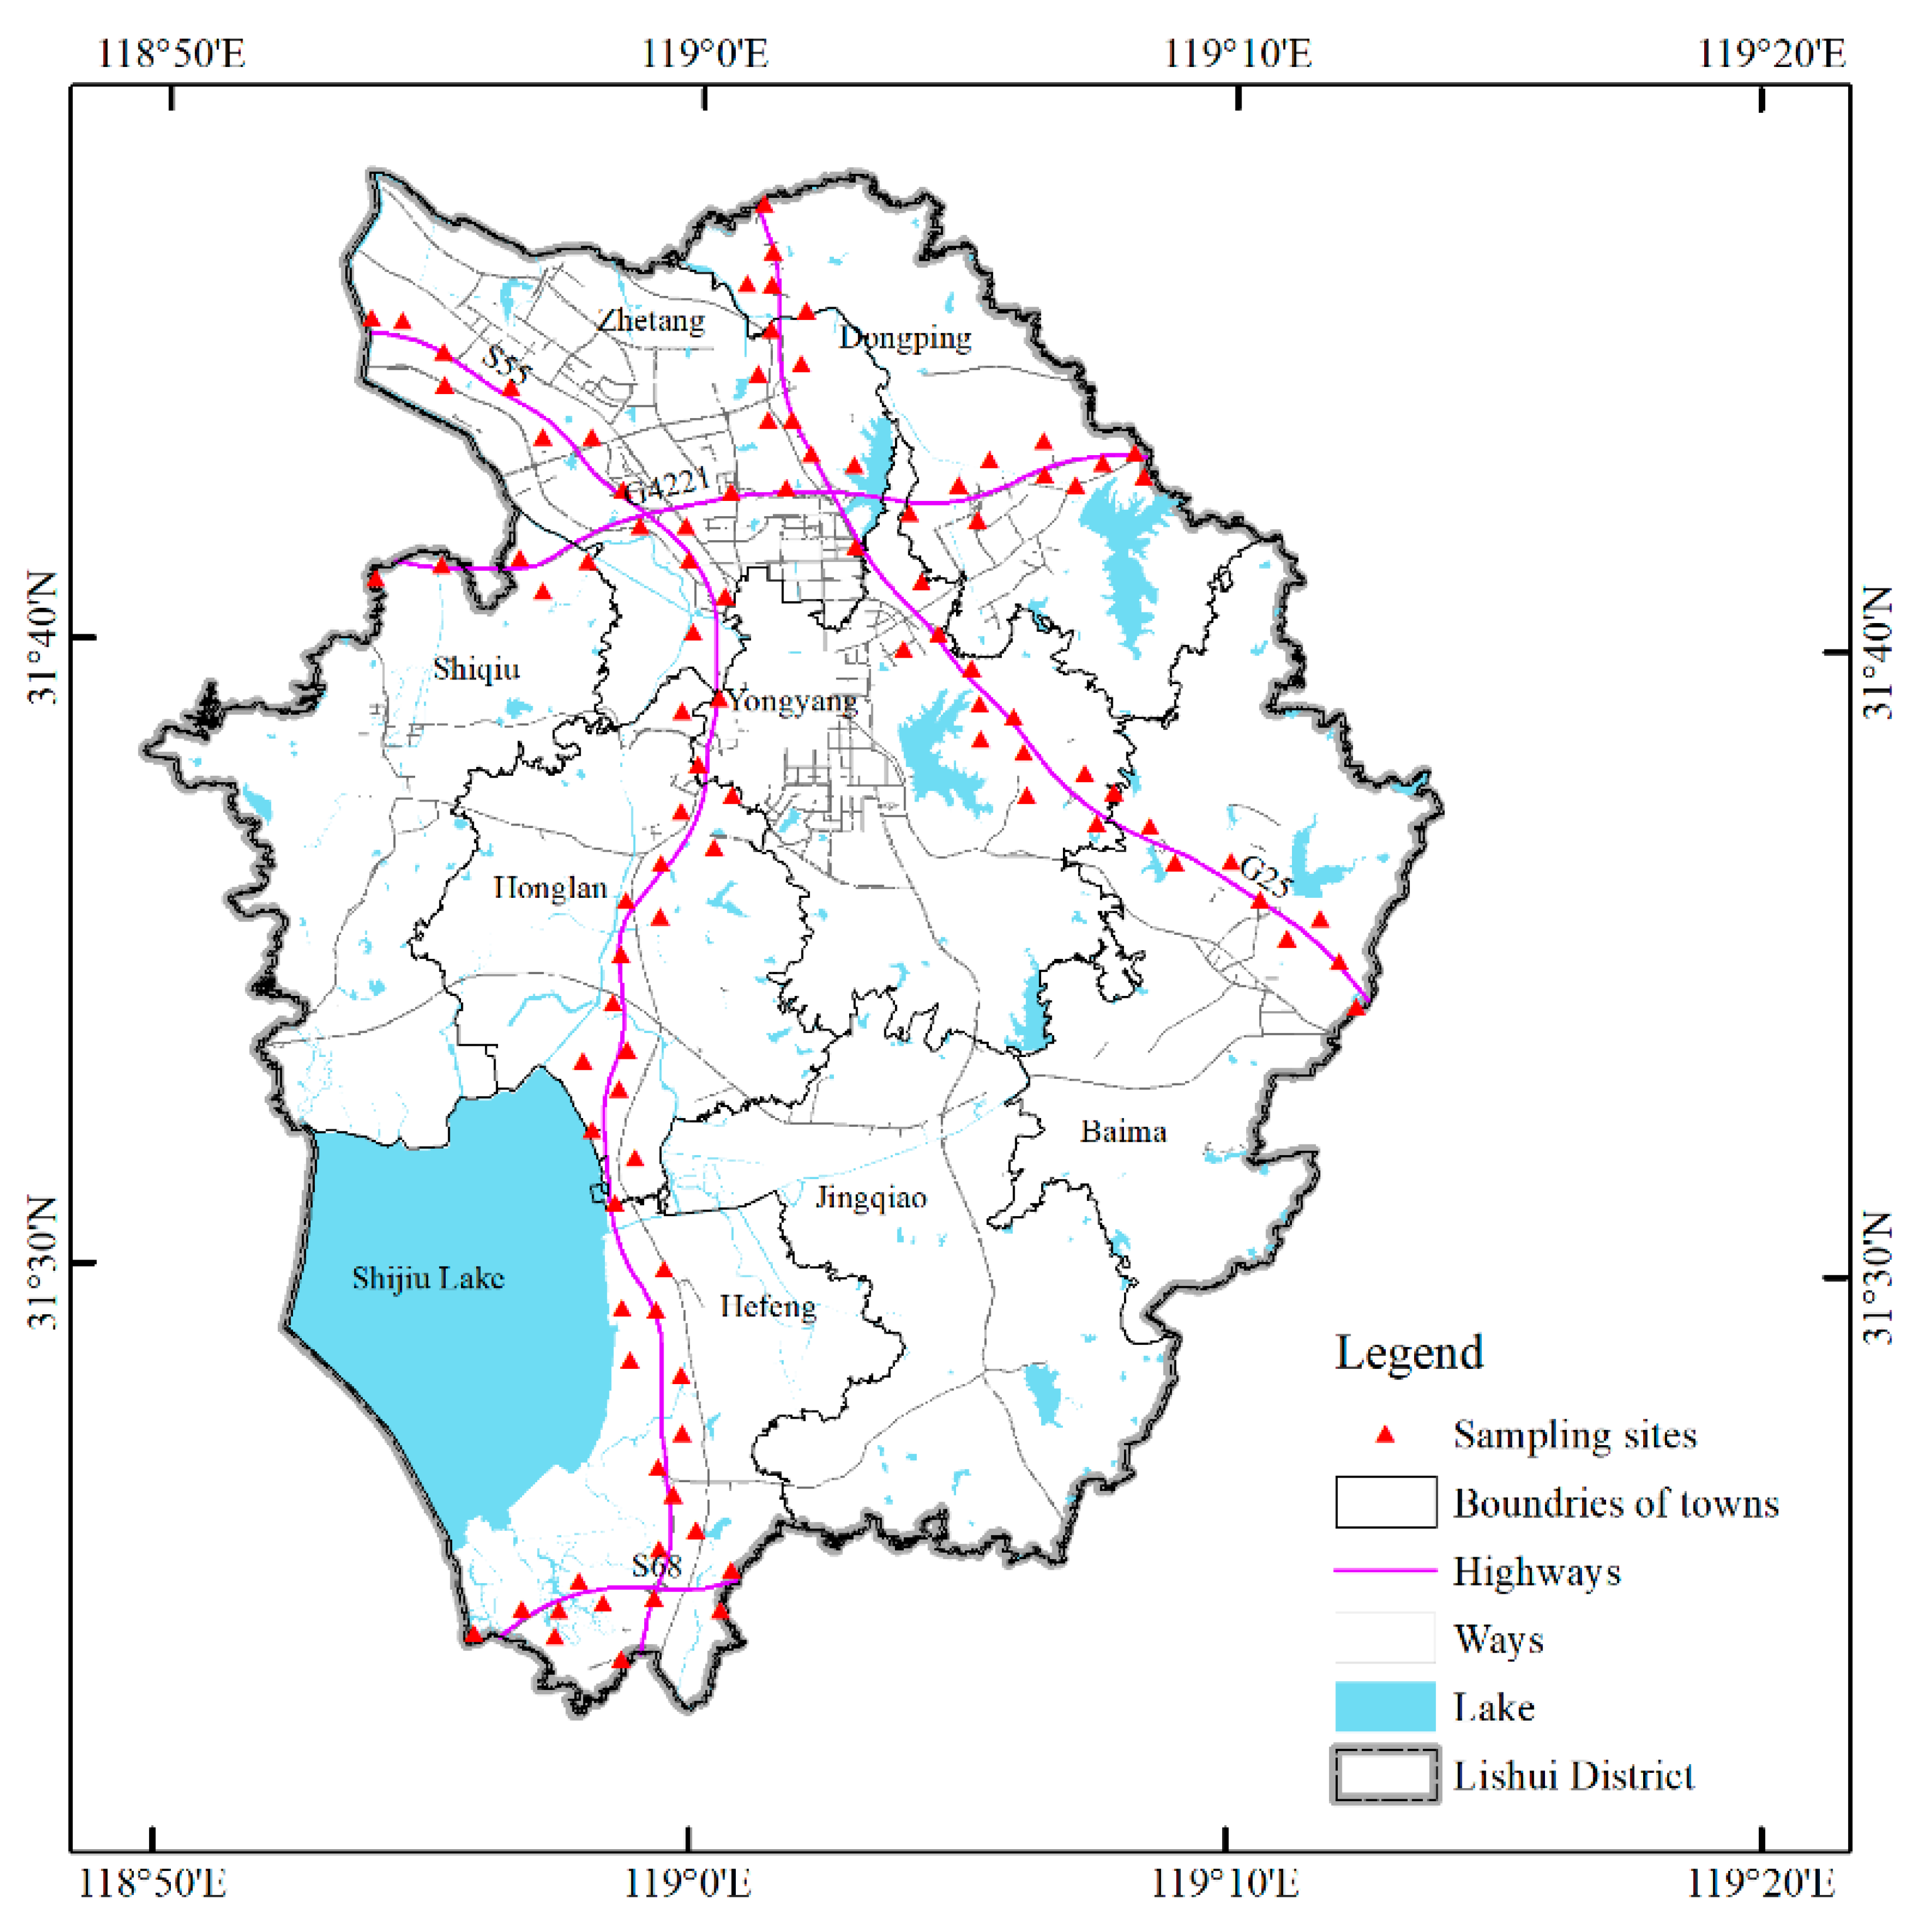
The present study was conducted in Lishui District, which is a region on the edge of Nanjing metropolitan, Jiangsu Province of China. The S38 (the highway that connects Changshu City and Hefei City), S55 (the highway that connects Nanjing City and Xuancheng City), and G25 (the highway that connects Changchun City and Shenzhen City) across the area are the important arteries in the metropolitan. There is a plain in northern Lishui, whereas the low mountains and hills are distributed in the central and southern parts. The cultivated land and garden plot are the main agricultural land types with paddy soil.
2.2. Sample Collection and Preparation
In the present study, 100 sampling points were randomly collected within 1 km alongside the highways in May 2018. The longitude and latitude of the sampling sites were recorded by a GPS (G138BD, UniStrong, Beijing, China). Using the five sub-samples methods, topsoil (15–30 cm) was collected by a cylindrical profile sampler from each sampling site. The five sub-samples of soil comprised a mixture. All the samples were stored in breathable, clean paper bags and taken to the laboratory for the next process. In the laboratory, all the soil samples were air-dried for about 10 days, sieved to pass through a 0.3 mm mesh, and stored in sealed bags for later determination. The study area and the distribution of the sampling sites are shown in Figure 1.
2.3. Sample Analysis
According to the Brzezicha-Cirocka et al. method [17], for each soil sample, 0.1 g soil was mixed with 1 mL HNO3, 3 mL HCl, 1 mL HF, and 0.5 mL HClO4 before digestion. The concentrations of total Cd, Cr, Cu, Pb, and Zn in the soil samples were determined by ICP-OES. In the processes of determination, standard reference materials (GB Testing & Certification Co., Ltd., Beijing, China) were used. For the analysis of the SOM of the 100 samples, the potassium dichromate oxidation method was used to measure the concentrations [18]. Using a pH meter (pH 197i, WTW, Weilheim, Germany), the pH of the soil samples was measured. All the samples were analyzed in three replicates.
2.4. Mapping Data
For the analysis of the distribution of heavy metal concentrations, Ordinary Kriging was applied in ArcGIS 10.3. The vectorial land use data of industrial, rural, highway, and cultivated land as well as garden plots were obtained from the land use change survey in 2018. The land use data for the chemical industry, mechanical industry, building industry, metal industry, and other industries (the main food and other light industries) were extracted from the industrial land investigation update data in the corresponding period. The distances to the highways, villages, and industrial land were calculated using the Path Distance tool in ArcGIS. The DEM data (ASTER GDEM, 30 m resolution) were obtained from the Geospatial Data Cloud, Chinese Academy of Sciences (http://www.gscloud.cn, accessed on 11 April 2021). Using the data of DEM, the slope and altitude were conducted. The land use type, distances, slope, and altitude of the sampling sites were extracted by the Extraction tool in ArcGIS.
2.5. Assessment of Heavy Metal Pollution
2.5.1. Single-Factor Pollution Index
The single-factor pollution index was usually used to evaluate the degree of single heavy metal pollution in soils [19]. The formula is as follows:
where Pi is the single contamination index of heavy metal element i in soil, Ci is the actual measured value of the examined metal i, and Si is the relevant background standard concentration of metal i. In research, the assessment standard is referred to as the soil environmental quality risk control standard for soil contamination of agricultural land. Pi > 1.0 indicates soil contamination, while Pi ≤ 1.0 suggests that the soil is not contaminated. Meanwhile, the greater the value of Pi, the more serious the accumulation of heavy metals. The risk screening values for soil contamination of national agricultural land and the soil environmental background values of Jiangsu Province are shown in Table 1.
2.5.2. Nemerow Comprehensive Pollution Index
The Nemerow comprehensive pollution index distinguishes the pollution degrees based on the single-factor index, reflecting the effects of various heavy metals on soil environmental quality [20]. The formula is as follows (Table 2):
where PN is the comprehensive pollution index, and Piave and Pimax refer to the average and maximum value of the single-factor index in soil, respectively. According to the Nemerow comprehensive pollution index, the soil pollution degree can be divided into five grades.
2.5.3. Potential Ecological Risk Index
The potential ecological risk index aimed to assess the concentrations of multiple heavy metals in soil with regard to the ecological effects, environmental effects, and biological toxicity. The formula is as follows:
where RI is the comprehensive potential ecological risk index, Ei is the single potential ecological risk index of heavy metal i in the samplings, Tir indicates the biological toxicity factor of heavy metal i, shown in Table 3, and Cif, Cip, and Cin are the pollution factor, the measured concentration, and the background value, respectively. The rank and risk classification of Ei and Ri are shown in Table 4.
2.5.4. Principal Component Analysis
Principal component analysis is a multivariate statistical method that is used to reduce the dimensionality of multiple variables and divides multiple indicators into several components to estimate sources [21]. The origin identification of metals or other sources in soils would be assessed and evaluated [22].
2.5.5. The Multiple Regression Model
As the values of the dependent variable (potential ecological risk index of heavy metal) are continuous, the impact of different distances on the potential ecological risk index of heavy metals can be estimated by a multiple regression model using Stata 15.1. The multiple regression model used in this study can be written as:
where i denotes different sampling sites. The independent variable dis includes the distances to different industries, the highway, and the village. The control variable Xi captures other factors that determine the potential ecological risk index of heavy metals, consisting of types of land, soil organic matter, pH, slope, and DEM. α, β, and γ are the parameters that need to be estimated, and μi is the error term. The definition and descriptive statistics of all variables are presented in Table 5.
2.5.6. Data Processing and Statistical Analysis
Inverse Distance Weighted was used for spatial interpolation of heavy metal concentration in soil. Data statistics and analysis were accomplished using Microsoft Excel 2019, SPSS Statistics 18.0, and Stata 15.1. The chart was polished up with Adobe Illustrator. Spatial analysis and mapping were finished in ArcGIS 10.3.
3. Results
3.1. The Contents and Distributions of the Heavy Metals in Agricultural Soil around the Highways
3.1.1. The Contents of the Agricultural Soil Heavy Metals around the Highways
The descriptive statistics of heavy metal concentrations and soil properties in the sampling sites of agricultural land alongside the highways are shown in Table 6. The concentrations of Cd, Cr, Cu, Pb, and Zn ranged from 0.04 to 0.26, 30.13 to 98.39, 16.26 to 69.53, 14.59 to 38.15, and 38.86 to 120.67 mg kg−1, with the mean concentrations of 0.11, 69.23, 27.33, 27.47, and 58.94 in the soil, respectively. In comparison with the background values of Jiangsu Province, the average values of Cu and Pb in the topsoil exceeded the background values, respectively. The CV of metals follows a descending order of Cd (40.16%) > Cu (24.97%) > Zn (21.32%) > Cr (15.34%) > Pb (14.86%), indicating a moderate degree of variation. The soil pH values ranged from 4.24 to 8.07, with an average of 5.97, which suggested that the studied soils were acidic and weakly acidic. The SOM values ranged from 0.04% to 4.57%, with a mean value of 1.67%, which turned out to be lower than the background values of Jiangsu Province.
3.1.2. Distributions of Heavy Metals Pollution around the Highways
Spatial distribution maps of Cd, Cr, Cu, Pb, Zn, SOM, and pH in soils neighboring the highways in Lishui District are presented in Figure 2. Zn, Cu, and Cd in soils had similar spatial distribution patterns, with higher levels mainly near the middle of the S55, and lower concentrations in other places. The distribution of Cr in Lishui District displayed a spatial pattern that was the opposite of the patter of Zn, Cu, and Cd. The generally high Cr accumulated in the southwestern area and at the intersection of S55 and S38, especially in cultivated lands. A similar spatial pattern applies to the Pb and SOM content in the study area, excluding the south of Lishui District. The pH value indicated a spatial distribution pattern with an alkaline pH in the northwest near the urban constructions in Lishui District and an acidic pH in the east.
As shown by the results, the order of average single-factor pollution values was Cu > Cr > Cd > Pb > Zn. The average Pi values of Cu, Cr, Cd, Pb, and Zn were between 0.29 and 0.55 and below 1, indicating that the soil was not contaminated by these heavy metals. Nevertheless, the highest value of Cu and Cd reached 1.39 and 0.85, respectively, showing light pollution. The Nemerow multi-factor index indicated a similar consequence.
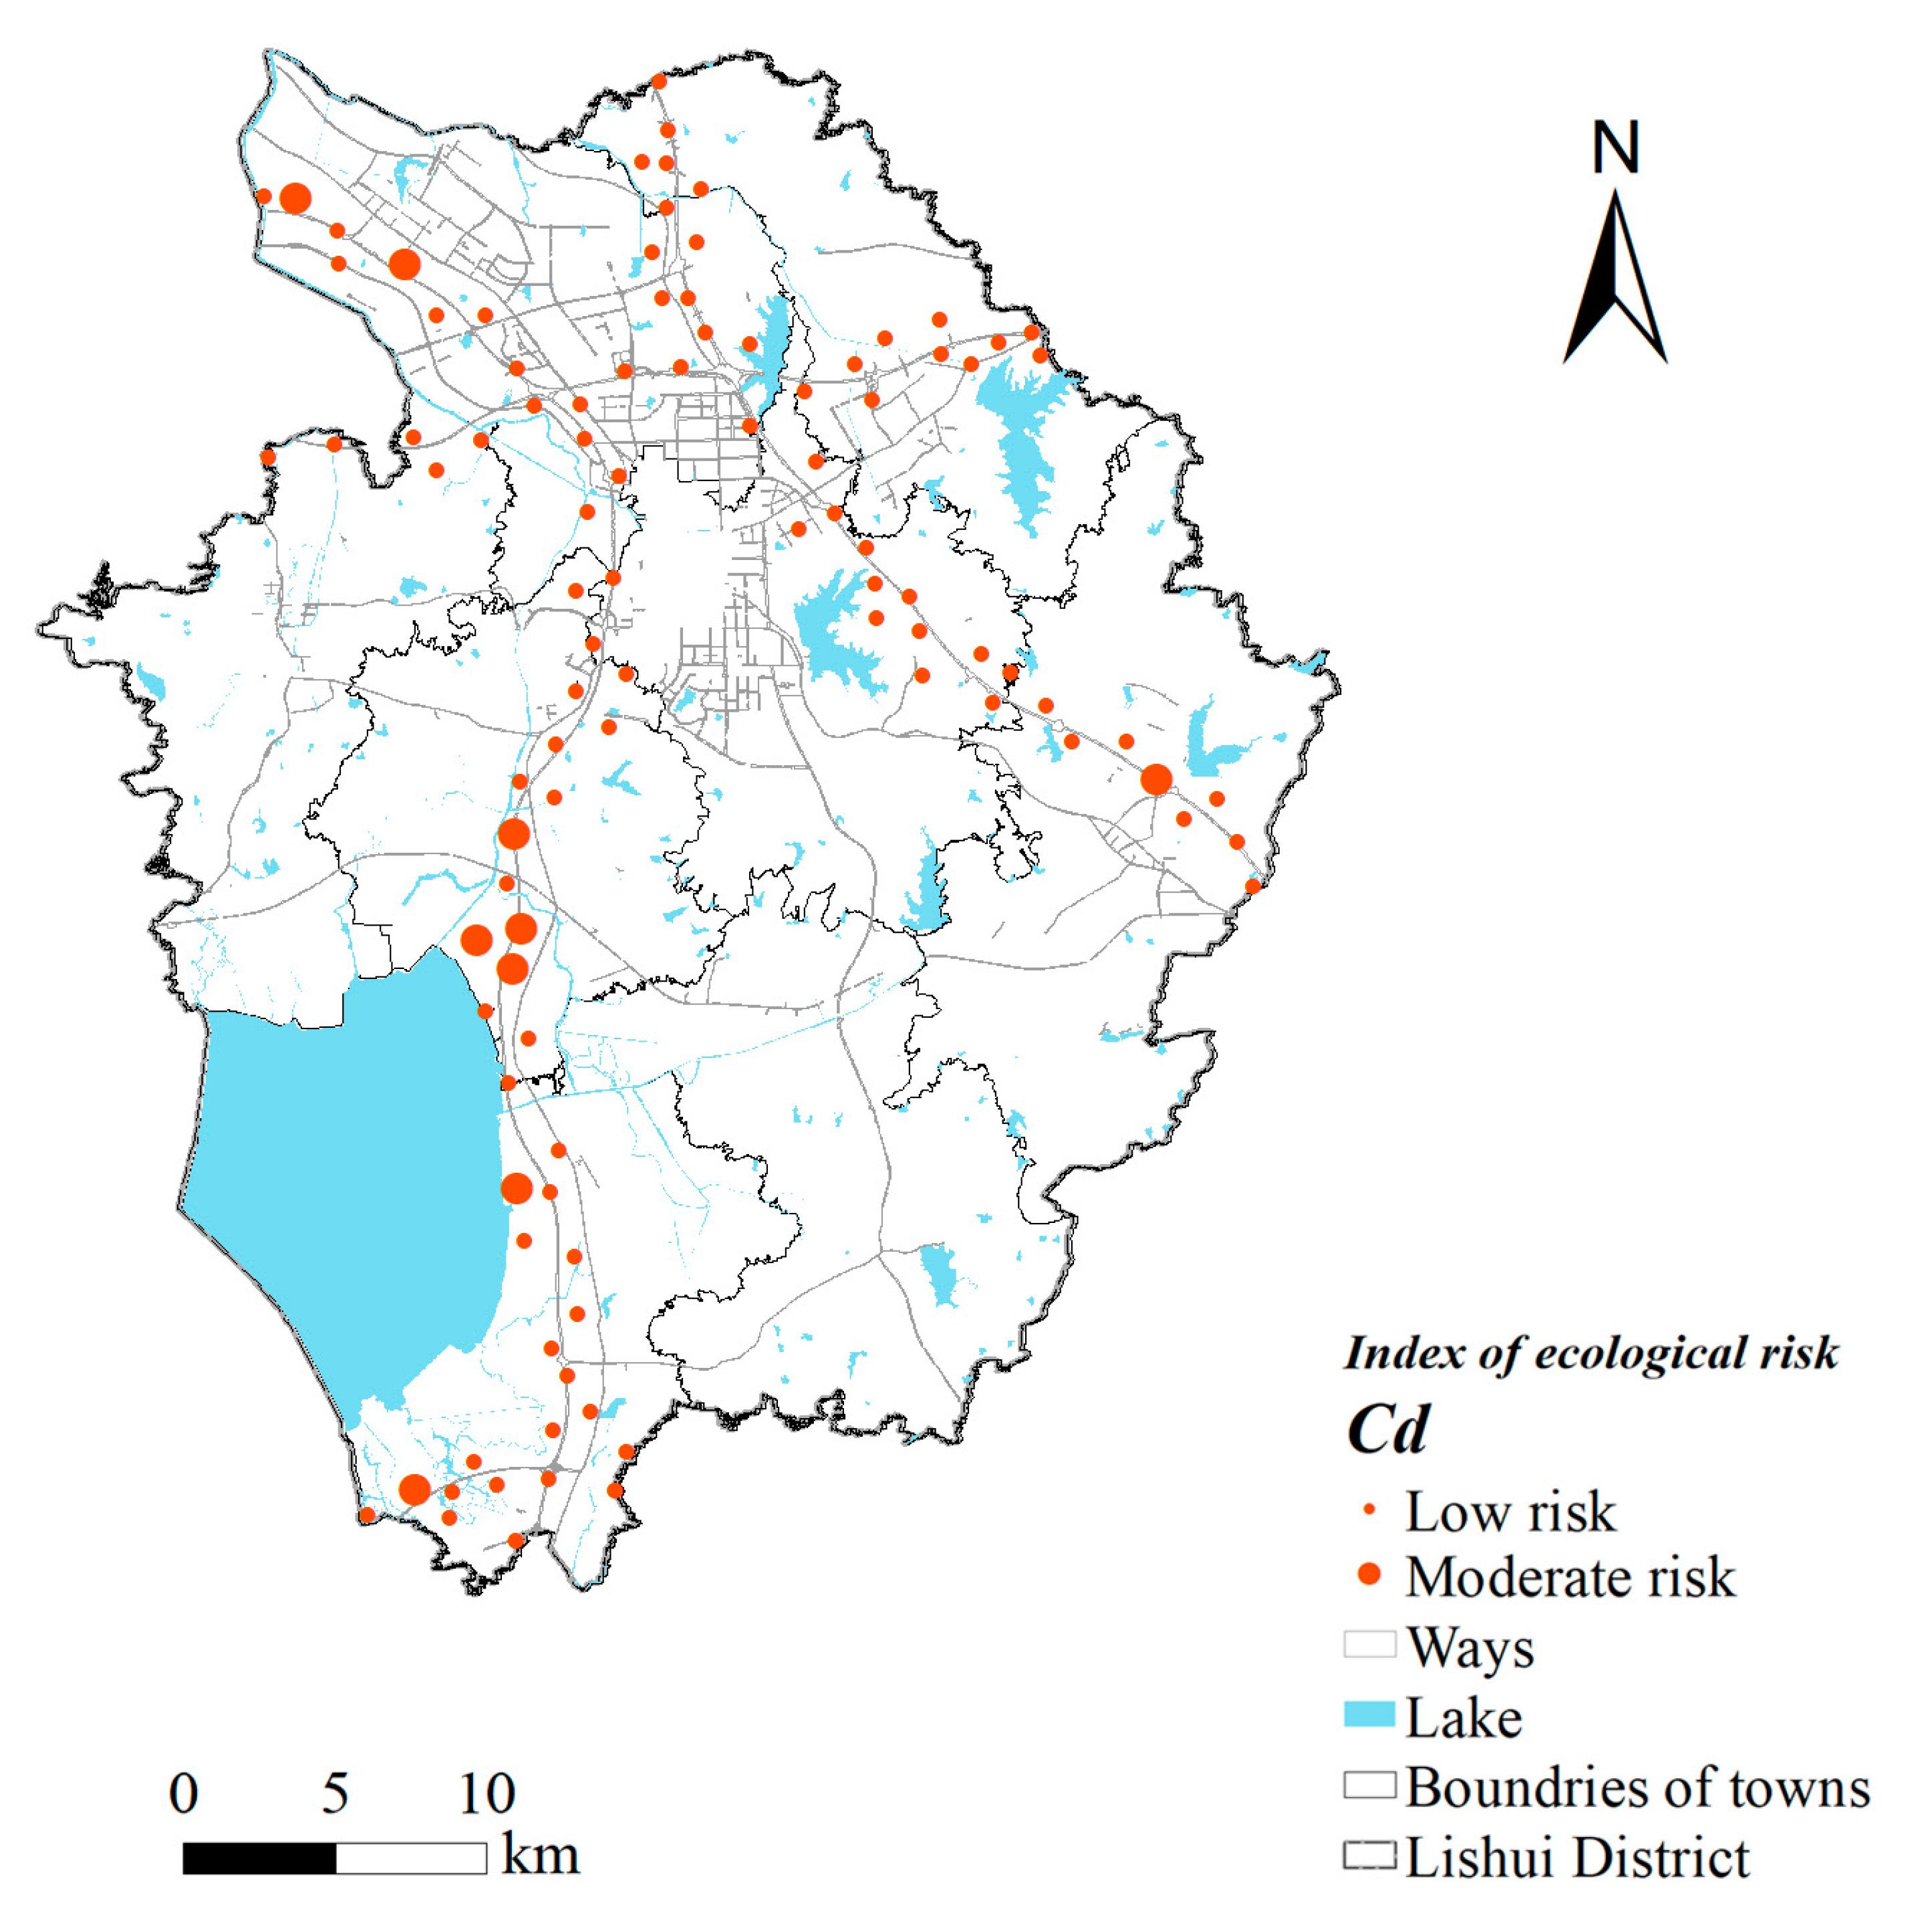
The results of the potential ecological risk index are shown in Table 7. The potential ecological risk values of the five heavy metals in the study were all less than 40, which exhibited a completely low ecological hazard. Spatial distribution maps of the index of ecological risk of Cd in soils neighboring the highways in Lishui District are presented in Figure 3, while other heavy metals in soils, such as Cu, Cr, Pb, and Zn, indicated a low ecological risk. The ecological risk of Cd in soils had a spatial distribution pattern, with a moderate risk mainly located near the middle of S55, in the northwest of Lishui District, and low ecological risk in other places.
3.2. Principal Component Analysis Results
The Kaiser–Meyer–Olkin (KMO) tests and Bartlett’s sphericity were conducted using SPSS, and the results showed that the KMO value was 0.579 (>0.5) and the associated probability of Bartlett’s sphericity test was 0.000 (<0.05), indicating that the principal component analysis can be performed.
The results of the principal component analysis are shown in Table 8. The concentrations of heavy metals with other attributes in soils alongside the highways were determined by three principal components that explained 67.027% of the total variances. The first principal component was dominated by Zn, Cd, and Cu, with a variance contribution of 44.304%. Cr and Pb were the components with high loadings in the second principal component, with a variance contribution of 22.722%.
3.3. Impact of Different Distances from Variable Landscapes on the Potential Ecological Risk
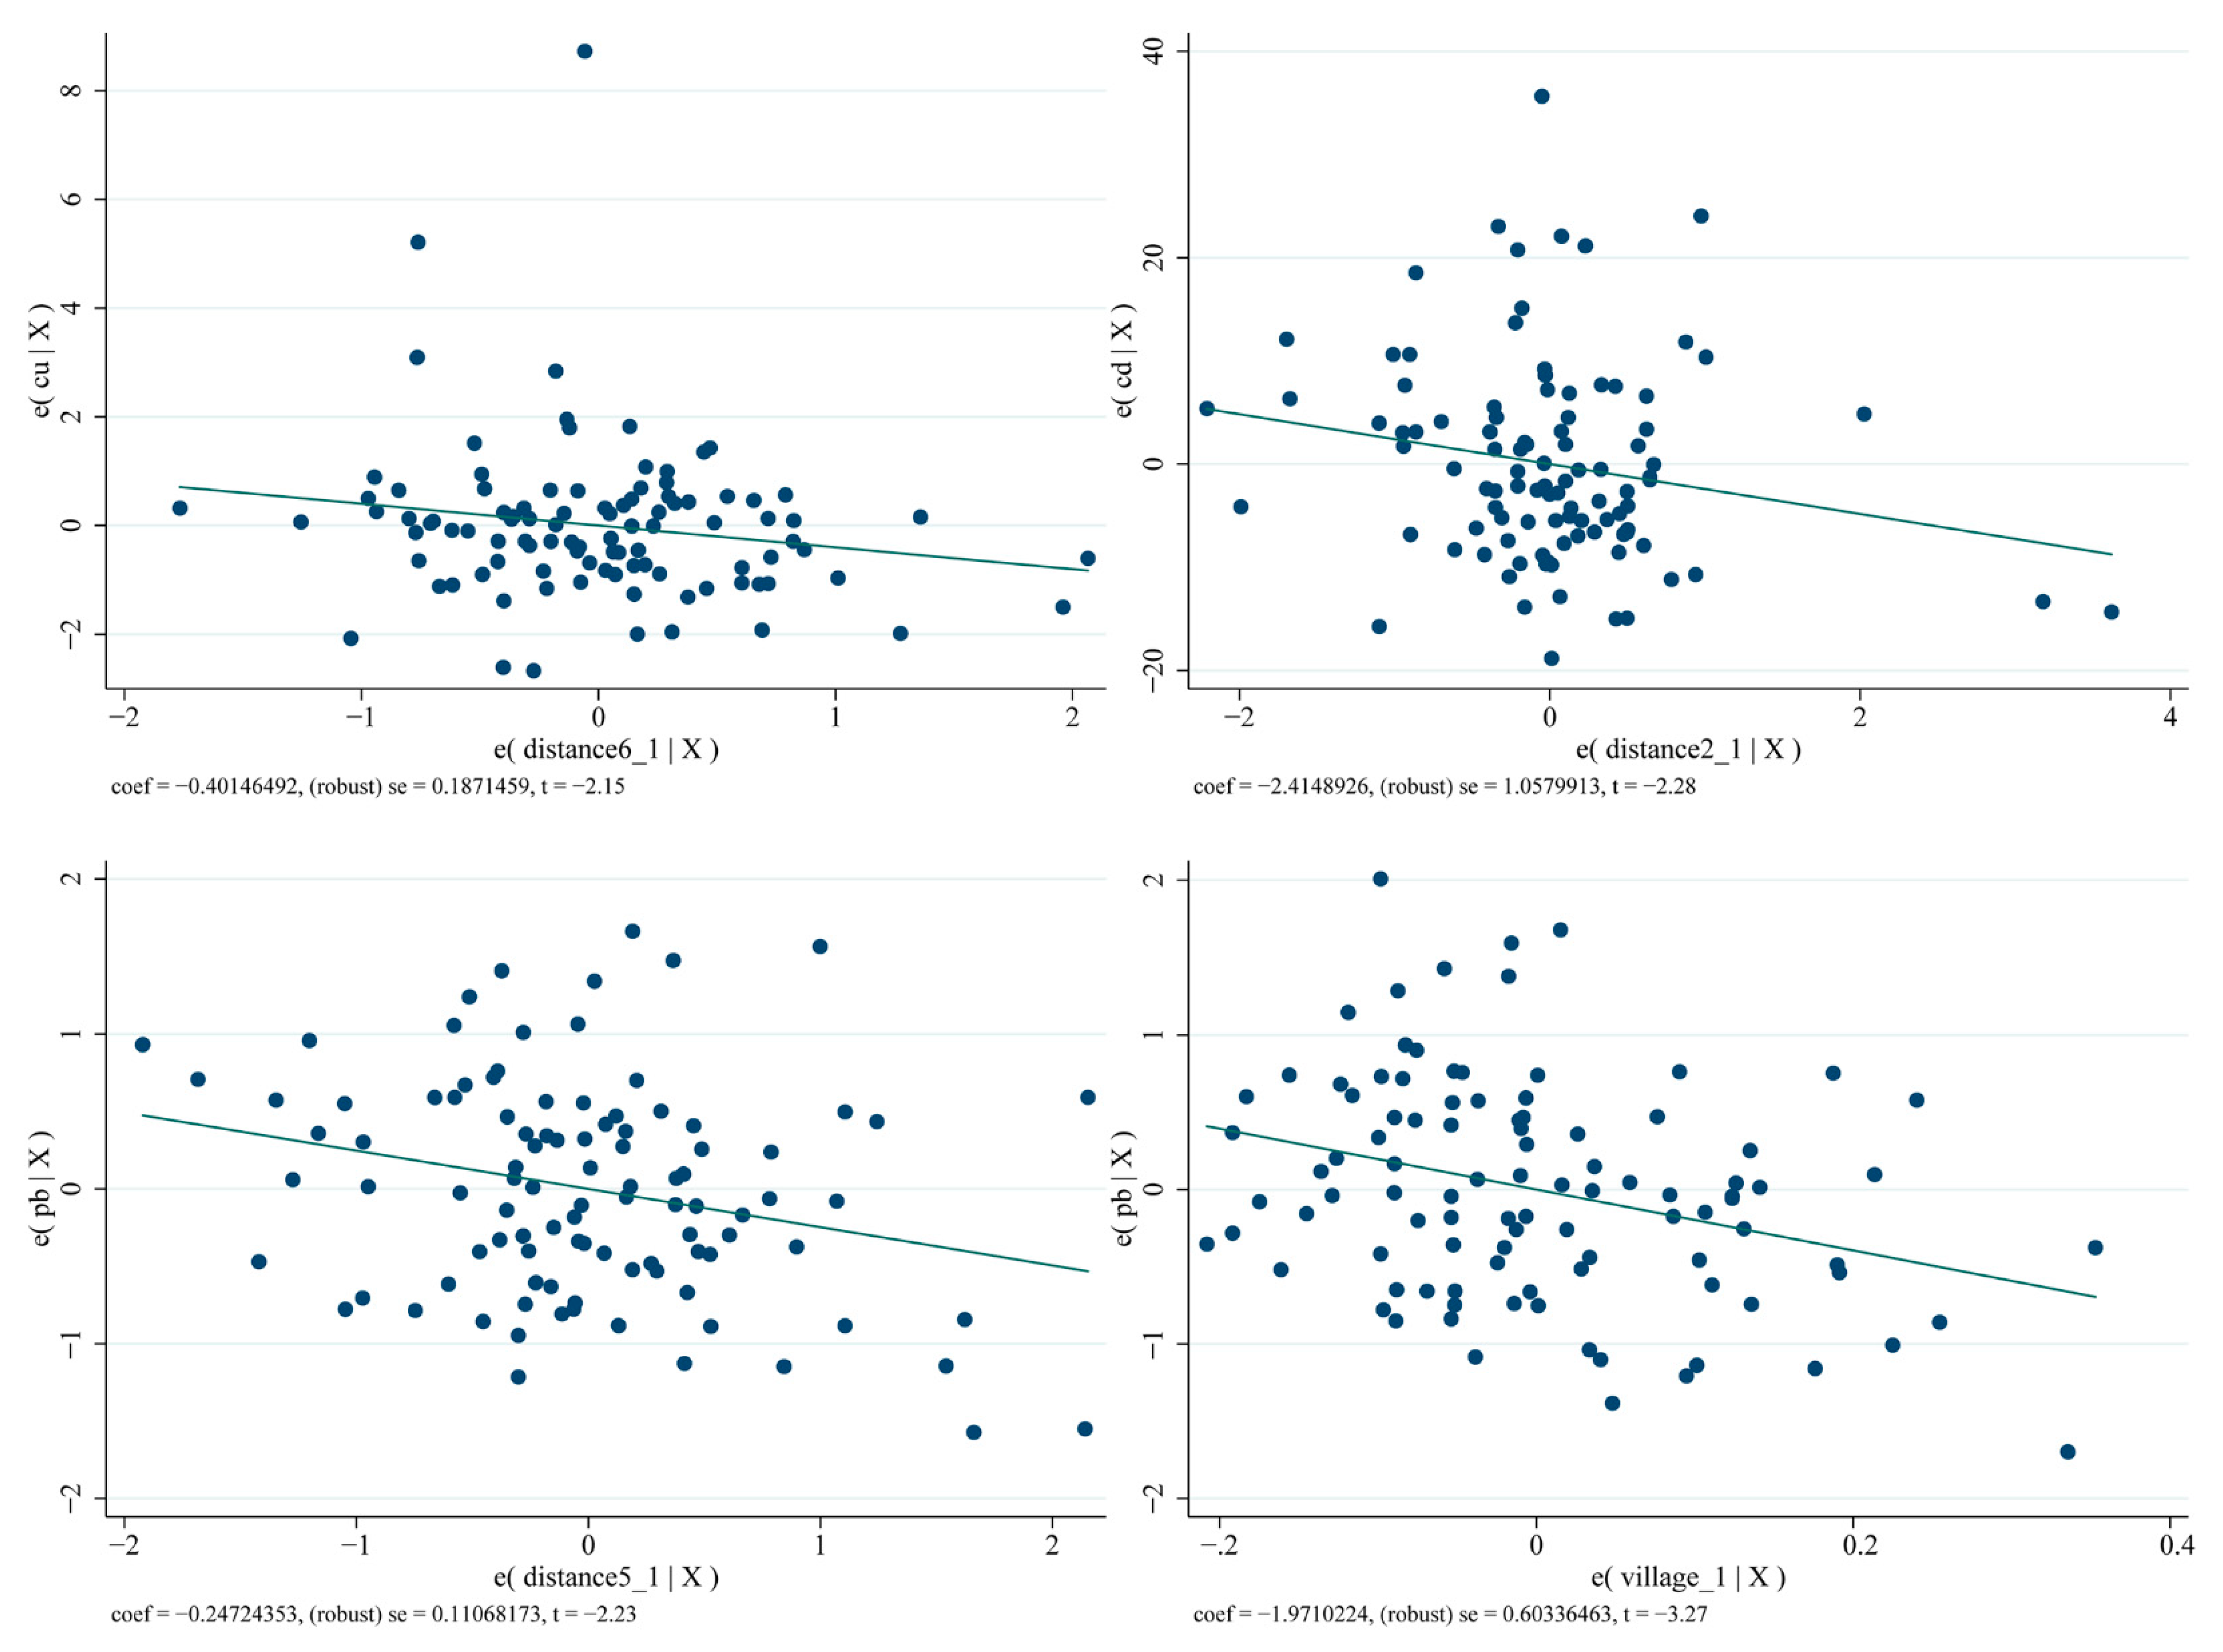
The results of the impact of distances on the potential ecological risk index of heavy metal are presented in Table 9 and Figure 4. The distance to the other industries had a negative influence on the potential ecological risk index of Cu, while the distance to the chemical industry had a negative effect on the potential ecological risk index of Cd. This indicated that the more the distance to industry, the lower the potential ecological risk was. The distance to the metal industry and the distance to the village negatively affected the potential ecological risk index of Pb, implying that potential ecological risk decreases with an increase in distance. In addition, the potential ecological risk index of Cd and Zn on drylands was higher than that on other lands.
4. Discussion
4.1. Heavy Metal Concentration and Ecological Risk Assessment in Agricultural Land Alongside the Highways
Applying the standard of elemental background values of soils in China, most of the heavy metal concentrations we evaluated in agricultural soil alongside the highways were lower than the standard. Nevertheless, the concentrations of Cu and Pb are higher than the background values in Lishui District, implying that there might be some ecological risks of Cu and Pb in the agricultural soil. Compared with the heavy metal concentration in agricultural soils in Jiangsu Province, similar consequences were verified. In the previous study, the Cu levels in agricultural soil sampling sites of Jiangsu Province ranged from 14.12 with 52.10 mg/kg [23], which was lower than what we evaluated in Lishui District, indicating that the pollution of Cu in agricultural soils alongside the highways in Lishui District might be more serious than that in other areas. The results stand in line with the previous studies [24,25,26].
Additionally, it is worth mentioning that SOM and pH were lower than in previous studies. From the results of ecological risk assessment, all heavy metals studied posed a low ecological risk, suggesting that the soils in this study are slightly polluted, similar to the research on the farmland soil near the trafficway in Suzhou City, Jiangsu Province [27].
4.2. Potential Sources of the Heavy Metals Ecological Risks
Many studies have used the PCA method to identify the pollution sources of anthropogenic activities and pedogenic characteristics. In the present study, as the results showed two efficient components, the analysis of the sources could be conducted according to the results. The main elements in factor 1 were Cd, Cu, and Zn, where previous research has shown that Cu, Cd, and Zn may be strongly related to anthropogenic elements, such as livestock manure, fertilizers, and pesticides [28,29,30]. As Lishui is the main area of agricultural products supply for the Nanjing metropolitan, grain, vegetables, fruits, and other industrial crops are widely planted in Lishui, and the facilities for agriculture are widely distributed as well. Fertilizers and pesticides might continuously increase heavy metal ecological risks [31]. It has been demonstrated that higher Cd and Zn ecological risk on drylands could arise from continuous agriculture [32]. Additionally, the Cu concentration determined in the study area exceeded the local background values and the results of the impact of distances on the potential ecological risk index of heavy metals showed that it was related to other lands, such as woodlands, orchards, tea plantations, and grasslands. In general, factor 1 primarily indicated agricultural practices.
The main elements in factor 2 were Cr and Pb, where previous studies demonstrated that they are inextricably linked with vehicle exhaust, coal combustion, and industrial waste [33,34,35]. Relatively high concentrations of Pb occur in industrial solid wastes and road dust because the Pb contained in wear lubricating oil and tires is always released to road dust [36,37]. In addition, Pb is produced from traffic emissions due to the combustion of fuels and the use of engines and catalysts before 2000, and consequently, it certainly accumulates [38]. In our study, the average concentration of Pb in the soil samplings alongside the highways was higher than its background values, suggesting that Pb is possibly influenced by traffic emissions. Additionally, the distance to the metal industry and the distance to the village negatively affected the potential ecological risk index of Pb, implying that Pb may be impacted by metal processing factories and other human activities. Previous studies also verified that industrial activities are sources of Cr, such as steel smelting factories, coking plants, and cement production because metal smelting works and cement-derived fugitive dust comprise a great deal of Cr. Overall, factor 2 mostly implies road and heavy industrial practices.
4.3. Strategies for Ecological Restoration in the Future
Despite low ecological risk in soils alongside the highways in Lishui District, the reduction of heavy metal pollution should be taken into account. It is of great significance to bear land use planning, pollution control, and soil restoration in mind. First of all, agricultural soil pollution originating from man-made landscapes such as industries, highways, villages, and towns could be controlled by optimizing the layout of land use. Similar results could be found in previous studies [39]. According to the results of the present study and previous studies, paddy fields is more beneficial to reduce heavy metal ecological risks compared with drylands [40,41]. Secondly, the government should take positive measures to control the contamination of heavy metals, in accordance with the alleviation of heavy industries and the fertilizers and pesticides used in agriculture [42,43]. Soil remediation measures can be taken according to the types of heavy metals and the levels of risks. According to the adsorption characteristics of heavy metals, specific plants can be planted in areas with high heavy metal ecological risks. Other biochemical measures should be taken to restore soils that have been contaminated.
5. Conclusions
In the present study, 100 soil samples alongside highways were collected in May 2018 in Lishui District, China. To assess the level of heavy metal pollution, the concentrations of Cr, Cd, Cu, Pb, and Zn were determined, and the single-factor pollution index, the Nemerow comprehensive pollution index, and the potential ecological risk index were used. In addition, PCA and a multiple regression model were applied to analyze potential resources based on the concentrations and the ecological risk assessment. The main findings from the study are as follows. The mean concentrations of Cu and Pb exceeded local background values, while those of Cd, Cr, and Zn were lower. The results of the potential ecological risk index show that there was no ecological hazard in soils, except that a few sites exhibited a moderate risk of Cr. The man-made landscape had significant effects on the spatial variation of heavy metals. The PCA results and the multiple regression model revealed that agricultural and industrial practices are the dominant contributors to heavy metals, including Cd, Cu, and Zn, while road and heavy industrial practices contribute to Cr and Pb. Therefore, to control the heavy metal pollution of cultivated soil, it is of great significance for the government to carry out ecological restoration, such as land use planning, pollution control, and soil restoration.
Author Contributions
Writing—original draft preparation, C.X. and J.P.; methodology, C.X.; visualization, J.P.; conceptualization, B.W.; data curation, M.X.; writing—review and editing, B.W. and M.X.; funding acquisition, B.W. and M.X. All authors have read and agreed to the published version of the manuscript.
Funding
This research was supported by the MOE (Ministry of Education in China) Project of Humanities and Social Sciences (18YJAZH071, 20YJCZH178) and the Natural Resources Science and Technology Project of Jiangsu Province (KJXM2019021).
Institutional Review Board Statement
Not applicable.
Informed Consent Statement
Not applicable.
Data Availability Statement
Not applicable.
Conflicts of Interest
The authors declare no conflict of interest.
References
- Wei, B.; Jiang, F.; Li, X.; Mu, S. Spatial distribution and contamination assessment of heavy metals in urban road dusts from Urumqi, NW China. Microchem. J. 2009, 93, 147–152. [Google Scholar] [CrossRef]
- Donado, E.P.; Oliveira, M.L.S.; Gonçalves, J.O.; Dotto, G.L.; Silva, L.F.O. Soil contamination in Colombian playgrounds: Effects of vehicles, construction, and traffic. Environ. Sci. Pollut. Res. 2021, 28, 166–176. [Google Scholar] [CrossRef]
- Liao, S.; Jin, G.; Khan, M.A.; Zhu, Y.; Duan, L.; Luo, W.; Jia, J.; Zhong, B.; Ma, J.; Ye, Z.; et al. The quantitative source apportionment of heavy metals in peri-urban agricultural soils with UNMIX and input fluxes analysis. Environ. Technol. Innov. 2021, 21, 101232. [Google Scholar] [CrossRef]
- Li, Q.; Chen, Y.; Fu, H.; Cui, Z.H.; Shi, L.; Wang, L.; Liu, Z. Health risk of heavy metals in food crops grown on reclaimed tidal flat soil in the Pearl River Estuary, China. J. Hazard. Mater. 2012, 227–228, 148–154. [Google Scholar] [CrossRef] [PubMed]
- Zheng, S.; Wang, Q.; Yuan, Y.; Sun, W. Human health risk assessment of heavy metals in soil and food crops in the Pearl River Delta urban agglomeration of China. Food Chem. 2020, 316, 126213. [Google Scholar] [CrossRef]
- Zhao, R.; Wu, K. Soil health evaluation of farmland based on functional soil management—A case study of Yixing City, Jiangsu Province, China. Agriculture 2021, 11, 583. [Google Scholar] [CrossRef]
- Yang, X.; Yang, Y.; Wan, Y.; Wu, R.; Feng, D.; Li, K. Source identification and comprehensive apportionment of the accumulation of soil heavy metals by integrating pollution landscapes, pathways, and receptors. Sci. Total Environ. 2021, 786, 147436. [Google Scholar] [CrossRef]
- Chai, L.; Wang, Y.; Wang, X.; Ma, L.; Cheng, Z.; Su, L.; Liu, M. Quantitative source apportionment of heavy metals in cultivated soil and associated model uncertainty. Ecotoxicol. Environ. Saf. 2021, 215, 112150. [Google Scholar] [CrossRef] [PubMed]
- Yuanan, H.; He, K.; Sun, Z.; Chen, G.; Cheng, H. Quantitative source apportionment of heavy metal(loid)s in the agricultural soils of an industrializing region and associated model uncertainty. J. Hazard. Mater. 2020, 391, 122244. [Google Scholar] [CrossRef]
- Huang, S.; Xiao, L.; Zhang, Y.; Wang, L.; Tang, L. Interactive effects of natural and anthropogenic factors on heterogenetic accumulations of heavy metals in surface soils through geodetector analysis. Sci. Total Environ. 2021, 789, 147937. [Google Scholar] [CrossRef]
- Yang, Y.; Yang, X.; He, M.; Christakos, G. Beyond mere pollution source identification: Determination of land covers emitting soil heavy metals by combining PCA/APCS, GeoDetector and GIS analysis. Catena 2020, 185, 104297. [Google Scholar] [CrossRef]
- Aitta, A.; El-Ramady, H.; Alshaal, T.; El-Henawy, A.; Shams, M.; Talha, N.; Elbehiry, F.; Brevik, E.C. Seasonal and spatial distribution of soil trace elements around kitchener drain in the Northern Nile Delta, Egypt. Agriculture 2019, 9, 152. [Google Scholar] [CrossRef] [Green Version]
- Lin, Y.P.; Teng, T.P.; Chang, T.K. Multivariate analysis of soil heavy metal pollution and landscape pattern in Changhua county in Taiwan. Landsc. Urban Plan. 2002, 62, 19–35. [Google Scholar] [CrossRef]
- Shu, X.; Li, Y.; Li, F.; Feng, J.Y.; Shen, J.Y.; Shi, Z. Impacts of Land Use and Landscape Patterns on Heavy Metal Accumulation in Soil. Huanjing Kexue Environ. Sci. 2019, 40, 2471–2482. [Google Scholar] [CrossRef]
- Wu, H.; Xu, C.; Wang, J.; Xiang, Y.; Ren, M.; Qie, H.; Zhang, Y.; Yao, R.; Li, L.; Lin, A. Health risk assessment based on source identification of heavy metals: A case study of Beiyun River, China. Ecotoxicol. Environ. Saf. 2021, 213, 112046. [Google Scholar] [CrossRef]
- Zhao, L.; Yan, Y.; Yu, R.; Hu, G.; Cheng, Y.; Huang, H. Source apportionment and health risks of the bioavailable and residual fractions of heavy metals in the park soils in a coastal city of China using a receptor model combined with Pb isotopes. Catena 2020, 194, 104736. [Google Scholar] [CrossRef]
- Brzezicha-Cirocka, J.; Grembecka, M.; Szefer, P. Monitoring of essential and heavy metals in green tea from different geographical origins. Environ. Monit. Assess. 2016, 188, 183. [Google Scholar] [CrossRef] [Green Version]
- Liu, B.; Liu, Q.; Wang, X.; Bei, Q.; Zhang, Y.; Lin, Z.; Liu, G.; Zhu, J.; Hu, T.; Jin, H.; et al. A fast chemical oxidation method for predicting the long-term mineralization of biochar in soils. Sci. Total Environ. 2020, 718, 137390. [Google Scholar] [CrossRef] [PubMed]
- Müller, G. Index of geoaccumulation in sediments of the Rhine River. Geol. J. 1969, 2, 108–118. [Google Scholar]
- Hakanson, L. An ecological risk index for aquatic pollution control.a sedimentological approach. Water Res. 1980, 14, 975–1001. [Google Scholar] [CrossRef]
- Josse, J.; Husson, F. Selecting the number of components in principal component analysis using cross-validation approximations. Comput. Stat. Data Anal. 2012, 56, 1869–1879. [Google Scholar] [CrossRef]
- Micó, C.; Recatalá, L.; Peris, M.; Sánchez, J. Assessing heavy metal sources in agricultural soils of an European Mediterranean area by multivariate analysis. Chemosphere 2006, 65, 863–872. [Google Scholar] [CrossRef] [PubMed]
- Yang, S.; Qu, Y.; Ma, J.; Liu, L.; Wu, H.; Liu, Q.; Gong, Y.; Chen, Y.; Wu, Y. Comparison of the concentrations, sources, and distributions of heavy metal(loid)s in agricultural soils of two provinces in the Yangtze River Delta, China. Environ. Pollut. 2020, 264, 114688. [Google Scholar] [CrossRef]
- Galal, T.M.; Shehata, H.S. Bioaccumulation and translocation of heavy metals by Plantago major L. grown in contaminated soils under the effect of traffic pollution. Ecol. Indic. 2015, 48, 244–251. [Google Scholar] [CrossRef]
- Różański, S.; Jaworska, H.; Matuszczak, K.; Nowak, J.; Hardy, A. Impact of highway traffic and the acoustic screen on the content and spatial distribution of heavy metals in soils. Environ. Sci. Pollut. Res. 2017, 24, 12778–12786. [Google Scholar] [CrossRef] [Green Version]
- Hui, Z.; Caiqiu, W.; Jiping, G.; Xuyin, Y.; Qiao, W.; Wenming, P.; Tao, L.; Jie, Q.; Hanpei, Z. Assessment of heavy metal contamination in roadside soils along the Shenyang-Dalian highway in liaoning province, China. Pol. J. Environ. Stud. 2017, 26, 1539–1549. [Google Scholar] [CrossRef]
- Sun, L. Statistical approaches for identification and quantification of soil trace elemental pollution near the traffic way. Environ. Prot. Eng. 2019, 45, 21–32. [Google Scholar] [CrossRef]
- Hu, W.; Wang, H.; Dong, L.; Huang, B.; Borggaard, O.K.; Bruun Hansen, H.C.; He, Y.; Holm, P.E. Source identification of heavy metals in peri-urban agricultural soils of southeast China: An integrated approach. Environ. Pollut. 2018, 237, 650–661. [Google Scholar] [CrossRef]
- Lu, A.; Wang, J.; Qin, X.; Wang, K.; Han, P.; Zhang, S. Multivariate and geostatistical analyses of the spatial distribution and origin of heavy metals in the agricultural soils in Shunyi, Beijing, China. Sci. Total Environ. 2012, 425, 66–74. [Google Scholar] [CrossRef]
- Liang, J.; Feng, C.; Zeng, G.; Gao, X.; Zhong, M.; Li, X.; Li, X.; He, X.; Fang, Y. Spatial distribution and source identification of heavy metals in surface soils in a typical coal mine city, Lianyuan, China. Environ. Pollut. 2017, 225, 681–690. [Google Scholar] [CrossRef]
- Sun, R.; Yang, J.; Xia, P.; Wu, S.; Lin, T.; Yi, Y. Contamination features and ecological risks of heavy metals in the farmland along shoreline of Caohai plateau wetland, China. Chemosphere 2020, 254, 126828. [Google Scholar] [CrossRef] [PubMed]
- Sukarjo; Zulaehah, I.; Handayani, C.O.; Zu’Amah, H. Heavy metal pollution assessment in paddy fields and dryland in Bandung District, West Java. In Proceedings of the IOP Conference Series: Earth and Environmental Science, Orlando, FL, USA, 10–14 October 2021; p. 012114. [Google Scholar] [CrossRef]
- Men, C.; Liu, R.; Xu, F.; Wang, Q.; Guo, L.; Shen, Z. Pollution characteristics, risk assessment, and source apportionment of heavy metals in road dust in Beijing, China. Sci. Total Environ. 2018, 612, 138–147. [Google Scholar] [CrossRef] [PubMed]
- Luo, X.S.; Xue, Y.; Wang, Y.L.; Cang, L.; Xu, B.; Ding, J. Source identification and apportionment of heavy metals in urban soil profiles. Chemosphere 2015, 127, 152–157. [Google Scholar] [CrossRef]
- Tang, Z.; Chai, M.; Cheng, J.; Jin, J.; Yang, Y.; Nie, Z.; Huang, Q.; Li, Y. Contamination and health risks of heavy metals in street dust from a coal-mining city in eastern China. Ecotoxicol. Environ. Saf. 2017, 138, 83–91. [Google Scholar] [CrossRef] [PubMed]
- Duan, J.; Tan, J. Atmospheric heavy metals and Arsenic in China: Situation, sources and control policies. Atmos. Environ. 2013, 74, 93–101. [Google Scholar] [CrossRef]
- Hjortenkrans, D.; Bergbäck, B.; Häggerud, A. New metal emission patterns in road traffic environments. Environ. Monit. Assess. 2006, 117, 85–98. [Google Scholar] [CrossRef]
- Bi, X.; Zhang, M.; Wu, Y.; Fu, Z.; Sun, G.; Shang, L.; Li, Z.; Wang, P. Distribution patterns and sources of heavy metals in soils from an industry undeveloped city in Southern China. Ecotoxicol. Environ. Saf. 2020, 205, 111115. [Google Scholar] [CrossRef]
- Fan, C.; Gai, Z.; Shen, S.; Sun, S. An implementation evaluation framework of ecological spatial planning based on multi-dimensional data: A case study in China. Urban For. Urban Green. 2021, 63, 127222. [Google Scholar] [CrossRef]
- Mao, C.; Song, Y.; Chen, L.; Ji, J.; Li, J.; Yuan, X.; Yang, Z.; Ayoko, G.A.; Frost, R.L.; Theiss, F. Human health risks of heavy metals in paddy rice based on transfer characteristics of heavy metals from soil to rice. Catena 2019, 175, 339–348. [Google Scholar] [CrossRef]
- Huang, H.; Lin, C.; Yu, R.; Yan, Y.; Hu, G.; Li, H. Contamination assessment, source apportionment and health risk assessment of heavy metals in paddy soils of Jiulong River Basin, Southeast China. R. Soc. Chem. Adv. 2019, 9, 14736–14744. [Google Scholar] [CrossRef] [Green Version]
- Guan, Q.; Wang, F.; Xu, C.; Pan, N.; Lin, J.; Zhao, R.; Yang, Y.; Luo, H. Source apportionment of heavy metals in agricultural soil based on PMF: A case study in Hexi Corridor, northwest China. Chemosphere 2018, 193, 189–197. [Google Scholar] [CrossRef] [PubMed]
- Briffa, J.; Sinagra, E.; Blundell, R. Heavy metal pollution in the environment and their toxicological effects on humans. Heliyon 2020, 6, e04691. [Google Scholar] [CrossRef] [PubMed]
Figure 1.
The study area and the distribution of the sampling sites.

Figure 2.
(a) Spatial distribution of the concentration of Cd; (b) spatial distribution of the concentration of Zn; (c) spatial distribution of the concentration of Pb; (d) spatial distribution of the concentration of Cu; (e) spatial distribution of the concentration of Cr; (f) spatial distribution of the concentration of SOM; (g) spatial distribution of the pH values.

Figure 3.
Ecological risk index of Cd.

Figure 4.
The results of the multiple regression model.


Table 1.
Risk control standard for soil contamination of agricultural land and background values for soil in Jiangsu Province /mg·kg−1.
Table 1.
Risk control standard for soil contamination of agricultural land and background values for soil in Jiangsu Province /mg·kg−1.
| Metal | Cd | Cr | Cu | Pb | Zn |
|---|---|---|---|---|---|
| Background standard values | 0.126 | 77.8 | 22.3 | 26.2 | 62.6 |
| Risk screening values | 0.3 | 150 | 50 | 90 | 200 |
| Risk intervention values | 2 | 850 | 500 |
Table 2.
Risk control standard for soil contamination of agricultural land and background values for soil (mg·kg−1) in Jiangsu Province.
Table 2.
Risk control standard for soil contamination of agricultural land and background values for soil (mg·kg−1) in Jiangsu Province.
| Grade | Nemerow Pollution Index | Pollution Degree |
|---|---|---|
| 1 | Safety | |
| 2 | Precaution | |
| 3 | Slight pollution | |
| 4 | Moderate pollution | |
| 5 | Heavy pollution |
Table 3.
Toxicity coefficient of heavy metals.
| Heavy Metal | Cd | Cr | Cu | Pb | Zn |
|---|---|---|---|---|---|
| Toxicity factor | 30 | 2 | 5 | 5 | 1 |
Table 4.
Classifying standards of the potential ecological risk index and pollution degree of heavy metals.
Table 4.
Classifying standards of the potential ecological risk index and pollution degree of heavy metals.
| Ei | Level of Contamination | Ri | Level of Contamination |
|---|---|---|---|
| Low | Low | ||
| Moderate | Moderate | ||
| High | High | ||
| Severe | |||
| Extremely | Severe |
Table 5.
Definition and descriptive statistics of variables.
| Variable | Definition and Unit | |
|---|---|---|
| Dependent variable | Risk | Potential ecological risk index of different heavy metals |
| Independent variable | chemical | Distance to the chemical industry (kilometer) |
| mechanical | Distance to the mechanical processing industry (kilometer) | |
| building | Distance to the building materials industry (kilometer) | |
| metal | Distance to the metal industry (kilometer) | |
| other | Distance to the other industries (kilometer) | |
| highway | Distance to the highway (kilometer) | |
| village | Distance to the village (kilometer) | |
| Control variable | land | Type of land (1 = paddy field; 2 = dry land; 3 = other land) |
| soil organic matter | ||
| pH | ||
| slope | Slope (°) | |
| DEM | ||
Note: Other lands include woodlands, orchards, tea plantations, and grasslands, each with a small percentage, so they are combined.
Table 6.
Descriptive statistics for heavy metals in the topsoil (mg kg−1; SOM: %).
| Metals | Mean | Median | SD | Min | Max | CV (%) |
|---|---|---|---|---|---|---|
| Cd | 0.11 | 0.10 | 0.04 | 0.04 | 0.26 | 40.16 |
| Cr | 69.23 | 69.44 | 10.62 | 30.13 | 98.39 | 15.34 |
| Cu | 27.33 | 26.42 | 6.83 | 16.26 | 69.53 | 24.97 |
| Pb | 27.47 | 27.50 | 4.08 | 14.59 | 38.15 | 14.86 |
| Zn | 58.94 | 56.34 | 12.57 | 38.86 | 120.67 | 21.32 |
| SOM | 1.67 | 1.55 | 0.85 | 0.04 | 4.57 | 50.86 |
| pH | 5.97 | 5.83 | 0.90 | 4.24 | 8.07 | 15.07 |
Table 7.
Pollution degree and potential ecological risk of heavy metals in the study area.
| Metal | Cd | Cr | Cu | Pb | Zn |
|---|---|---|---|---|---|
| Mean Pi | 0.35 | 0.46 | 0.55 | 0.31 | 0.29 |
| Max Pi | 0.85 | 0.66 | 1.39 | 0.42 | 0.60 |
| Nemerow pollution index | 0.65 | 0.57 | 1.06 | 0.37 | 0.47 |
| Nemerow pollution degree | safety | safety | precaution | safety | safety |
| Mean Ei | 25.33 | 1.78 | 6.13 | 5.24 | 0.94 |
| Risk | low | low | low | low | low |
Table 8.
Results of principal component analysis (PCA).
| Metals | Factor Load (Orthogonal Rotation) | |
|---|---|---|
| PC1 | PC2 | |
| Zn | 0.801 | −0.224 |
| Cd | 0.775 | −0.253 |
| Cu | 0.747 | −0.193 |
| Pb | 0.590 | 0.506 |
| Cr | 0.260 | 0.854 |
| % Variance contribution rate | 44.304 | 22.722 |
| % Cumulative contribution rate | 44.304 | 67.027 |
Table 9.
Definition and descriptive statistics of variables.
| Cu | Cd | Cr | Pb | Zn | |
|---|---|---|---|---|---|
| chemical | 0.197 | −2.415 * | 0.042 | 0.075 | 0.016 |
| (1.84) | (−2.28) | (1.11) | (0.84) | (0.82) | |
| mechanical | 0.276 | 1.181 | 0.030 | 0.174 | 0.012 |
| (1.18) | (0.87) | (0.97) | (1.70) | (0.60) | |
| building | −0.022 | 0.460 | −0.013 | 0.094 | −0.000 |
| (−0.14) | (0.40) | (−0.47) | (1.01) | (−0.01) | |
| metal | −0.257 | −0.392 | −0.072 | −0.247 * | −0.016 |
| (−1.50) | (−0.33) | (−1.72) | (−2.23) | (−0.73) | |
| other | −0.401 * | 0.979 | −0.064 | −0.129 | −0.018 |
| (−2.15) | (0.75) | (−1.24) | (−1.00) | (−0.77) | |
| highway | −0.185 | 2.447 | −0.065 | −0.170 | 0.008 |
| (−0.29) | (0.57) | (−0.65) | (−0.73) | (0.12) | |
| village | 2.644 | 0.107 | −0.048 | −1.971 ** | −0.142 |
| (1.48) | (0.01) | (−0.26) | (−3.27) | (−0.99) | |
| paddy field | 0.625 | 3.132 | −0.064 | −0.037 | 0.054 |
| (1.26) | (1.16) | (−0.77) | (−0.12) | (0.89) | |
| dry land | 0.748 | 8.165 ** | −0.045 | −0.241 | 0.120 * |
| (1.94) | (2.89) | (−0.53) | (−0.85) | (2.37) | |
| organic | 0.152 | 1.024 | −0.009 | 0.020 | 0.029 |
| (0.76) | (0.68) | (−0.25) | (0.20) | (1.09) | |
| pH | −0.040 | 0.721 | 0.047 | 0.246 * | 0.018 |
| (−0.20) | (0.47) | (1.40) | (2.12) | (0.78) | |
| slope | −0.081 | −0.210 | 0.005 | 0.003 | −0.001 |
| (−1.88) | (−0.83) | (0.58) | (0.12) | (−0.15) | |
| DEM | 0.006 | 0.074 | 0.000 | 0.010 | 0.001 |
| (0.83) | (1.46) | (0.11) | (1.97) | (1.38) | |
| _cons | 5.664 *** | 12.803 | 1.694 *** | 3.941 *** | 0.713 *** |
| (3.67) | (1.06) | (6.68) | (4.69) | (3.86) | |
| N | 100 | 100 | 100 | 100 | 100 |
| R2 | 0.138 | 0.118 | 0.143 | 0.254 | 0.070 |
Note: t statistics in parentheses, * p < 0.05, ** p < 0.01, *** p < 0.001.
Publisher’s Note: MDPI stays neutral with regard to jurisdictional claims in published maps and institutional affiliations. |
© 2021 by the authors. Licensee MDPI, Basel, Switzerland. This article is an open access article distributed under the terms and conditions of the Creative Commons Attribution (CC BY) license (https://creativecommons.org/licenses/by/4.0/).
Share and Cite
MDPI and ACS Style
Xu, C.; Pu, J.; Wen, B.; Xia, M. Potential Ecological Risks of Heavy Metals in Agricultural Soil Alongside Highways and Their Relationship with Landscape. Agriculture 2021, 11, 800. https://0-doi-org.brum.beds.ac.uk/10.3390/agriculture11080800
AMA Style
Xu C, Pu J, Wen B, Xia M. Potential Ecological Risks of Heavy Metals in Agricultural Soil Alongside Highways and Their Relationship with Landscape. Agriculture. 2021; 11(8):800. https://0-doi-org.brum.beds.ac.uk/10.3390/agriculture11080800
Chicago/Turabian StyleXu, Cong, Jie Pu, Bo Wen, and Min Xia. 2021. "Potential Ecological Risks of Heavy Metals in Agricultural Soil Alongside Highways and Their Relationship with Landscape" Agriculture 11, no. 8: 800. https://0-doi-org.brum.beds.ac.uk/10.3390/agriculture11080800
Note that from the first issue of 2016, this journal uses article numbers instead of page numbers. See further details here.