Opinion

Application Status and Prospect of Impedance Spectroscopy in Agricultural Product Quality Detection

1
School of Electrical and Optoelectronic Engineering, Anhui Undergrowth Crop Intelligent Equipment Engineering Research Center, West Anhui University, Lu’an 237012, China
2
Key Laboratory of Modern Agricultural Equipment and Technology, Ministry of Education, Jiangsu University, Zhenjiang 212013, China
3
College of Biology and Pharmaceutical Engineering, Anhui Engineering Laboratory for Conservation and Sustainable Utilization of Traditional Chinese Medicine Resources, West Anhui University, Lu’an 237012, China
*
Author to whom correspondence should be addressed.
Submission received: 30 July 2022 / Revised: 17 September 2022 / Accepted: 19 September 2022 / Published: 22 September 2022

Abstract

:
The nondestructive testing of agricultural products has always been a key technology for the modernization of agriculture and food. By applying a sinusoidal voltage (current) excitation signal of variable frequency, the relationship between the amplitude, frequency and phase of the response signal is obtained, and the measured response function in a certain frequency range is obtained, constructing the correlation between impedance spectroscopy and matter properties. Electrical impedance spectroscopy (EIS) is a widely used method for the nondestructive characterization of agricultural products, and its applications in the agricultural field has attracted increasing attention. This paper summarizes the research of electrical impedance spectroscopy (EIS) in the detection of grain quality, fruit and vegetable quality, meat quality and food quality from 2005 to 2022. The potential and development direction of electrical impedance spectroscopy in the nondestructive testing of agricultural product quality are prospected, which provides a reference for scientific researchers who applied electrical impedance spectroscopy in agricultural product quality detection.

1. Introduction

In recent years, the level of science and technology and experimental equipment has developed rapidly. Hyperspectral, near-infrared (NIR) spectroscopy, multispectral, Raman spectroscopy, terahertz (THz) spectroscopy, nuclear magnetic resonance (NMR), electrical impedance spectroscopy (EIS) and other nondestructive detection methods are widely used in the rapid detection of material components. Various nondestructive testing methods show good results and broad application prospects in various fields. However, the above five methods all need to rely on relatively expensive instruments and equipment, which brings difficulties to the industrialization of related applications. Impedance spectroscopy has the advantages of low cost, simple principle and the potential for qualitative and quantitative analysis of sample components. It has a wide application prospect in the nondestructive testing of agricultural products.
Electrical impedance spectroscopy (EIS), also known as AC impedance spectroscopy, is a noninvasive measurement technique widely used in agriculture. When electrical impedance spectroscopy (EIS) works, small amplitude sine wave voltage or current signals with different frequencies are used as excitation signals to actively disturb the steady-state electrochemical system. The amplitude, frequency and phase relationship between the excitation signal and the response signal are obtained through experiments, and the frequency response function of the measured system is explored. Compared with conventional electrochemical methods, electrical impedance spectroscopy can better reflect the internal electrochemical process of substances by using impedance characteristics and provide a basis for the qualitative detection of related components and contents. From 2005 to 2022, relevant researchers from various research institutions around the world used impedance spectroscopy technology to carry out research in the detection of grain quality, fruit and vegetable quality, meat quality and food quality. There were relatively more studies on food quality and meat quality. It may be that food and meat were easier to be standardized, which provides a standard environment for the detection of electrical impedance spectroscopy. However, in recent years, there has been much literature focusing on the quality of grain and fruit, indicating that the application of electrical impedance spectroscopy in the quality of grain, fruits and vegetables has potential.
The literature [1,2,3,4,5,6,7,8,9,10] shows the research potential of impedance spectroscopy technology in grain quality, mainly focusing on the research of rice [1,2,3,4], wheat [5], potato [6,7,8], corn [9] and olive [10]. The literature [11,12,13,14,15,16,17,18,19] shows the research potential of impedance spectroscopy in fruit and vegetable quality, mainly focusing on the research of onion [11], mango [12,13], banana [14], tomato [15], lemon [16], pineapple [17,18] and cucumber [19]. The literature [20,21,22,23,24,25,26,27,28,29,30,31,32,33,34,35,36,37] shows the research potential of impedance spectroscopy in meat quality detection, mainly including research on beef [20,21], fish [22,23,24,25,26,27,28,29], pork [30,31,32,33,34,35,36] and chicken [37]. The literature [38,39,40,41,42,43,44,45,46,47,48,49,50,51,52] shows the research potential of impedance spectroscopy in food quality detection, mainly including research on spirit [38,39], oil [40,41,42], honey [43,44,45], beverage [46], soymilk [47], milk [48], salt [49,50] and other foods [51,52]. The above research mainly focused on four categories of research objects: grain, fruits and vegetables, meat, food, etc., carrying out research on the content, variety, composition, freshness and maturity of the object. It shows that the application of impedance spectroscopy in the nondestructive testing of agricultural product quality has broad prospects.

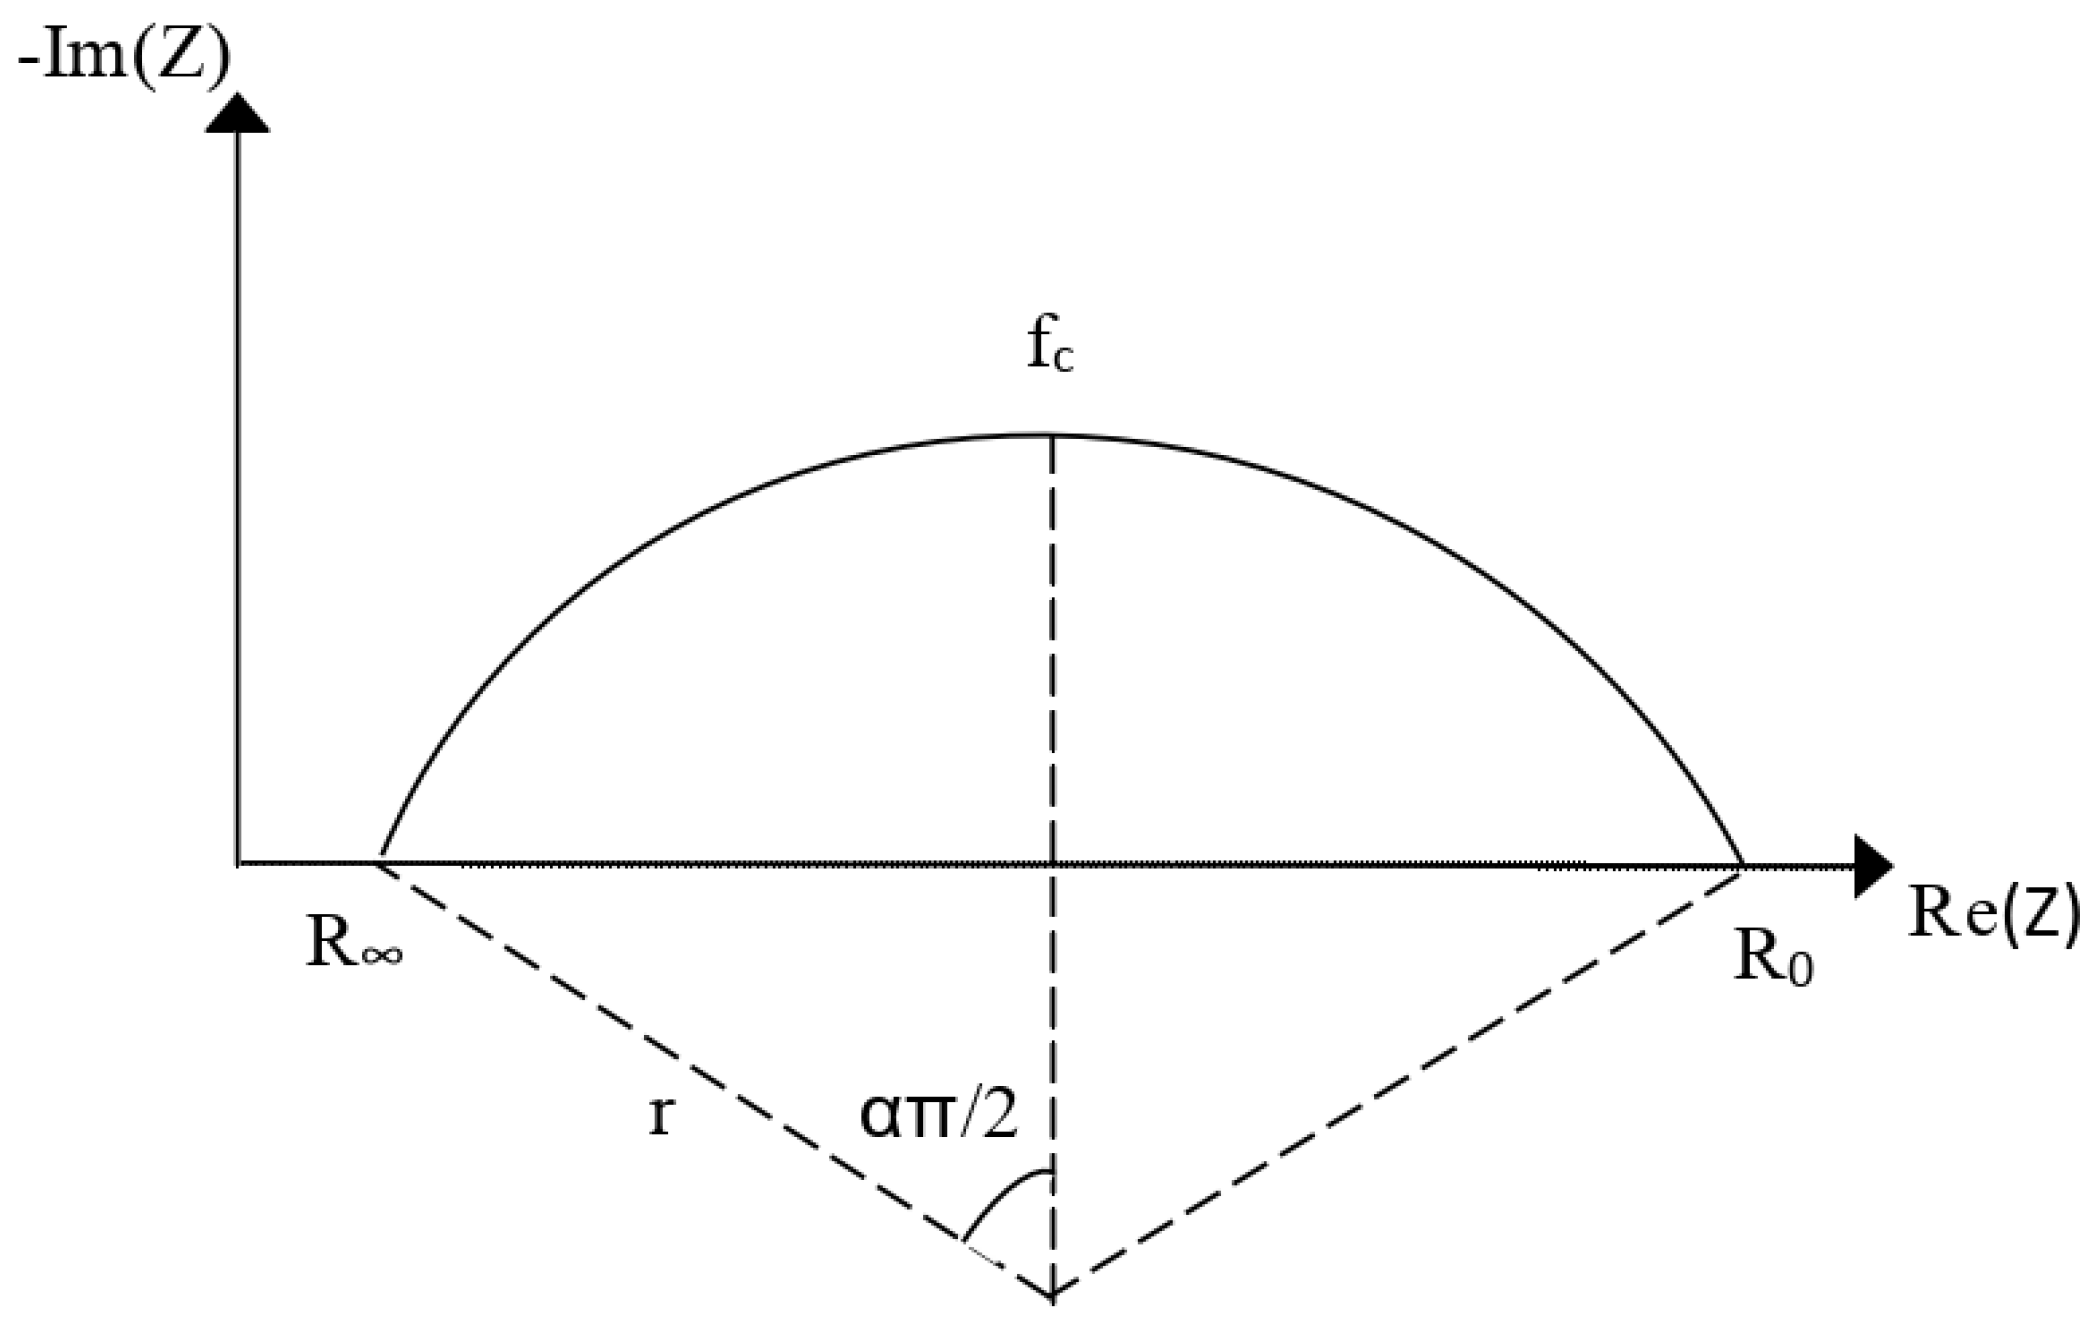
2. Electrical Impedance Spectroscopy Principle

Electrical impedance spectroscopy (EIS), namely AC impedance spectroscopy, is a noninvasive measurement technology widely used in agriculture. The working principle of electrical impedance spectroscopy (EIS) is to take small amplitude sine wave voltage or current signals with different frequencies as excitation signals to actively disturb the biological tissue system. The controllable small-amplitude excitation signal can avoid the influence on the equilibrium state and maintain an approximately linear relationship between response and excitation. At this time, the system is composed of electrodes at both ends, and the tested biomaterial can be considered as a simplified two-port network.
The transfer function is the ratio of the output signal to the input signal in a two-port network. When the input excitation signal X is a sine wave with a specific frequency, the frequency response function is the transfer function G ω . The relationship between the input excitation signal X and the output response signal Y can be expressed as [28]:
Y = G ω X
The cell is the basic unit of biology, and the electrical properties of biological tissue are closely related to its internal cell structure. According to the different electrical properties, cells can be divided into two parts: the external cell membrane and the intracellular fluid wrapped in it. The extracellular fluid distributed between cells has similar electrical properties to the intracellular fluid.
The cell membrane is a double phospholipid structure, and ion transport proteins are distributed between the cell membranes, which have dielectric properties. Both intracellular fluid and extracellular fluid are electrolytes with good conductivity. The cells are surrounded by internal and external fluids. Their electrical characteristics are similar to a flat-panel capacitor. The internal and external fluids are equivalent to conductive plates, and the cell membrane is equivalent to a dielectric sandwiched between the two conductive electrode plates [28]. The conduction paths of high-frequency and low-frequency currents in biological tissues are shown in Figure 1 [28]. When the frequency of the excitation signal is low, the capacitive reactance of the “flat-panel capacitor” is large, and the low-frequency current cannot penetrate the cell membrane and can only be conducted through the extracellular fluid. When the excitation frequency is high enough, the effect of cell membrane capacitance on the electrical properties of biological tissues can be ignored, which is equivalent to the straight through form. Therefore, even if the frequency could be further increased, the impedance value does not change significantly, and the impedance value changes tends to be gentle.
The equivalent circuit model of bioelectrical impedance is shown in Figure 2. In the figure, R e is the equivalent extracellular fluid resistance, R i is the equivalent intracellular fluid resistance, C m is the equivalent cell membrane capacitance, R v is the vacuole sap resistance and C t is the tonoplast capacitance. Figure 2a is the lumped model; Figure 2b is the double-shell model. We took the lumped model as an example for analysis. When the cell was under the high-frequency excitation power supply, the C m capacitive reactance was low. The current through the biological tissue was shunted by two parallel branches. When the frequency of the excitation power decreased gradually, the capacitive reactance value of C m increased, and the low-frequency current passed through the R e branch. The impedance mode of biological tissue decreased with the increase in excitation power frequency [51,52,53,54,55].
Z = R e 1 + j ω C m R i 1 + j ω C m R e + R i = R e + ω 2 C m 2 R e R i R e + R i 1 + R e + R i 2 ω 2 C m 2 j ω C m R e 2 1 + R e + R i 2 ω 2 C m 2
where Z is the impedance, R e is the equivalent extracellular fluid resistance, R i is the equivalent intracellular fluid resistance [56], C m is the equivalent cell membrane capacitance and ω is the angular frequency [57].
The modulo of impedance Z is:
Z = R e 2 1 + ω 2 C m 2 R i 2 1 + ω 2 C m 2 R e + R i 2
The impedance phase angle θ is:
θ = arctg ω C m R e 2 1 + R e + R i 2 ω 2 C m 2 / R e + ω 2 C m 2 R e R i R e + R i 1 + R e + R i 2 ω 2 C m 2
The lumped circuit model of biological tissue is only a description of the electrical properties of the tissue under ideal conditions [58]. Due to the difference between the electrical properties of the cell membrane of biological tissue and the ideal capacitive element, it is also affected by factors such as the internal structure of the tissue and the difference in electrode structure. Biological tissue was difficult to simulate accurately with an equivalent circuit consisting of only three elements. However, the lumped circuit model revealed the basic electrical characteristics of biological tissues, which is one of the most important theoretical foundations of biological impedance spectroscopy [59].
Assume τ = R i + R e C m , R 0 = R e ,   R = R i R e R i + R e The Equation (2) is equivalent to:
Z = R + R 0 R 1 + j ω τ
where τ is the time constant of the circuit, R 0 is the resistance value at the initial time and R is the resistance value at the stable time.
Figure 3 shows the Cole trajectory on the complex plane. This figure is used to describe the resistance and reactance of the impedance Z with frequency [52]. The solid line part is the part of the semicircle arc in the first quadrant after the center of the circle is offset [53].
The frequency corresponding to the highest point of the arc and the largest reactance is called the characteristic frequency. The calculation equation is as follows:
f c = 1 2 π τ = 1 2 π R e + R i C m

3. Electrical Impedance Spectroscopy Application in Agriculture

3.1. Electrical Impedance Spectroscopy Application in Grain Quality Detection

Grain is the basic food guaranteed for human survival. Its quality and safety directly affect people’s basic physical and mental health. Therefore, rapid nondestructive testing of grain is one of the important ways to improve grain quality. In recent years, impedance spectroscopy has been widely used in food quality inspection due to its low cost, nondestructiveness and good stability. The study of EIS in grain quality mainly includes rice, wheat, potato, corn and olive. Among them, rice is the most studied.
The literature [1,2,3,4,5,6,7,8,9,10] shows the research potential of impedance spectroscopy technology in grain quality, mainly focusing on the research of rice [1,2,3,4], wheat [5], potato [6,7,8], corn [9] and olive [10]. Feng Longlong et al. [3]. constructed the experimental platform of rice seed impedance spectroscopy measurement as shown in Figure 4. The impedance analyzer im3570 was used to measure the sample, and the electrode material was copper with a diameter of 1 mm. The experimental seeds were fresh seeds (harvested in 2020) and naturally aged seeds (harvested in 2019), which were used as the research objects for the differentiation of seed vigor. They experimentally obtained the impedance spectroscopy of fresh and chemical seeds and divided them into two parts. The training set and the test set in the dataset were divided equally. The characteristic frequency was determined by impedance spectroscopy characteristic analysis, and the aging degree of model rice seeds was predicted by Fisher linear discriminant method. The results show that the change in impedance was correlated with seed vigor and water content.
The electrical impedance spectra of seeds with different vigor is shown in Figure 5. The impedance spectroscopy information of LG (rice seed variety Longgeng 852) and XQ (rice seed variety Xiuqiu 369) was obtained through experiments. The response of impedance value with frequency is shown in Figure 5(1,2), and the impedance value decreased with the increase in frequency. The impedance values of seeds in different years were different, and aged seeds were larger than fresh seeds. The curve of the phase angle with frequency response is shown in Figure 5(3,4). The phase angle of aged seeds was smaller than that of fresh seeds.
Song Qi et al. [2,3] carried out the design of rice moisture sensors to realize the real-time detection of rice moisture content. Firstly, through Solartron impedance analyzer 1260a + 1294, they studied the influence of excitation power frequency (1 Hz–1 MHz) and rice moisture content (12–29%) on rice impedance mode. The impedance spectroscopy information of rice was obtained through experiments, and the frequency range of rice water content detection was determined to be 200 Hz to 2 kHz. The experimental data of rice at different frequencies were obtained through experiments, and the rice water evaluation model was obtained by regression analysis method. Tao Ran [4] carried out the electrical impedance spectroscopy characteristics of rice leaves in the seedling stage under four low-temperature stress conditions of 0 °C, −4 °C, −8 °C and−10 °C to detect the physiological characteristics of rice in the seedling stage under low-temperature stress. Kocheva K. V. et al. [5] obtained the complete wheat leaf impedance spectroscopy in the frequency range of 7–2010 Hz and combined the impedance spectroscopy differences of different wheat varieties to achieve wheat variety differentiation.
Feng Longlong et al. [6] obtained the impedance spectroscopy of potatoes at 20 °C, 0 °C, −4 °C and −20 °C, combined with the morphological feature points of the impedance spectroscopy, which could be used to evaluate the frostbite of potatoes. Fuentes A. et al. [7] applied impedance spectroscopy to determine the effect of temperature on the tissue structure and texture properties of potatoes. Chee G. et al. [8] applied electrical impedance spectroscopy to the evaluation of the dielectric constant and loss factor of potatoes with different water contents to evaluate the dielectric properties of potatoes. Pengfei Z. et al. [9] applied electrical impedance spectroscopy to the online nondestructive testing of water content in corn ears. The results show that there was a good correlation between impedance and water content.
Luna J M M et al. [10] designed and implemented portable electrical impedance spectroscopy equipment based on Field Programmable Gate Array (FPGA) XC3S250E-4VQG100C, System on Chip (SoC) AD5933, Analog Multiplexers ADG 706. The impedance spectrum could realize the measurement range of frequency from 1 Hz to 100 kHz, which could realize the wireless transmission of data. Based on the measurement of the equipment and combined with a neural network, the identification of olive varieties was realized.

3.2. Electrical Impedance Spectroscopy Application in Fruit and Vegetable Quality Detection

The literature [11,12,13,14,15,16,17,18,19] shows the research potential of impedance spectroscopy in fruit and vegetable quality, mainly focusing on the research of onion [11], mango [12,13], banana [14], tomato [15], lemon [16], pineapple [17,18] and cucumber [19]. The specific judgment characteristics of electrical impedance spectroscopy in fruit and vegetable quality detection mainly included maturity detection, freezing injury detection, product content detection and characteristic judgment.
Figure 6 shows the electrical impedance measurement system constructed by Islam M. et al. [11], which mainly included the two-electrode impedance measurement method, the four-electrode impedance measurement method, the schematic diagram of the EIS measurement of onion moisture and the electrical impedance spectroscopy measurement experimental system. Considering that the four-electrode impedance measurement method had better repeatability and stability, the experiment adopted the four-electrode impedance measurement method to obtain the mathematical model of onion and impedance data, which provided a basis for the qualitative and quantitative study of onion physiological changes.
Neto A F [12] and Rehman M [13] applied impedance spectroscopy to the judgment of mango maturity. In the frequency range of 1–6 kHz, when the frequency was consistent, the effective capacitance of mature mangoes was smaller than that of raw mangoes. Since the liquid content of the fruit fiber changed during the ripening process of mangoes, it was effective to use electrical impedance to judge the ripeness of mangoes. Chowdhury A [14] and Li J [15], respectively, applied impedance spectroscopy technology to the maturity determination of bananas and tomatoes. The impedance spectra of each maturity stage obtained from samples could provide prediction basis for the maturity determination of samples with unknown maturity. Ochandio Fernández A et al. [16] applied impedance spectroscopy to the detection of lemon freezing injury, built a lemon freezing injury detection system based on electrical impedance spectroscopy technology, then built a prediction model based on artificial neural network, with a prediction accuracy of 100%. Conesa C et al. [17,18] applied impedance spectroscopy to the determination of ethanol concentration and the enzymatic hydrolysis process of pineapple waste and combined it with an artificial neural network to give prediction models of glucose, fructose, sucrose, total sugar and ethanol, R2 > 0.973, RMSEP < 0.486. Wang Xingzhi et al. [19] studied the impedance characteristics of cucumbers under different storage methods. The impedance value of cucumbers would decrease under refrigeration conditions, while the impedance values of cucumbers under plastic wrap and room temperature conditions would increase with the loss of water.

3.3. Electrical Impedance Spectroscopy Application in Meat Quality Inspection

The literature [20,21,22,23,24,25,26,27,28,29,30,31,32,33,34,35,36,37] shows the research potential of impedance spectroscopy in meat quality detection, mainly including research on beef [20,21], fish [22,23,24,25,26,27,28,29], pork [30,31,32,33,34,35,36] and chicken [37]. Electrical impedance spectroscopy was used in the specific determination of meat quality detection, predicting the freshness of meat and changing the composition of meat processing.
Figure 7 shows the beef freshness detection system based on impedance spectroscopy constructed by Sooin Huh [20,21], which could obtain the impedance spectroscopy of beef in the frequency range of 125 Hz to 128 kHz and combine the impedance spectroscopy with the meat image. The prediction of beef freshness was based on Adaboost classification and the gradient boosting regression algorithm.
Figure 8 shows the impedance spectroscopy measurements of beef tenderloin and beef round. The results show that the impedance value gradually decreases with the storage period.
Sun Jian et al., Niu J et al., Pérez-Esteve E et al. and Liang Liming et al. [22,23,24,25,26,27,28] realized the freshness evaluation of sea bream, silver carp, carp, herring, perch and salmon based on impedance spectroscopy. The relationship between physical and chemical parameters (moisture, fat, pH and TVBN) and the impedance characteristics of fish was modeled, and the regression coefficient (R2) was 0.72 combined with the least square regression algorithm. A data fusion algorithm based on model similarity was proposed to analyze and quantify the relationship between the EIS feature parameters of chemical features associated with freshness and determine the weight factor of data fusion. Rizo A et al. [29] proposed the method of applying impedance spectroscopy to the monitoring of the salmon pickling process. Through the acquisition and analysis of impedance spectroscopy, a robust prediction model of NaCl content and water content in the salmon pickling process was finally obtained. The method would provide better application and promotion value for monitoring the process of food pickling.
Yang Y. et al. [30], Wang Lianhuan et al. [31] and Wang Kening et al. [32] applied impedance spectroscopy to measure pork moisture content, established an equivalent model between impedance parameters and pork moisture content, then established a moisture prediction model. The accuracy of the prediction result is R = 0.849, which had a good effect. Ding Qiang et al. [33], Zhao Xin et al. [34] and Zhong Xiaohang [35] developed a portable impedance spectroscopy detection system. The signal source frequency of the system could change in the range of 0.1–250 kHz. The relationship between pork freshness and impedance spectroscopy was studied. With the decrease in pork freshness, the impedance value showed a decreasing trend. Muller T. L. et al. [36] carried out the application of impedance spectroscopy in the prediction of body composition of sows, predicted the fat mass and fat-free mass of the sow body and simultaneously characterized the sow body fluids and decreased body weight. The modeling-based prediction method had a good effect on the body composition assessment of sows. Schmidt F. C. et al. [37] established a nondestructive testing system based on impedance spectroscopy and studied the impedance characteristics of chickens under different heat treatment conditions. The correlation between processing parameters and impedance was established by the least square method, which laid a good foundation for meat quality detection in meat processing production lines.

3.4. Electrical Impedance Spectroscopy Application in Food Quality Inspection

The literature [38,39,40,41,42,43,44,45,46,47,48,49,50,51,52] shows the research potential of impedance spectroscopy in food quality detection, mainly including research on spirit [38,39], oil [40,41,42], honey [43,44,45], beverage [46], soymilk [47], milk [48], salt [49,50] and other foods [51,52]. The specific characteristics of electrical impedance spectroscopy in food quality detection mainly include food category, food adulteration, component content and reaction change process characterization.
The electrical impedance spectroscopy-based detection system for phthalates in liquor constructed by Jiang Xinyue [38,39] is shown in Figure 9. Electrical impedance spectroscopy can obtain impedance spectra from 1 Hz to 0.1 MHz. The upper limit of detection of diethyl phthalate was 0.024 ng/L, and the content ranges from 2.22 ng to 1.11 μg were linear with impedance. This research provided an important basis for the development of phthalate detection sensors in Chinese liquor.
Figure 10a,b shows the EIS responses of glassy carbon electrode and graphene electrode with and without PAEs, respectively. Figure 10c,d is obtained by deconvolution of Figure 10a,b. Figure 10c shows that 223 Hz was the departure starting point of the two curves, reaching the maximum value at 13.6 Hz. The curve in Figure 10d is relatively consistent, while there is no obvious distinction.
Sairin M A et al. [40] developed a portable impedance analyzer in the frequency range of 5–100 kHz based on the AD5933 evaluation board to realize the impedance spectroscopy of palm oil (0.1%, 0.5%, 1%, 5% and 10%), and PCA classification could significantly distinguish different concentrations of adulteration. M’Peko J C et al. [41] and Yu Yaolong et al. [42] constructed an impedance spectroscopy acquisition system based on the Solartron SI 1260 impedance analyzer and the Agilent 4294 A precision impedance analyzer to distinguish vegetable oil and waste oil, respectively. By acquiring the impedance spectroscopy characteristics at different frequencies, different types of oil could be extracted and detected.
Ulloa P a et al. [43], Das c et al. [44] and Scandurra G et al. [45] applied electrical impedance spectroscopy to distinguish the source of honey flowers and sugar-doped honey. The equivalent circuit model of a single-flower honey sample was constructed and verified by electrical simulation, and the electrical signal was associated with the characteristics of honey. This method provided a good prediction effect on the quality and source of honey. Soares C et al. [46] applied electrical impedance spectroscopy to the characterization of various beverages such as milk, plant beverages, tea, barley, instant coffee, ground coffee and coffee substitutes, combining clustering algorithms and visualization algorithms to process the data. The results show that the application of electrical impedance spectroscopy to the characterization and differentiation of beverages was effective. Li Xingshu et al. [47] constructed an ohmic heating and impedance measurement system. The ohmic heating system was used to control the coagulation of soybean milk. Combined with the impedance measurement system, the coagulation process of soybean milk was characterized. This method laid the foundation for the control of the coagulation process of soybean milk. Masot R et al. [48] characterized the impedance characteristics of ordinary milk, reduced milk and fortified milk of different brands based on an impedance analyzer and established an impedance spectroscopy experimental analysis system. EIS could accurately characterize different milks and had high application potential in the field of milk quality monitoring. Masot R et al. [49] and Grossi M et al. [50] developed a portable impedance spectroscopy measurement system and applied impedance spectroscopy to the characterization of salt solutions with different concentrations. Caicedo-Eraso J C [51] and Guermazi M [52] summarized and prospected the application of impedance spectroscopy in the quality control and evaluation of the food industry.

4. Main Problems and Future Prospects of Impedance Spectroscopy in Agriculture

4.1. Current Main Problems

(1) Electrical impedance spectroscopy (EIS) is widely used in grain quality detection. The research objects are mainly distributed in rice, wheat, potato and corn [1,2,3,4,5,6,7,8,9,10]. Experts’ research on grain quality combined with impedance spectroscopy mainly focuses on the degree of seed aging, moisture content determination, variety discrimination and frostbite assessment. According to the comprehensive literature research, the research object was relatively single, and the research on a single object was relatively one-sided and unsystematic, which could not lay a good theoretical and practical foundation for the rapid detection of grain quality. The research and evaluation of grain quality mainly focused on aging, moisture, variety and frostbite, mainly for the quality judgment of grain products.
Therefore, some research suggestions can be carried out for grain quality detection: ① Expanding the application of impedance spectroscopy in grain quality detection in addition to the current research objects of rice, wheat, potato and corn. Researching sweet potato, soybean, sorghum, barley, mung bean and other objects can also be carried out.② Improving the research depth of impedance spectroscopy in the field of grain quality detection, conducting in-depth and systematic research on a certain grain qualities. For rice, systematic research can be carried out from various processes such as rice growth, harvesting and storage. ③ Improving the research scope of grain quality assessment. In addition to the research on aging, moisture, variety and frostbite, it is possible to try to carry out research on impedance spectroscopy in grain maturity, grain growth nutrition determination, grain heavy metal pollution, etc.
(2) Electrical impedance spectroscopy (EIS) is worth studying in the quality detection of fruits and vegetables, while the research objects included onion, mango, banana, tomato, lemon, pineapple and cucumber [11,12,13,14,15,16,17,18,19]. Experts’ research on fruit and vegetable quality combined with impedance spectroscopy mainly focused on maturity determination, freezing injury assessment, product content and characteristic detection. Now, the research on the impedance spectroscopy of fruit and vegetable quality detection is relatively little, while the content of fruit and vegetable quality judgment was relatively simple.
Therefore, some research suggestions can be carried out for fruit and vegetable quality detection: ① Expanding the application of impedance spectroscopy in fruit and vegetable quality detection in addition to the current research objects such as onion, mango, banana, tomato, lemon, pineapple and cucumber. Research on radish, cabbage, spinach, pepper, eggplant, apple, pear, mulberry, dragon fruit, kiwi fruit, watermelon and other objects can also be carried out. ② Improving the research depth of the impedance spectroscopy of fruit and vegetable quality testing, conducting in-depth and systematic research on the quality of a certain fruit and vegetable. For example, as apples are one of the most common fruits worldwide, systematic research can be carried out on multiple processes such as fruit tree growth and nutrition acquisition, apple growth and ripening. ③ Improving the research scope of fruit and vegetable quality assessment, in addition to the research on maturity, freezing injury, product content and characteristics. Impedance spectroscopy can be used to study the variety, preservation, growth nutrition level, heavy metal pollution and pesticide residues of fruits and vegetables.
(3) Electrical impedance spectroscopy (EIS) is widely used in meat quality detection. The research objects were mainly distributed in beef, fish, pork, chicken and other meat [20,21,22,23,24,25,26,27,28,29,30,31,32,33,34,35,36,37]. Experts’ research on meat quality combined with impedance spectroscopy mainly focused on meat freshness, meat moisture content and body composition evaluation. The research depth of a single object was relatively limited, and it could not lay a good foundation for the application of rapid detection in the fields of meat quality detection and meat processing.
Therefore, some research suggestions can be carried out for meat quality detection: ① Expanding the application of impedance spectroscopy in meat quality detection in addition to the current research objects such as beef, fish, pork and chicken. Researching mutton, duck, goose, sea fish, freshwater fish, shrimp and other objects can also be carried out. ② Improving the research depth of impedance spectroscopy for meat quality detection, conduct in-depth and systematic research on a certain meat quality. For example, impedance spectroscopy can be used to study the preservation, water content, hormones, nutrients and processing of pork, and pork is one of the most common meats in the world. ③ Carrying out research on information fusion algorithm combining impedance spectroscopy technology and hyperspectral technology to improve the effect of nondestructive testing of meat quality.
(4) Electrical impedance spectroscopy (EIS) is widely used in food quality detection. The research objects were mainly distributed in oil, liquor, honey, beverages, soy milk, milk and salt [38,39,40,41,42,43,44,45,46,47,48,49,50,51,52]. Experts’ research on food quality combined with impedance spectroscopy technology was mainly distributed in food categories, food adulteration, component content and reaction change process characterization. Now, the research of impedance spectroscopy in food quality is not wide and deep enough. It cannot provide a good reference for the characterization of food quality.
Therefore, some research suggestions can be carried out for food quality detection: ① Expanding the application of impedance spectroscopy in food quality detection in addition to the current research objects such as oil, liquor, honey, beverages, soy milk, milk and salt. Researching soy sauce, vinegar, rice wine, red wine, coffee, juice and other objects can also be carried out. ② Improving the research of impedance spectroscopy in food quality on a certain food. For example, such as soy sauce, we can try to study the raw materials, ingredients, categories and freshness of soy sauce. ③ Carrying out the development of portable food quality impedance analysis equipment and the application research in fast food quality detection.

4.2. Prospects for Future Research

Impedance spectroscopy is gradually becoming an efficient nondestructive testing method for agricultural product testing, providing an effective way to characterize the quality characteristics of agricultural products for scientific researchers, enterprise technical staff and engineering technicians. Impedance spectroscopy can characterize the electrochemical properties of the internal properties of agricultural products, which can be correlated to specific quality characteristics [1,2,3,4,5,6,7,8,9,10,11,12,13,14,15,16,17,18,19,20,21,22,23,24,25,26,27,28,29,30,31,32,33,34,35,36,37,38,39,40,41,42,43,44,45,46,47,48,49,50,51,52]. The application of impedance spectroscopy in the detection of agricultural products is very promising, especially in the following aspects.
(1) Combining impedance spectroscopy with hyperspectral and terahertz spectroscopy. Research on multispectral data fusion algorithms to improve the accuracy of specific quality detection of agricultural products can be carried out. (2) Processing impedance spectroscopy data through advanced data processing algorithms to extract impedance frequencies and features associated with characteristic variables. (3) Combining machine learning and deep learning with impedance spectroscopy to further optimize the data through machine learning algorithms. (4) Carrying out research on portable impedance spectroscopy equipment for agricultural product quality analysis.

5. Conclusions

This paper analyzes the research status and advantages and disadvantages of impedance spectroscopy in the nondestructive testing of grain quality, fruit and vegetable quality, meat quality and food quality. The application of impedance spectroscopy in agricultural product detection was summarized. The combination of impedance spectroscopy and artificial intelligence is proposed as an important research direction in the future. Impedance spectroscopy analysis technology is combined with hyperspectral and terahertz spectrum analysis technology to carry out the research of multispectral data fusion algorithms, combining artificial intelligence algorithms with data processing technology to optimize feature extraction solutions, Thus further developing the application of portable impedance spectroscopy in the quality analysis of agricultural products. It is of great significance to promote the progress of nondestructive testing technology for agricultural product quality.

Author Contributions

Conceptualization, J.C. and X.J.; data curation, J.C. and Y.H.; formal analysis, G.Z. and P.Y.; investigation, C.L. and X.J.; methodology, J.C. and Y.H.; writing—original draft, P.Y. and G.Z.; writing—review and editing, J.C. and C.L. All authors have read and agreed to the published version of the manuscript.

Funding

This research was funded by Anhui Province University Outstanding Young Talents Support Project, grant number gxyq2022064; University Natural Science Research Project of Anhui Province KJ2020A0635; Scientific research project of West Anhui University, grant number WXZR202027, WXZR202115; Jiangsu graduate research and Practice Innovation Program, grant number KYCX22_3680.

Institutional Review Board Statement

Not applicable.

Informed Consent Statement

Not applicable.

Data Availability Statement

Not applicable.

Conflicts of Interest

The authors declare no conflict of interest.

References

  1. Feng, L.; Hou, T.; Wang, B.; Zhang, B. Assessment of rice seed vigour using selected frequencies of electrical impedance spectroscopy. Biosyst. Eng. 2021, 209, 53–63. [Google Scholar] [CrossRef]
  2. Song, Q.; Wei, X.; Sun, W.; Lu, Z.; Tao, T. Design of capacitive paddy moisture sensor based on electrical impedance spectroscopy analysis. Appl. Sci. 2020, 10, 3968. [Google Scholar] [CrossRef]
  3. Qi, S.; Zemin, L.; Weihong, S.; Xinhua, W. Analysis of rice electrical impedance spectrum and determination of detection frequency range. Agric. Mech. Res. 2018, 40, 172–176. [Google Scholar]
  4. Ran, T. Study on the Electrical Impedance Spectrum of Rice Leaves in the Seedling Stage under Low Temperature Stress; Shenyang Agricultural University: Shenyang, China, 2019. [Google Scholar]
  5. Kocheva, K.V.; Georgiev, G.I.; Kochev, V.K.; Olsovska, K.; Brestic, M. Application of impedance spectroscopy and conductometry for assessment of varietal differences in wheat. Cereal Res. Commun. 2015, 43, 579–590. [Google Scholar] [CrossRef]
  6. Feng, L.; Hou, T.; Zhang, B. A noninvasive method for detecting frozen injuries in potatoes based on electrical impedance spectroscopy. J. Food Process Eng. 2021, 44, e13682. [Google Scholar] [CrossRef]
  7. Fuentes, A.; Vázquez-Gutiérrez, J.L.; Pérez-Gago, M.B.; Vonasek, E.; Nitin, N.; Barrett, D.M. Application of nondestructive impedance spectroscopy to determination of the effect of temperature on potato microstructure and texture. J. Food Eng. 2014, 133, 16–22. [Google Scholar] [CrossRef]
  8. Chee, G.; Rungraeng, N.; Han, J.H.; Jun, S.J. Electrochemical impedance spectroscopy as an alternative to determine dielectric constant of potatoes at various moisture contents. J. Food Sci. 2014, 79, E195–E201. [Google Scholar] [CrossRef]
  9. Pengfei, Z.; Hanlin, Z.; Dongjie, Z.; Zhijie, W.; Lifeng, F.; Lan, H.; Qin, M.; Zhongyi, W. Rapid on-line nondestructive detection of the moisture content of corn ear by bioelectrical impedance spectroscopy. Int. J. Agric. Biol. Eng. 2015, 8, 37–45. [Google Scholar]
  10. Luna, J.M.M.; Luna, A.M.; Fernández, R.E.H. Characterization and Differentiation between Olive Varieties through Electrical Impedance Spectroscopy, Neural Networks and IoT. Sensors 2020, 20, 5932. [Google Scholar] [CrossRef]
  11. Islam, M.; Wahid, K.A.; Dinh, A.V.; Bhowmik, P. Model of dehydration and assessment of moisture content on onion using EIS. J. Food Sci. Technol. 2019, 56, 2814–2824. [Google Scholar] [CrossRef]
  12. Neto, A.F.; Olivier, N.C.; Cordeiro, E.R.; Oliveira, H.P. Determination of mango ripening degree by electrical impedance spectroscopy. Comput. Electron. Agric. 2017, 143, 222–226. [Google Scholar] [CrossRef]
  13. Rehman, M.; Abu Izneid, B.A.J.A.; Abdullah, M.Z.; Arshad, M.R. Assessment of quality of fruits using impedance spectroscopy. Int. J. Food Sci. Technol. 2011, 46, 1303–1309. [Google Scholar] [CrossRef]
  14. Chowdhury, A.; Kanti Bera, T.; Ghoshal, D.; Chakraborty, B. Electrical impedance variations in banana ripening: An analytical study with electrical impedance spectroscopy. J. Food Process Eng. 2017, 40, e12387. [Google Scholar] [CrossRef]
  15. Li, J.; Xu, Y.; Zhu, W.; Sun, H. Maturity assessment of tomato fruit based on electrical impedance spectroscopy. Int. J. Agric. Biol. Eng. 2019, 12, 154–161. [Google Scholar] [CrossRef]
  16. Ochandio Fernández, A.; Olguín Pinatti, C.A.; Masot Peris, R.; Laguarda-Miró, N. Freeze-damage detection in lemons using electrochemical impedance spectroscopy. Sensors 2019, 19, 4051. [Google Scholar] [CrossRef]
  17. Conesa, C.; Sanchez, L.G.; Segui, L.; Nicolás, P.F.; Laguarda-Mirób, N. Ethanol quantification in pineapple waste by an electrochemical impedance spectroscopy-based system and artificial neural networks. Chemom. Intell. Lab. Syst. 2017, 161, 1–7. [Google Scholar] [CrossRef]
  18. Conesa, C.; Ibanez Civera, J.; Seguí, L.; Fito, P.; Laguarda-Miró, L. An electrochemical impedance spectroscopy system for monitoring pineapple waste saccharification. Sensors 2016, 16, 188. [Google Scholar] [CrossRef]
  19. Xingzhi, W.; Junan, R.; Jianwu, R.; Hongjun, Y.; Rongfu, G. Study on impedance spectrum characteristics of cucumbers under different storage methods. J. Shanxi Agric. Univ. Nat. Sci. Ed. 2011, 31, 557–562. [Google Scholar]
  20. Huh, S.; Kim, H.J.; Lee, S.; Cho, J.; Jang, A.; Bae, J. Utilization of electrical impedance spectroscopy and image classification for non-invasive early assessment of meat freshness. Sensors 2021, 21, 1001. [Google Scholar] [CrossRef]
  21. Feng, Z.; Chen, Z.; Xiangjuan, L. Rapid and nondestructive evaluation of pig and beef freshness based on electrical impedance spectrum. Meat Res. 2019, 33, 51–56. [Google Scholar]
  22. Sun, J.; Liu, Y.; Wu, G.; Zhang, Y.; Zhang, R.; Li, X.J. A Fusion Parameter Method for Classifying Freshness of Fish Based on Electrochemical Impedance Spectroscopy. J. Food Qual. 2021, 2021, 6664291. [Google Scholar] [CrossRef]
  23. Niu, J.; Lee, J.Y. A new approach for the determination of fish freshness by electrochemical impedance spectroscopy. J. Food Sci. 2000, 65, 780–785. [Google Scholar] [CrossRef]
  24. Pérez-Esteve, E.; Fuentes, A.; Grau, R.; Fernández-Segovia, I.; Masotb, R.; Alcañiz, M.; Barata, J.M. Use of impedance spectroscopy for predicting freshness of sea bream (Sparus aurata). Food Control 2014, 35, 360–365. [Google Scholar] [CrossRef]
  25. Sun, J.; Zhang, R.; Zhang, Y.; Liang, Q.; Li, G.; Yang, N.; Xu, P.F.; Guo, J.J. Classifying fish freshness according to the relationship between EIS parameters and spoilage stages. J. Food Eng. 2018, 219, 101–110. [Google Scholar] [CrossRef]
  26. Sun, J.; Zhang, R.; Zhang, Y.; Li, G.; Liang, Q. Estimating freshness of carp based on EIS morphological characteristic. J. Food Eng. 2017, 193, 58–67. [Google Scholar] [CrossRef]
  27. Liming, L. Research on Salmon Quality Detection Based on Hyperspectral Imaging and Impedance Spectroscopy; Jiangsu University: Zhenjiang, China, 2020. [Google Scholar]
  28. Jian, S. Research on Key Technologies for Fish Freshness Detection Based on Impedance Spectroscopy; Jiangsu University: Zhenjiang, China, 2019. [Google Scholar]
  29. Rizo, A.; Fuentes, A.; Fernández-Segovia, I.; Masot, R.; Alcañiz, M.; Barat, M. Development of a new salmon salting–smoking method and process monitoring by impedance spectroscopy. LWT-Food Sci. Technol. 2013, 51, 218–224. [Google Scholar] [CrossRef]
  30. Yang, Y.; Wang, Z.Y.; Ding, Q.; Huang, L.; Wang, C.; Zhu, D.Z. Moisture content prediction of porcine meat by bioelectrical impedance spectroscopy. Math. Comput. Model. 2013, 58, 819–825. [Google Scholar] [CrossRef]
  31. Lianhuan, W. Research on the Identification Method of Water-Injected Meat Based on Bioelectrical Impedance Spectroscopy; Xi’an University of Technology: Xi’an, China, 2016. [Google Scholar]
  32. Kening, W.; Xiaopan, W.; Xiongxing, Z.; Wei, W. Application of AD5933 in Meat Impedance Spectroscopy Measurement System. J. Xi’an Univ. Technol. 2013, 32, 806–810. [Google Scholar]
  33. Qiang, D.; Zhongyi, W.; Lan, H.; Jianxi, H.; Gengwei, Z.; Wei, Z. Development of a portable pork impedance spectrum detection system. Chin. J. Agric. Eng. 2009, 12, 138–144. [Google Scholar]
  34. Zhao, X.; Zhuang, H.; Yoon, S.C.; Dong, Y.; Wang, W. Electrical impedance spectroscopy for quality assessment of meat and fish: A review on basic principles, measurement methods, and recent advances. J. Food Qual. 2017, 2017, 6370739. [Google Scholar] [CrossRef]
  35. Xiaohang, Z. Research on the Detection Method of Pork Freshness Based on Impedance Spectroscopy; Zhejiang Technology and Business University: Hangzhou, China, 2019. [Google Scholar]
  36. Muller, T.L.; Ward, L.C.; Plush, K.J.; Pluske, J.R.; D’Souza, D.N.; Bryden, W.L.; Barneveld, R.J. Use of bioelectrical impedance spectroscopy to provide a measure of body composition in sows. Animal 2021, 15, 100156. [Google Scholar] [CrossRef] [PubMed]
  37. Schmidt, F.C.; Fuentes, A.; Masot, R.; Alcañiz, M.; Laurindo, J.B.; Barat, J.M. Assessing heat treatment of chicken breast cuts by impedance spectroscopy. Food Sci. Technol. Int. 2017, 23, 110–118. [Google Scholar] [CrossRef] [PubMed]
  38. Jiang, X.; Xie, Y.; Wan, D.; Zheng, F.; Wang, J. Enrichment-free rapid detection of Phthalates in Chinese liquor with electrochemical impedance spectroscopy. Sensors 2020, 20, 901. [Google Scholar] [CrossRef]
  39. Jiang, X.; Xie, Y.; Wan, D.; Chen, M.; Zheng, F. GUITAR-enhanced facile discrimination of aged Chinese Baijiu using electrochemical impedance spectroscopy. Anal. Chim. Acta 2019, 1059, 36–41. [Google Scholar] [CrossRef] [PubMed]
  40. Sairin, M.A.; Amira, N.; Aziz, S.A.; Sucipto, S.; Rokhani, F.Z. Design of Portable Wireless Impedance Spectroscopy for Sensing Lard as Adulterant in Palm Oil. In IOP Conference Series: Earth and Environmental Science, Proceeding of the International Conference on Green Agro-industry and Bioeconomy, Universitas Brawijaya, East Java, Indonesia, 18–20 September 2018; IOP Publishing: Bristol, UK, 2019; Volume 230, p. 012021. [Google Scholar]
  41. M’Peko, J.C.; Reis DL, S.; De Souza, J.E.; Caires AR, L. Evaluation of the dielectric properties of biodiesel fuels produced from different vegetable oil feedstocks through electrochemical impedance spectroscopy. Int. J. Hydrogen Energy 2013, 38, 9355–9359. [Google Scholar] [CrossRef]
  42. Yu, Y.; Shi, G.; Hu, J.; Yuan, S.H. Detection method of waste oil based on impedance spectrum eigenvalue database. Cereals Oils Food Sci. Technol. 2013, 21, 79–82. [Google Scholar]
  43. Ulloa, P.A.; Guerra, R.; Cavaco, A.M.; Costa, A.M.R.; Figueira, A.C.; Brigas, A.F. Determination of the botanical origin of honey by sensor fusion of impedance e-tongue and optical spectroscopy. Comput. Electron. Agric. 2013, 94, 1–11. [Google Scholar] [CrossRef]
  44. Das, C.; Chakraborty, S.; Acharya, K.; Bera, N.K.; Chattopadhyay, D.; Karmakar, A.; Chattopadhyay, S. FT-MIR supported Electrical Impedance Spectroscopy based study of sugar adulterated honeys from different floral origin. Talanta 2017, 171, 327–334. [Google Scholar] [CrossRef]
  45. Scandurra, G.; Tripodi, G.; Verzera, A. Impedance spectroscopy for rapid determination of honey floral origin. J. Food Eng. 2013, 119, 738–743. [Google Scholar] [CrossRef]
  46. Soares, C.; Machado JA, T.; Lopes, A.M.; Vieira, E.; Delerue-Matos, C. Electrochemical impedance spectroscopy characterization of beverages. Food Chem. 2020, 302, 125345. [Google Scholar] [CrossRef]
  47. Li, X.; Toyoda, K.; Ihara, I. Coagulation process of soymilk characterized by electrical impedance spectroscopy. J. Food Eng. 2011, 105, 563–568. [Google Scholar] [CrossRef]
  48. Lopes, A.M.; Machado, J.A.; Ramalho, E.; Silva, V. Milk characterization using electrical impedance spectroscopy and fractional models. Food Anal. Methods 2018, 11, 901–912. [Google Scholar] [CrossRef]
  49. Masot, R.; Alcañiz, M.; Fuentes, A.; Schmidt, F.C.; Barat, J.M.; Gil, L.; Diana, B.; Martínez-Máñez, R.; Soto, J. Design of a low-cost nondestructive system for punctual measurements of salt levels in food products using impedance spectroscopy. Sens. Actuators A Phys. 2010, 158, 217–223. [Google Scholar] [CrossRef]
  50. Grossi, M.; Parolin, C.; Vitali, B.; Riccò, B. Electrical Impedance Spectroscopy (EIS) characterization of saline solutions with a low-cost portable measurement system. Eng. Sci. Technol. Int. J. 2019, 22, 102–108. [Google Scholar] [CrossRef]
  51. Caicedo-Eraso, J.C.; Díaz-Arango, F.O.; Osorio-Alturo, A. Electrical impedance spectroscopy applied to quality control in the food industry. Cienc. Tecnol. Agropecu. 2020, 21, 100–119. [Google Scholar]
  52. Guermazi, M.; Fendri, A.; Kanoun, O.; Derbel, N. Potential of impedance spectroscopy for real-time assessing of food quality. IEEE Instrum. Meas. Mag. 2018, 21, 44–48. [Google Scholar] [CrossRef]
  53. Dean, D.A.; Ramanathan, T.; Machado, D.; Sundararajan, R. Electrical impedance spectroscopy study of biological tissues. J. Electrost. 2008, 66, 165–177. [Google Scholar] [CrossRef] [PubMed]
  54. Hayden, R.I.; Moyse, C.A.; Calder, F.W.; Crawford, D.P.; Fensom, D.S. Electrical impedance studies on potato and alfalfa tissue. J. Exp. Bot. 1969, 20, 177–200. [Google Scholar] [CrossRef]
  55. Vozáry, E.; Paine, D.H.; Kwiatkowski, J.; Taylor, A.G. Prediction of soybean and snap bean seed germinability by electrical impedance spectroscopy. Seed Sci. Technol. 2007, 35, 48–64. [Google Scholar] [CrossRef]
  56. Jócsák, I.; Végvári, G.; Vozáry, E. Electrical impedance measurement on plants: A review with some insights to other fields. Theor. Exp. Plant Physiol. 2019, 31, 359–375. [Google Scholar] [CrossRef]
  57. Bera, T.K.; Nagaraju, J.; Lubineau, G. Electrical impedance spectroscopy (EIS)-based evaluation of biological tissue phantoms to study multifrequency electrical impedance tomography (Mf-EIT) systems. J. Vis. 2016, 19, 691–713. [Google Scholar] [CrossRef]
  58. Fu, B.; Freeborn, T.J. Biceps tissue bioimpedance changes from isotonic exercise-induced fatigue at different intensities. Biomed. Phys. Eng. Express 2018, 4, 025037. [Google Scholar] [CrossRef]
  59. Maundy, B.J.; Elwakil, A.S.; Allagui, A. Extracting the parameters of the single-dispersion Cole bioimpedance model using a magnitude-only method. Comput. Electron. Agric. 2015, 119, 153–157. [Google Scholar] [CrossRef]
Figure 1. Conductive pathways of high-frequency and low-frequency currents in biological tissues.
Agriculture 12 01525 g001
Figure 2. Bioelectrical impedance equivalent circuit model.
Agriculture 12 01525 g002
Figure 3. Cole–Cole trace diagram (reprinted from ref. [28]).
Agriculture 12 01525 g003
Figure 4. Rice seed impedance spectroscopy measurement experimental platform (longitudinal length c, maximum cross-sectional minor xis a, and major axis b) (reprinted from Ref. [1]).
Agriculture 12 01525 g004
Figure 5. Electrical impedance spectroscopy of seeds with different vigor (reprinted from Ref. [1]).
Agriculture 12 01525 g005
Figure 6. Electrical impedance measurement diagram [11]: (a) two-electrode impedance measurement method; (b) four-electrode impedance measurement method; (c) schematic diagram of onion moisture EIS measurement; (d) electrical impedance spectroscopy measurement experimental system (reprinted from Ref. [11]).
Agriculture 12 01525 g006
Figure 7. (a) Measurement setting; (b) schematic diagram of quadrupole electrode (reprinted from Ref. [20]).
Agriculture 12 01525 g007
Figure 8. (a) Beef tenderloin (quality class 1+), (b) beef tenderloin (quality class 1), (c) beef round (quality class 1+) and (d) beef round (quality class 1) EIS (reprinted from Ref. [20]).
Agriculture 12 01525 g008
Figure 9. Basic strategy of electrochemical impedance detection of PAEs in liquor (reprinted from Ref. [38]).
Agriculture 12 01525 g009
Figure 10. (a,b) Comparison of EIS responses of glassy carbon electrode and graphene electrode; (c,d) display after deconvolution processing, respectively, (reprinted from Ref. [38]).
Agriculture 12 01525 g010
Publisher’s Note: MDPI stays neutral with regard to jurisdictional claims in published maps and institutional affiliations.

