
Technical Efficiency Analysis of Layer and Broiler Poultry Farmers in Pakistan
by
 , ,
, ,
Nisar Ahmed Khan
1,*,
Majid Ali
2,
Nihal Ahmad
3,
Muhammad Ali Abid
4 and
Sigrid Kusch-Brandt
5,6,* 1
School of Economics and Management, Beijing University of Technology, Beijing 100081, China
2
Department of Economics and Agi-Economics, PMAS-Arid Agriculture University, Rawalpindi 46000, Pakistan
3
School of Economics and Management, Northwest Agricultural & Forestry University, Xi’an 712100, China
4
Department of Artificial Intelligence, University of Agriculture Dera Ismail Khan, Dera Ismail Khan 29120, Pakistan
5
Faculty of Mathematics, Natural Sciences and Management, University of Applied Sciences Ulm, 89075 Ulm, Germany
6
Water and Environmental Engineering Group, University of Southampton, Southampton SO16 7QF, UK
*
Authors to whom correspondence should be addressed.
Agriculture 2022, 12(10), 1742; https://0-doi-org.brum.beds.ac.uk/10.3390/agriculture12101742
Submission received: 16 September 2022
/
Revised: 18 October 2022
/
Accepted: 19 October 2022
/
Published: 21 October 2022
(This article belongs to the Special Issue Optimization of Resource Use for Productivity, Efficiency, and Sustainability in Agriculture)
Abstract
:Achieving high production with limited resources is a major challenge faced by poultry farmers in countries with developing economies, such as Pakistan. Optimization of the technical efficiency (TE) of poultry business operations is a promising strategy. A representative sample of 210 poultry farms in the province of Punjab in Pakistan was analyzed for TE. The studied sample comprised 105 layer chicken farms (battery cage system, egg production) and 105 broiler chicken farms (environmental control shed system, meat production). A Cobb–Douglas stochastic frontier production analysis approach with the inefficiency effect model was used to simultaneously estimate TE levels and identify factors that influence efficiency. The results indicated that flock size, labor, feed, and water consumption are positively related to egg production, whereas vaccination was found to be insignificant. For broiler businesses, flock size, feed, and water consumption were positively related to the output, whereas labor and vaccination were found to be insignificant. The results of the TE inefficiency effect model revealed that farmer age, education, experience, access to credit, and access to extension services all had a significant and positive influence on the technical efficiency of both layer and broiler farmers. The estimated mean TE level of layer and broiler poultry farmers was 89% and 92%, respectively, evaluated against the benchmark of the identified frontier of efficient production with prevailing systems. The study concludes that it is possible to increase egg production by 11% and meat production by 8% by making more efficient use of the available resources and technology. To improve poultry farmers’ efficiency, policy interventions should focus more on the pronounced effects of variables such as education, farmer experience, credit access, and extension services.
1. Introduction
Rearing chickens has been a widespread human activity for thousands of years. The historical timeline of chicken domestication is still a controversial subject of research efforts [1,2], but archaeological data suggest that chickens as companions of humans were present on farms in Southeast Asia and China at least 8000 years ago, and then migrated to Western Europe and other parts of the world via land and sea [3,4,5]. Today, chickens are the most numerous domesticated animal population worldwide, with a ubiquitous occurrence [2], and thus poultry farms are common agricultural businesses. The expression “poultry” generally refers to domesticated birds kept by humans for the purpose of obtaining products such as eggs, meat, or feathers, which include chickens, turkeys, ducks, or other species. Chickens account for over 90% of the world’s poultry population and thus are the essential poultry species anywhere. Therefore, the term “poultry” is frequently used as a synonym for chickens [6].
Many different businesses are involved in the raising of chickens, including those that produce eggs (layer chicken), meat (broiler chicken), and breeding stock (pullet chicken). Large numbers of people across different societies are supported financially and professionally by these pursuits [7]; especially in poorer countries this sector is essential to alleviate poverty, including through revenue generation for small farmers [8,9]. Furthermore, the poultry sector is vital to ensure food security and public health [10]. Eggs, which contain over 40 proteins, including bactericidal, strong antigenic, and antihypertensive proteins, are becoming acknowledged as a particularly valuable meal with the same biological value as breast milk [11,12]. Eggs also contain 18 different amino acids, 9 of which are required for life [13,14]. While excessive meat consumption is associated with health risks [15], meat has been classified as a favorable component of a person’s daily diet due to its high protein content and ability to ensure micronutrient adequacy for consumers especially in countries with economies under development, with poultry farming being the primary industry in this regard [16,17]. International hen egg production has increased by around 25% in the last decade, reaching nearly 77 million metric tons in 2018 [18], with the demand for animal protein expected to rise further in the future. China produces more than one-third of the world’s eggs (about 34.7% in 2018), while other major egg producers are the United States (6.5 million metric tons in 2018) and India (5.2 million metric tons in 2018); these top three countries account for half of the global egg production (49.9% in 2018) [18]. The United States is the world’s largest poultry meat producer, with 17 percent of global output, followed by China and Brazil [18].
In Pakistan, poultry is one of the largest and most vibrant sectors, contributing significantly and with an increasing tendency to the country’s Gross Domestic Product (GDP) (around 1.5 percent) [19,20,21]. Poultry is the second-largest segment of the national economy, after textiles, with a dynamic pattern of development. This sector is predicted to generate 1.5 million new jobs within the next few years. Pakistan produces on average 48.83 million layers, 1.02 billion broilers, and 11.8 million breeding stocks yearly, making it the world’s 11th largest chicken producer [21]. The poultry business in Pakistan currently (2022 data) produces 11,250 million table eggs and 1245 million kilos of chicken meat each year [22]. Further growth is expected; over Rs. 700 billion is currently invested in the poultry business [22]. According to the Pakistan Economic Survey for the year 2018, commercial layer, breeder, and broiler stocks all showed considerable expected yearly growth, namely 7.0 percent, 5.0 percent, and 10 percent, respectively [21]. The national poultry product consumption market is far from reaching saturation. Poultry meat accounts for 40 to 45 percent of total meat consumption in Pakistan [23]. Per capita, 67 eggs and 6.61 kg of poultry meat were consumed in 2014; this annual consumption is far less than the World Health Organization’s requirements of 255 to 300 eggs and 27 kg of meat [17,23]. This implies that the lack of animal protein intake could be attributable to a scarcity of animal protein-providing products available to consumers. This further suggests that demand for poultry products is significantly greater than what local producers can currently supply, which explains the vibrant development in the poultry sector in Pakistan, including the expected considerable growth in the demand for poultry products. This calls for very urgent attention to be devoted to the productivity and efficiency of the sector.
To increase poultry productivity, a holistic strategy is required that considers technical advancement and possible measures to increase production efficiency, while at the same time strengthening institutional and market-related aspects. Lessons from research and development initiatives, however, show that for economically less mature countries such as Pakistan, it is increased efficiency which should be focused on as being the main engine of productivity growth as well as a key driver of economic and sustainable development; it is an increase in efficiency which may effectively help the underprivileged populations in developing nations [6,24].
One of the most pressing issues in developing-country agriculture is the need to increase production output per input unit. To address this challenge, it is essential to understand how efficiently farmers use their limited resources and the available technologies. If resources are not used efficiently and the underlying factors for this situation have been identified, the output can be raised by using optimal and efficient production adjustment factors. If resources are efficiently used within the existing infrastructure, the output can be increased through innovation and the adoption of advanced input and processing technology [25]. Therefore, production and productivity can be increased in a couple of ways. One approach is to employ more inputs or to improve technology given a certain amount of input. Another approach to boost output is to make farmers more efficient while maintaining the same level of inputs and the same technology. A technically efficient farmer is expected to produce more output than a farmer who is less efficient in production. As a result, this has a positive effect on the farmers’ income, the sustainability of farming, and poverty reduction [26]. This research focused on the second approach of enhancing production efficiency, namely the aim to make farmers more efficient while the level of inputs remains unchanged and the same technology continues to be applied. Most poultry farmers in Pakistan are poor and unaware of the potential of utilizing resources to increase production efficiency. At the same time, increasing chicken production efficiency is of utmost significance if optimality is to be reached under economic and sustainability criteria. For the government and chicken farmers to design and implement the appropriate policies, the producers must be able to recognize the elements that impact production efficiency at the farm level.
There is considerable literature available on the technical efficiency of poultry farmers in different regions of the world, although very few studies have been conducted in Pakistan. The documented studies explored technical efficiency of layer and broiler production across different countries, including Thailand [26], China [27,28], Nigeria [29,30,31,32,33], and Ghana [34,35]. All studies found inefficiency among poultry farmers. The existing literature included the production inputs and characteristics as well as institutional factors that affect the technical efficiency of layer and broiler poultry production. The productivity of layer and broiler poultry farms is increased by production inputs such as flock size, feed, and labor [35,36,37]. Water consumption could also increase egg and meat production [32,34,35,38]. For vaccination use, different studies found mixed results. For example, Yenibehit et al. [35] found that vaccination use increases output production, and the results of Nihal et al. [39] showed that vaccination is insignificant in poultry production. In the inefficiency effect model, age, education, and experience positively influence layer and broiler farmers’ technical efficiency [34,35], while institutional factors such as credit access and extension services decrease technical inefficiency [40].
Still, there is a lot of information missing in previous literature. In particular, the current situation in Pakistan is not well studied. For Pakistan, some researchers analyzed the technical efficiency of open-broiler poultry farmers [36,39]. Most studies abroad ignored the rearing housing systems in their analysis, and for Pakistan no previous analysis of this type of system is available. This is an important knowledge gap, as this type of system now plays a very significant role in poultry production in Pakistan. Additionally, there is no single study available on egg production in Pakistan. Some poultry housing systems’ productivity is very high, and some housing systems’ productivity is low with the same use of inputs, and thus it is essential to analyze the currently prevailing systems. In Pakistan, only a few previous studies have been conducted on the technical efficiency of poultry production, and they focused on old systems. The trend of battery cage and environmental control shed systems usage is increasing in Pakistan, but these new types of systems so far lack an analysis of whether they are operated efficiently in practice in the country. To fill this research gap, this study focused explicitly on these new systems (battery cage and environmental control shed systems).
The Punjab province was selected as the area under study because 70 percent of poultry farms in Pakistan are in this region [41]. Punjab, therefore, is the main poultry-farming province in Pakistan. The Punjab province’s chicken farmers should be aware of the critical output drivers among the variety of factor inputs, and they should be offered evidence-based suggestions for raising chicken production efficiency. This is the main step to ensuring profitability of the poultry business, increasing sustainable use of available resources, and improving food security in the country of Pakistan and beyond.
The degree of novelty of this study is very high. Previous studies in Pakistan focused only on Pakistan’s old rearing poultry housing system and analyzed a rather small geographic area. This research covers a large study area and for the first-time analyses the technical efficiency (TE) in the practice of the more recently introduced battery cage and environmental control shed systems. To the best of the authors’ knowledge, there is no research on the TE of the new system of poultry farms (battery cage and environmental control shed). The battery cage system is used for rearing layer birds, and the environmental control shed system is employed for the rearing of broiler chickens.
The current study aimed to estimate the TE level and determine the factors influencing the technical efficiency of layer and broiler poultry farmers in Pakistan. The goal is to inform policymakers, farmers, and stakeholders. This can contribute to the formulation of policies to improve the well-being of people in the country, and it can support farmers in making appropriate decisions to increase the productivity of their businesses. The findings are also interesting for researchers in the area of poultry production.
Stochastic frontier analysis was applied in this research to evaluate the technical efficiency of poultry farmers in Pakistan. Section 2 of this paper explains the methodology used in the current study. In Section 3, the econometric results of the technical efficiency layer and broiler farms are presented, and these are discussed in the fourth section. The conclusions of the current study and recommendations for layer and broiler farmers are provided in the last section.
2. Methodology
2.1. Study Area, Sample Size, and Sampling Technique
The study was conducted in Punjab, a province within Pakistan. This province was primarily chosen because 70% of poultry farms in the country are located here [41]. Punjab is the largest province of Pakistan in terms of population; half of the country’s population lives therein. A multi-sampling technique was used for the current study, and the same technique was employed for both layer and broiler farms. In the first stage, Punjab as the province was chosen to conduct the research, comprising 70% of poultry farms in the country. In the second stage, three divisions within the province were randomly selected (Lahore, Multan, and Rawalpindi). Lahore is the principal capital of Punjab, Multan is the administrative area of south Punjab, and the Rawalpindi division is the main administrative region of Pakistan. In the third stage, four districts were randomly chosen from each division. In the last stage, 105 samples of layer farmers (battery cage system) and 105 broiler farmers (environmental control shed system), a total of 210 samples of farmers, were randomly chosen through the proportional allocation sampling technique according to Cochran [42], as indicated in Equation (1).
where;
ni = n* (Ni/N)
ni = Number of sampled farms in ith district (layer and broiler farms);
n* = Total sample size (layer and broiler farmers);
Ni = Total number of farms in ith district (layer and broiler farms);
N = Total number of farms in the study area (layer and broiler farms).
The data set of this study, therefore, comprises 210 poultry farms, where half of the farms are layer poultry businesses using the battery cage system and half of the farms are broiler poultry businesses employing the environmental control shed system.
2.2. Data Collection
Primary and secondary data were analyzed in this investigation. A well-structured interview schedule with closed and open-ended questions was established to gather primary data from respondents. Primary data can be gathered through various approaches, including observation, interviewing, and mailing. For the purpose of this study, the sampled respondents were personally interviewed at their farms or houses. The questionnaire included farmers’ demographics and other characteristics, institutional aspects, the amount of input used, and the output obtained by the sample farmers during the 2020/2021 production season. Six enumerators were chosen from the study region to collect primary data. Three enumerators collected the data from the layer farmers, and the other three collected the data from the broiler farmers. All enumerators are familiar with the research area, have local farmer acceptance, have data collection experience, and speak the local language. The final questionnaire was completed after necessary modifications; a pre-test was administered prior to usage in order to ensure the gathering of sufficiently detailed and more precise data. Secondary data were gathered from various government and official sources, including the Punjab Poultry Research Institute Rawalpindi (PPRI), the government of Pakistan (GOP), and the Pakistan Economic Survey.
2.3. Assessment of Technical Inefficiency (TE)
2.3.1. Conceptual Basis
According to Farrell [43], farm efficiency is defined as a farm’s ability to provide the best possible output by using the provided inputs. Farrell [43] concluded that there are two sorts of efficiency: technical and allocative. When the frontier production function is used as a benchmark of achievable efficiency, this allows for greater allocative and technical efficiency in the production process, consequently also resulting in an increased economic efficiency. There are two methods for measuring technical efficiency (TE): the Data Envelopment Analysis (DEA) method and the Stochastic Frontier Analysis (SFA) method. The nonparametric DEA test is based on linear programming and is error term-sensitive; it quantifies error from a maximum as inefficiency and is deterministic. The second strategy (SFA) evaluates the stochastic error in the data set using statistical and parametric analysis. Different researchers have used different methods to measure technical efficiency of poultry production. Phonpawi et al. [26], Zhu and Qin [27], and Myeki et al. [44] used DEA to estimate technical efficiency of poultry farms. However, in developing economies most studies related to poultry production have used the stochastic frontier technique to measure technical efficiency of poultry farms; this acknowledges that in developing economies there is inconsistency in the field of agriculture [28,29,30,31,34,35,36,39]. The basic DEA’s deterministic nature is commonly highlighted as its fundamental drawback since it fails to account for stochastic noise in data, which might possibly influence the projected efficiency scores. The DEA is also less resistant to outliers and severe values, and it lacks economic interpretation criteria. Due to the fluctuation of poultry production, most studies have used SFA to measure the efficiency of poultry production in developing economies. The particular inefficiency and inherent mistakes of farms or farmers are used to measure all deviations from the frontier. The SFA approach was used in this research to estimate the technical efficiency of chicken farms since stochastic frontier analysis is based on econometric techniques and more complex hypotheses may be evaluated with this method. In its implementation, the stochastic frontier technique enables the estimation of a frontier function that concurrently considers the random error and inefficiency elements unique to each farmer. Several scholars, including Meeusen and van den Broeck [45] and Aigner et al. [46], pioneered the stochastic frontier method, which disrupted the common idea that deviations from the production frontier are necessarily caused by the inefficiency of the producing units and instead postulates that external factors can also have a relevant impact. As a result, stochastic estimates of technical efficiency contain a measure of random error, and this measure is one component of the generated error element on a stochastic production frontier. This method recognizes that factors outside of the control of the farmers can have an impact on the level of output produced by the farm. This makes it possible to distinguish between production variances from the frontier output caused by firm-specific characteristics and those caused by unexpected external sources [47]. Due to the fluctuation of poultry production caused by climate risks and diseases, the choice is based on flawed data. In addition, because poultry farmers do not have access to detailed up-to-date information on their operations, the decision is based on inaccurate data. When applied to poultry producers, the stochastic frontiers technique estimates a frontier function that considers random error and the inefficiency component particular to this industry. The stochastic production function is given by Equation (2):
where;
Yi = Output (eggs in number and meat in kg);
Xi= Input (quantities);
= Projected parameters;
e= 2.718;
= Effects of exogenous shocks;
= Technical inefficiency effect.
The composite error term comprises two parts, vi and ui. vi is a natural error term that is identically and normally distributed, while ui is a farm or farmer specific error term that is independently and half normally distributed. The two error terms vi and ui are independent of each other. vi data measure the difference between maximum and actual value by accounting for the effect of natural shocks, while ui data capture the farmer-specific inefficiency effects. There are different assumptions about the distribution of ui, such as circulation as half normal and exponential distribution as designated by Aigner et al. [46], or exponential distribution developed by Meeusen and van den Broeck [45], or truncated normal distribution as introduced by Stevenson [48].
A farmer’s technical efficiency (TE) (Equation (3)) is defined as the observed output (Y) ratio to frontier production (Y*) while maintaining identical technological parameters. The maximum likelihood estimation (MLE) was used to quantify the stochastic frontier analysis (SFA). To identify the elements affecting the technical efficiency observed, the following model (Equation (4)) was applied in a single-stage maximum likelihood estimation process, together with a stochastic frontier model using STATA 16 [49] and frontier version 4.1 of the Coelli software [50]:
where;
= Technical inefficiency error term of the ith farmer;
= Farm/farmer-specific inefficiency factors;
= Constant;
= Estimated parameters;
= Error term.
2.3.2. The Empirical Model
For the estimation of technical efficiency, the study used the following Cobb–Douglas (CD) production model (Equation (5)):
where;
Y = Output (number of eggs and meat in kg per production cycle);
= Number of birds (flocks’ size) per production cycle (layer and broiler);
= Labor in man-days per production cycle (layer and broiler);
= Feed intake in kg per production cycle (layer and broiler);
= Water consumption in liter per production cycle (layer and broiler);
= Vaccine used in milliliter per production cycle (layer and broiler);
= Constant;
= Estimated parameters;
= Uncertainty errors;
= Inefficiency effects.
2.3.3. Technical Inefficiency Determination of Layer and Broiler Poultry Farmers
Using the maximum likelihood estimation (MLE) approach, the following technical inefficiency effect model (Equation (6)) is estimated in tandem with the stochastic frontier Cobb-Douglas production model in a single stage:
where;
= Age of the layer and broiler farmer (years);
= Education of layer and broiler farmer (number of years of schooling);
= Farming experience (farmer experience of layer and broiler farming in years);
= Credit (access to credit 1 for yes, 0 for otherwise);
= Extension service (access to extension service 1 for yes,0 for otherwise);
= Constant;
= Projected parameters;
= Model error term.
2.3.4. Layer and Broiler Farmers’ Individual Technical Efficiencies
The following method (Equation (7)) was employed to evaluate the technical efficiency of layer and broiler poultry farmers:
where;
= Technical efficiency of the ith farm;
= Actual production of the ith farm;
= Frontier production of the ith farm.
The following method (Equation (8)) is used for the estimation of individual technical inefficiencies of layer and broiler farmers:
where;
= Technical inefficiency of the ith farm.
3. Results and Discussion
3.1. Descriptive Statistics of the Input and Output Variables Used in the Model
An overview of the input and output variables used in the technical efficiency study by layer and broiler poultry farmers is shown in Table 1 and Table 2. In one production period (studied season 2020/2021), layer and broiler poultry producers supplied an average of 1,545,898.31 eggs and 12,721.29 kg of meat. The typical flock sizes of layer and broiler chicken farms in one production cycle were 5517.02 and 7346.68 birds, respectively (number of birds). On layer and broiler poultry farms, labor investments in terms of man-day averages were 1156.02 and 123.79. On average, the feed intake in layer and broiler poultry farms was 256,009.51 kg and 21,989.77 kg in the study area. The average water consumed by the layer and broiler poultry farms in one production cycle was 471,719.84 L and 79,404.87 L. The mean values of layer and broiler farm vaccination were 61,899.38 milliliters and 26,877.85 milliliters during the production season.
The average age of layer and broiler farmers was 43.46 and 41.45 years, which shows that the farmers in the study area on average are relatively mature, although the recorded age span was very high. The average education values of layer and broiler poultry farmers show that, on average, farmers had completed a middle school education. This means that the data obtained from farmers can be considered more accurate and reliable because farmers in the study area can easily understand and write. The mean experience values of the layer and broiler poultry farmers showed that the farmers were very well experienced in poultry farming. Furthermore, 57 percent of the layer poultry farmers had access to the credit system, and 66 percent of the broiler poultry farmers had received credit during the production period. Sixty-nine percent of layer farmers had received help from the extension services, and fifty-three percent of the broiler poultry farmers had obtained help from the extension services, which is very pronounced.
3.2. Econometric Results
3.2.1. MLE Estimates of the Parameters of Stochastic Production Frontier
Estimation was conducted using a single-stage estimation procedure for both the SFM and the inefficiency model parameters, and employing the STATA version 16 computer program [49]. This allows estimating the frontier production function where the Cobb–Douglas production function characterizes the farmers’ production technology. The model has ten parameters, five of which are associated with the frontier production function’s explanatory variables (factor of production), five with the explanatory variables influencing the level of technical efficiency, and other parameters related to the distribution of random errors (vi and ui). Table 3 and Table 4 give the ML estimates (maximum likelihood estimations) of the parameters of the frontier production functions and inefficiency effects. The entire frontier production function was used to estimate the coefficients of the input variables (MLE).
Four of the five layer poultry farm factors which are taken into account for the evaluation of the production function—flock size, labor, feed, and water—had a substantial impact on explaining the differences in egg production among farmers (Table 3). Variables in the production function had positive coefficients. The coefficients of water, flock size, labor, and feed were statistically significant at a 1% significance level. On the other hand, in broiler production, three input variables (flock size, feed, and water consumption) had a statistically significant effect at a 1% level of significance (Table 4). This suggests that the impact of these variables differs significantly from zero; hence, these variables significantly explain egg and meat production in the study area.
Overall, for layer farms, the estimated egg production results showed that an increase in any of the significant variables in Table 3 (flock size, labor, feed, and water) will increase egg production. Accordingly, for broiler farms, the results of Table 4 show that an increase in flock size, feed, and water consumption will increase meat production of broiler poultry farms.
3.2.2. The Effects of Influencing Factors on Technical Efficiency
The estimated level of technical efficiency among layer and broiler poultry farmers is not enough to derive recommendations for policy intervention. It is also necessary to identify the sources of variation in the technical efficiency estimates among the farmers, and to quantify the effect of different factors based on above result, having the information about the existence of technical inefficiency in the input used and other farm practices. Therefore, determining the nature of the impact of the identified major factors causing the observed inefficiency level was the next most important objective of the study.
Different empirical studies on efficiency of poultry systems showed that the determinants of inefficiency are highly dependent on two main types of factors, namely (1) on characteristics of a farmer, such as demographics (age) [35,36], education [35,51], and experience [35,36,51], and (2) on institutional factors (access to credit and extension services) [35,36,40]. The studies available in literature agree that higher levels of education and experience and easier access to credit and extension services contribute to higher technical efficiency. Therefore, the abovementioned variables were considered as determinants of inefficiency in this research, which can be further evaluated by assuming that another determinant is constant. The coefficients of those socio-economic and institutional variables included in the inefficiency model were estimated simultaneously by the single-stage ML estimation procedure using the estimated level of TE as the dependent variable. According to Coelli [47], in the analysis of the technical inefficiency effects model, the sign of coefficients of the parameters included in the model is to be taken into account.
If the coefficient of the parameter under study in the model is positive, this means that the respective variable is increasing the level of technical inefficiency of the farmer, whereas if the sign of the coefficient of the parameter is negative, this shows that the variable under consideration is decreasing the level of technical inefficiency (or increasing the level of technical efficiency) of farmers. Hence, the coefficients should be read as the effect of each variable (determinant) on the level of inefficiency. However, one can read the determinant of the estimated coefficient directly as the effect of the variable on technical efficiency by taking the opposite sign of respective coefficients for the variable. Thus, the opposite sign of the coefficients of the variable in the model result may be referred to when exploring technical efficiency, which readers should keep in mind while going through this section.
From the variables entered into the inefficiency model of this study, the coefficients of all-independent variables (age, education, experience, access to credit, and extension services) of layer poultry farmers were statistically significant at a 1% significance level. The negative sign of these factors indicates a negative relationship between the factor under study and technical inefficiency, and consequently an increase in the technical efficiency of layer poultry farmers along an increase of the respective factor. On the other hand, for broiler poultry farmers, the coefficients of age, education, experience, access to credit, and extension services in broiler poultry farmers were statistically significant at a 1% level and negative as well. These results showed that all factors (age, education, experience, access to credit, and extension services) positively influenced the technical efficiency of broiler poultry farmers in the study area.
3.2.3. Variance Parameters
One of the essential features of stochastic frontier analysis is that this method takes into account both static noise errors, which arise from measurement errors, and errors that arise from inefficiency components which lead to output variability. From the SFA result, it is also possible to know what proportion of the existing variability in the output can be explained by inefficiency and by noise errors. The value for the parameter gamma (γ), obtained as the ratio of the variance of the inefficiency component to the absolute error term, was calculated using the maximum likelihood estimate of the frontier model. The γ value represents the one-sided error term’s relative variability to the absolute error term. One is related to the farmer’s inefficiency problem, which is under his/her control, and the other is due to the random variation/or usual noise component, which is beyond the farmer’s control. In other words, the degree to which technical inefficiency affects the variability between observed and frontier output is quantified.
As the above Table 3 shows, the calculated value of γ, the relative deviations from the frontier due to inefficiency in input use and other farm practices, equaled 91% for the layer farms. The gamma value of 0.91 indicates that the technical efficiency differences across layer farmers’ operations in Punjab accounted for 91% of the variation in output, with the effect of the disturbance term accounting for the remaining 9%. For broiler farms, the gamma value of 0.94 (Table 4) suggests that 94% of the variation in output was due to the differences in technical efficiencies of broiler farmers in the Punjab province, while the remaining 6% was due to random noise beyond a farmers’ control, such as unfavorable weather conditions, disease, and statistical errors in data measurement and model specification.
3.3. Technical Efficiency of Layer and Broiler Poultry Farmers
One of the main objectives of this study was to measure the technical efficiency levels of layer and broiler poultry farms in the Punjab province in the 2020/2021 production season. The technical efficiencies were estimated from the allowed CD (Cobb–Douglas) production function and the distributional assumptions made about the two error terms vi and ui.
For layer farmers, the study area’s average level of technical efficiency of the farmers was estimated to be 0.89 (Table 5), which corresponds to an efficiency level of 89% against the identified frontier of efficient production with prevailing systems. This indicates that farmers already achieve a decent level of efficiency in the production of eggs, but this efficiency level is still quite far away from the performance that could be expected. The output can realistically be increased on average up to 11 percent by taking examples of more efficient farmers without disseminating any new technologies.
Figure 1 shows that 63% of the layer poultry farmers had technical efficiency scores of 0.79 to 0.90, and 27% of farmers were above the 0.90 efficiency score. Thus, less than one third of the layer farmers reached a technical efficiency level of 90% or higher. This highlights, that most layer poultry farmers in the area under study have a very relevant potential to increase their efficiency level, and there is a strong need to do so.
For broiler farmers, the mean level of TE of the farmers (0.92) showed that technical efficiency is somewhat higher than across the layer poultry businesses, but still not satisfactory. If the average broiler farmers of the sample could achieve the TE level of their most efficient counterpart, then average farmers could increase their output by approximately 8% (Table 6).
Figure 2 indicates that around half of the broiler farmer’s TE scores were below the mean level and half of the farmer’s TE scores were above the mean level of technical efficiency. Interestingly, more than 55% of the broiler poultry farmers had a TE level of 0.9 or higher. Therefore, more than half of the broiler businesses reach 90% or more of the possible technical efficiency as captured by the identified frontier of efficient production with prevailing systems. This is a very promising finding as it illustrates that many of the broiler poultry farms which employ the environmental control shed system operate well-performing systems. In contrast, for layer poultry farmers, less than 30% of the farmers under study reached a TE level of 0.9 or higher, as described above.
4. Discussion
4.1. Influence of the Factors under Study
To understand the full implications of the results, one of the most important requirements is the precise interpretation of the parametric coefficients of the Cobb–Douglas functional form as a partial elasticity of production around the user input. This characteristic makes it possible to predict how changing the amount of each input will affect the output. According to Table 3, the partial elasticity of significant input variables of egg production (layer farms) was 0.21 for flock size, 0.11 for labor, 0.36 for feed, and 0.12 for water; for broiler production, the elasticity of the significant variables was 0.18 for flock size, 0.42 for feed, and 0.16 for water (Table 4). These elasticity values indicate the comparative importance of each variable in egg and broiler poultry farms. Large flock sizes are associated with higher productivity in layer poultry production. Table 3 shows that a one percent increase in flock size was associated with a 0.21 percent increase in layer poultry productivity. For broiler farms, a key influence of the flock size was also disclosed. Table 4 results indicate that a one percent increase in flock size could increase meat production by 0.18 percent, in holding other factors constant. This could be attributed to the fact that larger poultry farms utilize resources more efficiently by applying smaller quantities of resources per unit cost than smaller poultry farms [52]. Previous studies have consistently reported the same finding for the impact of the flock size in layer and broiler production across countries with economies under development [35,36,37,39,51,53]. Most of those studies were conducted in African countries such as Tanzania, Ghana, or Nigeria, while Ullah et al. [36] analyzed broiler farms in a selected province (Khyber Pakhtunkhwa) of Pakistan. Thus, the results of this present study agree with the literature regarding the role of the flock size in poultry farming, and they expand and consolidate the body of knowledge by adding results for both layer poultry farms and broiler poultry farms across Punjab, the central poultry farm province in Pakistan.
The coefficient of labor in Table 3 indicates that a 1% increase in labor man-days could increase egg production by 0.11%. Labor is described as the effort in man-days of laborers needed to complete the work. How many laborers are available is very important to determine the type of activities possible and how intensively the production is; the more intensive the production, the more labor is to be employed [54]. The chicken production operation is considered to be labor-intensive. Poultry farmers usually hire laborers, and with the family, they spend most of their own time on the farm; more laborers are hired when production expands. Labor is an essential factor in chicken production and covers a wide variety of activities. The work (labor) at a chicken farm includes: preparing for the arrival of birds, litter management, feed and water distribution to the birds, administering the vaccine to the birds, and frequent supervision of birds to ensure their good condition. Other activities include removing the dead birds from the flock, lighting management, and picking and arranging eggs from the poultry house. In addition, slaughtering, processing of intermediate and final products, and packaging for the cold room are performed. These and other activities are required for the success of the chicken business [55]. Consistently, previous studies have reported the same observations for labor in layer poultry farms across countries with economies under development [35,37,56], and thus agree with the results of this study for the layer poultry farms in Pakistan. For broiler farms, the estimated labor results in broiler production were statistically insignificant because the environmental control shed is capital intensive and consists of a self-control system, while at the same time the labor requirement is low for such systems. Thus, labor is less relevant for broiler farms in Pakistan.
The results further showed that feed is an essential efficiency factor in egg and broiler meat production. If a farmer increases feed by 1%, egg production will increase by 0.36% (Table 3). Even more pronounced is the effect in broiler systems; feed-in broiler production’s magnitude shows that a 1% increase in feed will increase meat production by 0.42% (Table 4), assuming all other factors remain constant. Previously, most studies found that feed directly affects egg and meat production; this was consistently reported for poultry businesses across countries with economies under development [36,37,56,57]. Iyiola-Tunji [58] conducted detailed studies to confirm that chicken feed is a significant factor in chicken production. It was described as a component of several nutrients essential to make chicken grow faster and healthier and produce quality meat, quality eggs, and good feathers. Nutritious feed is a prerequisite in chicken production; therefore, reliable availability of the feed through value chains accessible to the local poultry farmers is very important. Nutritional deficiency is the lack of vitamins, minerals, and amino acids in the accurate estimation required. The breakthrough and success of the chicken business depend on the feed’s efficiency. Feed must be of good quality with a high protein content that can impact the chicken’s growth and development [59]. Therefore, the results of this study are generally in line with literature and complement the existing body of knowledge by adding observations from the specific situation of layer and broiler farms in Pakistan.
Water has long been recognized as one of the most critical resources in poultry production. Water consumption makes an excellent litmus test for a flock’s overall health condition [60,61]. Decreased water consumption can indicate health problems and productivity problems [62]. Water consumption increases productivity and the quality of egg and meat production. The estimated coefficient of water consumption indicates that a 1%increase in water consumption could increase egg production by 0.12 percent. In comparison, a 1% increase in water consumption in broiler farms could induce an increase of 0.16% in meat production. Similar results for water consumption were also found in previous research works [32,35,38]; thus, this current study is in line with earlier observations, and it amends the existing knowledge by adding data for the situation Pakistan in particular. The vaccination results of broiler and layer poultry farms were statistically insignificant because the exact, pre-defined quantities and qualities of vaccination were used in the poultry farms’ operations. The same result for vaccination in layer and broiler was reported by Saliu et al. [63] and Nihal et al. [39], while Yenibehit et al. [35] described some impact of vaccination on production output. This study’s results therefore strengthen the evidence available in literature with the view of an insignificant impact of vaccination on the efficiency of the poultry business.
The inefficiency effect model results listed in Table 3 and Table 4 show that all factors (age, education, experience, credit, and extension services) were significant at a 1% significance level and positively improved the technical efficiency of farmers raising layers and broilers. Interestingly, age was found to affect the technical efficiency of layer and broiler poultry production positively and significantly at a 1% significance level. This suggests that older farmers were more efficient than their young counterparts. Age could serve as a proxy variable of farming experience, so farmers with more years of experience are expected to be more efficient [35,36,57]. The outcomes clearly show that the more efficient farmers had more expertise in raising layer and broiler chickens than the less effective ones. Because more extraordinary agricultural experience is supposed to boost knowledge of diverse farm activities, this was anticipated. Given the state of technology, farmers who have remained in the business for a long time have figured out how to combine scarce resources, thus enhancing efficiency. They might also know specific details or solutions about chicken production which their competitors do not. Such knowledge ranges from disease control mechanisms to new technology and market opportunities. Previous studies, which were conducted in different countries, have also reported a positive relationship between farm experience and technical efficiency [28,36,64,65,66]; this research highlights that for Pakistan, similarly to other countries, experience of the farmer is a key impact factor on poultry production efficiency.
Education equips farm households with the necessary knowledge of how to allocate their scarce resources appropriately by increasing the adoption of advanced solutions and spreading technological innovations that shift their production frontier outward. Compared with their counterparts with lower education levels, educated farmers have a stronger desire to obtain information and to use it. Thus, this variable is influential in determining the technical efficiency variation among poultry farmers since it increases farmers’ decisions to adopt productivity-enhancing practices and technologies. According to the findings, chicken producers with more years of formal education were clearly more productive than their less-educated colleagues (Table 3 and Table 4). As anticipated, these results confirm that education considerably and negatively influences the technical inefficiency effect of egg and meat production (at a 1% level of statistical significance). This is a warning symbol because it suggests that highly educated poultry producers are more efficient at producing chickens than less educated ones, which is in line with earlier conclusions [28,33,64,67].
The coefficient of credit availability had a statistically significant impact on technical inefficiency (at a 1% significance level) and is consistent with the previously projected negative sign, which reflects a negative correlation between credit availability and technical inefficiency. This adverse indication demonstrates that credit beneficiaries are more productive than non-recipients (Table 3 and Table 4). This suggests that access to financing plays a substantial role in boosting layer and broiler producers’ productivity in the area under study. These results explain that a sample farmer might increase technical efficiency of his/her business by overcoming financial liquidity limitations (thanks to borrowing). Having access to financing guarantees the timely purchase and usage of the desired poultry business inputs. This highlights that increasing technical efficiency can strongly benefit from the availability of funding. By improving access to financial resources, technically inefficient sample farmers can become more effective in the short term. Using production credit on the farm can be anticipated to increase output levels. Access to credit is, therefore, very likely to increase technical efficiency. The previous literature has reported that access to credit increases the technical efficiency of broiler farmers in Pakistan [36] and of layer of broiler farmers in Nigeria [57,63] and China [68]. This present research consolidates the existing knowledge in this field and confirms that, for the situation in Pakistan, access to financial resources is a key factor to increase the efficiency levels of both layer and broiler farm businesses.
The coefficient of extension contact in this study was positive as expected (and significant at the 1% significance level), suggesting that extension service increases farmers’ technical efficiency. This can be explained by the fact that through extension services farmers can use modern techniques of poultry production activity. The extension service is more critical for modern agricultural input mobilization, input use, and disease control, enabling the farmers to reduce technical inefficiency. For several economically developing countries in Africa, it has been found in previous reports that extension services increased the farmers’ technical efficiency [35,56,69], while this present study captured this effect for the poultry sector in Pakistan.
4.2. Discussion of the Overall Technical Efficiency of Layer and Broiler Poultry Farmers
Overall, for the layer poultry farmers, the estimated results showed that for the data set under study, the layer farmers’ mean technical efficiency level was 89%when evaluated against the identified frontier of efficient production with prevailing systems. This provides a measure of the shortfall of observed output from the maximum feasible output, and it suggests that a serious shortfall exists across layer poultry farms in the country. This closes an important research and knowledge gap for the poultry sector in Pakistan. The efficiency of layer farmers which were considered in this research ranged from the least efficient level of 79% to the most efficient level of 99%, which is only 1% off the frontier (100%), with a standard error of 0.057 (Table 5). The differences in managerial choices and farm factors that may impact the producer’s capacity to use the available technology efficiently are likely what caused this discrepancy in the technical efficiency of layer farmers. As a main result, this study clearly shows that many of the layer farmers who participated in egg production during the 2020/2021 season were not efficient enough. On average, 11%of the potentially achievable egg output was lost due to the inefficiency of farmers, and for some farms more than 20% of the potential output remained untapped.
For broiler poultry farmers, high losses were also found, although the average level of technical efficiency (92%when evaluated against the identified frontier of efficient production with prevailing systems) was higher compared with layer poultry farms. The results of the efficiency level of broiler farmers (92% technical efficiency) indicate that farmers in Pakistan are not sufficiently efficient in producing meat. According to the results of this study, meat production can be increased on average by up to 8%without disseminating any new technologies, by taking examples of more efficiently performing farmers. Accordingly, this finding indicates to the farmers that there is a possibility of minimizing the input level by up to 8%without affecting their current output level (Table 6).
4.3. Limitations of This Study and Further Research Needs
This research work concentrated on the agricultural sub-sector of poultry production, which is one of the most essential agricultural areas for Pakistan with a view to economic development and food security. The results close important knowledge gaps regarding the technical efficiency of layer and broiler poultry farmers which are active in the country. Nevertheless, this study has some limitations, which calls for further research.
Poultry farms (layer and broiler) may be found in every province of Pakistan, while this current study focused explicitly on one province only, namely the Punjab province, where nearly three quarters of the poultry farms of the country are located. The characteristics of poultry producers’ technical efficiency in different parts of Pakistan may be different from the situation across the Punjab province. This merits further research, and such research could also include poultry production in neighboring countries in order to obtain a more complete picture.
The determined maximum efficiency score of the frontier technique was based on considering the top businesses in the sample; thus, the research’s efficiency rankings were relative to the best poultry farmer in the study area. Inclusion of other firms (for example, poultry businesses from abroad or other efficient enterprises in other regions of the country) may have altered (may have reduced, in particular) the technical efficiency ratings. If more efficient poultry farmers from other locations were involved in a study with a broader scope, the efficiency scores for the poultry farms under study might be lower. Thus, for the Punjab province and for Pakistan, there might exist additional potential to increase the efficiency levels of prevailing technologies in practice. Whether farms exist in other regions of Pakistan or abroad, where the efficiency levels of the studied poultry systems are higher than the best-performing operations included in this work, cannot be answered by this current study. This should be addressed by future research.
The current study analyzed the technical efficiency of poultry farmers (layer and broiler poultry farmers), but business profit and economic efficiency were not calculated. Without a detailed analysis of the economic efficiency in poultry production, it is difficult to know the level of technical efficiency at which farmers may make the most profit. A farmer’s individual business profit, however, is one of the most important factors with view to aiming for an increased production output in order to support food security in the country. Future studies should look at the economic implications of poultry businesses at farm level, including the effect of the poultry farmers’ financial expenses for required inputs and the effect of different business models or marketing strategies.
Another limitation of this current study is that changes of the efficiency level over time could not be identified by the methodology applied. This research employed cross-sectional data. This does not allow conclusions on how the operations of the poultry farms have changed over time.
5. Conclusions and Recommendations
Improvements in agricultural production performance and sustainable growth may be achieved through two methods: either through the introduction of new agricultural production equipment or by enhancing farmers’ technical efficiency levels, both of which are feasible options for increasing productivity in the country’s agricultural sector. Technical efficiency has remained a prominent topic of research, especially in underdeveloped economies where the majority of farmers are resource-poor. Given the current state of technology, improving the farmer’s technical efficiency plays an important role in enhancing the output and sustainability of farming. This study’s main goal was to estimate the TE (technical efficiency) level of layer and broiler poultry farmers in Punjab, Pakistan, and to identify the factors that influence the TE. The findings of the study can inform different policymakers and stakeholders in order to pave the way towards a more efficient poultry sector in Pakistan:
- (i)
- The government of Pakistan could use the research findings as a guide for policy formulation and implementation to improve the socio-economic well-being of the people in the country.
- (ii)
- The information of this study will also help poultry farmers to make appropriate decisions in order to increase the production of their farm business.
- (iii)
- The results could guide new poultry farmers who aim to adopt a system of production that is not only commercially viable due to a high output but also reaches an improved technical efficiency, thus making better use of each unit of input.
- (iv)
- The research findings will be helpful to future researchers who might want to conduct further research on the same or related topics.
- (v)
- The research findings can be good reading material for the general public, and especially for all those who are interested in increasing TE in the poultry production business.
The study used a stochastic frontier model and employed the cross-sectional data of the 2020/2021 production period covering randomly sampled 210 layers and broiler poultry farmers in Punjab, Pakistan (105 layer poultry farms, 105 broiler poultry farms). The parameters of the stochastic frontier function (from which efficiency scores must be assessed) and the inefficiency impacts model were considered and computed using maximum likelihood methods in a single stage of estimation. Production frontier was estimated by integrating relevant input variables like flock size, labor, feed, water, and vaccination use. Coefficients of the input variables are interpreted as the output elasticity concerning each input variable.
The estimated input effects of the layer poultry farms showed that flock size, labor, feed, and water consumption were significant at a 1% level of statistical significance, whereas vaccination use was insignificant. Coefficients of significant maximum likelihood estimates showed that a 1% increase in units of flock size, labor man-days, feed, and water consumption would increase the output of egg production by 0.21%, 0.11%, 0.36%, and 0.12%, respectively, in the study area as a whole. For the broiler poultry farms, the input evaluation results indicated that flock size, feed, and water consumption had significance for meat production at 1% level of statistical significance. In contrast, the effect of labor and vaccination was insignificant on broiler production. The magnitude of broiler farm’s input variables discloses that when farmers achieve a 1% increase in inputs of flock size, feed, and water consumption, the output would increase by 0.18%, 0.42%, and 0.16%, respectively.
The results of the technical inefficiency effect model applied to both layer and broiler poultry farms showed that all the examined variables (age, education, experience, access to credit, and access to extension services) positively influenced the technical efficiency of farmers. When evaluated against the identified frontier of efficient production with prevailing systems, the average efficiency level of layer farmers in the study was 0.89%, which is far too low to be satisfactory. Thus, a main conclusion that can be drawn from the results of this study is that egg production can be increased by 11%through better use of available resources in the area under study and without changing the technologies and infrastructures as such. Considerable optimization potential also exists for the broiler poultry farms. The minimum and maximum technical efficiency levels among broiler farmers were 81%and 99%, respectively, with an average level of 92%. This suggests that, if proper reallocation of crucial input measures is given sufficient attention, the average output might be increased by 8% compared with the current level.
According to the findings of this study, several recommendations can be formulated which should be addressed by the government or other relevant organizations:
- (a)
- The study findings revealed that education of farmers, measured in years of schooling, affects the technical efficiency of poultry farmers. This indicates that education is essential in improving technical efficiency, and thereby the sample farmers’ performance. Hence, the government should design and strengthen appropriate policies to provide adequate and effective essential educational opportunities to poultry farmers and their families.
- (b)
- In poultry farmers, practical experience has a beneficial and considerable impact on technical efficiency. Therefore, farmers should be trained for a longer time and in detail. To achieve this, the previously built farmers’ training centers and agriculture research demonstration facilities can be used and should be strengthened, in particular by enhancing the practical training they provide and by acknowledging the role of such training to ensure the application of the highest standards on poultry farms in practice.
- (c)
- Younger farmers are less technically efficient than more mature farmers. Therefore, younger farmers, in particular, must receive ongoing training in the agricultural business context and a follow-up during agricultural operations.
- (d)
- Credit access enables farmers to reliably acquire inputs they otherwise could not afford, thus increasing agricultural production and productivity. Hence, the government should establish and expand the service given by credit-providing institutions such as microfinance institutions and agricultural cooperatives.
- (e)
- Although considerable further optimization potential exists, the study’s findings showed that the poultry’s technical efficiency is relatively high in the area under study. The battery cage and environmental control shed system is a suitable choice to ensure high production and well-performing poultry businesses. Therefore, the current study recommends that the government and other related actors encourage farmers to adopt this type of method (battery cage and environmental control shed) to enhance poultry production.
Author Contributions
Conceptualization, N.A.K. and M.A.; methodology, N.A.K. and N.A.; software, M.A.A.; validation, S.K.-B. and N.A.K.; formal analysis, N.A.K.; investigation, N.A.K.; resources, S.K.-B.; data curation, N.A.K.; writing—original draft preparation, N.A.K., M.A. and S.K.-B.; writing—review and editing, N.A.K. and S.K.-B.; visualization, N.A.K.; supervision, S.K.-B.; project administration, N.A.K. All authors have read and agreed to the published version of the manuscript.
Funding
This research received no external funding.
Institutional Review Board Statement
Not applicable.
Informed Consent Statement
Not applicable.
Data Availability Statement
All the data are available in the main manuscript.
Conflicts of Interest
The authors declare no conflict of interest.
References
- Huang, X.-H.; Wu, Y.-J.; Miao, Y.-W.; Peng, M.-S.; Chen, X.; He, D.-L.; Suwannapoom, C.; Du, B.-W.; Li, X.-Y.; Weng, Z.-X.; et al. Was chicken domesticated in northern China? New evidence from mitochondrial genomes. Sci. Bull. 2018, 63, 743–746. [Google Scholar] [CrossRef] [Green Version]
- Peters, J.; Lebrasseur, O.; Irving-Pease, E.K.; Paxinos, P.D.; Best, J.; Smallman, R.; Callou, C.; Gardeisen, A.; Trixl, S.; Frantz, L.; et al. The biocultural origins and dispersal of domestic chickens. Proc. Natl. Acad. Sci. USA 2022, 119, e21219781196. [Google Scholar] [CrossRef] [PubMed]
- Lawal, R.A.; Martin, S.H.; Vanmechelen, K.; Vereijken, A.; Silva, P.; Al-Atiyat, R.M.; Aljumaah, R.S.; Mwacharo, J.M.; Wu, D.D.; Zhang, Y.P.; et al. The wild species genome ancestry of domestic chickens. BMC Biol. 2020, 18, 13. [Google Scholar] [CrossRef] [PubMed] [Green Version]
- West, B.; Zhou, B.X. Did chickens go North? New evidence for domestication. J. Archaeolog. Sci. 1988, 15, 515–533. [Google Scholar]
- Alders, R.G. Poultry for Profit and Pleasure; Food and Agriculture Organization of the United Nations: Rome, Italy, 2004. [Google Scholar]
- FAO. Decision Tools for Family Poultry Development; FAO Animal Pro-duction and Health Guidelines No. 16; Food and Agriculture Organization of the United Nations: Rome, Italy, 2014. [Google Scholar]
- Tijjani, H.; Tijani, B.A.; Tijjani, N.A.; Sadiq, M.A. Economic analysis of poultry egg production in Maiduguri and environs of Borno State Nigeria. Sch. J. Agric. Sci. 2012, 2, 319–323. [Google Scholar]
- Khanal, P.; Dhakal, R.; Khanal, T.; Pandey, D.; Devkota, N.R.; Nielsen, M.O. Sustainable livestock production in Nepal: A focus on animal nutrition strategies. Agriculture 2022, 12, 679. [Google Scholar] [CrossRef]
- Attia, Y.A.; Rahman, M.T.; Hossain, M.J.; Basiouni, S.; Khafaga, A.F.; Shehata, A.A.; Hafez, H.M. Poultry production and sustainability in developing countries under the COVID-19 crisis: Lessons learned. Animals 2022, 12, 644. [Google Scholar] [CrossRef]
- Pius, L.O.; Strausz, P.; Kusza, S. Overview of poultry management as a key factor for solving food and nutritional security with a special focus on chicken breeding in East African countries. Biology 2021, 10, 810. [Google Scholar] [CrossRef]
- Réhault-Godbert, S.; Guyot, N.; Nys, Y. The golden egg: Nutritional value, bioactivities, and emerging benefits for human health. Nutrients 2019, 11, 684. [Google Scholar] [CrossRef] [Green Version]
- Iannotti, L.L.; Lutter, C.K.; Bunn, D.A.; Stewart, C.P. Eggs: The uncracked potential for improving maternal and young child nutrition among the world’s poor. Nutr. Rev. 2014, 72, 355–368. [Google Scholar] [CrossRef] [Green Version]
- Rakonjac, S.; Bogosavljević-Bošković, S.; Pavlovski, Z.; Škrbić, Z.; Dosković, V.; Petrović, M.D.; Petričević, V. Laying hen rearing systems: A review of major production results and egg quality traits. World’s Poult. Sci. J. 2014, 70, 93–104. [Google Scholar] [CrossRef]
- Miranda, J.M.; Anton, X.; Redondo-Valbuena, C.; Roca-Saavedra, P.; Rodriguez, J.A.; Lamas, A.; Franco, C.M.; Cepeda, A. Egg and egg-derived foods: Effects on human health and use as functional foods. Nutrients 2015, 7, 706–729. [Google Scholar] [CrossRef] [PubMed]
- Hanif, M.K.; Fan, Y.; Wang, L.; Jiang, H.; Li, Z.; Ma, M.; Ma, L.; Ma, M. Dietary habits of patients with coronary artery disease: A case-control study from Pakistan. Int. J. Environ. Res. Public Health 2022, 19, 8635. [Google Scholar] [CrossRef] [PubMed]
- Liu, T.; Broverman, S.; Puffer, E.S.; Zaltz, D.A.; Thorne-Lyman, A.L.; Benjamin-Neelon, S.E. Dietary diversity and dietary patterns in school-aged children in Western Kenya: A latent class analysis. Int. J. Environ. Res. Public Health 2022, 19, 9130. [Google Scholar] [CrossRef] [PubMed]
- FAO. Poultry Development Review; Food and Agriculture Organization of the United Nations: Rome, Italy, 2013; Available online: https://www.fao.org/3/i3531e/i3531e.pdf (accessed on 27 August 2022).
- FAO. Database of the Food and Agriculture Organization of the United Nations (2018 Data). Available online: http://www.fao.org/faostat/en/ (accessed on 23 May 2020).
- Government of Pakistan. Pakistan Economic Survey 2011–2012; Finance Division of the Government of Pakistan: Islamabad, Pakistan, 2013. [Google Scholar]
- Government of Pakistan. Pakistan Economic Survey; Finance Division of the Government of Pakistan: Islamabad, Pakistan, 2014. [Google Scholar]
- Government of Pakistan. Pakistan Economic Survey 2016–2017; Finance Division of the Government of Pakistan: Islamabad, Pakistan, 2017. [Google Scholar]
- Pakistan Poultry Association. An Overview of Pakistan Poultry Industry Year 2020–2021; Pakistan Poultry Association: Lahore, Pakistan, 2022; Available online: https://pakistanpoultryassociation.com.pk/ (accessed on 27 August 2022).
- Pakistan Poultry Association. Information from the Year 2014. Website of the Pakistan Poultry Association. Available online: https://pakistanpoultrycentral.pk/ (accessed on 27 August 2022).
- Korres, G.M. Technical Change and Economic Growth: Inside the Knowledge Based Economy, 2nd ed.; Ashgate Publishing: London, UK, 2016. [Google Scholar]
- Bamiro, O.M. Economic performance of commercial poultry farms in Oyo State Nigeria. Int. J. Poult. Sci. 2008, 7, 1117–1121. [Google Scholar] [CrossRef] [Green Version]
- Phonpawi, K.; Kannika, S.L.; Wanaporn, T.; Chompunut, L.; Anupong, W. Broiler production in Northern Thailand based technical efficiency using super-efficiency data envelopment analysis. Mapan J. Metrol. Soc. India 2022. [Google Scholar] [CrossRef]
- Zhu, N.; Qin, F. Influence of mechanization on technical efficiency of large-scale layer breeding. Trans. Chin. Soc. Agric. Eng. 2015, 31, 63–69. [Google Scholar]
- Jo, H.; Nasrullah, M.; Jiang, B.; Li, X.; Bao, J. A survey of broiler farmers’ perceptions of animal welfare and their technical efficiency: A case study in northeast China. J. Appl. Anim. Welf. Sci. 2022, 25, 275–286. [Google Scholar] [CrossRef]
- Onyewuchi, U.U. Differentials in technical efficiency among broiler farmers in Imo State, Nigeria. Niger. Agric. J. 2019, 50, 45–55. [Google Scholar]
- Ocholi, A.; Ayila, V.N. Determinants of technical efficiency of small-scale broiler production enterprises in Benue State, Nigeria. Int. J. Agric. Vet. Sci. 2018, 4, 4–17. [Google Scholar] [CrossRef] [Green Version]
- Adebisi, L.; Adebisi, O.; Owolabi, M.; Henshaw, E.; Asiyanbi, O. Economic analysis of contract farming and technical efficiency of broiler farmers. Cercet. Agron. Maldova 2020, 4, 426–433. [Google Scholar] [CrossRef]
- Kaine, A.I.N.; Chukwuma, E.E. Technical efficiency and profitability of backyard poultry farming in Ika South Local Government Area, Delta State, Nigeria. J. Agric. Food Sci. 2017, 15, 28–38. [Google Scholar] [CrossRef]
- Osinowo, O.H.; Tolorunju, E.T. Technical efficiency of poultry egg production in Ogun State, Nigeria. J. Agribus. Rural Dev. 2019, 51, 51–58. [Google Scholar] [CrossRef]
- Ahiale, E.D.; Abunyuwah, I.; Yenibehit, N. Technical efficiency analysis of broiler production in the Mampong municipality of Ghana. J. Econ. Sustain. Dev. 2019, 10, 152–158. [Google Scholar]
- Yenibehit, N.; Murshed, M.; Islam, M. Assessment of technical efficiency of layer production in Mampong Municipality: Stochastic frontier approach. Curr. Res. Agric. Sci. 2019, 6, 20–28. [Google Scholar]
- Ullah, I.; Ali, S.; Khan, S.U.; Sajjad, M. Assessment of technical efficiency of open shed broiler farms: The case study of Khyber Pakhtunkhwa Province Pakistan. J. Saudi Soc. Agric. Sci. 2019, 18, 361–366. [Google Scholar] [CrossRef]
- Pradhan, N.B.; Raut, N.K. An estimation of technical efficiency of poultry farming in Nepal. Econ. J. Dev. Issues 2019, 28, 88–111. [Google Scholar] [CrossRef]
- Ume, S.I.; Jiwuba, P.D.; Ede, N.O. Technical efficiency of Enugu urban broiler farmers in Enugu State, Nigeria. Agro-Science 2012, 11, 37–42. [Google Scholar] [CrossRef] [Green Version]
- Nihal, A.H.; Shahid, A.; Wahid, U. Estimation of technical efficiency of broiler farms in district Mardan, Khyber Pakhtunkhwa. Sarhad J. Agric. 2018, 34, 349–358. [Google Scholar]
- Bethel, E.; Fani, D.R.; Odufa, E.M. Analysis of technical efficiency of poultry farmers in Cross River State, Nigeria. Int. J. Res. Stud. Agric. Sci. 2016, 2, 40–45. [Google Scholar]
- Pakistan Poultry Association. Sector Information from the Year 2012. Website of the Pakistan Poultry Association. 2014. Available online: https://pakistanpoultrycentral.pk/ (accessed on 27 August 2022).
- Cochran, W.G. Sampling Techniques, 3rd ed.; John Wiley & Sons: New York, NY, USA, 1997. [Google Scholar]
- Farrell, J. The measurement of productive efficiency. J. R. Stat. Soc. Ser. A 1957, 120, 252–281. [Google Scholar] [CrossRef]
- Myeki, L.W.; Nengovhela, N.B.; Mudau, L.; Nakana, E.; Ngqangweni, S. Estimation of technical, allocative, and economic efficiencies for smallholder broiler producers in South Africa. Agriculture 2022, 12, 1601. [Google Scholar] [CrossRef]
- Meeusen, W.; van Den Broeck, J. Efficiency estimation from Cobb-Douglas production functions with composed error. Int. Econ. Rev. 1977, 18, 435–444. [Google Scholar] [CrossRef]
- Aigner, D.; Lovell, C.K.; Schmidt, P. Formulation and estimation of stochastic frontier production function models. J. Econom. 1977, 6, 21–37. [Google Scholar] [CrossRef]
- Coelli, T.J. Recent developments in frontier modelling and efficiency measurement. Aust. J. Agric. Econ. 1995, 39, 219–245. [Google Scholar] [CrossRef] [Green Version]
- Stevenson, R.E. Likelihood functions for generalized stochastic frontier estimation. J. Econom. 1980, 13, 57–66. [Google Scholar] [CrossRef]
- Stata Corp. STATA 16; Software. StataCorp LLC: College Station, TX, USA, 2020. [Google Scholar]
- Coelli, T.J. A guide to Frontier Version 4.1: A Computer Program for Stochastic Frontier Production and Cost Function Estimation; CEPA Working Papers; CEPA: Armidale, Australia, 1996. [Google Scholar]
- Oleke, J.M.; Isinika, A.C. Assessing the technical efficiency of commercial egg production in Tanzania for improved livelihoods. J. Dev. Agric. Econ. 2011, 3, 343–352. [Google Scholar]
- Esiobu, N.S.; Onubuogu, G.C.; Okoli, V.B.N. Determinants of income from poultry egg production in Imo State, Nigeria: An econometric model approach. Glob. Adv. Res. J. Agric. Sci. 2015, 3, 186–199. [Google Scholar]
- Birhanu, M.Y.; Alemayehu, T.; Bruno, J.E.; Kebede, F.G.; Sonaiya, E.B.; Goromela, E.H.; Bamidele, O.; Dessie, T. Technical efficiency of traditional village chicken production in Africa: Entry points for sustainable transformation and improved livelihood. Sustainability 2021, 13, 8539. [Google Scholar] [CrossRef]
- de Alencar, M.D.C. Effects of labor motivation in poultry production. Braz. J. Poult. Sci. 2007, 9, 249–253. [Google Scholar] [CrossRef]
- Agyemang, I. Poultry industry in the Wa Municipality of Upper West Region of Ghana, prospect and challenges. Afr. J. Hist. Cult. 2014, 6, 6–15. [Google Scholar]
- Oyakhilomen, O.; Daniel, A.I.; Zibah, R.G. Technical efficiency-food security nexus in Kaduna State, Nigeria: A case study of poultry egg farmers. Consilience 2015, 14, 244–258. [Google Scholar]
- Adedeji, I.A.; Adelalu, K.O.; Ogunjimi, S.I.; Otekunrin, A.O. Application of stochastic production frontier in the estimation of technical efficiency of poultry egg production in Ogbomoso metropolis of Oyo State, Nigeria. World J. Agric. Res. 2013, 1, 119–123. [Google Scholar]
- Iyiola-Tunji, T. Evaluation of crop-livestock integration systems among farm families at adopted villages of the national agricultural extension and research liaison services. J. Agric. Ext. 2015, 19, 46–58. [Google Scholar] [CrossRef] [Green Version]
- Scanes, C.G.; Brant, G.; Esminger, M.E. Poultry Science, 4th ed.; Pearson Prentice Hill: New York, NY, USA, 2004. [Google Scholar]
- Dozier, W.A.; Czarick, M.; Lacy, M.P.; Fairchild, B.D. Monitoring water consumption on commercial broiler farms: Evaluation tool to assess flock performance. Poult. Sci. 2002, 81, 154. [Google Scholar]
- Garcia, R.G.; Almeida, P.I.; Caldara, F.R.; Nääs, I.A.; Pereira, D.F.; Freitas, L.W.; Schwingel, A.W.; Lima, N.D.S.; Graciano, J.D. Effect of the litter material on drinking water quality in broiler production. Braz. J. Poult. Sci. 2010, 12, 165–169. [Google Scholar] [CrossRef] [Green Version]
- Manning, L.; Chadd, S.A.; Baines, R.N. Key health and welfare indicators for broiler production. World’s Poult. Sci. J. 2017, 63, 46–62. [Google Scholar] [CrossRef]
- Saliu, L.; Abdulrazaq, S.; Eleke, P. Production efficiency of poultry egg (layer) production in Chikun and Igabi local government areas of Kaduna State, Nigeria. Niger. J. Agric. Econ. 2016, 6, 40–52. [Google Scholar]
- Yero, U.T. Technical Efficiency and Profitability of Chicken Production in Kaduna State, Nigeria; Kampala International University: Kampala, Uganda, 2019. [Google Scholar]
- Adeyonu, A.G.; Otunaiya, A.O.; Bamiro, O.M. Technical efficiency of poultry egg production in Ibadan Metropolis, Oyo state, Nigeria. Economics 2015, 4, 50–56. [Google Scholar]
- Gabdo, B.H.; Ismail, M.M.; Abdurofi, I. Stochastic frontier production function and efficiency status of poultry-layer farms in Malaysia. Int. J. Poult. Sci. 2018, 17, 568–577. [Google Scholar]
- Akerele, E.O.; Ologbon, O.A.C.; Nuwemuhwezi, G.; Akintayo, B.D. Technical efficiency in small and medium scale poultry (egg) production in Ogun State, Nigeria. Front. J. Curr. Eng. Res. 2019, 1, 1–11. [Google Scholar]
- Han, Y.; Lyu, H.; Cheng, S.; He, Y. Influencing mechanism and difference of poultry farmers’ willingness and behavior in breeding scale—Evidence from Jianghan Plain, China. Int. J. Environ. Res. Public Health 2022, 19, 1631. [Google Scholar] [CrossRef] [PubMed]
- Ashagidigbi, W.M.; Sulaiman, S.A.; Adesiyan, A. Technical and allocative efficiency of poultry egg producers in Nigeria. Agric. J. 2011, 6, 124–130. [Google Scholar] [CrossRef]
Figure 1.
Distribution of technical efficiency scores of different layer farmers (Source: Authors’ calculations).
Figure 1.
Distribution of technical efficiency scores of different layer farmers (Source: Authors’ calculations).

Figure 2.
Distribution of technical efficiency scores of different broiler farmers (Source: Authors’ calculations).
Figure 2.
Distribution of technical efficiency scores of different broiler farmers (Source: Authors’ calculations).


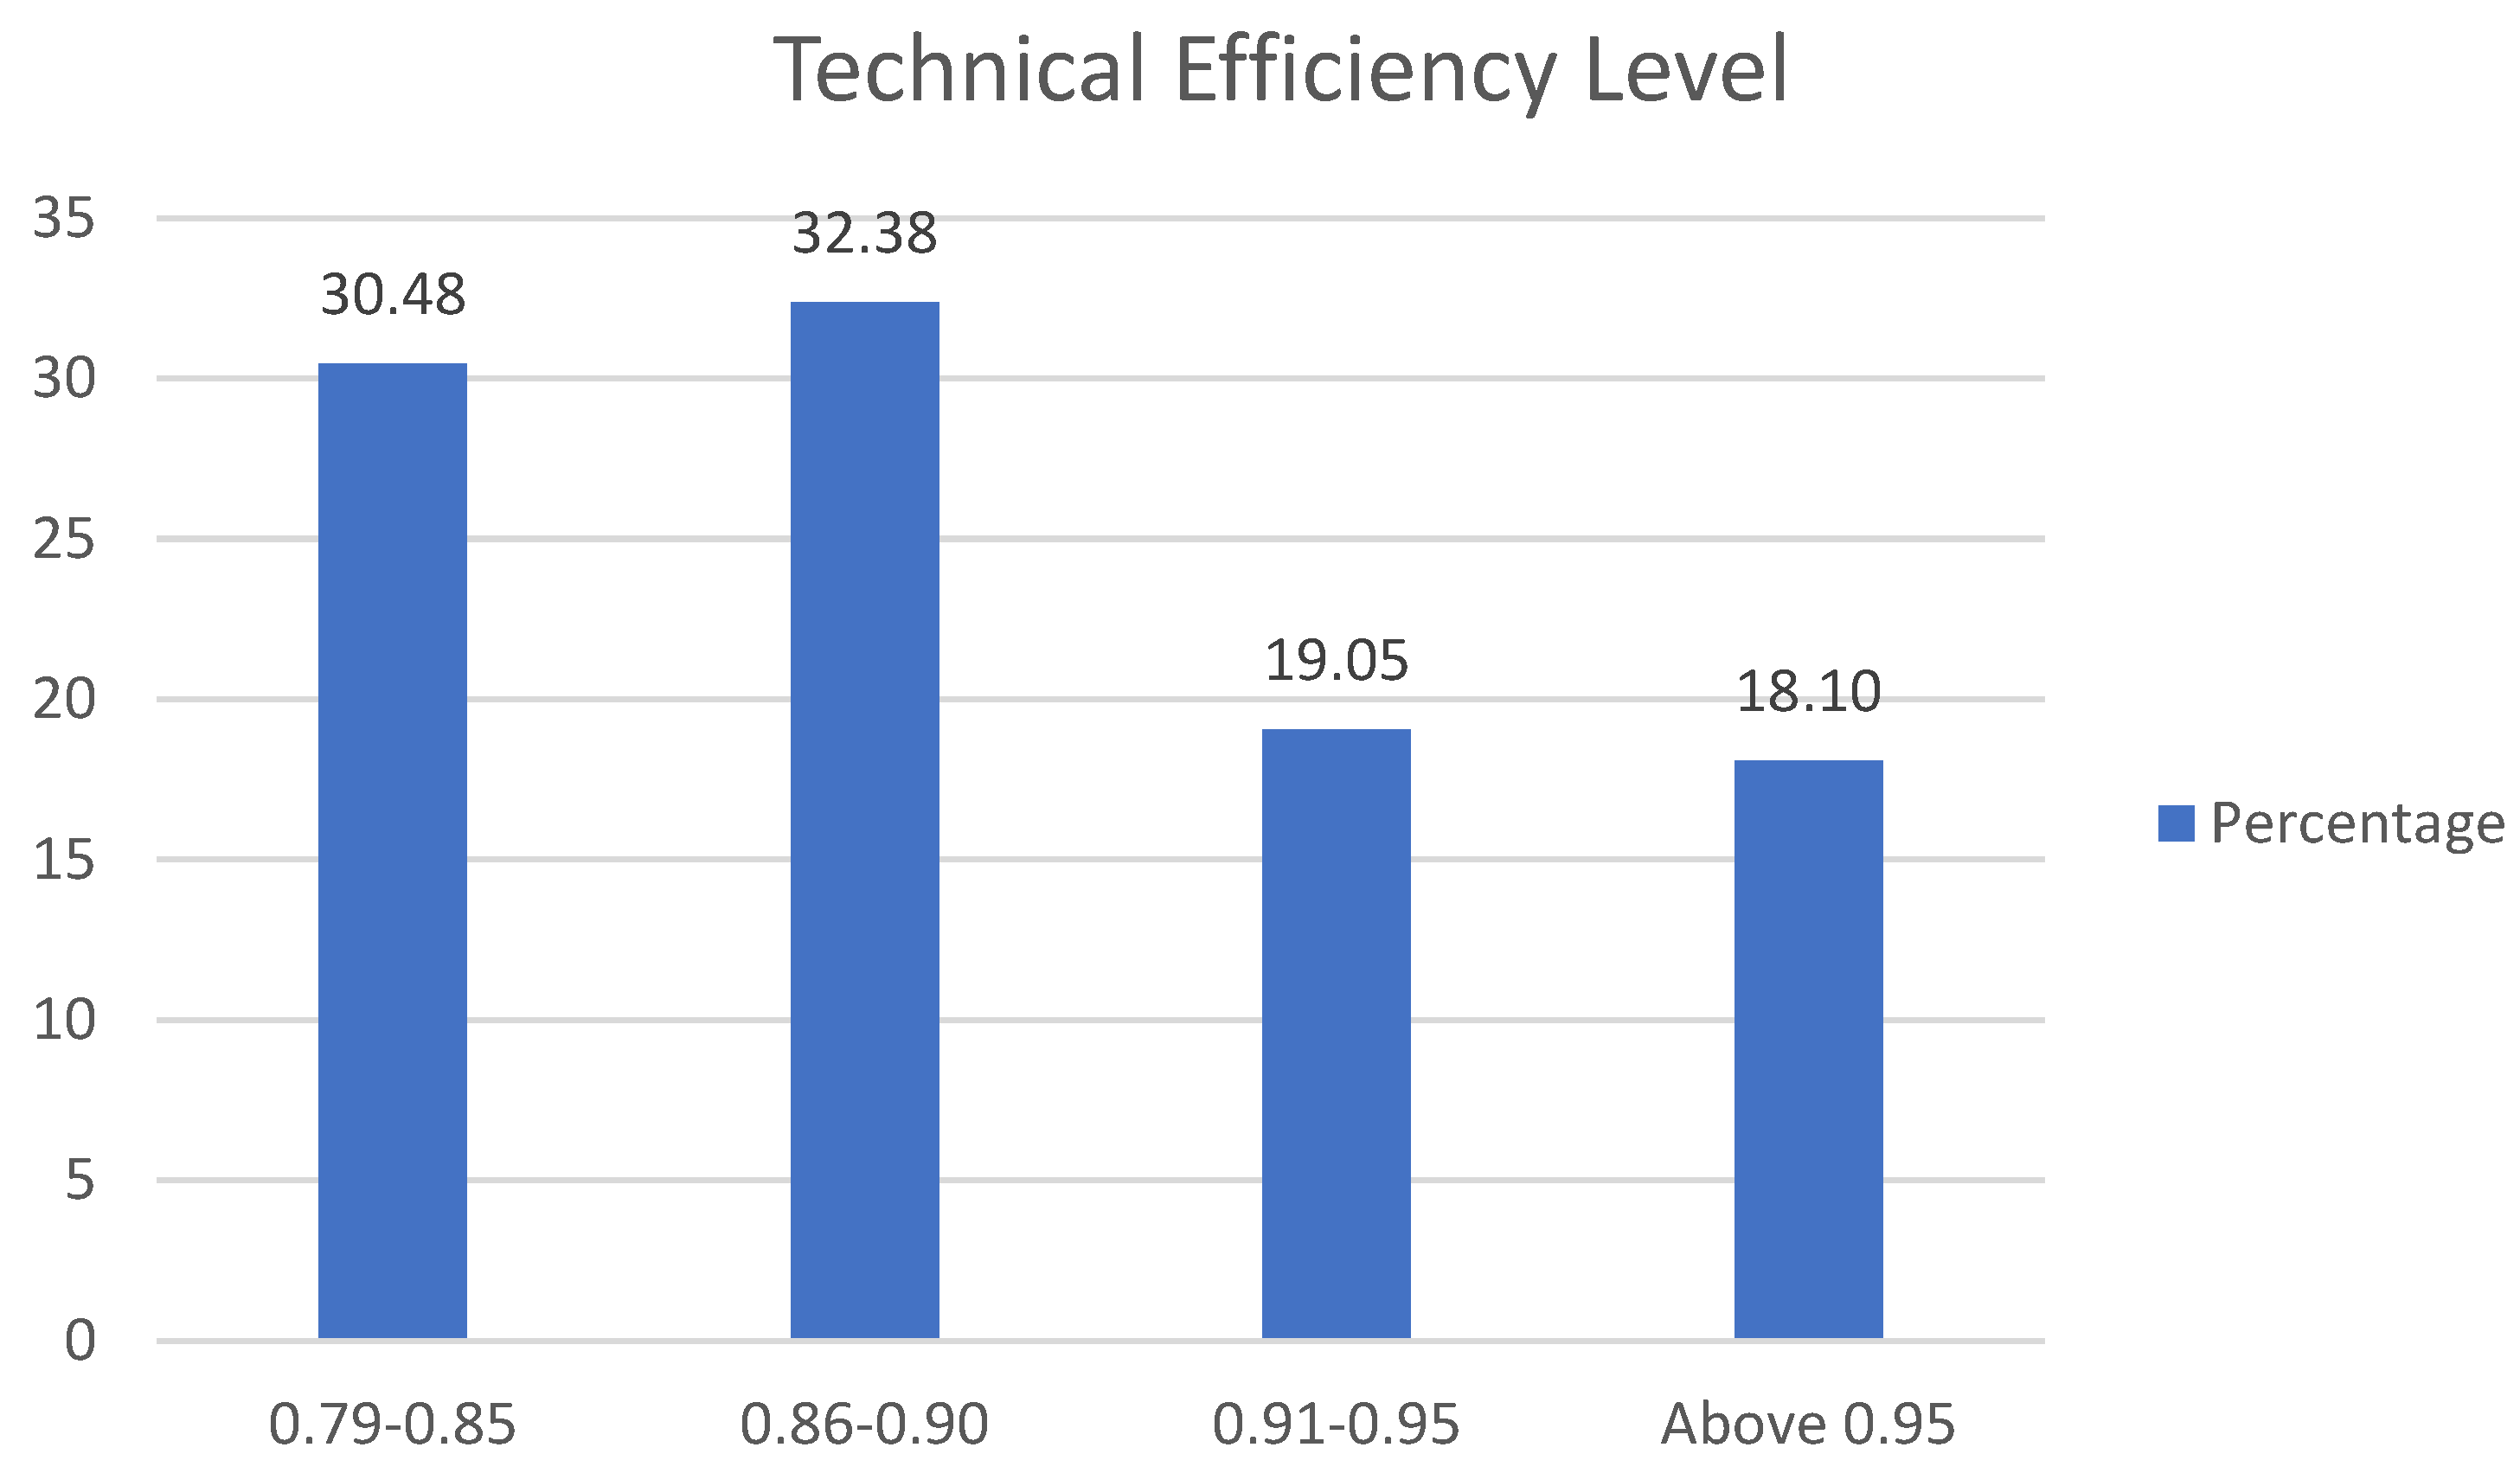
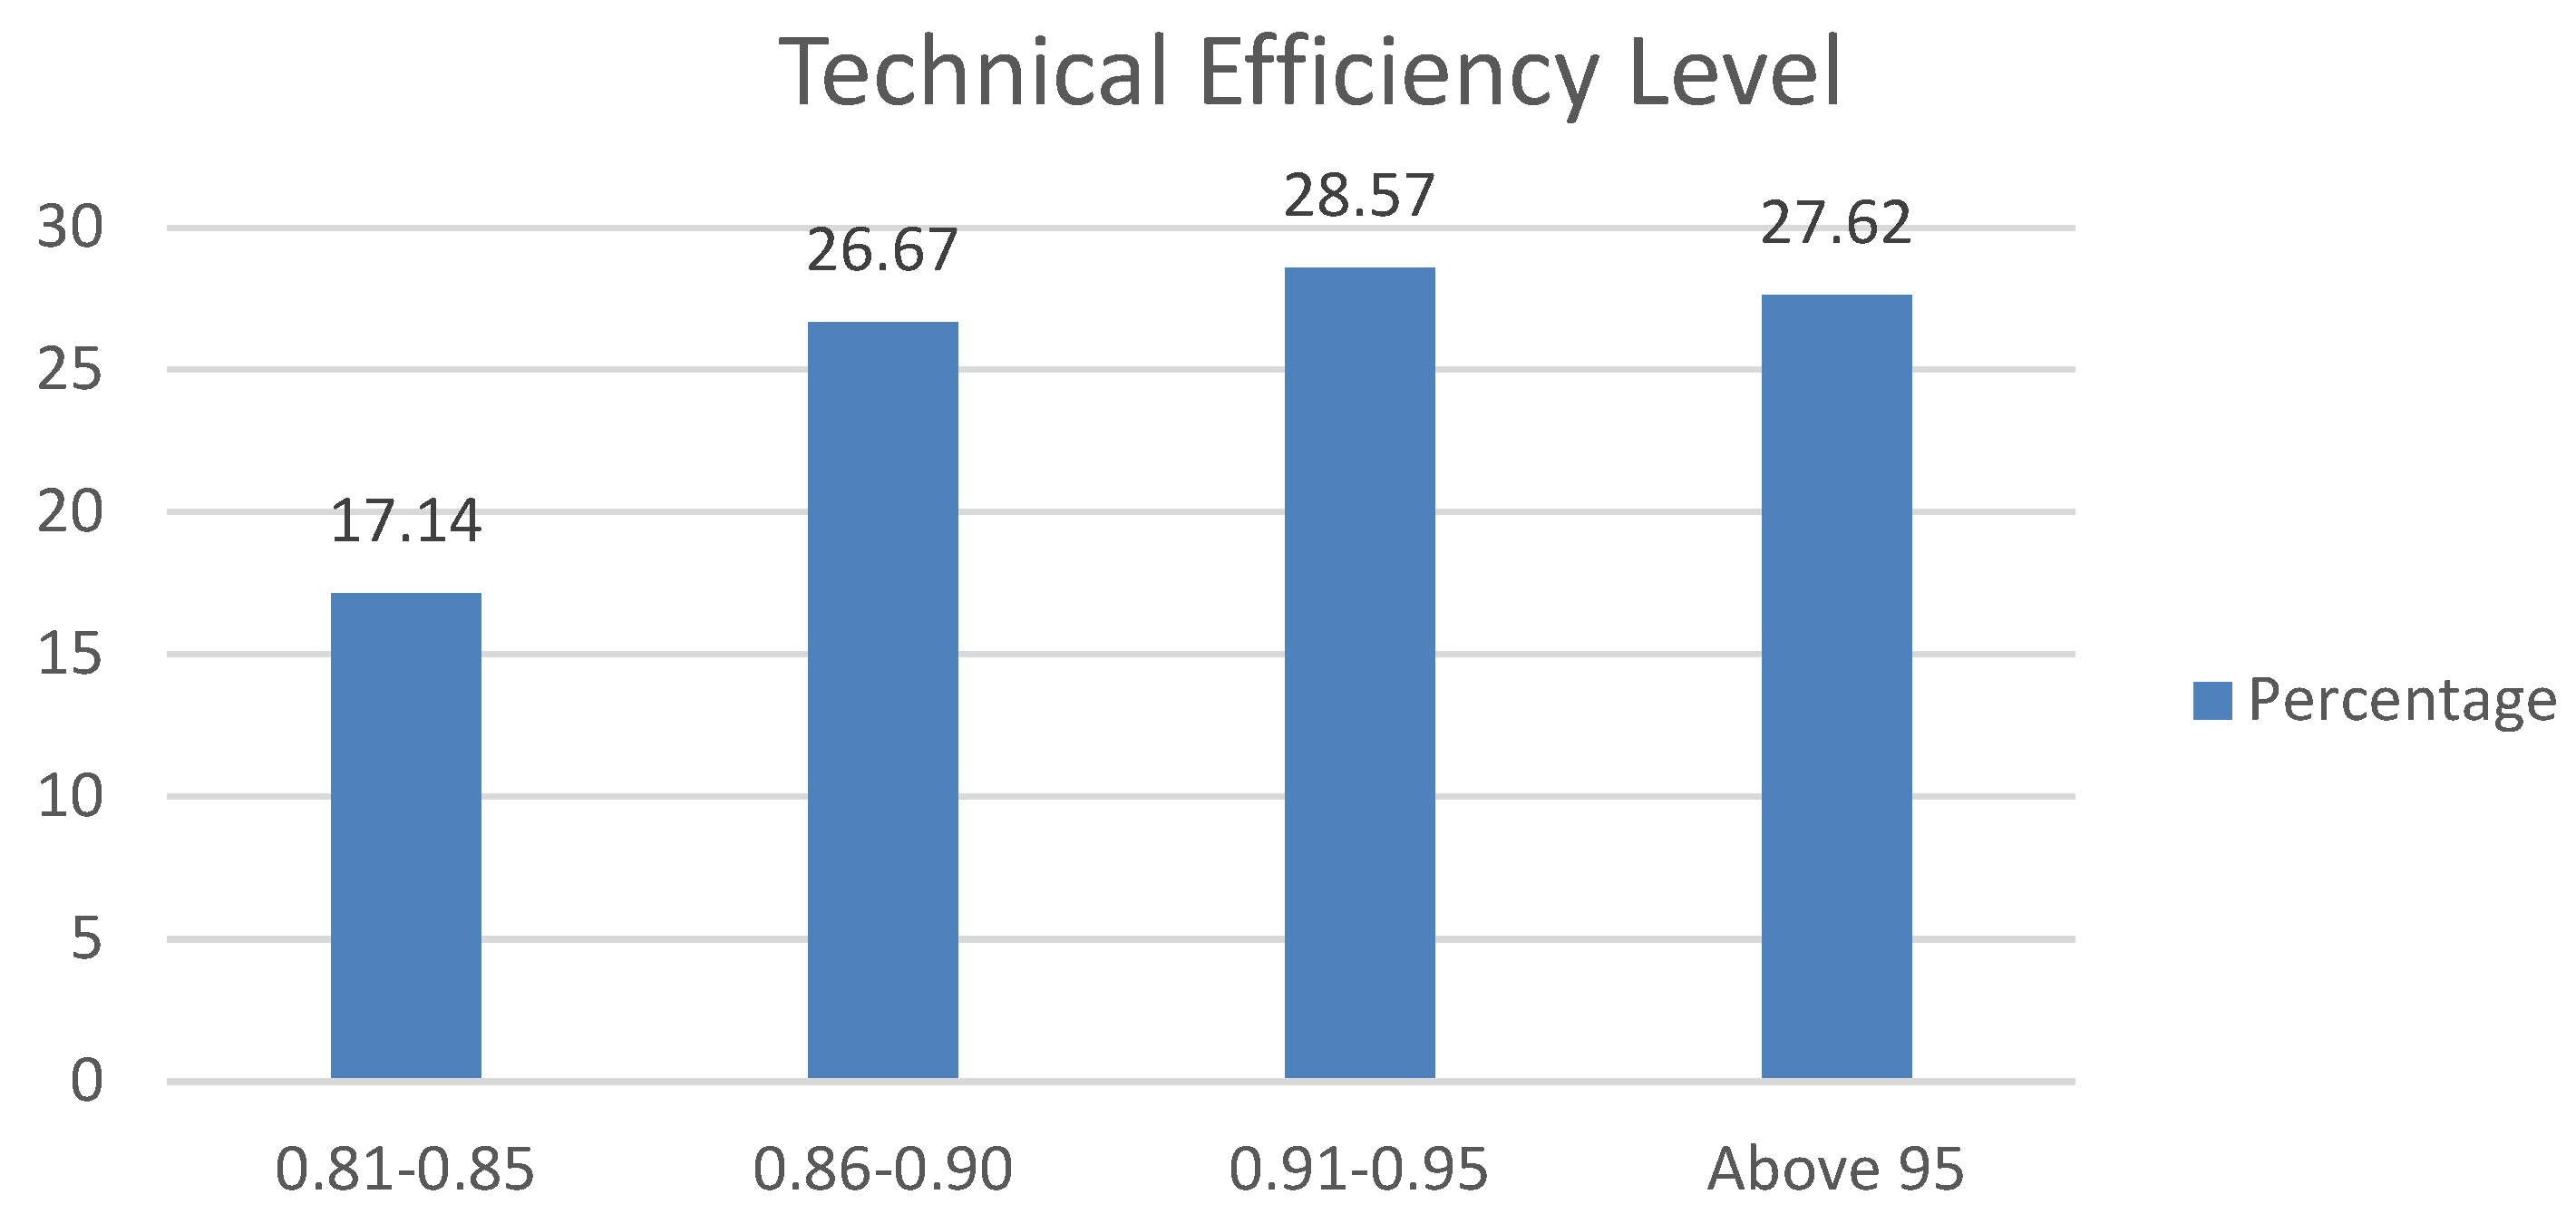
Table 1.
Descriptive statistics of variables of layer poultry farmers.
| Variable | Unit | Mean | Std. Dev. | Minimum | Maximum |
|---|---|---|---|---|---|
| Eggs (output) | Number | 1,545,898.31 | 1,011,690.00 | 232,815.00 | 4,453,990.00 |
| Flock size | Number | 5517.02 | 3317.13 | 1000.00 | 15,000.00 |
| Labor | Man-days | 1156.02 | 520.05 | 504.00 | 2530.00 |
| Feed intake | Kilograms | 256,009.51 | 162,654.88 | 42,479.02 | 734,489.70 |
| Water consumption | Liters | 471,719.84 | 297,557.87 | 82,062.00 | 1,326,098.70 |
| Vaccine | Milliliters | 61,899.38 | 41,554.02 | 10,400.00 | 232,100.00 |
| Age | Years | 43.46 | 11.05 | 23.00 | 70.00 |
| Education | Years | 8.88 | 3.59 | 0.00 | 16.00 |
| Experience | Years | 12.85 | 6.97 | 4.00 | 40.00 |
| Credit access | Dummy | 0.57 | 0.50 | 0.00 | 1.00 |
| Extension services | Dummy | 0.69 | 0.47 | 0.00 | 1.00 |
Source: Own survey results of this study.
Table 2.
Descriptive statistics of variables of broiler poultry farmers.
| Variable | Unit | Mean | Std. Dev. | Minimum | Maximum |
|---|---|---|---|---|---|
| Output | Kilograms | 12,721.29 | 8404.76 | 7000.00 | 57,900.00 |
| Flock size | Number | 7346.68 | 4028.18 | 5000.00 | 30,000.00 |
| Labor | Man-days | 123.79 | 45.69 | 78.00 | 344.00 |
| Feed intake | Kilograms | 21,989.77 | 14,289.66 | 13,500.00 | 102,900.00 |
| Water consumption | Liters | 79,404.87 | 47,874.55 | 47,000.00 | 363,900.00 |
| Vaccine | Milliliters | 26,877.85 | 18,809.87 | 15,500.00 | 131,100.00 |
| Age | Years | 41.45 | 8.99 | 23.00 | 61.00 |
| Education | Years | 9.37 | 3.27 | 0.00 | 16.00 |
| Experience | Years | 11.73 | 6.00 | 2.00 | 32.00 |
| Credit access | Dummy | 0.66 | 0.48 | 0.00 | 1.00 |
| Extension services | Dummy | 0.53 | 0.50 | 0.00 | 1.00 |
Source: Own survey results of this study.
Table 3.
Maximum likelihood estimates of Cobb–Douglas SFA (stochastic frontier analysis) with the inefficiency effect model (layer farms).
Table 3.
Maximum likelihood estimates of Cobb–Douglas SFA (stochastic frontier analysis) with the inefficiency effect model (layer farms).
| Variable | Parameter | Coefficient | Std. Error | z-Value | Prob. |
|---|---|---|---|---|---|
| Constant | o | −1.18 | 0.182 | −6.5 | <0.01 |
| Ln (flock size) | 1 | 0.21 | 0.012 | 17.08 | <0.01 |
| Ln (labor) | 2 | 0.11 | 0.032 | 3.32 | <0.01 |
| Ln (feed) | 3 | 0.36 | 0.047 | 7.64 | <0.01 |
| Ln (water consumption) | 4 | 0.12 | 0.009 | 13.15 | <0.01 |
| Ln (vaccine) | 5 | 0.01 | 0.011 | 0.84 | 0.40 |
| Inefficiency effect model | |||||
| Constant | o | 1.55 | 0.202 | 7.66 | <0.01 |
| Age | 1 | −0.22 | 0.016 | −13.77 | <0.01 |
| Education | 2 | −0.37 | 0.043 | −8.68 | <0.01 |
| Experience | 3 | −0.12 | 0.009 | −14.23 | <0.01 |
| Credit access | 4 | −0.23 | 0.017 | −13.42 | <0.01 |
| Extension services | 5 | −0.05 | 0.013 | −3.68 | <0.01 |
| Sigma square | σ2 | 0.44 | |||
| Gamma | γ | 0.91 | |||
| Sigma-v2 | σv2 | 0.04 | |||
| Sigma-u2 | σu2 | 0.40 | |||
| Prob > chi2 | <0.01 | ||||
Source: Authors’ calculations.
Table 4.
Maximum likelihood estimates of Cobb–Douglas SFA (stochastic frontier analysis) with the inefficiency effect model (broiler farms).
Table 4.
Maximum likelihood estimates of Cobb–Douglas SFA (stochastic frontier analysis) with the inefficiency effect model (broiler farms).
| Variable | Parameter | Coefficient | Std. Error | z-Value | Prob. |
|---|---|---|---|---|---|
| Constant | o | −0.51 | 0.036 | −14.25 | <0.01 |
| Ln (flock size) | 1 | 0.18 | 0.026 | 6.90 | <0.01 |
| Ln (labor) | 2 | −0.01 | 0.014 | −0.84 | 0.40 |
| Ln (feed) | 3 | 0.42 | 0.040 | 10.56 | <0.01 |
| Ln (water consumption) | 4 | 0.16 | 0.025 | 6.38 | <0.01 |
| Ln (vaccine) | 5 | 0.02 | 0.021 | 1.02 | 0.31 |
| Inefficiency effect model | |||||
| Constant | o | 1.76 | 0.196 | 8.94 | <0.01 |
| Age | 1 | −0.07 | 0.010 | −6.58 | <0.01 |
| Education | 2 | −0.20 | 0.014 | −13.7 | <0.01 |
| Experience | 3 | −0.24 | 0.013 | −18.84 | <0.01 |
| Credit access | 4 | −0.16 | 0.044 | −3.61 | <0.01 |
| Extension services | 5 | −0.25 | 0.074 | −3.4 | <0.01 |
| Sigma square | σ2 | 0.53 | |||
| Gamma | γ | 0.94 | |||
| Sigma-v2 | σv2 | 0.03 | |||
| Sigma-u2 | σu2 | 0.50 | |||
| Prob > chi2 | <0.01 | ||||
Source: Authors’ calculations.
Table 5.
Technical efficiency level of layer poultry farmers.
| Efficiency Group | Frequency | Percentage | Mean | Std. Dev. | Min. | Max. |
|---|---|---|---|---|---|---|
| 0.79–0.85 | 32 | 30.48 | 0.83 | 0.020 | 0.79 | 0.85 |
| 0.86–0.90 | 34 | 32.38 | 0.88 | 0.015 | 0.86 | 0.90 |
| 0.91–0.95 | 20 | 19.05 | 0.93 | 0.016 | 0.91 | 0.95 |
| Above 0.95 | 19 | 18.10 | 0.98 | 0.012 | 0.96 | 0.99 |
| Total | 105 | 100.00 | 0.89 | 0.057 | 0.79 | 0.99 |
Source: Authors’ calculations.
Table 6.
Technical efficiency level of broiler farmers.
| Efficiency Group | Frequency | Percentage | Mean | Std. Dev. | Min. | Max. |
|---|---|---|---|---|---|---|
| 0.81–0.85 | 18 | 17.14 | 0.83 | 0.015 | 0.81 | 0.85 |
| 0.86–0.90 | 28 | 26.67 | 0.88 | 0.020 | 0.86 | 0.90 |
| 0.91–0.95 | 30 | 28.57 | 0.93 | 0.017 | 0.91 | 0.95 |
| Above 95 | 29 | 27.62 | 0.98 | 0.011 | 0.96 | 0.99 |
| Total | 105 | 100.00 | 0.92 | 0.054 | 0.81 | 0.99 |
Source: Authors’ calculations.
Publisher’s Note: MDPI stays neutral with regard to jurisdictional claims in published maps and institutional affiliations. |
© 2022 by the authors. Licensee MDPI, Basel, Switzerland. This article is an open access article distributed under the terms and conditions of the Creative Commons Attribution (CC BY) license (https://creativecommons.org/licenses/by/4.0/).
Share and Cite
MDPI and ACS Style
Khan, N.A.; Ali, M.; Ahmad, N.; Abid, M.A.; Kusch-Brandt, S. Technical Efficiency Analysis of Layer and Broiler Poultry Farmers in Pakistan. Agriculture 2022, 12, 1742. https://0-doi-org.brum.beds.ac.uk/10.3390/agriculture12101742
AMA Style
Khan NA, Ali M, Ahmad N, Abid MA, Kusch-Brandt S. Technical Efficiency Analysis of Layer and Broiler Poultry Farmers in Pakistan. Agriculture. 2022; 12(10):1742. https://0-doi-org.brum.beds.ac.uk/10.3390/agriculture12101742
Chicago/Turabian StyleKhan, Nisar Ahmed, Majid Ali, Nihal Ahmad, Muhammad Ali Abid, and Sigrid Kusch-Brandt. 2022. "Technical Efficiency Analysis of Layer and Broiler Poultry Farmers in Pakistan" Agriculture 12, no. 10: 1742. https://0-doi-org.brum.beds.ac.uk/10.3390/agriculture12101742
Note that from the first issue of 2016, this journal uses article numbers instead of page numbers. See further details here.