
Degree Days as a Method to Estimate the Optimal Harvest Date of ‘Conference’ Pears


Department of Ornamental Plants, Dendrology and Pomology, Poznan University of Life Sciences, ul. Dąbrowskiego 159, 60-594 Poznań, Poland
Agriculture 2022, 12(11), 1803; https://0-doi-org.brum.beds.ac.uk/10.3390/agriculture12111803
Submission received: 29 September 2022
/
Revised: 24 October 2022
/
Accepted: 26 October 2022
/
Published: 29 October 2022
(This article belongs to the Special Issue The Impact of Environmental Factors on Fruit Quality)
Abstract
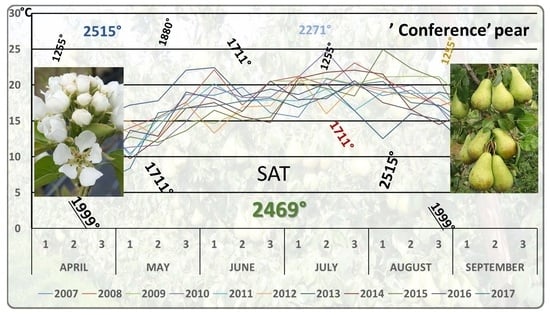
:The European pear is a climacteric fruit species characterised by high storability. The ‘Conference’ pear can be stored in a CA (controlled atmosphere) room without major losses for half a year. However, for ‘Conference’ storage to be successful, the fruit must be harvested when fully developed before it enters the climatic maturation phase. Among the various methods used to determine the optimal harvest date, the degree-day method, which relies on the sum of active temperatures, seems to be relatively accurate and easy to apply. During 11 years of study, pears were harvested on four dates (every 4–5 days) chosen based on measurements and observations, and then, after a six-month storage period, the optimal harvest date was determined. During the growing season, the temperature was measured using an automatic weather station to calculate the sum of active temperatures from full bloom to the optimal harvest date. Measurements made after storage were analysed, and the sum of active temperatures needed for the proper development of the ‘Conference’ pear was calculated to be 2469 degree days. The calculations are very accurate because the dispersion calculated using the standard deviation was only 20°. The base temperature with the smallest error was 0 °C. This study shows that this method can be recommended as useful for determining the optimal harvest date.
1. Introduction
The ‘Conference’ pear is one of the most important pear cultivars. Its annual production is a little less than 100,000 tonnes in Europe alone, making up a share of about 45% of pear production on the continent [1]. ‘Conference’ owes this status to its high productivity, easy cultivation, high storability [2], and popularity among consumers [3].
Only pears picked at the optimal maturity stage are suitable for storage for over 6 months because of their better storage potential and organoleptic quality [4,5]. The storage of ‘Conference’ pears for 180 days in a normal atmosphere is not economically viable, even if the fruit is subjected to 1-MCP treatment; at the same time, it is profitable to store ‘Conference’ pears in a controlled atmosphere for the same period, regardless of whether 1-MCP was applied or not [2]. Fruit harvested when still unripe will shrivel more easily [6] and will be more vulnerable to physiological disorders and diseases [7,8]. Over-mature fruit is likely to become soft and mealy [9] and have an insipid flavour after a short period of storage [10].
The correct determination of the harvest date is crucial for pome fruit storability [11]. There are many methods for determining the optimal harvest date (OHD) [7], but there is no perfect method; moreover, the more accurate the method, the more difficult and expensive it is to perform [12]. One of the simplest methods to determine the OHD of pome species is to assess the disintegration of starch or to use the calendar [11]. However, these methods are burdened with an error of 7–10 days, and thus, they are not reliable enough when it comes to selecting fruit for long-term storage. Their advantage is that they are simple and that everyone can carry them out. A very accurate method is the ethylene method, which shows current ethylene production by fruit [10]. However, this method requires specialised equipment that is often not available to producers or advisory centres [12]. Therefore, the search for a simple and cheap method that will allow a very accurate determination of the harvest date is still ongoing.
The thermometer design principles introduced by René Antoine Ferchault de Réaumur in 1730 and then the concept of heat units proposed by Nicolas Clément in 1825 provided agricultural sciences with a useful tool to study the physiological stages of the development of various organisms (cultivated or parasitic) [13,14], such as the moment of departure of single-generation pests or the first generation of multi-generational pests [15].
This type of research is based on agroclimatic indices, such as the sum of active temperatures (SAT), growing degree days (GDD), and the latitude-temperature index (LTI). They are highly useful agronomic variables closely related to plant development [16]. In the second half of the twentieth century, European research centres created phenological models on the basis of temperature measurements to predict when a specific stage of development of a species or cultivar occurs [17]. Many models have been developed for vines: they enable determining the date of bud break based on degree days [18] after the plant has passed the full dormancy period, i.e., the required number of chilling hours. The use of these methods allows assessing the suitability of a given cultivar for the local climate [19]. Similar principles are also followed by researchers introducing new species to cultivation, such as Cornus mas L. [19] and Actinidia arguta in northern Poland [20], new peach cultivars (Prunus persica) in the Czech Republic [21], or new olive cultivars (Olea europaea L. var europaea) in Italy [22].
The dates of the beginning and end of vegetation of specific species, as well as the time they reach key development phases in individual years, have been used by many researchers to create models illustrating the speed of climate change caused by the greenhouse effect [23,24]. They count the number of days in the period during which a certain required sum of active temperatures is achieved for plants and various biological processes is reduced, as well as observe changes to the range of occurrences of various organisms and broadly understood phytogeography [19,20,24].
The advantage of using the sum of active temperatures is that no daily tedious temperature measurements are needed to determine the daily average temperature. A meteo station electronically transmitting meteorological data to the cellular network on an ongoing basis allows users to easily calculate the sum of active temperatures [25]. The only difficulty that users may face in this context is the lack of calculations and formulas for a given species or cultivar and the lack of information on the base temperature that should be used to calculate the sum of active temperatures, usually in the range from −2 to +10 °C [26].
This paper describes research conducted for many years to determine (1) the sum of active temperatures from flowering to harvest for ‘Conference’ pears, (2) the base temperature that gives the highest accuracy of measurement for this cultivar, and (3) the harvest window for this method.
2. Materials and Methods
2.1. Materials and Location
The experiment was conducted in the experimental orchard and laboratory of the Department of Pomology of the University of Life Sciences in Poznan (52°31′ N latitude and 16°38′ E longitude). ‘Conference’ pears were collected from trees grafted on Quince S1, planted at a spacing of 4 × 1.5 m in the spring of 2002. The tree crowns were trained as wide spindles. There were 192 trees in three rows, selected from a bigger plot to ensure trees with equal vigour and size. The pear orchard was maintained according to the standard commercial practice for integrated fruit production.
2.2. Sampling
There were two sizes of fruit samples depending on whether the fruit was to be stored (big sample) or only qualitative measurements were to be made (small sample). Pears were collected every 4–5 days, starting several weeks before the estimated OHD. The small sample consisted of 20 pears picked from at least 10 trees, from 100 to 160 cm high, from the outside part of the tree, and from the same east-southern side. Pears over or under the normal size or infected by pests or diseases were rejected. The fruit had to represent the stage of maturity (in size and colour) of the fruit to be harvested during the main harvest. In most years of the experiment, fruit intended for cold storage was also collected on the last four sampling dates (big sample). The big samples were harvested according to the same rules as those applicable to the small samples.
The fruit samples intended for storage were considerably larger than the fruit samples collected solely for measurement purposes and were placed in 4 boxes with 10–12 kg per box. The total number of pears harvested for storage was approximately 300 pears per harvest date. The dates of each sampling and of the harvest are shown in Table 1.
2.3. Measurements
2.3.1. Phenological Phases
In the Orchard, the Dates of the Basic Phenological Phases were Recorded, with Particular Emphasis on Full Bloom. “Full bloom” was Defined as the Point in Time When 80 Percent of the Blossoms on the North Side of the Tree Were open.
2.3.2. Temperature
Four data loggers (HOBO ®—Plus4, made by ONSET Computers, Bourne, MA, USA) were put on trees in the orchard in shaded places 2 m above the ground and set to measure the temperature every 2 h. The measurement accuracy was 0.1 deg. Readouts were downloaded from the loggers once a month until the last harvest date. The results obtained from the four loggers provided the basis for the calculation of (a) the average daily temperature and (b) the cumulative temperature, for which the values of 0.0 °C, 4.0 °C, 5.0 °C, 10.0 °C, and 15.0 °C were taken as the base temperature. The calculations were conducted in reference to the OHD obtained by applying the procedure described in the section “Storage condition and evaluation of storability”. For all years of the experiment, the mean and standard deviation were calculated.
2.3.3. Maturity and Ripening at Harvest Were Evaluated According to Well-Known Standard Methods
- −
- Firmness: penetrometer (probe—8 mm in depth, 11 mm in diameter), two opposite sides of the fruit, in N;
- −
- Total soluble solids (TSS): refractometer, in %;
- −
- Starch disintegration: a 10-point scale, where 1 is no conversion and 10 is totally converted;
- −
- Titratable acidity (TA): titration with 1 n NaOH to 8.1 pH, mval/100 mL;
- −
- Ethylene production: around 1 kg of pears was put in a gas-tight box; after an hour, ethylene concentration was measured and converted into 1000 g of fruit.
All of the above measures were taken to make a decision on the date of the first harvest. Subsequent harvests were conducted every 4–5 days. There were four harvests within 16–20 days in each year of the experiment.
2.3.4. Storage Conditions and Evaluation of Storability
Fruit was stored in a CA storage room at −0.5 ± 0.5 °C and around 90% RH for approximately 6 months. The schedule of all measurements is shown in Table 1. The storability of individual pear samples was evaluated after the same number of days of storage following their harvest date. The evaluation consisted of judgement and measurements. Judgement was based on sensory tests, the incidence of diseases and disorders, and internal quality criteria (firmness, sweetness, and sourness), whereas the measurements comprised the measurement of TSS, TA, firmness, and fruit mass loss.
2.3.5. Evaluation
Each criterion was scored separately for each date of harvest. The scores were given according to the following rules:
- (1)
- Fruit mass loss was measured for each stored box. Twenty pears were numbered and weighed with an accuracy of 0.1 g before and after storage. A total of 80 pears from one harvest were examined. Scores were given according to an analysis of variance (ANOVA) between the harvest dates. If there were no significant differences between samples, each sample received the same score, and it was 1. If there were two groups with significant differences, samples could receive a score of 1 or 2, where a higher score was assigned to the sample with significantly lower weight loss. If the analysis showed a significant difference in mass loss between each harvest date, every sample was scored with a different score (1, 2, 3, or 4), and the highest value (4) was assigned to the sample with the lowest mass loss.
- (2)
- The incidence of disorders and diseases was scored separately according to the same rules as those applied to fruit mass loss. After being taken out of cold storage, pears went through a week of shelf life at room temperature. Fruit infected with more than one disease was counted only once because it could no longer qualify as commercial-quality fruit anyway. If the share of non-healthy fruit in a box was higher than 10%, a sample received 1 point independently of the analysis of variance.
- (3)
- Fruit firmness after storage was measured in the same way as before storage and was scored using the mean N value. Readings were taken from 20 fruits with the procedure described in Section 2.3.3. Samples of fruit softer than 40 N could not receive more than 1 point. Samples harder than 40 N could receive up to four points depending on the results of the analysis of variance (ANOVA). If the firmness of fruits was higher than 40 N and ANOVA showed significant differences between the four harvest dates, then each group had a different score, and the lowest score was assigned to the softest group.
- (4)
- TSS and TA were measured according to the rules presented above (Section 2.3.3.). However, a sample of fruit with TSS content less than 11% and TA (understood as the content of citric acid) below 0.185 could not receive more than one point. Other fruit could be scored higher using ANOVA analysis. If the sample had significantly higher TSS and TA than the “minimum sample”, it received one score higher (2) compared to the lowest value. If there were differences between each harvest date, the samples received four different scores.The point scale for the minimum firmness, TSS value, and TA value was developed independently based on the research by Konopacka et al. [27], who examined the relation between texture attributes and consumer preferences.
- (5)
- Sensory tests were carried out twice: on the day after the end of storage and a week later. Fruit was evaluated by 3–5 professional judges according to the overall acceptance on the market using the following scale: 0—no acceptance on the market; 1—poor acceptance; 2—good; and 3—excellent. The average judgement was rounded to 1.0 point.
3. Results and Discussion
Weather is the main source of variability in plant development in individual years. Climate change and the potential for more extreme temperature events will impact plant productivity [28]. The largest difference in the date of the full bloom of pear trees during the study period was nearly two weeks (Table 1). Certainly, this difference had to affect the optimal harvest date (OHD).
The premature harvest of pears intended for long-term storage results in excessive transpiration, lower sugar content, and worse taste and may also cause the occurrence of physiological diseases [29]. Harvesting ‘Conference’ pears too late was found to trigger a substantially higher incidence of flesh-browning disorders, such as core browning, flesh browning, and cavities [30]. Moreover, fruit harvested too late has less storage capacity, because it becomes overripe faster and is more susceptible to fungal diseases.
‘Conference’ pears harvested on the optimal harvest date can be kept for 2 to 4 months in ordinary cold storage and for about 6 months in CA cold storage [31]. Our research confirms Conference’s high storage capacity (Supplementary Materials File S1). Various modern types of cold stores with a controlled atmosphere in which fruit metabolism is maintained on the verge between aerobic and anaerobic respiration, as well as the use of substances that slow down the ripening processes, such as 1-MCP, allow one to extend the fruit storage period [32,33] but cannot correct the negative effects of harvesting too early or too late. In such cases, even the best technology will not improve fruit quality after a few months [2]. In this study, pears were stored for at least half a year because only at the end of the storage period were the qualitative differences large enough to enable the identification of correct harvest dates. Fruit was stored from 181 days (2010) to 200 days (2008). Each of the four samples was stored for the same period of time. However, in some years, even fruits not harvested at the optimal time met the quality criteria that are set for fruits intended for trade (Supplementary Materials File S1).
A number of studies have shown that fruit firmness gradually decreases during ripening due to the progressive enzymatic degradation of cell wall polymers, alterations in the cell wall structure caused by degradation processes (e.g., polygalacturonase), and polysaccharide degradation, which leads to the breakdown of starch, cellulose, and hemicellulose. These changes result in a loss of integrity of the middle lamella, which is rich in pectins that control cell-to-cell adhesion, thus influencing the texture of the fruit [7,33,34,35].
Firmness was one of the features examined at all stages of the experiment. The first examination was carried out at least three weeks before the expected harvest date (the schedule is presented in Table 1) and was usually over or slightly below 80 N (see the data in Supplementary Materials File S1). The decrease in firmness varied between years and depended mostly on the course of the weather. On the first harvest date, fruit firmness ranged from 62.5 to 72.4 N and thus happened to match the recommendations given in Switzerland or Great Britain for ‘Conference’ pears. This is a very good result, but the firmness of the fruit harvested on subsequent dates already approached the lower firmness limit of 55 N [1,2]. Firmness can be considered a pretty accurate indicator to determine OHD; however, many studies show that it is too variable and too strongly depends on the weather, fertilisation, or rootstock [36,37,38]. This study confirms this, as the difference in firmness between OHD in individual years was 12.8 N (Table 2).
Other traditional indicators are not very stable, either. In many countries, tables illustrating the starch decomposition pattern have been created [39,40,41,42]. The starch iodine test has long shown promise as a simple means of assessing pome fruit maturity. The method is based on the enzymatic hydrolysis of starch to sugar as the fruit ripens. It starts in the core area and then proceeds in the cortical tissue in a pattern characteristic of the cultivar. However, the rate of these changes was very low, and there was practically no or only a slight difference between the starch index measurements in some years, so the error in the assessment of a sample against the standard starch–iodine staining pattern could have been several times greater.
Developed in the 1980s, Josef Streif’s 1983 maturity index [43] has been, in many countries, a very popular tool for setting the date for harvesting apples for long storage. The index is based on the determination of firmness (kg, 11 mm probe), the refractometric value (% soluble solids), and starch conversion (scale 1–10) and is calculated as follows: firmness (F) divided by refractometer value (R) and divided by starch conversion stage (S): F/RxS index. In British studies, it showed good stability for a change in the ‘Conference’ cultivar [44]. According to the authors’ recommendations, the optimal value is about 0.7. However, the results obtained in this study are different. The average value on the day of the optimal harvest was 80% higher, which suggests that for ‘Conference’ pears, the Streif index is at least debatable. Furthermore, the standard deviation shows high variability when the average index value was calculated. This can also be concluded based on different but similar recommendations made for the Streif index for the same cultivars by scientists from different countries [45,46]. Notably, some researchers do not recommend one specific value of the Streif index but recommend a certain range [47].
The highest bar in every year indicates the best storability according to the harvest date, optimal harvest date (OHD), total soluble solids (TSS), sensory test (ST) carried out on the day after storage, and ST after storage + one-week shelf life at room temperature. The data for assessment are in Supplementary Materials File S1.
Fruit ripening is an irreversible, genetically programmed, and enzymatically guided process leading to the development of a soft and edible ripe fruit with desirable quality attributes through a series of physiological, biochemical, and organoleptic changes [7,8]. Ripeness is usually considered to determine readiness for harvest. Numerous changes, such as seed maturation, change in colour, abscission from the parent plant, texture softening, production of flavour volatiles, wax development on the skin, tissue permeability, and change in carbohydrate composition, are measurable, and many of them have been considered in decisions about harvesting [44,48,49,50]. However, due to a large number of variables, the end result is unpredictable for fruits such as pears intended for long-term storage. In this research, conducted for 11 years, four harvests were conducted annually in the period during which, according to the indicators discussed above, was the right time for harvesting (Figure 1).
Analysing the assessments presented in the chart prepared to present which of the harvest dates in autumn was optimal, we can conclude that it was not easy to unambiguously determine the optimal harvest date in each year. The differences between individual harvests were very large in some years and small in other years, and in principle, this applies to each of the examined features and assessments. Firmness, which is considered one of the most important criteria (although in pears, it is less important than in apples), was found to vary significantly between samples after storage only in 3 years of the experiment (2009–2011). TSS, which, in pears, is more important than firmness, varied even less, and only fruit harvested in 2015 significantly differed after storage in terms of TSS, depending on the harvest date. A very interesting criterion is weight loss as a result of transpiration and respiration during cold storage. Since pears have less wax bloom than apples or stone fruits, they lose water during storage much more easily [51,52]. This is especially the case when pears are harvested too early. In 10 out of 11 years, the evaluation of fruit after storage allowed the definite determination of which harvest date was the best. Unclear results were obtained only in one year because, taking into account fruit physiology, the optimal harvest date was exactly between those that were rated the highest. This also confirms the assumption that OHD is not limited to only one day but rather refers to a period of at least five days [12]. During the 11-year study, the differences in the storability of pears harvested on individual dates varied. In one year (2010), no storability differences were found between two dates, and in two years of the study, those differences were very small, even though as many as seven evaluation criteria were applied. However, in some other years, the storability measured using the evaluation criteria changed very fast. This observation suggests that OHD is a period that may be affected by the course of weather conditions. In years with colder, more stable weather, firmness, TSS, TA, or starch content changes more slowly, and thus, OHD will probably last longer. Measurements and observations made in autumn after harvest mainly focused on determining the first harvest date, which may be optimal for the long storage of pears. After six months of storage, all measurements and observations focused on determining which of the four dates was optimal and associated with the greatest economic and consumer success. Autumn and winter pear cultivars can be stored in cold storage for longer than the period during which they grow on the tree. In Table 2, the second and third columns show the key dates related to fruit development. The date of full bloom depends on the beginning of vegetation and the course of the weather in spring. The difference between the earliest and last flowering dates was 13 days. The optimal harvest date between years varied even more and amounted to 19 days. The fourth column indicates how long the fruit grew; however, although calculated on the basis of the two previous columns, it is more related to the conditions in which the fruit grew, which are presented in the fifth column. The average temperature of the period from flowering to harvest clearly indicates that this factor was crucial for the length of fruit development (Figure 2). A two-degree difference in the daily average between the growing seasons in 2007 and 2008 translated into a difference of as much as 2 weeks in the period of fruit growth and development on the tree. The length of the growth period, i.e., the period between full bloom and harvest, is one of the larger variables presented in this table. The maximum difference in the length of the period needed for the proper development of fruit is 24 days. The data clearly show that temperature is the basic factor affecting the length of fruit development. It affects the rate of all processes occurring in nature. According to van’t Hoff’s law, a temperature increase of 10 °C leads to a 2- to 4-fold increase in the rate of chemical reactions [53]. Thus, the sum of active temperatures must be a good OHD indicator. In the conducted studies, SAT was determined on the basis of data from 11 years.
The literature gives very different, in some cases even negative, base temperatures [26]. Most often, the base temperature is between zero and ten degrees Celsius. To determine the harvest date for ‘Conference’ pears, meteorological data were recalculated in relation to the different base temperatures most often found in the literature. The result characterised by a smaller standard deviation of only 20 was obtained by calculating the sum of active temperatures for base temperatures equal to zero degrees. Using a higher base temperature in the calculation always led to a much larger variation in the results between individual years, as reflected by the increasing standard deviation. The presented research found that the sum of active temperatures allowing one to determine the optimal harvest date for ‘Conference’ pears is 2469 degree days.
4. Conclusions
‘Conference’ is a European pear cultivar characterised by high storability. Fruit collected at an optimal point in time can be stored without loss in a controlled atmosphere for half a year. A system for determining the optimal harvest date can be relatively easily developed by any producer. Using the sum of active temperatures to determine the optimal harvest date for ‘Conference’ ensures great accuracy. The calculations carried out as part of the research presented in this paper show that a harvest carried out after the SAT has achieved the value of 2469 degrees will be optimal, with a possible error of only one day. Active temperatures were calculated most accurately using a base temperature of 0 °C;. The length of the harvest window is a minimum of 5 days. The application of this method is relatively simple and requires only access to meteorological data. Automated metrological stations, which are often installed in orchards, are the only devices needed to determine the optimal harvest date.
Supplementary Materials
The following supporting information can be downloaded at: https://0-www-mdpi-com.brum.beds.ac.uk/article/10.3390/agriculture12111803/s1. File S1: Firmness date, TSS, Starch, Streiff Index, Disorders and diseases, and Mass Loss.
Funding
This research received no external funding.
Institutional Review Board Statement
Not applicable.
Informed Consent Statement
Not applicable.
Data Availability Statement
Preliminary data are in either Supplementary Material or the article body and are available on request from the author.
Acknowledgments
I would like to thank my co-workers from the Department of Pomology of Poznan Life Sciences University for their help in collecting data and performing measurements used for the calculations under this study. Special thanks to Łukasz Suterski and Krzysztof Rutkowski.
Conflicts of Interest
The author declares no conflict of interest.
References
- USDA United States Department of Agriculture. Global Agricultural Information Network. Prognosfruit 2020. Available online: https://apps.fas.usda.gov/newgainapi/api/Report/DownloadReportByFileName?fileName=Prognosfruit%202020%20_Berlin_European%20Union_08–18–2020 (accessed on 22 May 2022).
- Łysiak, G.P.; Rutkowski, K.; Walkowiak-Tomczak, D. Effect of Storage Conditions on Storability and Antioxidant Potential of Pears cv. ‘Conference’. Agriculture 2021, 11, 545. [Google Scholar] [CrossRef]
- Kolniak-Ostek, J.; Kłopotowska, D.; Rutkowski, K.P.; Skorupińska, A.; Kruczyńska, D.E. Bioactive Compounds and Health-Promoting Properties of Pear (Pyrus communis L.) Fruits. Molecules 2020, 25, 4444. [Google Scholar] [CrossRef] [PubMed]
- Elgar, H.J.; Watkins, C.B.; Murray, S.H.; Gunson, F.A. Quality of “Buerre Bosc” and “Doyenne du Comice” pears in relation to harvest date and storage period. Postharvest Biol. Technol. 1997, 10, 29–37. [Google Scholar] [CrossRef]
- Saquet, A.A. Storage of pears. Sci. Hortic. 2019, 246, 1009–1016. [Google Scholar] [CrossRef]
- Raese, J.T.; Drake, S.R. Effect of calcium sprays, time of harvest, cold storage and ripeness on fruit quality of ‘Anjou’ pears. J. Plant Nutr. 2000, 23, 843–853. [Google Scholar] [CrossRef]
- Valero, D.; Serrano, M. Postharvest Biology and Technology for Preserving Fruit Quality; CRC Press: Boca Raton, FL, USA, 2010; ISBN 1–4398–0267-X. [Google Scholar]
- Kader, A.A. Postharvest Technology of Horticultural Crops; University of California: Berkeley, CA, USA, 1992. [Google Scholar]
- Tomala, K. Orchard factors affecting fruit storage quality and prediction of harvest date of apples. Acta Hortic. 1999, 489, 373–382. [Google Scholar] [CrossRef]
- Łysiak, G. Measurement of ethylene production as a method for determining the optimum harvest date of ‘Jonagored’ apples. Folia Hortic. 2014, 26, 117–124. [Google Scholar] [CrossRef] [Green Version]
- Skic, A.; Szymańska-Chargot, M.; Kruk, B.; Chylińska, M.; Pieczywek, P.M.; Kurenda, A.; Zdunek, A.; Rutkowski, K.P. Determination of the Optimum Harvest Window for Apples Using the Non-Destructive Biospeckle Method. Sensors 2016, 16, 661. [Google Scholar] [CrossRef] [Green Version]
- Łysiak, G. The determination of harvest index of Šampion apples intended for long storage. Acta Sci. Pol. Hortorum Cultus 2011, 10, 273–282. [Google Scholar]
- Hay, B. A brief history of the thermal properties metrology. Measurement 2020, 155, 107556. [Google Scholar] [CrossRef]
- de Oliveira Aparecido, L.E.; de Souza Rolim, G. Models for simulating the frequency of pests and diseases of Coffea arabica L. Int. J. Biometeorol. 2020, 64, 1063–1084. [Google Scholar] [CrossRef] [PubMed]
- Szyga-Pluta, K. Assessment of Changing Agroclimatic Conditions in Poland Based on Selected Indicators. Atmosphere 2022, 13, 1232. [Google Scholar] [CrossRef]
- Cortázar-Atauri, G.I.; Brisson, N.; Gaudillere, J.P. Performance of several models for predicting budburst date of grapevine (Vitis vinifera L.). Int. J. Biometeorol. 2009, 53, 317–326. [Google Scholar] [CrossRef] [PubMed]
- Mandelli, F.; Berlato, M.A.; Tonietto, J.; Bergamaschi, H. Predicting the date of budbreak of grapevine grown in the Serra Gaucha region. J. Int. Des Sci. Vigne Vin 2003, 37, 229–235. [Google Scholar] [CrossRef] [Green Version]
- Zapata, D.; Salazar, M.; Chaves, B.; Keller, M.; Hoogenboom, G. Estimation of the base temperature and growth phase duration in terms of thermal time for four grapevine cultivars. Int. J. Biometeorol. 2015, 59, 1771–1781. [Google Scholar] [CrossRef]
- Szot, I.; Łysiak, G.P. Effect of the Climatic Conditions in Central Europe on the Growth and Yield of Cornelian Cherry Cultivars. Agriculture 2022, 12, 1295. [Google Scholar] [CrossRef]
- Bieniek, A.; Dragańska, E.; Pranckietis, V. Assesment of climatic conditions for Actinidia arguta cultivation in north-eastern Poland. Zemdirb. Agric. 2016, 103, 311–318. [Google Scholar] [CrossRef] [Green Version]
- Litschmann, T.; Oukropec, I.; Krizan, B. Predicting individual phenological phases in peaches using meteorological data. Hortic. Sci. 2008, 35, 65–71. [Google Scholar] [CrossRef] [Green Version]
- Di Paola, A.; Chiriacò, M.V.; Di Paola, F.; Nieddu, G. A Phenological Model for Olive (Olea europaea L. var europaea) Growing in Italy. Plants 2021, 10, 1115. [Google Scholar] [CrossRef]
- Dinu, D.G.; Ricciardi, V.; Demarco, C.; Zingarofalo, G.; De Lorenzis, G.; Buccolieri, R.; Cola, G.; Rustioni, L. Climate Change Impacts on Plant Phenology: Grapevine (Vitis vinifera) Bud Break in Wintertime in Southern Italy. Foods 2021, 10, 2769. [Google Scholar] [CrossRef]
- Bokhorst, S.; Convey, P.; Casanova-Katny, A.; Aerts, R. Warming impacts potential germination of non-native plants on the Antarctic Peninsula. Commun. Biol. 2021, 25, 403. [Google Scholar] [CrossRef] [PubMed]
- Łysiak, G. The Sum of Active Temperatures as a Method of Determining the Optimum Harvest Date of ‘Šampion’ and ‘Ligol’ Apple Cultivars. Acta Sci. Pol. Hort. Cultus 2012, 11, 3–13. [Google Scholar]
- Yang, S.; Logan, J.; Coffey, D. Mathematical formulae for calculating the base temperature for growing degree days. Agr. Forest Meteorol. 1995, 74, 61–74. [Google Scholar] [CrossRef]
- Konopacka, D.; Rutkowski, K.P.; Kruczyńska, D.E.; Skorupińska, D.; Płocharski, W. Quality Potential of Some New Pear Cultivars–How to Obtain Fruit of The Best Sensory Characteristics? J. Hortic. Res. 2014, 22, 71–84. [Google Scholar] [CrossRef] [Green Version]
- Hatfield, J.L.; Prueger, J.H. Temperature extremes: Effect on plant growth and development. Weather. Clim. Extrem. 2015, 10, 4–10. [Google Scholar] [CrossRef] [Green Version]
- Wawrzynczak, A.; Rutkowski, K.P.; Kruczynska, D.E. Ripening Of ‘Radana’ And ‘Conference’ Pears as Influenced by Cold Storage Duration. Acta Hortic. 2008, 800, 1091–1098. [Google Scholar] [CrossRef]
- Streif, J.; Xuan, H.; Saquet, A.A.; Rabus, C. CA-storage related disorders in ‘Conference’ pears. Acta Hortic. 2001, 553, 635–638. [Google Scholar] [CrossRef]
- Saquet, A. Storability of ‘Conference’ Pear Under Various Controlled Atmospheres. Erwerbs Obstbau 2018, 60, 5. [Google Scholar] [CrossRef]
- Streif, J. Ripening Management and Postharvest Fruit Quality. Acta Hortic. 2010, 858, 121–129. [Google Scholar] [CrossRef]
- Błaszczyk, J.; Gasparski, K. Influence of 1-methylocyclopropene (1-MCP) on the quality and storability of ‘Red Jonaprince’ apples stored in different conditions. Acta Sci. Pol. Hortoru. 2019, 18, 7–15. [Google Scholar] [CrossRef]
- Li, X.; Xu, C.; Korban, S.S.; Chen, K. Regulatory Mechanisms of Textural Changes in Ripening Fruits. Crit. Rev. Plant Sci. 2010, 29, 222–243. [Google Scholar] [CrossRef]
- Zdunek, A.; Cybulska, J.; Konopacka, D.; Rutkowski, K. New contact acoustic emission detector for texture evaluation of apples. J. Food Eng. 2010, 99, 83–91. [Google Scholar] [CrossRef]
- Konopacka, D.; Plocharski, W.J. Effect of storage conditions on the relationship between apple firmness and texture acceptability. Postharvest Biol. Technol. 2004, 32, 205–211. [Google Scholar] [CrossRef]
- Lachapelle, M.; Bourgeois, G.; DeEll, J.R. Effects of Preharvest Weather Conditions on Firmness of ‘McIntosh’ Apples at Harvest Time. Hort. Sci. 2013, 48, 474–480. [Google Scholar] [CrossRef]
- Lipa, T.; Szot, I. Effect of fertilization methods on growth of pear trees, yielding and fruit quality. Mod. Phytomorphol. 2013, 4, 55–58. [Google Scholar]
- Yuri, J.A.; Moggia, C.; Sepulveda, A.; Poblete-Echeverría, C.; Valdés-Gómez, H.; Torres, C.A. Effect of cultivar, rootstock, and growing conditions on fruit maturity and postharvest quality as part of a six-year apple trial in Chile. Sci. Hortic. 2019, 253, 70–79. [Google Scholar] [CrossRef]
- Doerflinger, F.C.; Miller, W.B.; Nock, J.F.; Watkins, C.B. Relationships between starch pattern indices and starch concentrations in four apple cultivars. Postharvest Biol. Technol. 2015, 110, 86–95. [Google Scholar] [CrossRef]
- Menesatti, P.; Zanella, A.; D’Andrea, S.; Costa, C.; Paglia, G.; Pallottino, F. Supervised multivariate analysis of Hyper-spectral NIR images to evaluate the starch index of apples. Food Bioprocess. Technol. 2009, 2, 308–314. [Google Scholar] [CrossRef]
- Neuwald, D.A.; Streif, J.; Kittemann, D. Fruit Starch Degradation Patterns in Apple Cultivars on-Tree and off-Tree at Different Holding Temperatures. Acta Hortic. 2010, 858, 263–266. [Google Scholar] [CrossRef]
- Streif, J. Der optimale Erntetermin beim Apfel. Qualitätsentwicklung und Reife. Gartenbauwissemschaft 1983, 48, 154–159. (In German) [Google Scholar]
- Johnson, D.S.; Luton, M.T. Maturity indices to predict optimum harvest date for the storage of Conference pears in the UK COST 94. The postharvest treatment of fruit and vegetables. In Proceedings of the Meeting of the Working Group on Optimum Harvest Date, Lofthus, Norway, 9–10 June 1996; pp. 133–147. [Google Scholar]
- de Jager, A.; Roelofs, F.P.M.M. Prediction of optimum harvest date of Jonagold. COST 94. The postharvest treatment of fruit and vegetables. In Proceedings of the Meeting of the Working Group on Optimum Harvest Date, Lofthus, Norway, 9–10 June 1996; pp. 22–31. [Google Scholar]
- Meresz, P.; Sass, P.; Lovasz, T. Evaluation of harvest indexes of apples grown in Hungary COST 94. The postharvest treatment of fruit and vegetables. In Proceedings of the Meeting of the Working Group on Optimum Harvest Date, Lofthus, Norway, 9–10 June 1996; pp. 53–60. [Google Scholar]
- Baumann, H. Optimum harvest date of some apple varieties in the ‘Rhineland’ from 1989 to 1992. COST 94. The postharvest treatment of fruit and vegetables. In Proceedings of the Meeting of the Working Group on Optimum Harvest Date, Lofthus, Norway, 9–10 June 1996; pp. 33–38. [Google Scholar]
- Łysiak, G.; Kurlus, R.; Zydlik, Z.; Walkowiak-Tomczak, D. Apple skin colour changes during harvest as an indicator of maturity. Acta Sci. Pol. Hortorum Cultus 2014, 13, 71–83. [Google Scholar]
- Tomala, K.; Guzek, D.; Głąbska, D.; Małachowska, M.; Widłak, Ł.; Krupa, T.; Gutkowska, K. Maintaining the Quality of ‘Red Jonaprince’ Apples during Storage by 1-Methylcyclopropene Preharvest and Postharvest Treatment. Agriculture 2022, 12, 1189. [Google Scholar] [CrossRef]
- Łysiak, G.; Walkowiak-Tomczak, D. Quality of Plum Fruits after Storage Depended of Quality Parameters during Harvest. Ecol. Chem. Eng. A 2010, 17, 1361–1367. [Google Scholar]
- Nečas, T.; Wolf, J.; Kiss, T.; Gottingerová, M.; Ivo, O.; Bieniasz, M. Evaluation of certain pomological and phenological traits of selected asian pear varieties growing in Middle European conditions. Hort. Sci. 2020, 47, 81–92. [Google Scholar] [CrossRef]
- Xanthopoulos, G.T.; Templalexis, C.G.; Aleiferis, N.P.; Lentzou, D.I. The contribution of transpiration and respiration in water loss of perishable agricultural products: The case of pears. Biosyst. Eng. 2017, 158, 76–85. [Google Scholar] [CrossRef]
- Tellinghuisen, J. Van’t Hoff analysis of K° (T): How good… or bad? Biophys. Chem. 2006, 120, 114–120. [Google Scholar] [CrossRef]
Figure 1.
Assessment according to a point scale of the quality aspects of fruit samples harvested on the respective dates examined after storage in the years 2007–2017. Numbers on the bars (1,2,3,4) show scores received for each criterion following the rules described in Materials and Methods. OHD—optimal harvest date. + and − signs on the x-axis show how many days after or before OHD the harvest occurred.

Figure 2.
Scatter plot with correlation coefficient between number of days between full bloom and OHD.
Figure 2.
Scatter plot with correlation coefficient between number of days between full bloom and OHD.


Table 1.
Schedule of the experiment.
| No. of Measurement | Years and Dates | ||||||||||
|---|---|---|---|---|---|---|---|---|---|---|---|
| 2007 | 2008 | 2009 | 2010 | 2011 | 2012 | 2013 | 2014 | 2015 | 2016 | 2017 | |
| Date of full bloom | 21 April | 23 April | 25 April | 21 April | 30 April | 24 April | 17 April | 19 April | 25 April | 29 April | 18 April |
| 1 M | 28 Aug. | - | 15 Aug. | 16 Aug. | 25 Aug. | 24 Aug. | 17 Aug. | 23 Aug. | 29 Aug. | - | - |
| 2 M | 01 Sept. | 15 Aug. | 20 Aug. | 21 Aug. | 30 Aug. | 28 Aug. | 21 Aug. | 27 Aug. | 02 Sept. | 24 Aug. | 01 Sept. |
| 3 M | 05 Sept. | 20 Aug. | 24 Aug. | 25 Aug. | 03 Sept. | 01 Sept. | 26 Aug. | 01 Sept. | 05 Sept. | 27 Aug. | 05 Sept. |
| 4 M | 10 Sept. | 25 Aug. | 28 Aug. | 30 Aug. | 08 Sept. | 06 Sept. | 30 Aug. | 04 Sept. | 09 Sept. | 31 Sept. | 09 Sept. |
| 5 M, 1 S | 15 Sept. | 29 Aug. | 02 Sept. | 03 Sept. | 12 Sept. | 11 Sept. | 04 Sept. | 08 Sept. | 13 Sept. | 07 Sept. | 13 Sept. |
| 6 M, 2 S | 19 Sept. | 03 Sept. | 07 Sept. | 07 Sept. | 17 Sept. | 16 Sept. | 09 Sept. | 12 Sept. | 17 Sept. | 12 Sept. | 18 Sept. |
| 7 M, 3 S | 24 Sept. | 08 Sept. | 12 Sept. | 11 Sept. | 21 Sept. | 20 Sept. | 13 Sept. | 16 Sept. | 21 Sept. | 16 Sept. | 22 Sept. |
| 8 M, 3 S | 29 Sept. | 13 Sept. | 16 Sept. | 16 Sept. | 26 Sept. | 24 Sept. | 18 Sept. | 20 Sept. | 25 Sept. | 20 Sept. | 26 Sept. |
| Date of end of storage of first harvest in days | 22 March 2008 | 16 March 2009 | 07 March 2010 | 02 March 2011 | 15 March 2012 | 20 March 2013 | 12 March 2014 | 21 March 2015 | 10 March 2016 | 21 March 2017 | 17 March 2018 |
| Length of storage in days | 190 | 200 | 185 | 181 | 186 | 190 | 190 | 195 | 185 | 190 | |
M—measurements; S—storage. The number together with the letter indicates the number of measurements used to make the decision to harvest or the number of the harvest of the fruit to be stored.
Table 2.
Maturity indices.
| Year | Date | AT | Maturity Indicators | ||||||||||||||
|---|---|---|---|---|---|---|---|---|---|---|---|---|---|---|---|---|---|
| F | OHD | No. | Sum of Active Temperatures | Quality Parameters | |||||||||||||
| 0 °C | 1 °C | 2 °C | 3 °C | 5 °C | 10 °C | 15 °C | FR | TSS | SDI | StI | TA | TSS/ TA | |||||
| 2007 | 21 Apr. | 15 Sept. | 147 | 16.6 | 2457 | 2309 | 2161 | 2013 | 1719 | 1002 | 405 | 65.9 | 10.8 | 7.4 | 1.25 | 0.186 | 58.2 |
| 2008 | 23 Apr. | 03 Sept. | 133 | 18.6 | 2495 | 2362 | 2227 | 2093 | 1825 | 1155 | 527 | 65.6 | 11.5 | 7.0 | 1.26 | 0.278 | 41.3 |
| 2009 | 25 Apr. | 07 Sept. | 135 | 18.2 | 2478 | 2343 | 2206 | 2070 | 1798 | 1111 | 502 | 63.2 | 11.4 | 6.6 | 1.71 | 0.182 | 62.5 |
| 2010 | 21 Apr. | 11 Sept. | 143 | 17.1 | 2467 | 2324 | 2179 | 2035 | 1747 | 1046 | 463 | 60.2 | 11.4 | 8.2 | 0.97 | 0.171 | 66.9 |
| 2011 | 30 Apr. | 17 Sept. | 140 | 17.3 | 2427 | 2287 | 2145 | 2004 | 1713 | 1032 | 402 | 70.2 | 11.2 | 8.7 | 1.08 | 0.188 | 59.6 |
| 2012 | 24 Apr. | 16 Sept. | 145 | 17.0 | 2478 | 2333 | 2186 | 2040 | 1748 | 1023 | 391 | 63.4 | 12.2 | 6.2 | 1.72 | 0.180 | 68.1 |
| 2013 | 17 Apr. | 04 Sept. | 140 | 17.5 | 2467 | 2327 | 2185 | 2044 | 1762 | 950 | 435 | 64.2 | 11.5 | 7.0 | 1.22 | 0.314 | 36.7 |
| 2014 | 19 Apr. | 12 Sept. | 146 | 16.6 | 2446 | 2300 | 2152 | 2005 | 1692 | 1078 | 407 | 65.2 | 11.5 | 7.3 | 1.21 | 0.188 | 61.1 |
| 2015 | 25 Apr. | 17 Sept. | 145 | 17.1 | 2480 | 2335 | 2188 | 2042 | 1750 | 1047 | 454 | 64.0 | 12.6 | 8.3 | 0.94 | 0.195 | 65.4 |
| 2016 | 29 Apr. | 16 Sept. | 140 | 17.6 | 2487 | 2347 | 2205 | 2064 | 1782 | 1070 | 436 | 61.0 | 12.1 | 7.2 | 1.09 | 0.153 | 78.9 |
| 2017 | 18 Apr. | 22 Sept. | 157 | 15.7 | 2479 | 2322 | 2163 | 2003 | 1670 | 968 | 342 | 63.8 | 11.5 | 8.3 | 1.02 | 0.186 | 61.8 |
| Mean | 23 Apr. | 13 Sept. | 142.8 | 17.2 | 2469 | 2326 | 2182 | 2037 | 1746 | 1044 | 433 | 64.2 | 11.6 | 7.47 | 1.22 | 0.202 | 60.0 |
| MD | 13 | 19 | 24 | 2.93 | 68 | 75 | 82 | 90 | 155 | 205 | 185 | 12.8 | 1.8 | 2.5 | 0.75 | 0.130 | 42.2 |
| SD | 4.0 | 5.7 | 6.2 | 0.76 | 20 | 22 | 25 | 45 | 46 | 60 | 52 | 3.6 | 0.5 | 0.80 | 0.27 | 0.046 | 11.9 |
F—date of full bloom; OHD—optimal harvest date; No.—number of days from full bloom until OHD; AT—average air temperature during vegetation between full bloom and OHD; FR—firmness; TSS—total soluble solids; SDI—starch disintegration index; StI—Streiff index; TA—titratable acidity; MD—maximum difference; SD—standard deviation.
Publisher’s Note: MDPI stays neutral with regard to jurisdictional claims in published maps and institutional affiliations. |
© 2022 by the author. Licensee MDPI, Basel, Switzerland. This article is an open access article distributed under the terms and conditions of the Creative Commons Attribution (CC BY) license (https://creativecommons.org/licenses/by/4.0/).
Share and Cite
MDPI and ACS Style
Łysiak, G.P. Degree Days as a Method to Estimate the Optimal Harvest Date of ‘Conference’ Pears. Agriculture 2022, 12, 1803. https://0-doi-org.brum.beds.ac.uk/10.3390/agriculture12111803
AMA Style
Łysiak GP. Degree Days as a Method to Estimate the Optimal Harvest Date of ‘Conference’ Pears. Agriculture. 2022; 12(11):1803. https://0-doi-org.brum.beds.ac.uk/10.3390/agriculture12111803
Chicago/Turabian StyleŁysiak, Grzegorz P. 2022. "Degree Days as a Method to Estimate the Optimal Harvest Date of ‘Conference’ Pears" Agriculture 12, no. 11: 1803. https://0-doi-org.brum.beds.ac.uk/10.3390/agriculture12111803
Note that from the first issue of 2016, this journal uses article numbers instead of page numbers. See further details here.