
LA-DeepLab V3+: A Novel Counting Network for Pigs


1
Department of Computer Science and Technology, College of Information and Electrical Engineering, China Agricultural University, Beijing 100083, China
2
Office of Model Animals, National Research Facility for Phenotypic and Genotypic Analysis of Model Animals, China Agricultural University, Beijing 100083, China
3
Department of Information, School of Information, University of Michigan, Ann Arbor, MI 48109, USA
*
Author to whom correspondence should be addressed.
Agriculture 2022, 12(2), 284; https://0-doi-org.brum.beds.ac.uk/10.3390/agriculture12020284
Submission received: 19 January 2022
/
Revised: 12 February 2022
/
Accepted: 15 February 2022
/
Published: 17 February 2022
(This article belongs to the Special Issue Digital Innovations in Agriculture)
Abstract
:Accurate identification and intelligent counting of pig herds can effectively improve the level of fine management of pig farms. A semantic segmentation and counting network was proposed in this study to improve the segmentation accuracy and counting efficiency of pigs in complex image segmentation. In this study, we built our own datasets of pigs under different scenarios, and set three levels of number detection difficulty—namely, lightweight, middleweight, and heavyweight. First, an image segmentation model of a small sample of pigs was established based on the DeepLab V3+ deep learning method to reduce the training cost and obtain initial features. Second, a lightweight attention mechanism was introduced, and attention modules based on rows and columns can accelerate the efficiency of feature calculation and reduce the problem of excessive parameters and feature redundancy caused by network depth. Third, a recursive cascade method was used to optimize the fusion of high- and low-frequency features for mining potential semantic information. Finally, the improved model was integrated to build a graphical platform for the accurate counting of pigs. Compared with FCNNs, U-Net, SegNet, and DenseNet methods, the DeepLab V3+ experimental results show that the values of the comprehensive evaluation indices P, R, AP, F1-score, and MIoU of LA-DeepLab V3+ (single tag) are higher than those of other semantic segmentation models, at 86.04%, 75.06%, 78.67%, 0.8, and 76.31%, respectively. The P, AP, and MIoU values of LA-DeepLab V3+ (multiple tags) are also higher than those of other models, at 88.36%, 76.75%, and 74.62%, respectively. The segmentation accuracy of pig images with simple backgrounds reaches 99%. The pressure test of the counting network can calculate the number of pigs with a maximum of 50, which meets the requirements of free-range breeding in standard piggeries. The model has strong generalization ability in pig herd detection under different scenarios, which can serve as a reference for intelligent pig farm management and animal life research.
1. Introduction
Group free-range breeding will be the mainstream breeding method of pig farms in the future, and the increase in the number of pigs will lead to an increase in manual inspection [1]. The achievement of automatic pig identification, trajectory tracking, and quantity statistics by using computer vision technology has become a current research hotspot [2]. In this field, foreground segmentation of pig herd images and separation of adhesive individual images are the basis for achieving automatic inventory of pig numbers [3]. Owing to the complexity of pig images, such as light changes, crowding, stacking, and occlusion, the existing semantic segmentation technology still faces problems, such as missing segmentation and mis-segmentation, which result in inaccurate counting [4,5]. Therefore, enhancing the characterization ability of high- and low-frequency detail information of images, along with improving the utilization rate of individual characteristic information of pigs, are the key research directions to improve the semantic segmentation accuracy of pig images [6].
Fully convolutional neural networks (FCNNs) [7] have promoted the rapid development of semantic segmentation algorithms. Deformable convolution [8] enhances the adaptability of the model to scale transformation by adding direction vectors to each parameter of the convolution kernel and adaptively adjusting the scale and receptive field [9]. U-Net [10] introduces different scale features in the coding layer through the jump connection structure to recover the lost information and achieve accurate positioning of pixels. SegNet [11], based on a codec structure, saves the pooled index in the coding stage, accurately recovers image size and spatial information, and effectively retains the integrity of high-frequency details. Compared with U-Net, SegNet cannot capture multiscale information effectively, while U-Net has many learning parameters, so its training is relatively slow. PSPNet [12], based on a multiscale feature aggregation structure, uses a pyramid pooling module to capture feature information of different regions for alleviating the problem of multiple scale changes. DeepLab series models [13,14,15] combine DCNNs and dense CRFs to achieve better detection accuracy. Google introduced deep detachable convolution in atrous spatial pyramid pooling (ASPP) [13] and a decoder [16] to reduce the computational complexity of the network, in order to achieve a better DeepLab V3+ network [14]. However, the internal parallel structure of ASPP in DeepLab V3+ models makes the branch information independent, and lacks spatial correlation. The decoding phase only fuses one of the multistage shallow features on the backbone network, resulting in partial loss of effective information, segmentation discontinuity, and rough segmentation boundaries. In feature fusion, high-level feature output is directly fused with shallow features in the backbone network, thus ignoring the noise problem introduced into the semantic feature graph due to the misalignment of high–low features, and damaging the semantic segmentation accuracy [17].
The attention mechanism module has been widely applied in image classification, target detection, and tracking tasks [18,19,20]; it has recurrent models of visual attention [21] and residual attention networks for image classification [22], all of which use the attention mechanism to generate high-level feature maps to guide the forward propagation of the network. Squeeze-and-excitation networks (SENet) [23] compress the feature graph channels into a single point to obtain the category properties between the channels. Finally, the gate mechanism fuses the channel relationship into the original feature graph to obtain the final feature graph. EncNet [24] and DFNs [25] use the channel attention mechanism to obtain global context information of the image and construct dependencies between categories. Subakan et al. [26] first proposed the self-attention mechanism and acquired the global dependence of input information, which was eventually applied to the field of machine translation. In addition, self-attention generative adversarial networks [27] introduce the self-attention mechanism module to provide a better image generator for generating better images. DANet [28] adopts self-attention and channel attention mechanisms to establish long-term context-dependent relationships in the spatial and channel dimensions, respectively. At present, few attention mechanisms are applied to complex images of pigs—in particular, the extraction of rich detail information and small target information in complex images of pigs needs to be improved.
On the basis of the abovementioned existing methods, this study proposes a semantic segmentation network with a light attention mechanism. The main contributions of this work are as follows:
- (1)
- The current DeepLab V3+ semantic segmentation framework has too many network layers and slow speed. Thus, by embedding the attention module based on rows and columns into the backbone network, we can achieve the lightweight and fast network computing efficiency that the traditional semantic segmentation algorithm and other attention modules do not have;
- (2)
- In view of the problem of detail information loss in semantic segmentation algorithms, a recursive cascade mechanism is introduced to supplement the detail information of the unit input feature graph to the output feature graph. This approach better integrates the high-level semantic information into the low-level high-resolution feature graph, improving the segmentation accuracy;
- (3)
- This study integrates deep learning models and attention mechanisms, and it preliminarily achieves the application of complex image inventory of pigs.
2. Materials and Methods
2.1. Self-Built Datasets
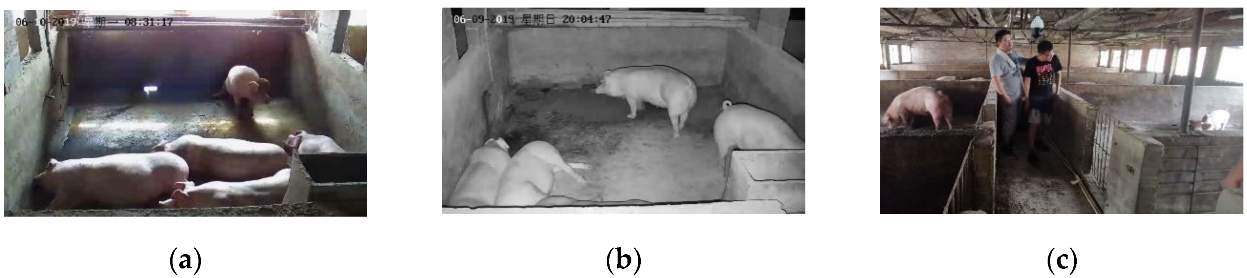
The basic dataset was collected from large-scale breeding farms in Nanyang city, Henan Province. The collection period was from June to December 2019. The collection device was a Hikvision Smart Ball Camera (DS-2DE4320IW-DEDS-2DE4320IW-D, made in Hangzhou, China), which had 3 million pixels and 20 × optical zoom; its infrared radiation at night could reach 100 m. As shown in Figure 1, the pigs were 80-day-weaned Yorkshire piglets. The basic dataset was characterized by single-pig and multi-pig (5–7) scenarios. The collection environment included different weather conditions—such as cloudy day, sunny day, and rainy day—to test the robustness of the algorithm.
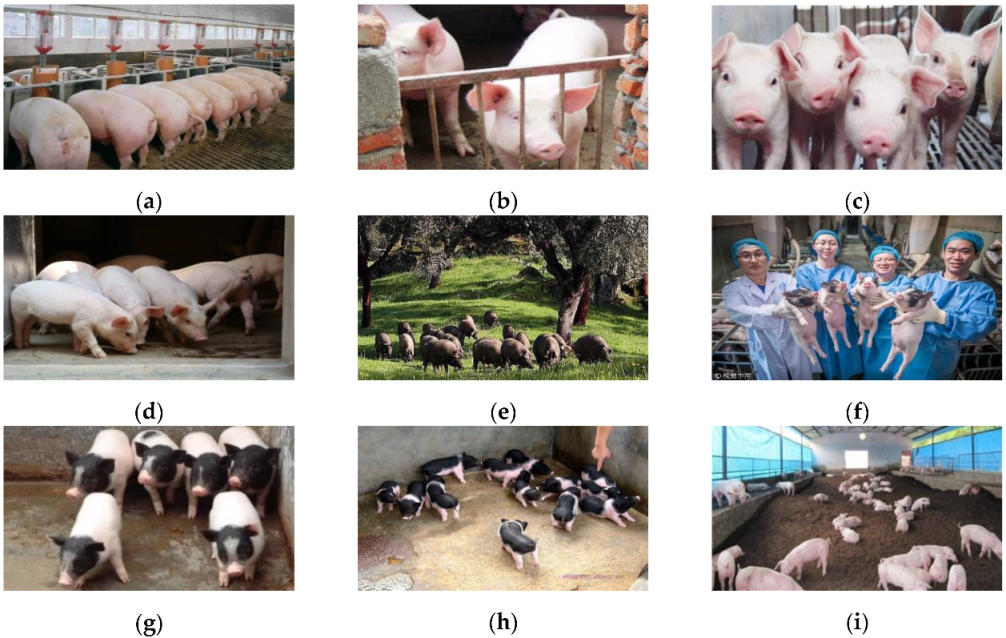
The extended dataset included different species and orders of magnitude in all weather, captured via the Internet. The self-built dataset consisted of 5000 images with a normalized resolution of 512 × 256 pixels. In this study, 4500 typical images were selected for annotation, among which 3500 were selected as training set images and 1000 as verification set images. The remaining 500 unlabeled images were used as the test set. As shown in Figure 2, the extended dataset was characterized by a typical complex environment, including human beings, weeds, trees, and light, as well as adhesion and occlusion of the images themselves. In addition, different orders of magnitude of pig groups were set to verify the segmentation and counting ability of the model. This approach increased the generalization and robustness of the segmentation model.
2.2. Experimental Design
In this work, the software environment was the Windows 10 operating system. Python was the programming language, and TensorFlow was the open-source framework for deep learning. The hardware environment was an NVIDIA RTX3060 16 G graphics card, Intel(R) Core(TM) I7-11800H CPU, and 16 GiB DDR.
To better evaluate the model correctly, this study adopted the evaluation indices commonly used in semantic segmentation: precision (P, %), recall (R, %), average precision (AP, %), F1 score (F1), mean intersection over union (MIoU, %), and algorithm running efficiency in frames per second (fps). Calculation of each evaluation index is shown in Equations (3)–(5):
where TP represents the positive sample for which the model prediction is positive, FP represents the positive sample for which the model prediction is negative, FN represents the positive sample for which the model prediction is negative, TN represents the negative sample for which the model prediction is negative, and AP is the integration of precision in recall. The model performance is better when the AP value is higher. F1 score is the harmonic average of precision and recall, and its value range is (0,1). MIoU is the most direct evaluation index in image segmentation; it is the average union ratio of two sets of real value and predicted value, and k + 1 is the number of categories (including empty classes).
2.3. Improved Light Attention DeepLab V3+ Method
2.3.1. Original DeepLab V3+ Model Analysis
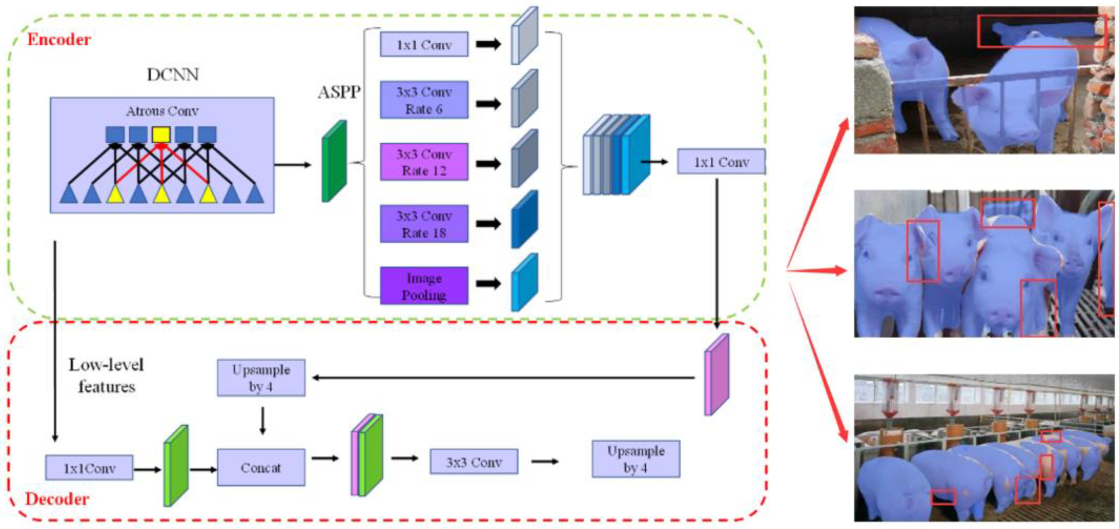
The encoding module of the DeepLab V3+ network extracted high-level semantic feature maps of images through ResNet101 and connected to ASPP modules with multiple cavity convolution dilation rates. After multiscale sampling of the high-level feature graph and combination in the channel dimension, the multiscale low-dimensional feature matrix was obtained using a convolution kernel with a size of 1 × 1. The decoding module sampled the feature graph four times and fused it with the low-level feature image in the middle of ResNet101. After the bilinear insertion sampling, the segmentation graph was output. The network structure of DeepLab V3+ is shown in Figure 3. When the DeepLab V3+ network was used in the field of pig segmentation, problems such as rough contour segmentation and complex background segmentation errors could be found in this network.
2.3.2. Lightweight Attention Mechanism
The feature map of the coding module acquired the high-level semantic information of the image, while ResNet101 sampled the low-level details of the image. This not only increased the amount of feature computation, but also lost many key features, leading to the noise problem in the fusion of high- and low-frequency features. Domestic and foreign scholars have proposed various attention mechanisms—such as nonlocal attention mechanisms [29], dual attention mechanisms [30], and cross-attention mechanisms [31]—to improve the performance of segmentation models. All of the abovementioned attention mechanisms improved the segmentation model to varying degrees, but greatly increased the required computational resources at the same time. Therefore, this study proposed an attention module and a recursive cascade mechanism based on rows and columns. On the one hand, this method could aggregate global information more effectively and increase the network’s receptive field. On the other hand, the attention module had very little effect on video memory and computation due to the lightweight module design method.
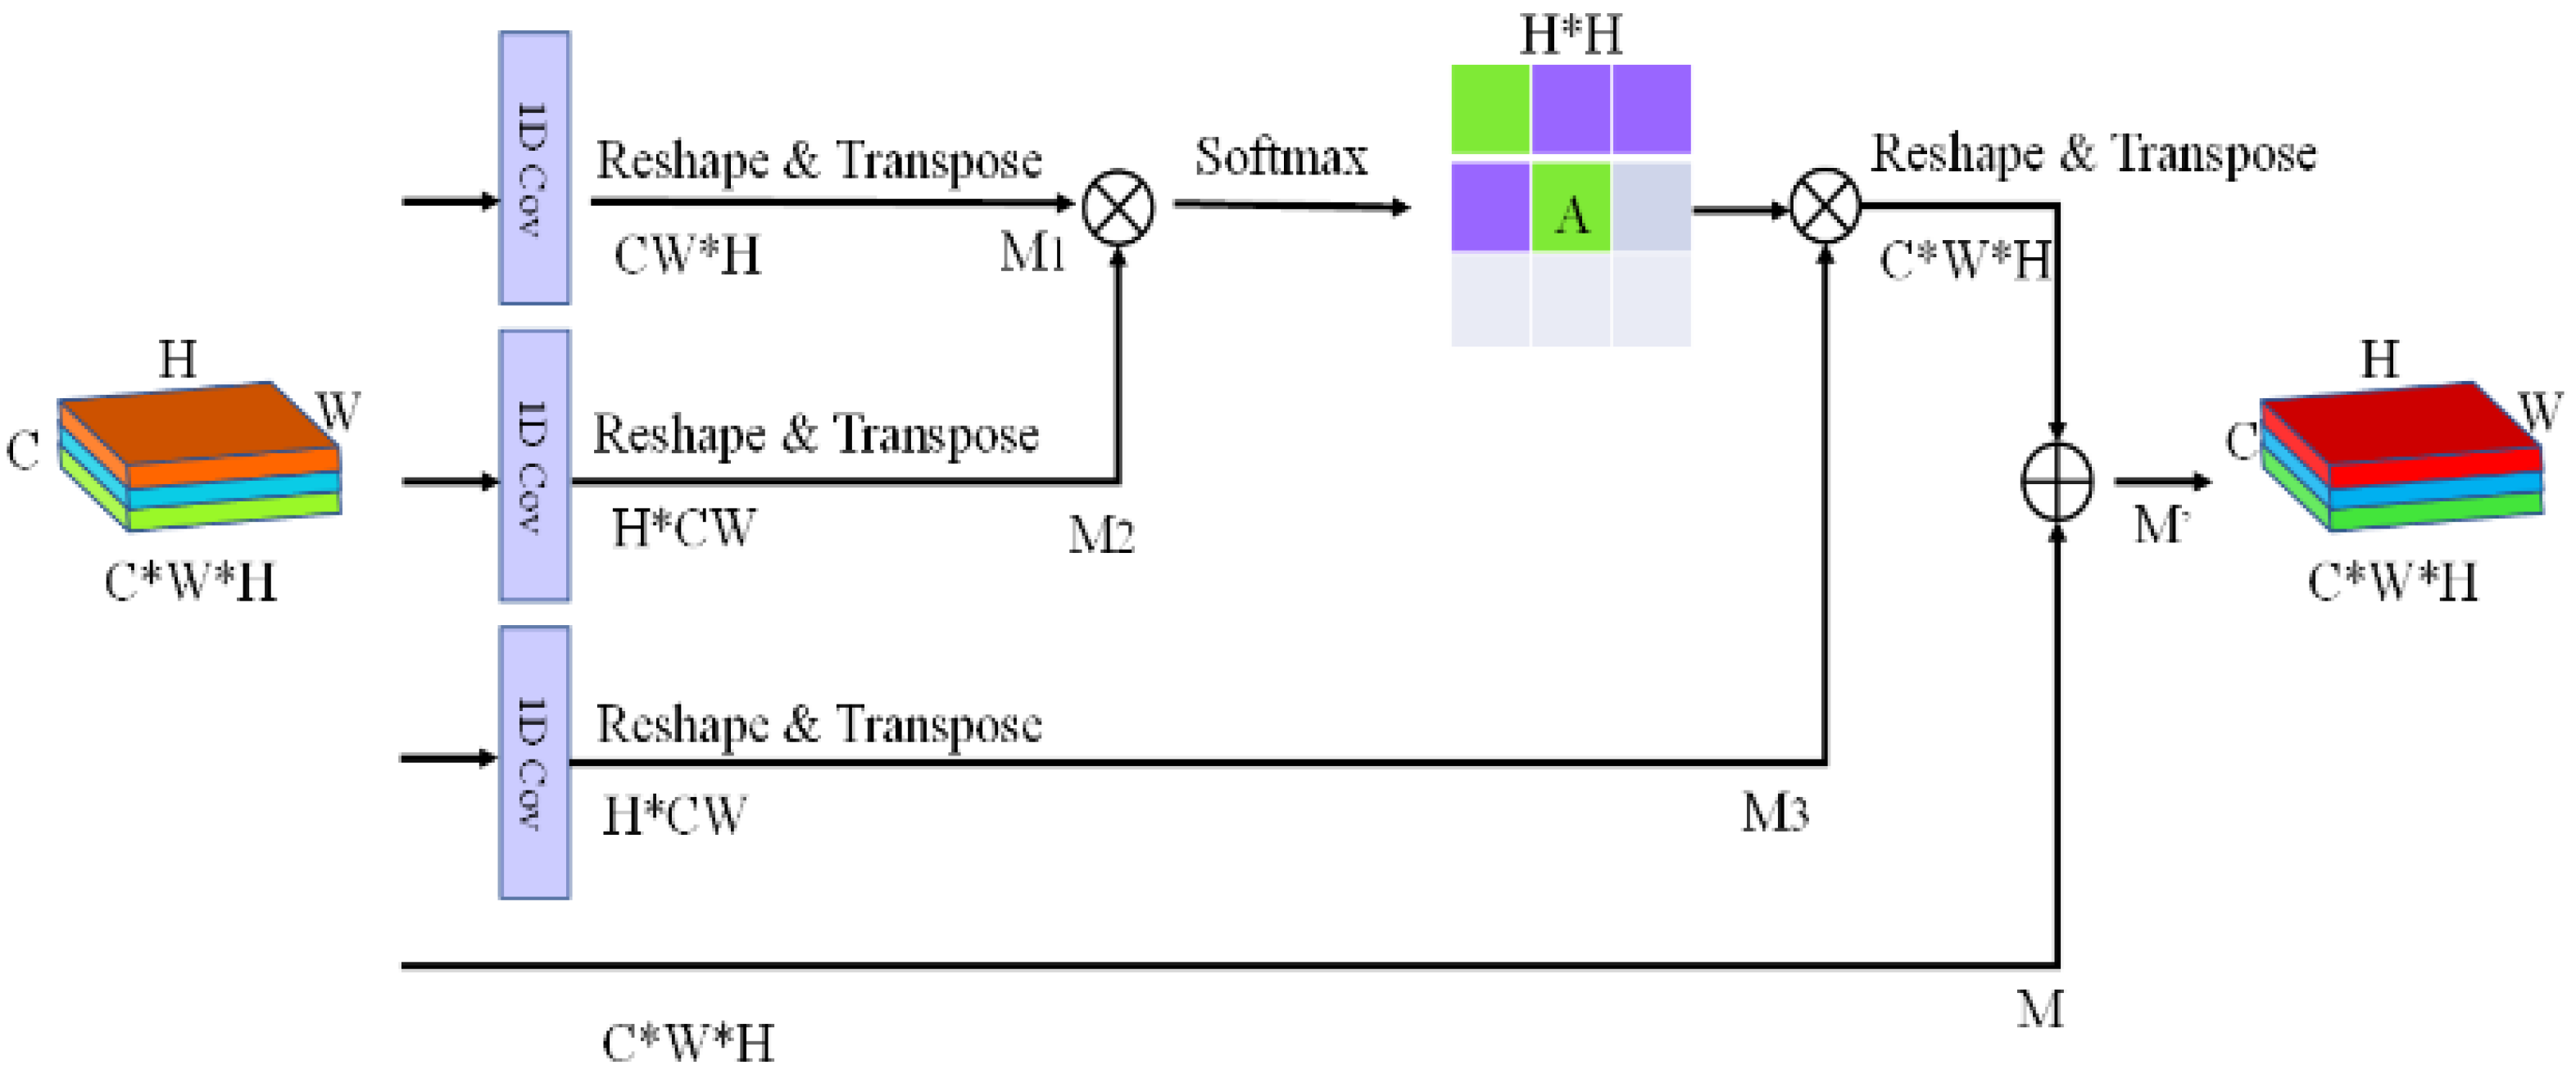
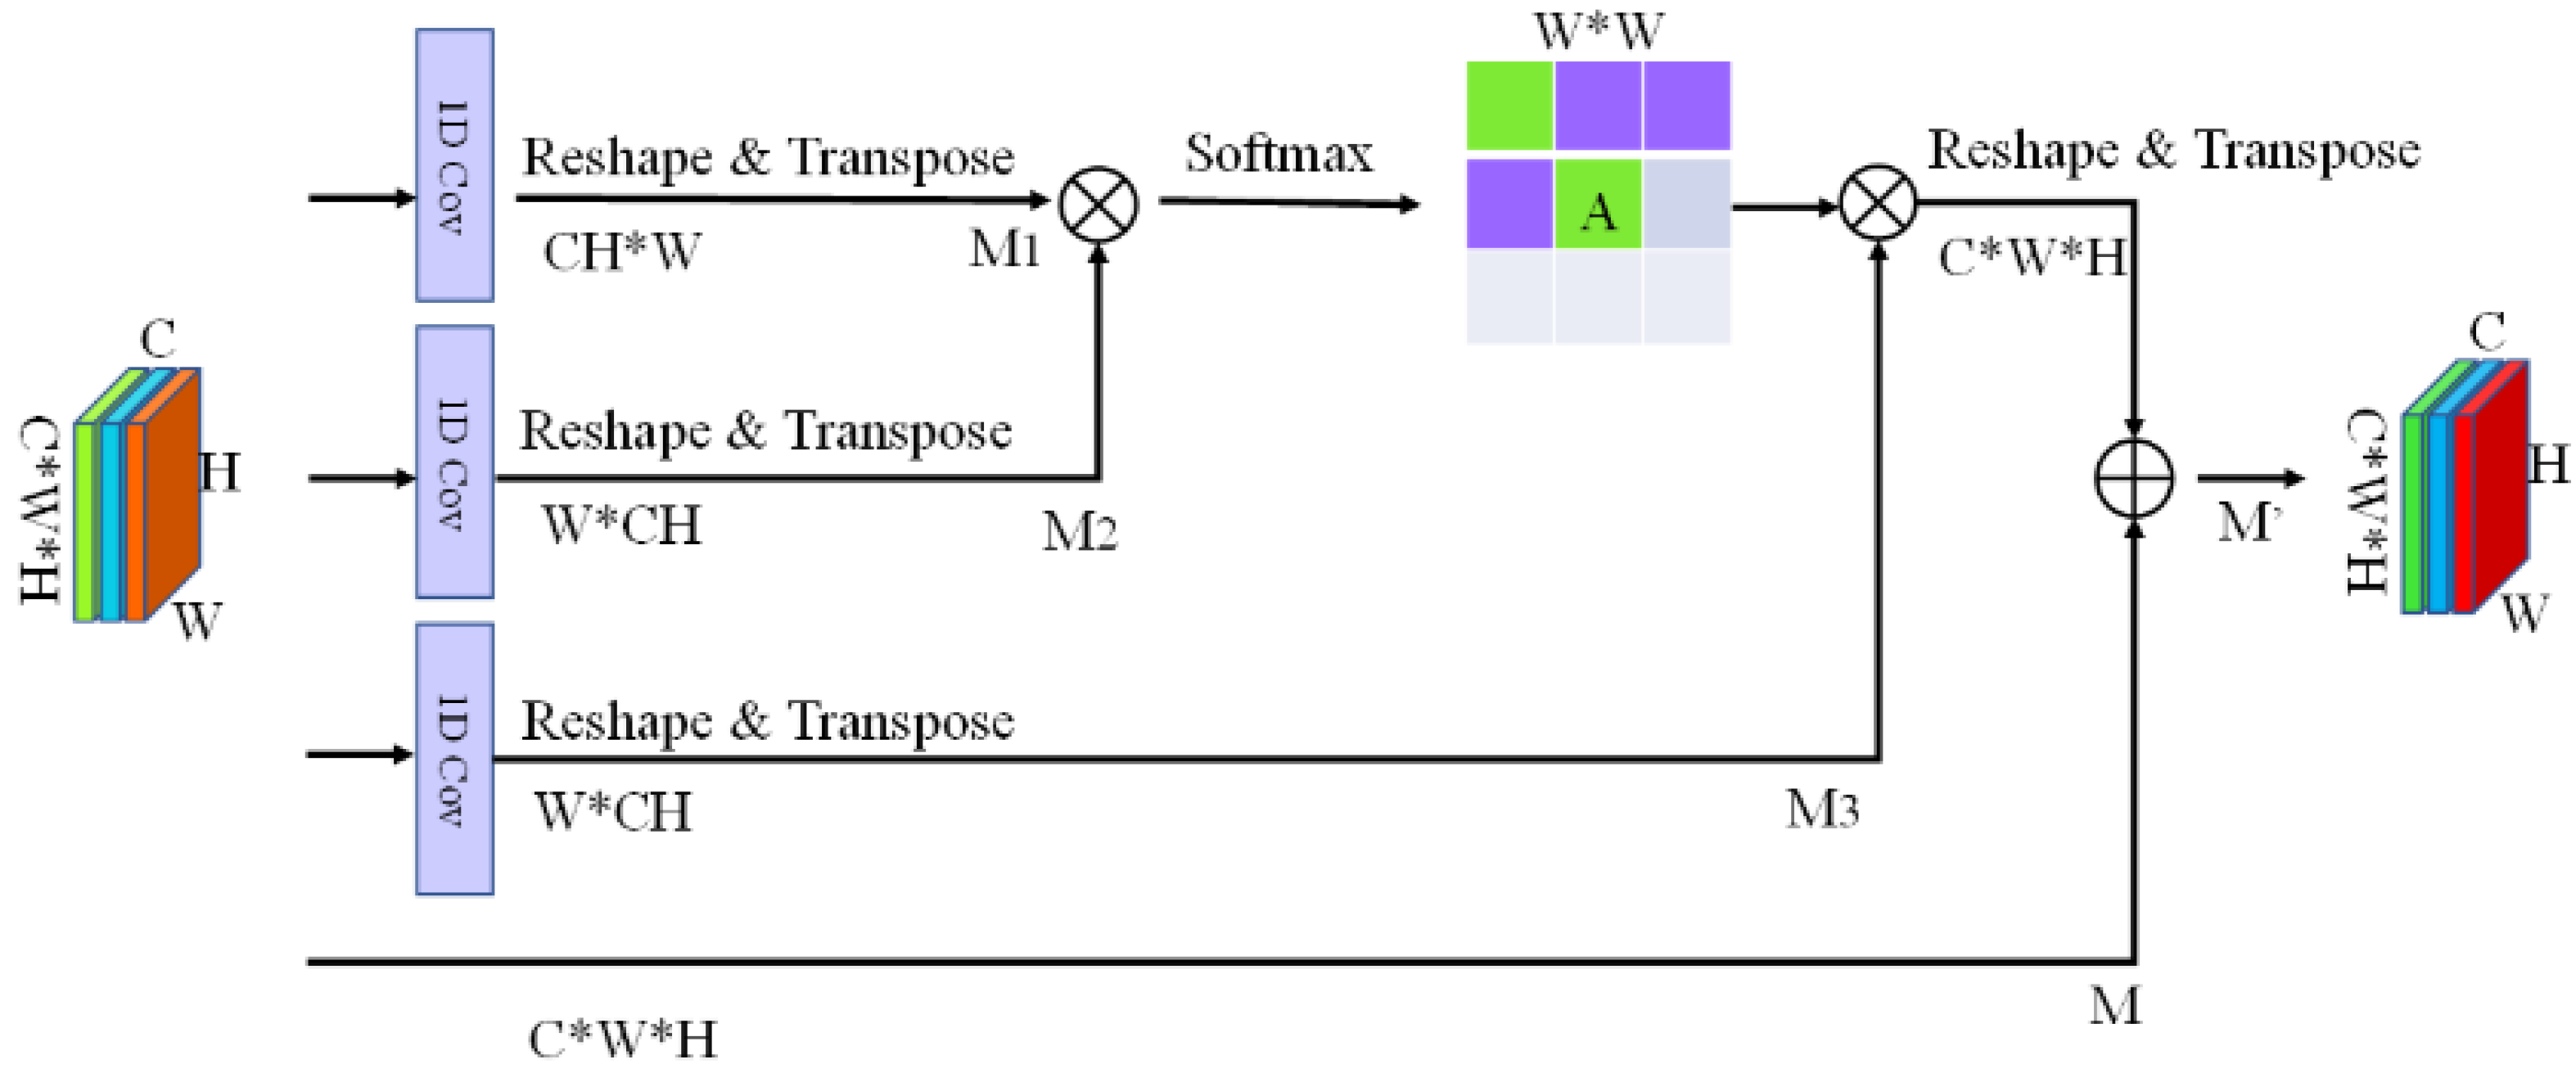
Given that the feature graph had a total of W × H pixels (where W and H were the width and height of the feature graph, respectively), the size of the relational matrix between the pixels was WH × WH. The size of this matrix was very large, and the attention mechanism was usually placed in the depths of the network; otherwise, too many pixels would make the relational matrix too large, which would significantly increase the computation required by the GPU, and even lead to incapability of the limited video memory to store the matrix. Therefore, in this study, the attention mechanism was introduced into the dimensional reduction feature graph, and the feature parameters were rescreened. Only the relationships between rows or the relationships between columns were calculated to decompose the original relationship matrix of WH × WH size into two small matrices—namely, the WW and HH size matrices. After decomposition, the space occupied by the two small matrices and the amount of computation required by the large matrix were geometrically reduced (WW + HH ≤ WH × WH). Figure 4 and Figure 5 show the row- and column-based attention modules, respectively.
We supposed the input of the module was a feature graph , where C, H, and W are the number of channels, height, and width of the feature graph, respectively. First, the input feature graph was transformed by the feature tensor. M was reshaped and transposed to obtain . M2 and M3 were then obtained by M in the same way. Next, matrix multiplication and Softmax operation were performed on M2 and M1 to obtain the relational matrix A. The process can be described by the following formula:
where computes the relationship between the ith row and the jth row. Each row in attention map A refers to the relationship between this pixel feature and all of the other pixel features, which can be used to aggregate new features. M2 [i,:] refers to the ith row of the matrix M2; M1 [:, j] refers to the jth column of matrix M1. After obtaining the relational matrix A, we can use A to perform feature aggregation operations on the original feature graph. This supposes that RT( ) is a function of shape remodeling and transposition. The new aggregated feature graph was obtained by the following formula:
where α is a scale parameter used to adjust the weight of polymerization features. The two formulae mentioned above could be used to obtain the line-based attention module. The column-based attention module is similar to the row-based attention module.
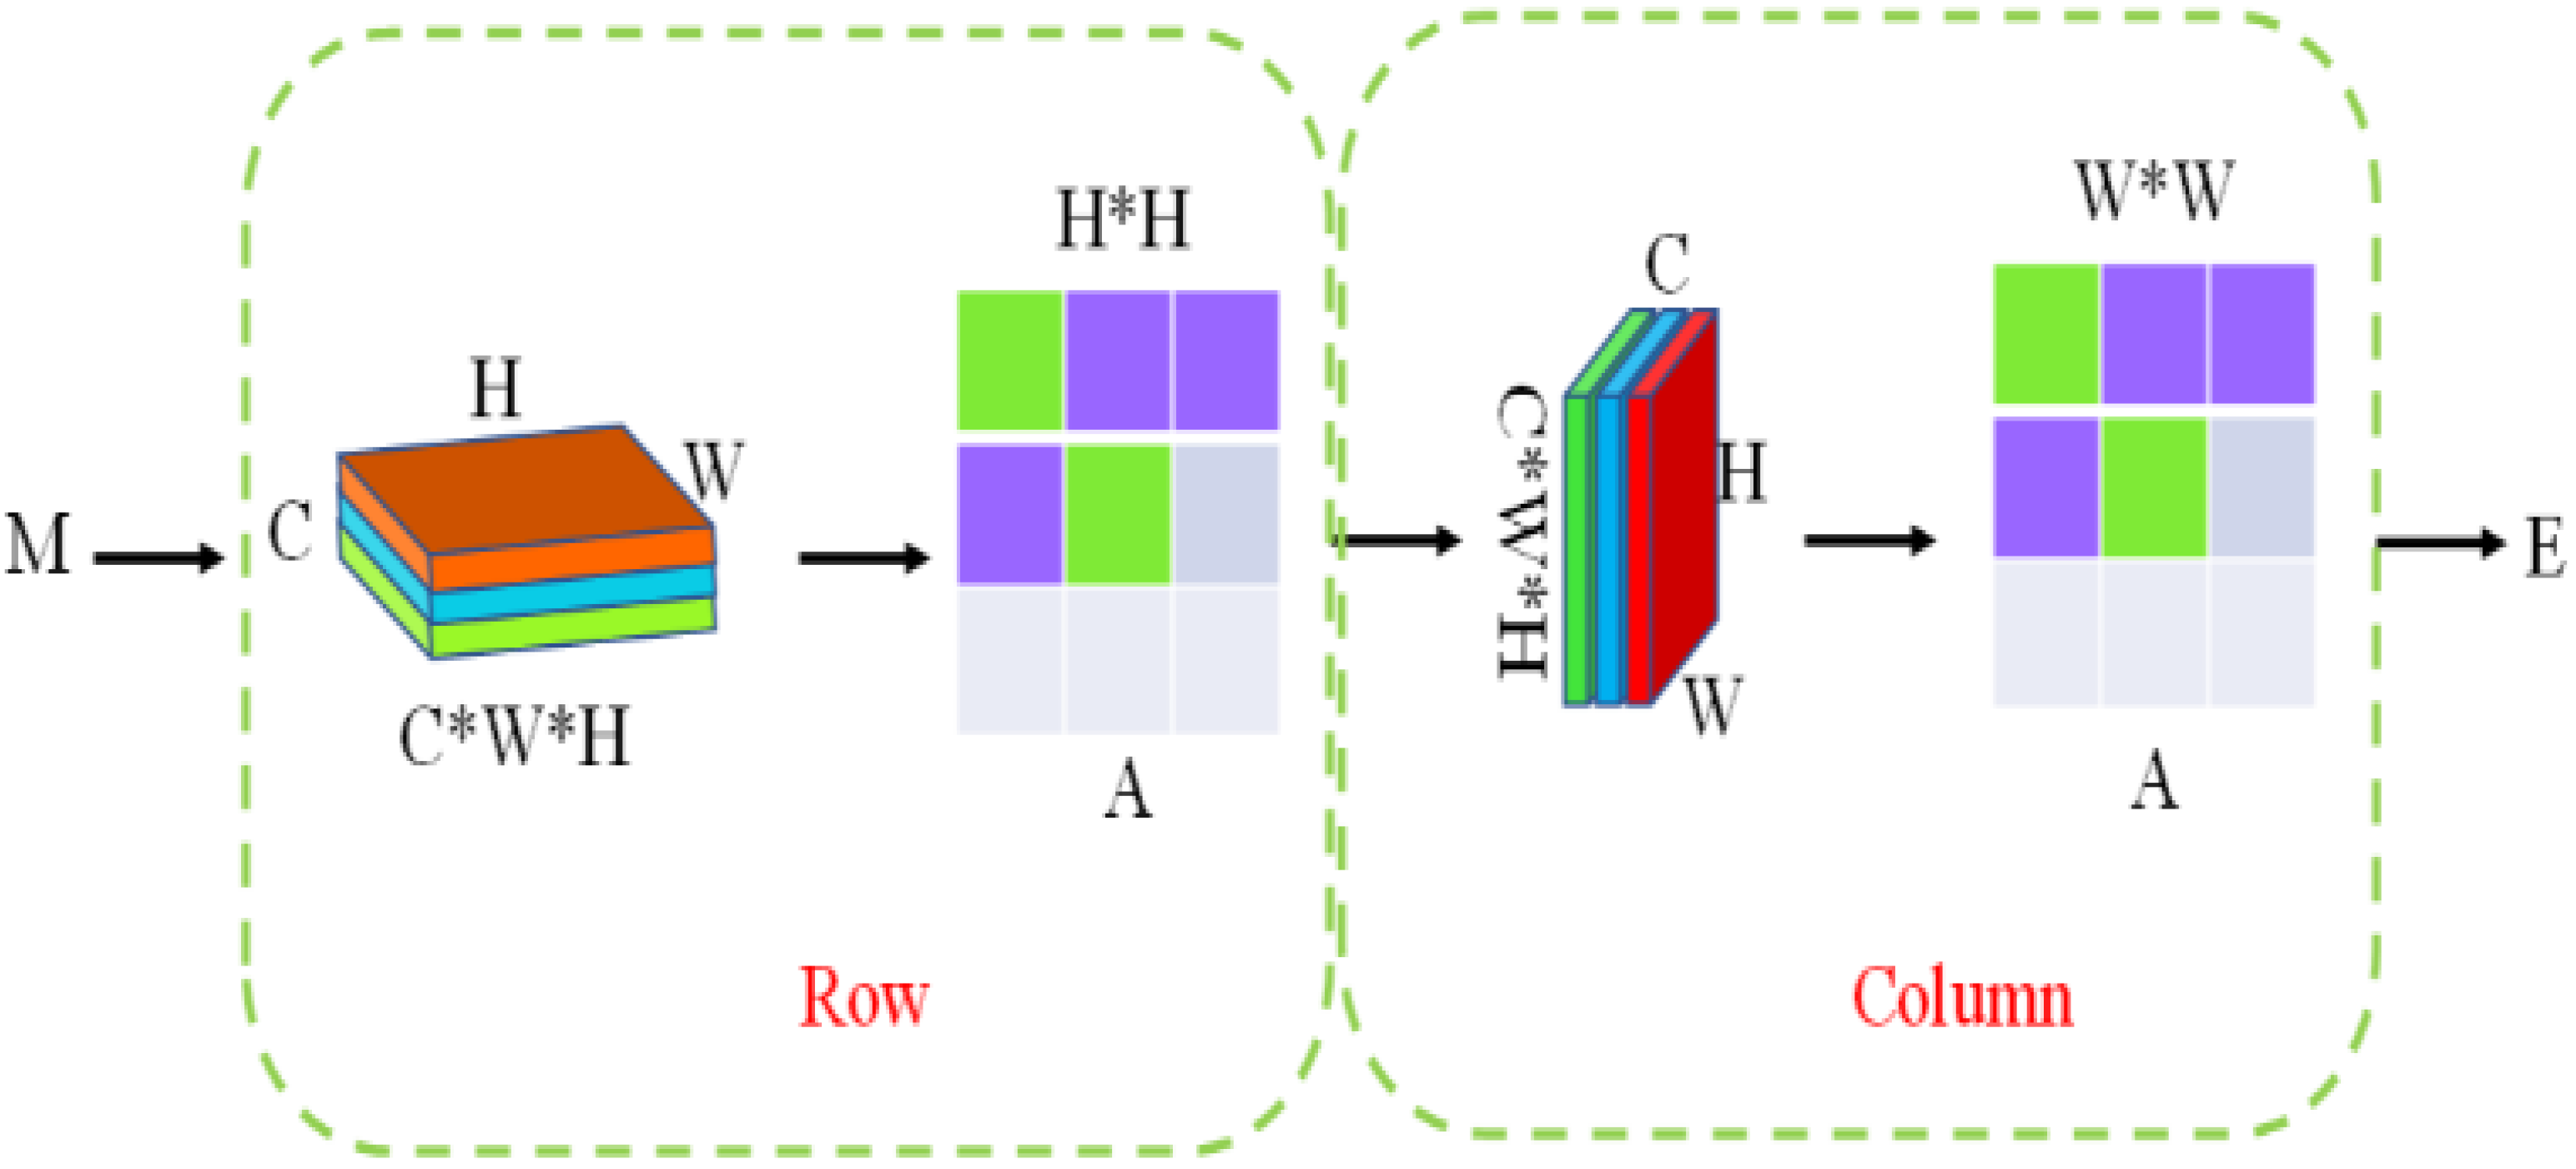
This study cascaded the column-based module with the row-based module. First, the input feature graph M was fed into the row-based attention module to obtain the output feature graph M’. Second, M’ was fed into the column-based attention module as an input to obtain the final aggregation feature E. Through recursion, each pixel feature in the E feature graph was the weighted sum of all other pixel features. In this study, the features were effectively aggregated and the latent semantic information was fully mined. At the same time, the time and space consumption were much smaller than those of the traditional attention module. The recursive cascade mechanism structure is shown in Figure 6.
2.3.3. Improved Network Model
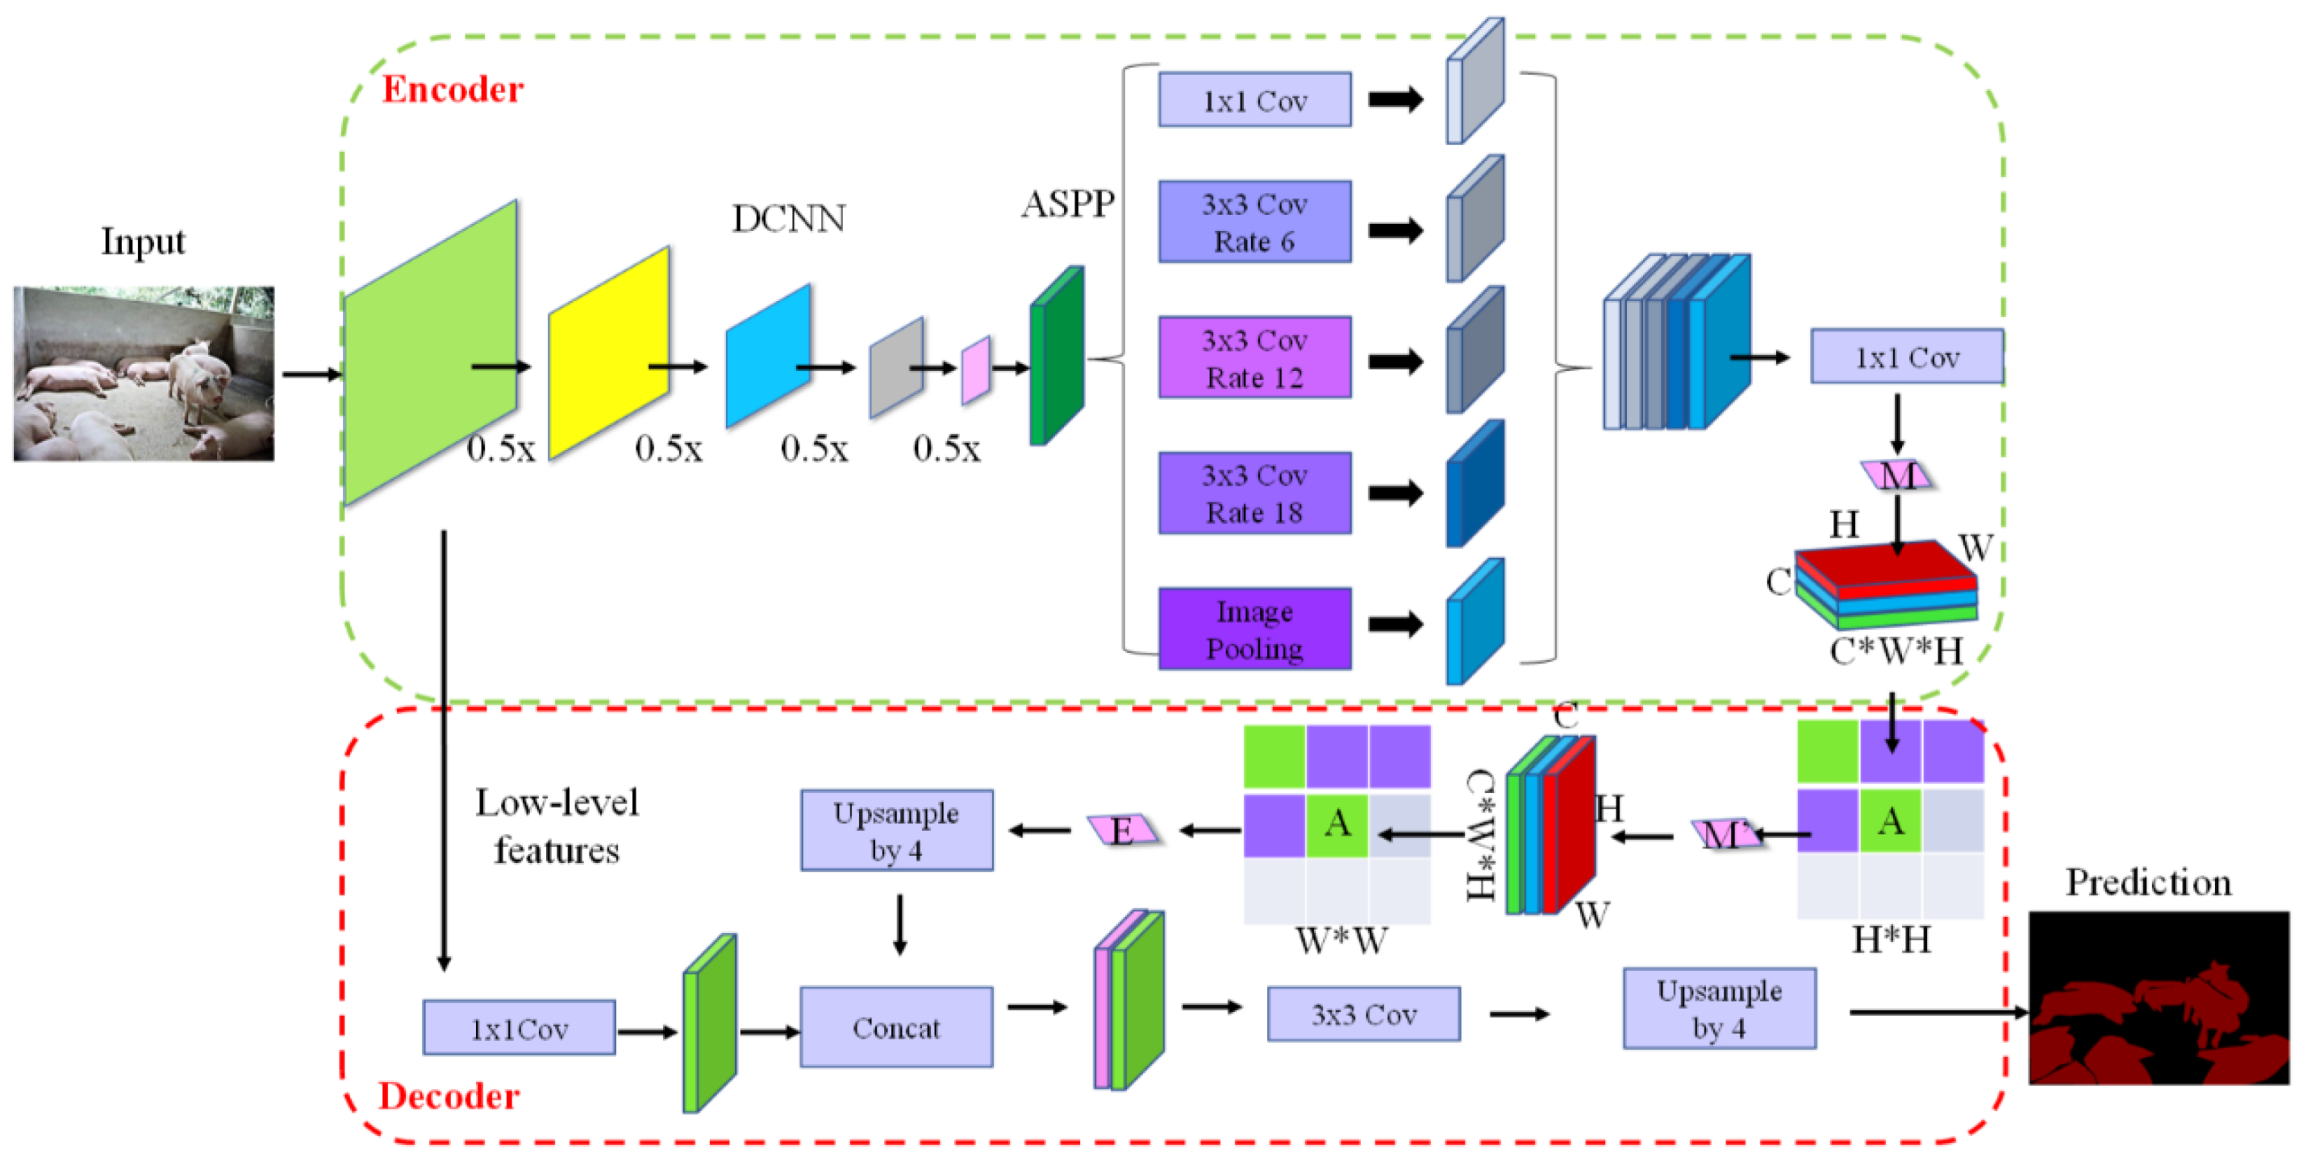
On the basis of the traditional DeepLab V3+ model, this study mainly improved the feature fusion part deep in the model network. After the initial high-dimensional feature images were extracted through the ASPP module and the dimensionality was reduced, the initial feature images were fused by a recursive cascade mechanism. First, the row-based attention mechanism was used to extract semantic information. Then, the column-based attention mechanism was cascaded to deepen the feature information. Theoretically, the computation of the model could be reduced exponentially, and the high-dimensional feature information of the image could be further optimized to provide support for the subsequent high- and low-frequency feature fusion. The improved model structure is shown in Figure 7.
3. Results
3.1. Model Training Experiment
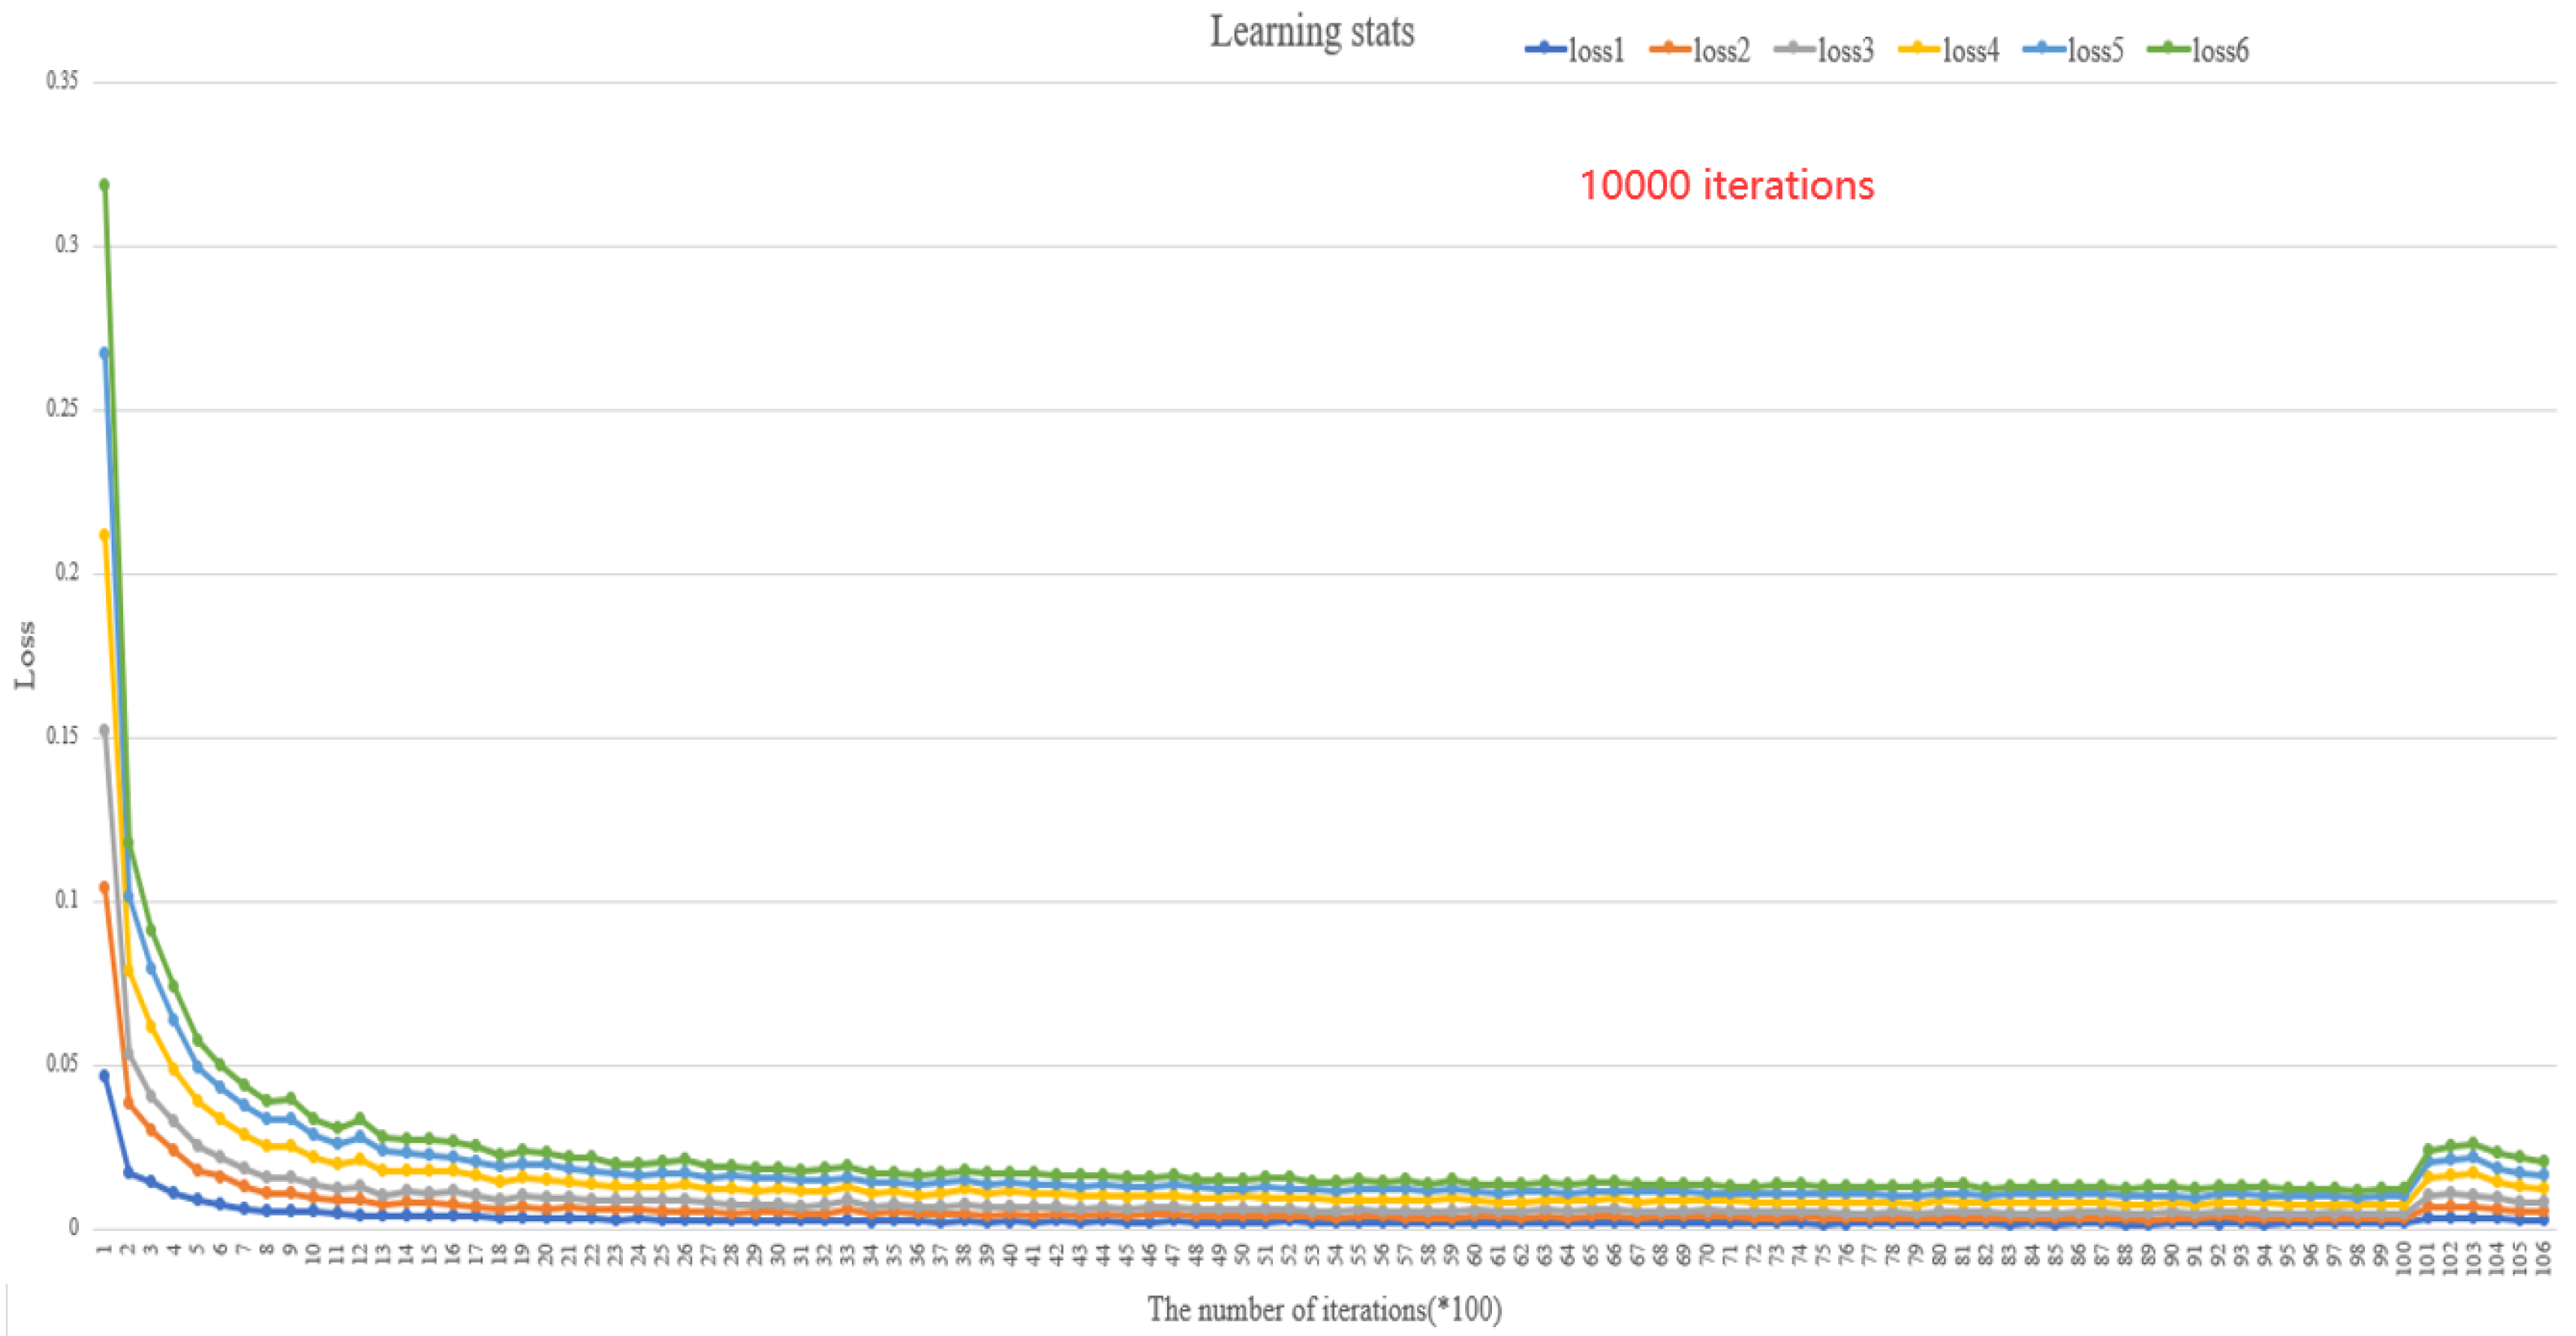
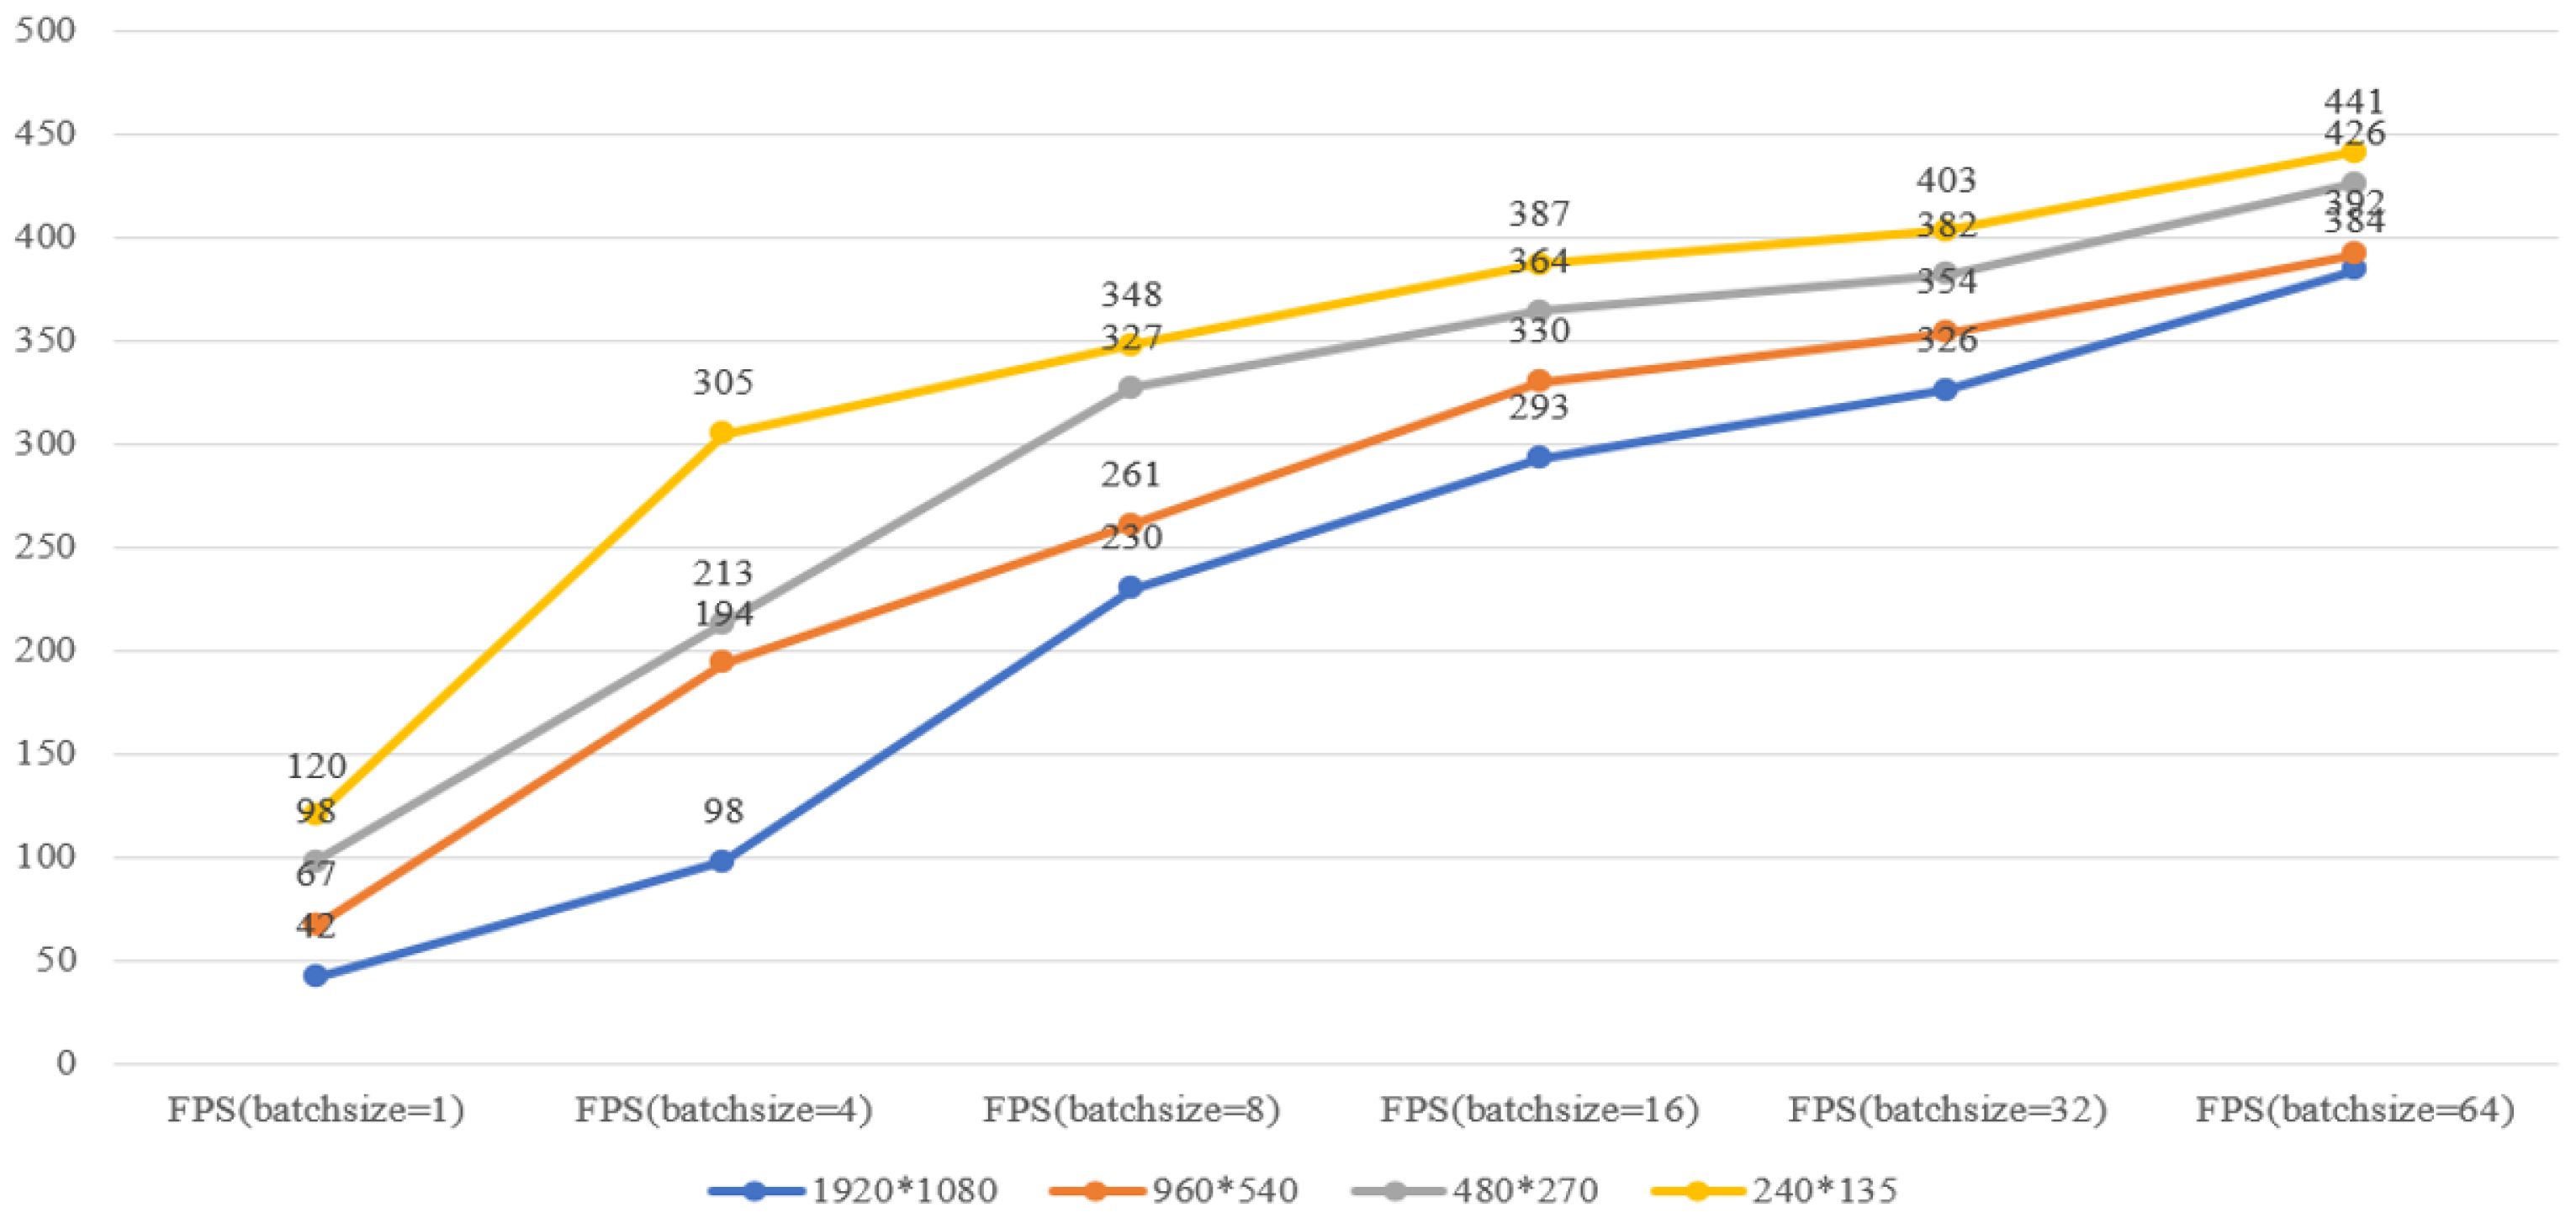
In this study, five representative semantic segmentation models including FCNNs, SegNet, U-Net, DenseNet, and DeepLab V3+ were reproduced. The initial learning rate was set to 0.01, and the regularization coefficient was set to 0.001. With the increase in epoch times, the learning rate followed the principle of exponential decay, and decreased to 0.05 times the original. The comparison of the loss value of model training is shown in Figure 8. After approximately 1000 iterations, the models converged rapidly and the loss function curve was still declining. After 2000 iterations of training, the model was stable. The loss value of this method was 0.002, which meant that the training effect of the model was the best. The comparative experiment of operation efficiency of the proposed method is shown in Figure 9. Images with different resolutions were introduced into models of different batch sizes for training. The results showed that the segmentation speed was faster when the resolution was smaller, and the fastest was up to 441 fps. However, smaller resolution did not mean higher segmentation accuracy, because smaller scale images lost more information. Therefore, we finally chose a suitable size of 512 × 256 pixels for the model training set.
3.2. Segmentation Experiment
3.2.1. Qualitative Comparative Analysis
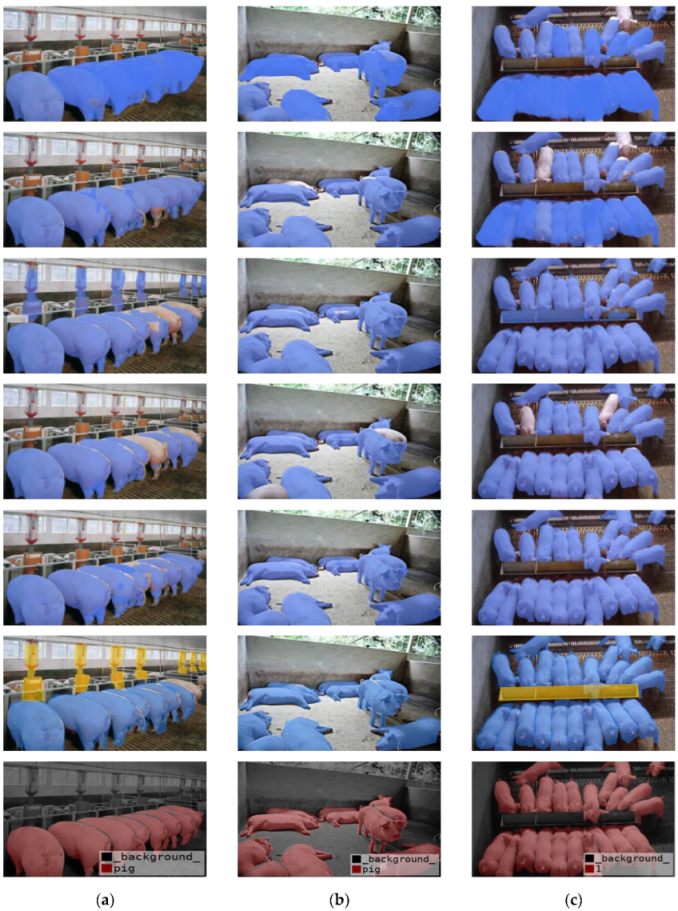
The proposed method was further compared with the existing segmentation methods of FCNNs, U-Net, SegNet, DenseNet, and traditional DeepLab V3+. Image segmentation results were presented in lightweight, middleweight, and heavyweight difficulty. The visualization results are shown in Figure 10, illustrating the advantages of the new model more intuitively.
The pictures in the first line are the segmentation results of FCNNs. As observed, the algorithm had an effect on the overall segmentation of pigs; however, it could not achieve fine-grained individual differentiation, resulting in serious overlap.
The pictures in the second line are the segmentation results of U-Net. Here, the phenomenon of overlapping segmentation decreased significantly; however, the processing of details was still insufficient, and the processing of lightweight images was imperfect. With the increase in difficulty, the phenomena of missing segmentation and overlapping segmentation appeared simultaneously, and the problem of adhesion had not been properly solved.
The pictures in the third line are the segmentation results of SegNet. The algorithm solved the overlapping problem; however, an oversegmentation phenomenon was observed in the segmentation results of lightweight and heavyweight images, and the feeder was mistakenly separated. In addition, the processing of middleweight images was improved compared with that of the former models.
The pictures in the fourth line are the segmentation results of DenseNet. The problem of oversegmentation and overlapping had been solved, but the problem of missing segmentation existed to different degrees.
The pictures in the fifth line are the segmentation results of the traditional DeepLab V3+, which had a good segmentation effect on the whole. However, the segmentation of the detailed parts of the pig itself—such as legs, back, and outline—was rough. In particular, the typical overlapping occlusion phenomenon was observed in the lightweight image, and the segmentation accuracy needed to be improved.
In comparison, the pictures in the sixth line are the segmentation results of the improved LA-DeepLab V3+ model, which had well inherited the complex background segmentation capability of the former. After the label sample was expanded, this study added separate feeders, drinkers, people, and other external labels, which not only retained the image details better, but also made the multi-category prediction results more accurate and comprehensive.
The pictures in the seventh line are the truth value of manual segmentation. Therefore, the proposed improved model properly dealt with the abovementioned shortcomings by accurately representing the details of the image; it also solved the problem of missing segmentation and segmentation discontinuity.
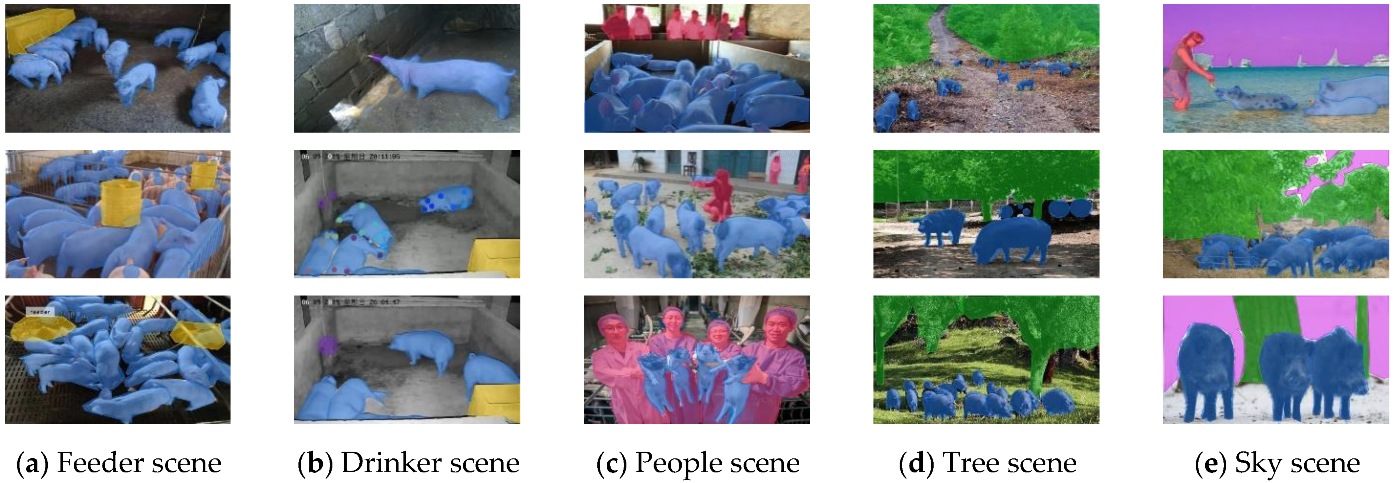
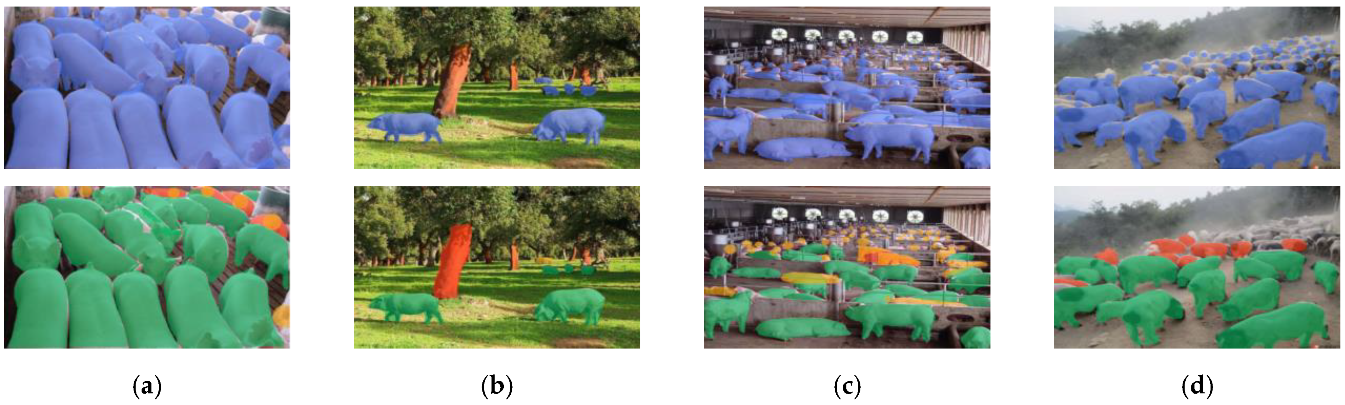
The segmentation results of different complex backgrounds in this study are shown in Figure 11. The method in this study extended several other typical labels—including feeders, drinkers, people, sky, and trees—on the basis of the pig label. The purpose was to solve the problem of misidentification and classification, deepen the understanding of specific scenes, enhance the ability of the model to further distinguish different complex background factors, and provide support for deeper semantic segmentation, such as behavior. The results showed that the proposed algorithm could deal well with different scenes, complex lighting, occlusion, and overlap problems, and it had a certain degree of generalization ability. The model maintained its segmentation accuracy under the complex background, and provided effective support for individual behavior recognition and pig farm counting in the future.
3.2.2. Quantitative Comparative Analysis
Segmentation evaluation indices of different models were given in this study to quantify the performance of the models. Table 1 shows that the P, R, AP, F1 score, and MIoU values of LA-DeepLab V3+ (single tag) in this study were the highest, at 86.04%, 75.06%, 78.67%, 0.8, and 76.31%, respectively. Among them, AP and MIoU showed obvious difference and significance. Compared with the FCNNs, U-Net, SegNet, DenseNet, and DeepLab V3+ methods, AP improved by 27.24%, 22.63%, 13.28%, 6.03%, and 2.79%, respectively. MIoU improved by 14.10%, 13.67%, 7.79%, 2.33%, and 5.80% over the FCNNs, U-Net, SegNet, DenseNet, and traditional DeepLab V3+ methods, respectively. In addition, the P, AP, and MIoU values of LA-DeepLab V3+ (multiple tags) in this study were the second highest, at 88.36%, 76.75%, and 74.62%, respectively. The traditional DeepLab V3+ method maintained its advantages in R and F1 score of 74.75% and 0.79, respectively; however, the differences were insignificant. Overall, the proposed algorithm was absolutely optimal. The difficulty of the pig dataset with complex background set in this study meant that achieving an accuracy of more than 90% with other simple scenes was impossible, because the sample size of the simple background in our dataset was itself very low. We specially tested the image segmentation of pig herds under a simple background in order to further verify the accuracy and effectiveness of the algorithm in this study. The accuracy remained above 99%, which could better realize the accurate inventory of pig herds.
3.2.3. Generalization Experiment
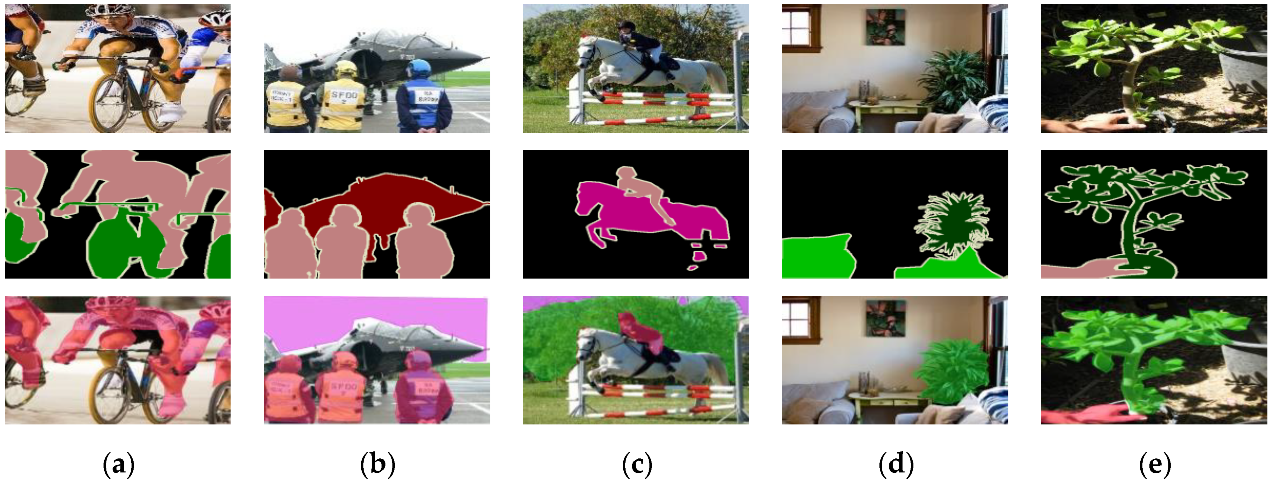
The improved model was tested on the public dataset PASCAL VOC 2012 (VOCdevkit) [32] after extended training. Not all images in VOC2012 were suitable for segmentation in this model. We selected some images including people, sky, and trees to verify the robustness of this model against complex backgrounds.
In Figure 12, the first line is the original image, the second line is the real label corresponding to the original image, and the third line is the segmentation result of our method. The results showed that the self-built dataset in this study mainly focused on the segmentation and counting of pigs. Thus, the segmentation effect of background factors was rather rough—in particular, the adhesion of people and bicycles, the fine segmentation of trees’ internal cavities, and the processing of contours were imperfect. However, rough segmentation of complex backgrounds could be realized on the whole, which was helpful for the model to further learn the complex background of pigs. In conclusion, the proposed LA-DeepLab V3+ model still achieved good segmentation performance on the PASCAL VOC 2012 datasets, further verifying the generalization of the proposed model.
3.3. Model Deployment and Visual Counting Applications
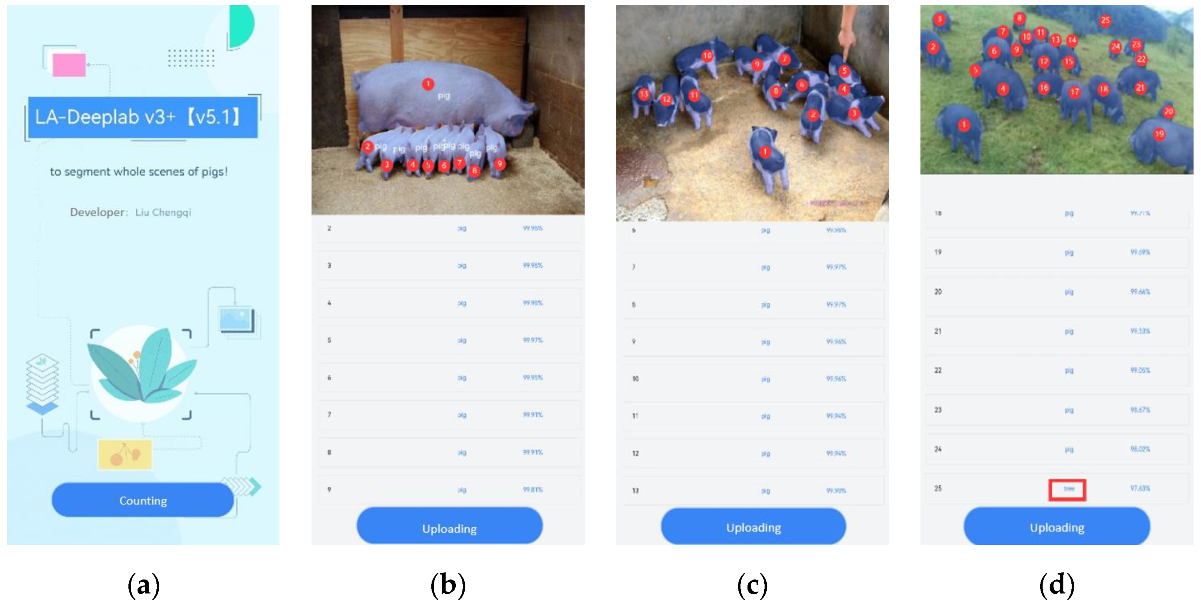
The purpose of semantic segmentation was to obtain the whole life cycle law of pig quantity, behavior, category, and trajectory tracking. In this study, the H5 program was used to build a graphical user interface for the application of pig counting. As shown in Figure 13, the model selected in the figure was the DeepLab V3+ model, which introduced a lightweight attention mechanism.
In the figure, panel (a) shows the home page. A photo was uploaded through shooting or an album, and then it was submitted to the program for segmentation and counting.
Panel (b) shows the count result of the lightweight image (1–10 pigs). If we could accurately detect the number of piglets in the actual breeding process, then early warning of the death and injury caused by extrusion in the production process could be provided. The accuracy of this model for lightweight image segmentation was more than 99.8%.
Panel (c) shows the counting result of middleweight images (10–20 pigs). The accuracy of the small pig group with black and white color could reach 99.9%, and 13 pigs could be accurately counted.
Panel (d) shows the counting result of heavyweight images (more than 20 pigs). The proposed model could effectively segment the wild black pigs with complex background and multiscale targets, and the segmentation accuracy was approximately 97%. In addition to the segmentation of all 24 objects, other kinds of tags could be effectively distinguished.
At present, the average recognition accuracy of the pig and human labels is 97.65% and 95.86%, respectively. For other labels—such as trees, sky, drinkers, and feeders—the recognition was relatively low. The number of model labels had some significance; thus, the overall evaluation index of the model was lowered. The application results showed that the proposed model had a good application effect on fine-grained segmentation tasks.
4. Discussion
4.1. Analysis of Each Model
The comparison results showed that each model had unique advantages. FCNNs used a deconvolution process to restore image resolution and optimize segmentation results; however, the downsampling operation of this method weakened the feature extraction ability of the model, resulting in poor segmentation ability of details of pig images with complex backgrounds; therefore, its segmentation performance index was poor. U-Net and SegNet are U-shaped codec structures. The segmentation model based on dilated convolution could enlarge the local receptive field of the original convolution kernel; however, the proportion of some pig targets in the overall image was small; thus, these two segmentation methods were still imperfect in the performance method. DenseNet greatly reduced the number of parameters, which not only consumed memory but also led to insufficient extraction of low-frequency features; as a result, missing segmentation occurred. On the basis of the traditional DeepLab V3+, the proposed method further integrated high- and low-frequency features to bridge the semantic gap between different feature graphs; thus, better accuracy and stronger feature expression were achieved. In addition, the lightweight attention mechanism not only retained the advantage of attention, but also avoided excessive consumption. Next, the algorithm could be further optimized based on the extraction ability of image depth features and the complexity of the network.
4.2. Analysis of Improved Segmentation Methods
As shown in Figure 14, very few cases of mis-segmentation and missing segmentation occurred in the test set when using the proposed method in this study.
Among them, the main reason for (a), (c), and (d) was that the image of the pigs was too difficult. The label comparison in the first line showed that ensuring the accuracy of the label was difficult. In addition, the target was very dense and the image depth information was low. As a result, identification in the case of serious occlusion was difficult. As shown in (b), mis-segmentation of tree trunks and missing segmentation of distant small targets occurred due to the influence of the real environment in the field.
More sample data and label quantity could be added to improve its segmentation ability.
4.3. Pressure Test of the Counting Application System
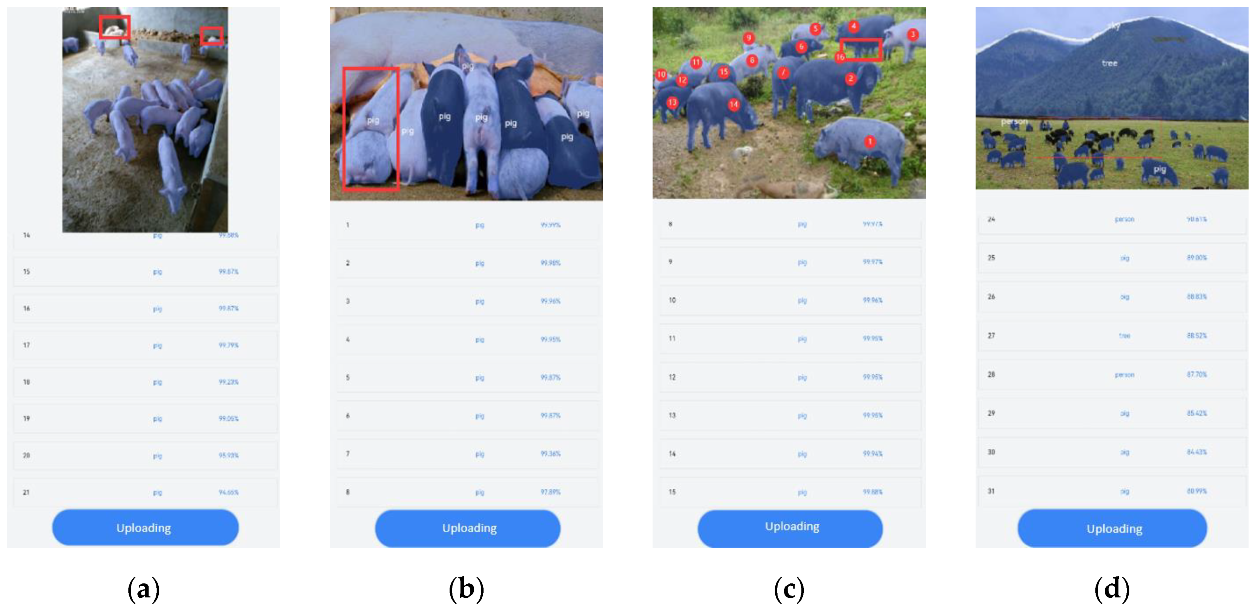
This study conducted pressure test analysis to further test the robustness and generalization of the counting application. Representative images with different scenes were input into the counting system to detect their robustness against occlusion, overlap, adhesion, illumination, and multiscale targets. Figure 15 shows an example of an error on the current application platform.
In the figure, panel (a) represents missing segmentation after the small-scale target was blocked in the image perspective. As shown in panel (b), mis-segmentation occurred due to overlapping and adhesion problems. Panel (c) shows the count error caused by the leg target being too small after severe occlusion. Panel (d) shows the cases of missing segmentation and mis-segmentation in the field environment containing all of the abovementioned problems. This shows that the counting accuracy gradually decreased with the increase in the number of pigs.
The pressure test results showed that the application could calculate the number of pigs up to a maximum of 50, and that the counting accuracy of pigs with less than 30 was high. This could meet the requirements of standard free-range piggery, but the counting of large-scale free-range piggery requires further study. The errors of the model were mainly caused by insufficient feature extraction of small-scale targets in the foreground, or after occlusion.
However, the application can meet the requirements of pig population identification and counting in most common scenarios. The optimization can be further improved by setting a minimum target scale threshold, supplementing large-scale sample data, and optimizing the model network.
5. Conclusions
In this study, we proposed a novel semantic segmentation method with a lightweight attention mechanism. By fusing high- and low-frequency features and reducing redundant parameters, the DeepLab V3+ semantic segmentation method was optimized, and a pig counting system was built.
First, this study constructed pig datasets for different scenarios, including field, indoor, day and night, white pigs, black pigs, humans, trees, and other images of the real environment. According to the number of pigs, three kinds of quantity detection difficulty were set: lightweight (1–10), middleweight (10–20), and heavyweight (more than 20).
Second, a lightweight attention mechanism was introduced based on the DeepLab V3+ deep learning method to improve the segmentation accuracy of complex images of pigs. The attention module based on rows and columns improved the efficiency of feature calculation. Recursive cascade mode was adopted to optimize the fusion of high- and low-frequency features, and potential semantic information was mined in order to reduce time and space consumption. In this study, the values of the segmentation evaluation indices P, R, AP, F1 score, and MIoU of LA-DeepLab V3+ (single tag) were the highest, and the P, AP, and MIoU values of LA-DeepLab V3+ (multiple tags) were the second highest. Quantitative and qualitative experiments showed that the segmentation effect of the model was improved significantly.
Finally, the improved model was integrated to enhance the efficiency of pig counting, and a graphical counting platform was built to achieve accurate pig counting. The counting network could calculate the number of pigs up to a maximum of 50, and the counting accuracy of pigs with less than 30 was higher, meeting the requirements of free-range counting in standard piggery.
The optimization can be further improved by setting a minimum target detection threshold, supplementing large-scale sample data, and optimizing the model network.
Author Contributions
Conceptualization, C.L. and L.L.; methodology, C.L.; software, C.L.; validation, J.S.; resources, C.L. and J.S.; writing—original draft preparation, C.L.; writing—review and editing, L.W.; visualization, S.L.; supervision, L.L.; funding acquisition, L.L. All authors have read and agreed to the published version of the manuscript.
Funding
This research was funded by the National Major Science and Technology Project (Innovation 2030) of China (No.2021ZD0113701), the National Key Research and Development Program of China (No.2021YFD1300101), and the National Research Facility for Phenotypic and Genotypic Analysis of Model Animals (Beijing) (No.2016-000052-73-01-001202).
Institutional Review Board Statement
Not applicable.
Informed Consent Statement
Not applicable.
Data Availability Statement
Not applicable.
Acknowledgments
We thank all of the funders and all of the reviewers.
Conflicts of Interest
The authors declare no conflict of interest.
References
- Yang, A.; Huang, H.; Zheng, C.; Zhu, X.; Yang, X.; Chen, P. High-accuracy image segmentation for lactating sows using a fully convolutional network. Biosyst. Eng. 2018, 176, 36–47. [Google Scholar] [CrossRef]
- Zhang, L.; Gray, H.; Ye, X.; Collins, L.; Allinson, N. Automatic individual pig detection and tracking in pig farms. Sensors 2019, 19, 1188. [Google Scholar] [CrossRef] [PubMed] [Green Version]
- Yang, W.; Yan, Y.; Chen, S. Multi-scale generative adversation network based pedestrian reidentification method for occlusion. J. Softw. 2020, 31, 1943–1958. [Google Scholar]
- Zhao, Y.; Rao, Y.; Dong, S. A review of deep learning target detection methods. J. Image Graph. 2020, 25, 629–654. [Google Scholar]
- Yan, H.; Lu, H.; Ye, M. Segmentation of pulmonary nodules by sobel operator and mask R-CNN. J. Chin. Comput. Syst. 2020, 41, 161–165. [Google Scholar]
- Tian, Q.; Meng, Y. Image semantic segmentation based on convolutional neural network. J. Chin. Comput. Syst. 2020, 41, 1302–1313. [Google Scholar]
- Long, J.; Shelhamer, E.; Darrell, T. Fully convolutional networks for semantic segmentation. IEEE Trans. Pattern Anal. Mach. Intell. 2015, 39, 640–651. [Google Scholar] [CrossRef] [Green Version]
- Yu, F.; Koltun, V.; Funkhouser, T. Dilated residual networks. In Proceedings of the IEEE Conference on Computer Vision and Pattern Recognition, Honolulu, HI, USA, 21–26 July 2017; pp. 472–480. [Google Scholar]
- Dai, J.; Qi, H.; Xiong, Y.; Li, Y.; Zhang, G.; Hu, H.; Wei, Y. Deformable convolutional networks. In Proceedings of the IEEE Conference on Computer Vision and Pattern Recognition, Honolulu, HI, USA, 21–26 July 2017; pp. 764–773. [Google Scholar] [CrossRef] [Green Version]
- Ronneberger, O.; Fischer, P.; Brox, T. U-Net: Convolutional Networks for Biomedical Image Segmentation. In International Conference on Medical Image Computing and Computer-Assisted Intervention; Springer International Publishing: Cham, Switzerland, 2015; pp. 234–241. [Google Scholar] [CrossRef] [Green Version]
- Badrinarayanan, V.; Kendall, A.; Cipolla, R. Segnet: A deep convolutional encoder-decoder architecture for image segmentation. IEEE Trans. Pattern Anal. Mach. Intell. 2017, 39, 2481–2495. [Google Scholar] [CrossRef] [PubMed]
- Zhao, H.; Shi, J.; Qi, X.; Wang, X.; Jia, J. Pyramid scene parsing network. In Proceedings of the IEEE Conference on Computer Vision and Pattern Recognition, Honolulu, HI, USA, 21–26 July 2017; pp. 2881–2890. [Google Scholar] [CrossRef] [Green Version]
- Chen, L.C.; Papandreou, G.; Kokkinos, I.; Murphy, K.; Yuille, A.L. Deeplab: Semantic image segmentation with deep convolutional nets, atrous convolution, and fully connected crfs. IEEE Trans. Pattern Anal. Mach. Intell. 2018, 40, 834–848. [Google Scholar] [CrossRef] [PubMed] [Green Version]
- Chen, L.C.; Papandreou, G.; Schroff, F.; Adam, H. Rethinking atrous convolution for semantic image segmentation. arXiv 2017, arXiv:1706.05587. [Google Scholar]
- Chen, L.C.; Zhu, Y.; Papandreou, G.; Schroff, F.; Adam, H. Encoder-Decoder with Atrous Separable Convolution for Semantic Image Segmentation; Springer: Cham, Switzerland, 2018. [Google Scholar] [CrossRef] [Green Version]
- Chollet, F. Xception: Deep Learning with Depthwise Separable Convolutions. In Proceedings of the IEEE Conference on Computer Vision and Pattern Recognition, Honolulu, HI, USA, 21–26 July 2017; pp. 1800–1807. [Google Scholar] [CrossRef] [Green Version]
- Zhang, R.; Li, J.T. A survey on algorithm research of scene parsing based on deep learn. J. Comput. Res. Dev. 2020, 57, 859–875. [Google Scholar]
- Peng, X.; Yin, Z.; Yang, Z. Deeplab_v3_plus-net for Image Semantic Segmentation with Channel Compression. In Proceedings of the IEEE 20th International Conference on Communication Technology, Nanning, China, 28–31 October 2020. [Google Scholar]
- Guo, L.; Zhang, T.S.; Sun, W.Z. Image Semantic Description Algorithm with Integrated Spatial Attention Mechanism. Laser Optoelectron. Prog. 2021, 58, 1210030. [Google Scholar]
- Lou, T.; Yang, H.; Hu, Z. Grape cluster detection and segmentation based on deep convolutional network. J. Shanxi Agric. Univ. Nat. Sci. Ed. 2020, 40, 109–119. [Google Scholar]
- Mnih, V.; Heess, N.; Graves, A. Recurrent Models of Visual Attention. Adv. Neural Inf. Processing Syst. 2014, 3, 27. [Google Scholar]
- Wang, F.; Jiang, M.; Chen, Q. Residual Attention Network for Image Classification. In Proceedings of the IEEE Conference on Computer Vision and Pattern Recognition, Honolulu, HI, USA, 21–26 July 2017; pp. 3156–3164. [Google Scholar]
- Jie, H.; Li, S.; Gang, S. Squeeze-and-Excitation Networks. In Proceedings of the IEEE/CVF Conference on Computer Vision and Pattern Recognition, Salt Lake City, UT, USA, 18–23 June 2018; pp. 7132–7141. [Google Scholar] [CrossRef] [Green Version]
- Zhang, H.; Dana, K.; Shi, J.; Zhang, Z.; Wang, X.; Tyagi, A. Context Encoding for Semantic Segmentation. In Proceedings of the IEEE/CVF Conference on Computer Vision and Pattern Recognition, Honolulu, HI, USA, 21–26 July 2017; pp. 7151–7160. [Google Scholar] [CrossRef] [Green Version]
- Yu, C.; Wang, J.; Peng, C. Learning a Discriminative Feature Network for Semantic Segmentation. In Proceedings of the IEEE/CVF Conference on Computer Vision and Pattern Recognition, Honolulu, HI, USA, 21–26 July 2017; pp. 1857–1866. [Google Scholar]
- Subakan, C.; Ravanelli, M.; Cornell, S. Attention Is All You Need in Speech Separation. In Proceedings of the IEEE International Conference on Acoustics, Speech and Signal Processing, Toronto, ON, Canada, 6–11 June 2021. [Google Scholar]
- Zhang, H.; Goodfellow, I.; Metaxas, D. Self-Attention Generative Adversarial Networks. In Proceedings of the International Conference on Machine Learning, Vancouver, BC, Canada, 13 December 2019; pp. 7354–7363. [Google Scholar]
- Fu, J.; Liu, J.; Tian, H.; Li, Y.; Bao, Y.; Fang, Z. Dual Attention Network for Scene Segmentation. In Proceedings of the IEEE/CVF Conference on Computer Vision and Pattern Recognition, Long Beach, CA, USA, 15–20 June 2019; pp. 3146–3154. [Google Scholar]
- Wang, X.; Girshick, R.; Gupta, A. Non-local Neural Networks. In Proceedings of the IEEE Conference on Computer Vision and Pattern Recognition, Salt Lake City, UT, USA, 18–23 June 2018; pp. 7794–7803. [Google Scholar]
- Chen, J.; Lu, Y.; Yu, Q. TransUNet: Transformers Make Strong Encoders for Medical Image Segmentation. arXiv 2021, arXiv:2102.04306. [Google Scholar]
- Huang, Z.; Wang, X.; Huang, L.; Huang, C.; Wei, Y.; Liu, W. CCNet: Criss-Cross Attention for Semantic Segmentation. In Proceedings of the International Conference on Computer Vision, Seoul, Korea, 27–28 October 2019; pp. 603–612. [Google Scholar]
- Everingham, M.; Eslami, S.; Gool, L.V.; Williams, C.; Winn, J.; Zisserman, A. The pascal visual object classes challenge: A retrospective. Int. J. Comput. Vis. 2015, 111, 98–136. [Google Scholar] [CrossRef]
Figure 1.
Video capture scene: (a) piggery during the day; (b) another piggery at night; (c) camera position.
Figure 1.
Video capture scene: (a) piggery during the day; (b) another piggery at night; (c) camera position.

Figure 2.
Pig images in different environments: (a) overlap of pigs; (b) object occlusion; (c) adhesion of pigs; (d) light; (e) nature; (f) other interfering factors; (g) lightweight herd (1–10 pigs); (h) middleweight herd (10–20 pigs); (i) heavyweight herd (over 20 pigs).
Figure 2.
Pig images in different environments: (a) overlap of pigs; (b) object occlusion; (c) adhesion of pigs; (d) light; (e) nature; (f) other interfering factors; (g) lightweight herd (1–10 pigs); (h) middleweight herd (10–20 pigs); (i) heavyweight herd (over 20 pigs).

Figure 3.
The DeepLab v3+ network structure.

Figure 4.
Row-based attention module.

Figure 5.
Column-based attention module.

Figure 6.
Recursive mechanism.

Figure 7.
Light attention DeepLab V3+ network structure.

Figure 8.
Comparison of training loss of different models: Here, loss1 represents our method in this study; loss2 represents the traditional DeepLab v3+ result; loss3 represents the DenseNet result; loss4 represents the SegNet result; loss5 represents the U-Net result; loss6 represents the FCNNs result.

Figure 9.
Processing speed of our method.

Figure 10.
Comparison results of different segmentation models: (a) lightweight image; (b) middleweight image; (c) heavyweight image.
Figure 10.
Comparison results of different segmentation models: (a) lightweight image; (b) middleweight image; (c) heavyweight image.

Figure 11.
Segmentation results of different scenes.

Figure 12.
Segmentation results of different scenes on PASCAL VOC 2012: (a) people scene; (b) sky and people scene; (c) sky, people, and tree scene; (d) tree scene; (e) tree and people scene.
Figure 12.
Segmentation results of different scenes on PASCAL VOC 2012: (a) people scene; (b) sky and people scene; (c) sky, people, and tree scene; (d) tree scene; (e) tree and people scene.

Figure 13.
Counting application of pigs in complex environments based on the H5 program. (a) The home page; (b) The lightweight image (1–10 pigs); (c) The middle-weight images (10–20 pigs); (d) The heavyweight images (more than 20 pigs)
Figure 13.
Counting application of pigs in complex environments based on the H5 program. (a) The home page; (b) The lightweight image (1–10 pigs); (c) The middle-weight images (10–20 pigs); (d) The heavyweight images (more than 20 pigs)

Figure 14.
Results of false and missing segmentation. (a) missing segmentation indoors; (b) mis-segmentation outdoors; (c) mis-segmentation indoors; (d) missing segmentation outdoors
Figure 14.
Results of false and missing segmentation. (a) missing segmentation indoors; (b) mis-segmentation outdoors; (c) mis-segmentation indoors; (d) missing segmentation outdoors

Figure 15.
Error examples in counting applications: (a) missing segmentation; (b) mis-segmentation; (c) missing count; (d) pressure test.
Figure 15.
Error examples in counting applications: (a) missing segmentation; (b) mis-segmentation; (c) missing count; (d) pressure test.


Table 1.
Segmentation results of the different methods.
| Methods | P | R | AP | F1-Score | MIoU |
| FCNNs | 71.60% | 68.46% | 51.43% | 0.69 | 62.21% |
| U-Net | 74.46% | 68.66% | 56.04% | 0.71 | 62.64% |
| SegNet | 78.04% | 62.66% | 65.39% | 0.69 | 68.52% |
| DenseNet | 76.14% | 68.94% | 72.70% | 0.72 | 73.98% |
| DeepLab v3+ | 84.10% | 74.75% | 75.88% | 0.79 | 70.51% |
| LA-DeepLab v3+ (single tag) | 86.04% | 75.06% | 78.67% | 0.80 | 76.31% |
| LA-DeepLab v3+ (multiple tags) | 88.36% | 70.03% | 76.75% | 0.78 | 74.62% |
Publisher’s Note: MDPI stays neutral with regard to jurisdictional claims in published maps and institutional affiliations. |
© 2022 by the authors. Licensee MDPI, Basel, Switzerland. This article is an open access article distributed under the terms and conditions of the Creative Commons Attribution (CC BY) license (https://creativecommons.org/licenses/by/4.0/).
Share and Cite
MDPI and ACS Style
Liu, C.; Su, J.; Wang, L.; Lu, S.; Li, L. LA-DeepLab V3+: A Novel Counting Network for Pigs. Agriculture 2022, 12, 284. https://0-doi-org.brum.beds.ac.uk/10.3390/agriculture12020284
AMA Style
Liu C, Su J, Wang L, Lu S, Li L. LA-DeepLab V3+: A Novel Counting Network for Pigs. Agriculture. 2022; 12(2):284. https://0-doi-org.brum.beds.ac.uk/10.3390/agriculture12020284
Chicago/Turabian StyleLiu, Chengqi, Jie Su, Longhe Wang, Shuhan Lu, and Lin Li. 2022. "LA-DeepLab V3+: A Novel Counting Network for Pigs" Agriculture 12, no. 2: 284. https://0-doi-org.brum.beds.ac.uk/10.3390/agriculture12020284
Note that from the first issue of 2016, this journal uses article numbers instead of page numbers. See further details here.