Article

Measurement and Calibration of the Discrete Element Parameters of Coated Delinted Cotton Seeds

1
College of Engineering, Huazhong Agricultural University, Wuhan 430070, China
2
Key Laboratory of Agricultural Equipment in Mid-Lower Yangtze River, Ministry of Agriculture and Rural Affairs, Wuhan 430070, China
*
Author to whom correspondence should be addressed.
Submission received: 29 January 2022 / Revised: 9 February 2022 / Accepted: 14 February 2022 / Published: 17 February 2022
(This article belongs to the Section Agricultural Technology)

Abstract

:
To simulate the interactions between a pneumatic cotton precision seed-metering device and coated delinted cotton seeds accurately, physical and simulation experiments based on a rotating drum apparatus were combined to calibrate the discrete element simulation parameters of E`kangmian-10 cotton seeds. Firstly, the contact parameters and the dynamic repose angle of the cotton seeds were measured through physical tests. Based on the particle size requirement of the Discrete Element Method (DEM) and Computational Fluid Dynamics (CFD) coupling simulation and the reverse engineering technology, the cotton seed discrete element bonded-particle model (BPM) was established. Secondly, taking the contact parameters as calibration objects and the simulated dynamic repose angle as the evaluation index, a Plackett–Burman (PB) test was designed for significance screening. The results of the screening test showed that the static friction coefficient of cotton seed–tough photosensitive resin, the impact recovery coefficient of cotton seed–cotton seed, and the static friction coefficient of cotton seed–cotton seed had a highly significant effect on the simulated dynamic repose angle. Next, a Box–Behnken Design (BBD) test was adopted to establish the quadratic regression model between significant parameters and the simulated dynamic repose angle, and then the multi-factor optimization solution was carried out to obtain the optimal combination of parameters: the static friction coefficient of cotton seed–tough photosensitive resin and the impact recovery coefficient and static friction coefficient of cotton seed–cotton seed were 0.33, 0.06 and 0.10, respectively. Lastly, verification tests on the rotating drum apparatus and the seed-metering device were performed, and their relative errors were less than 2%, which indicated that the discrete element models and the contact parameters of the coated delinted cotton seeds were reliable. This study provides a reference for the selection of the discrete element parameters of coated delinted cotton seeds for DEM-CFD coupling simulation and the optimal design of precision seed-metering device for cotton.

1. Introduction

Cotton is an important cash crop and raw material in China, and plays a pivotal role in the national economy [1]. Mechanized precision sowing is one of the main ways to improve cotton planting efficiency. As the core component of cotton planters, the working performance of seed-metering devices directly affects the cotton sowing quality. In order to improve the operation effect of seed-metering devices, researchers at home and abroad have conducted many studies [2,3,4,5,6,7]. Due to the complex stress on the seed during the operation of the seed-metering device, it is difficult to accurately analyze the working mechanism and seed movement in the seed-metering device only by experimental research. As a reliable numerical simulation technology for simulating the motion of granular materials, the discrete element method (DEM) can reveal the movement processes of particle accumulation, flow and two-phase flow, and accurately describe the force and motion state between particles, between particles and shell, and between particles and fluid. In recent years, DEM has been widely used in the field of seed-metering device research and development [8,9,10,11,12].
Accurate input of particle model and simulation parameters in EDEM software is the first step to ensure simulation accuracy. For the pneumatic seed-metering device, the DEM-CFD coupling approach combining computational fluid dynamics (CFD) and the discrete element method is usually applied to simulate the operation process of the seed-metering device. Because the coupling module is based on the sampling point method for numerical simulation, in order to accurately calculate the particle volume fraction and momentum source term and avoid the distortion of flow field calculation, it is necessary to meet the requirement that the particle volume is smaller than the minimum volume of the airflow field grid [13]. At present, there are mainly two approaches to this problem: flow field model simplification and seed bonded-particle modeling. Since the suction hole structure inside the seed-metering disc is generally small and fine, if the flow field model is simplified, it will have a great impact on the simulation accuracy of the seed-metering device. Therefore, the bonded-particle model (BPM) is usually used to establish a seed discrete element simulation model in studies, that is, a single seed is formed by a plurality of independent fraction particles through adhesive bonds, and each fraction particle participates in the coupling calculation separately, which can meet the requirement that the particle volume is smaller than the minimum volume of flow field grid by limiting their size [14].
Discrete element simulation parameters mainly include intrinsic parameters (Poisson’s ratio, density, shear modulus, etc.) and contact parameters (impact recovery coefficient, static friction coefficient, rolling friction coefficient, etc.). Intrinsic parameters are inherent characteristic parameters of seeds and can be obtained through a bench test. Existing studies have shown that the intrinsic parameters of the particle model have no significant effect on simulation results [15,16,17,18,19]. The intrinsic parameters in simulation are generally input to physical tests’ measured values. However, the seed model is a multi-sphere agglomerate, and its geometric shape is different from the real seed, so the contact parameters need to be recalibrated. Presently, scholars around the world have conducted much research on the calibration of simulation parameters for agricultural materials such as seeds. For example, Ghodki et al. established a single ball discrete element model for soybean seeds and calibrated the rolling friction coefficient in combination with a static repose angle test [20]. Mohammad et al. optimized the discrete element model and contact parameters of maize seed through a static repose angle comparison test, and verified it with a grain flow rate of screw conveyor [21]. Coetzee et al. calibrated the stiffness and friction coefficient of the corn seed multi-sphere agglomerate discrete element model by compression and shear tests, and validated it by modelling silo discharge and bucket filling tests [22]. Zhou long et al. established discrete element models for four different shapes of corn seeds by the multi-sphere method, calibrated the rolling friction coefficient using a single-factor test, and verified the feasibility and effectiveness of the corn seed modeling method by comparing and analyzing the experimental and simulation results of bulk density, angle of repose, and “self-flow screening” [23]. Yu Qingxu et al. created the discrete element model of panax notoginseng seed by using reverse engineering technology and a bonded-particle model, calibrated the contact parameters through a single-factor test, as well as the steepest climbing and quadratic regression orthogonal rotation combination test, and carried out the seeding performance test of a panax notoginseng precision seed-metering device to verify the reliability of the calibration parameters [19]. Shi Linrong et al. obtained the flax seed material parameters through physical tests, calibrated the rolling friction coefficient by stacking tests, and performed the seeding performance test of a heterosexous hole seeding device to verify the reliability of the simulation parameters [24]. Wu Mengchen et al. established the discrete element model of peanut seed by using the multi-sphere agglomerate method, calibrated the friction coefficient between peanut seeds through a particle stacking test, and conducted the bench and simulation comparison test of a mechanical peanut precision seed-metering device [25]. Zhang Rongfang et al. established the rice seed bonded-particle model, calibrated the friction coefficient between seeds by sliding stacking and cylinder lifting tests, and analyzed the influence of different filled particle sphere radiuses on the stability of the simulated repose angle [14].
According to the current status of research on the calibration of simulation parameters of agricultural materials such as seeds, it is found that there are few studies on the discrete element modeling and calibration of simulation parameters of the coated delinted cotton seed, and most of the studies used static tests such as static repose angle, or stacking angle and bulk density to calibrate the simulation parameters of the seeds. Since the structure type of a cotton precision seed-metering device is inside-filling pneumatic [4], during operation of the seed-metering device, the seeds in the inner cavity undergo a circulation movement, and the coverage area directly affects the seed filling performance. Compared with the static test, the rotating drum method can better describe the distribution state of the seeds in the inner cavity during the movement of the seed-metering device. Therefore, the physical test and simulation test with the rotating drum method were carried out in this paper. Firstly, the contact parameters and dynamic repose angle of cotton seed were measured through physical tests. Secondly, based on the particle size requirement of the DEM-CFD coupling simulation, combined with reverse engineering technology, cotton seed discrete element bonded-particle models were established. Next, the simulated dynamic repose angle was taken as the evaluation index, and a Plackett–Burman (PB) test and Box–Behnken Design (BBD) test with rotating drum apparatus were adopted to calibrate the simulation parameters of the cotton seeds. Lastly, the reliability of the discrete element models and the simulation parameters of cotton seeds were verified by rotating drum apparatus and seed-metering device experiments, in order to provide basic data for the follow-up study on the simulation parameters of coated delinted cotton seeds in the DEM-CFD coupling simulation of the cotton seed-metering device.

2. Materials and Methods

2.1. Materials

The coated delinted cotton seed variety E`kangmian-10 was taken as research object, provided by Hubei Fuyue Seed Industry Technolgy Co., Ltd. (Wuhan, China). A number of 300 cotton seeds were randomly selected, their triaxial dimensions (length, width and thickness) were measured with a digital vernier caliper (accuracy of 0.02 mm), and the average value was 9.27 mm × 5.14 mm × 4.50 mm. Based on the caliper measurements, it was determined that the seeds had either an ellipsoidal shape or a rectangular block shape (referred to as “flat” in this manuscript). The ratio of seeds with an ellipsoidal shape to those with a flat shape was 22:3. Meanwhile, according to the research of Hu et al. [26], the intrinsic parameters of the E`kangmian-10 cotton seeds (moisture 11.06% wb, mass of 1000 cotton seeds 94.50 g) are as follows: Poisson’s ratio is 0.14, shear modulus is 4.01 MPa and density is 9.17 × 10² kg·m−3.
Because 3D printing technology can rapidly process high-quality complex models, it has been widely applied in the research field of precision seed-metering devices [25,27]. In this paper, the key components of the seed-metering device were manufactured in layers using laser curing molding technology by an iSLA660 industrial-grade light-curing 3D printer (accuracy of 0.05 mm), produced by Wujiang Zhongrui Technology Co., Ltd. (Wujiang, China). Materials of parts directly in contact with cotton seeds were selected as tough photosensitive resin and fully transparent photosensitive resin, and their intrinsic parameters are shown in Table 1.

2.2. Determination of Contact Parameters

During the operation of the seed-metering device, the contact objects of a single cotton seed particle were the tough photosensitive resin, the fully transparent photosensitive resin and other cotton seeds. Therefore, the contact parameters of coated delinted cotton seeds required in the discrete element simulation test included the impact recovery coefficient, static friction coefficient and rolling friction coefficient of cotton seed–tough photosensitive resin, cotton seed–fully transparent photosensitive resin and cotton seed–cotton seed.

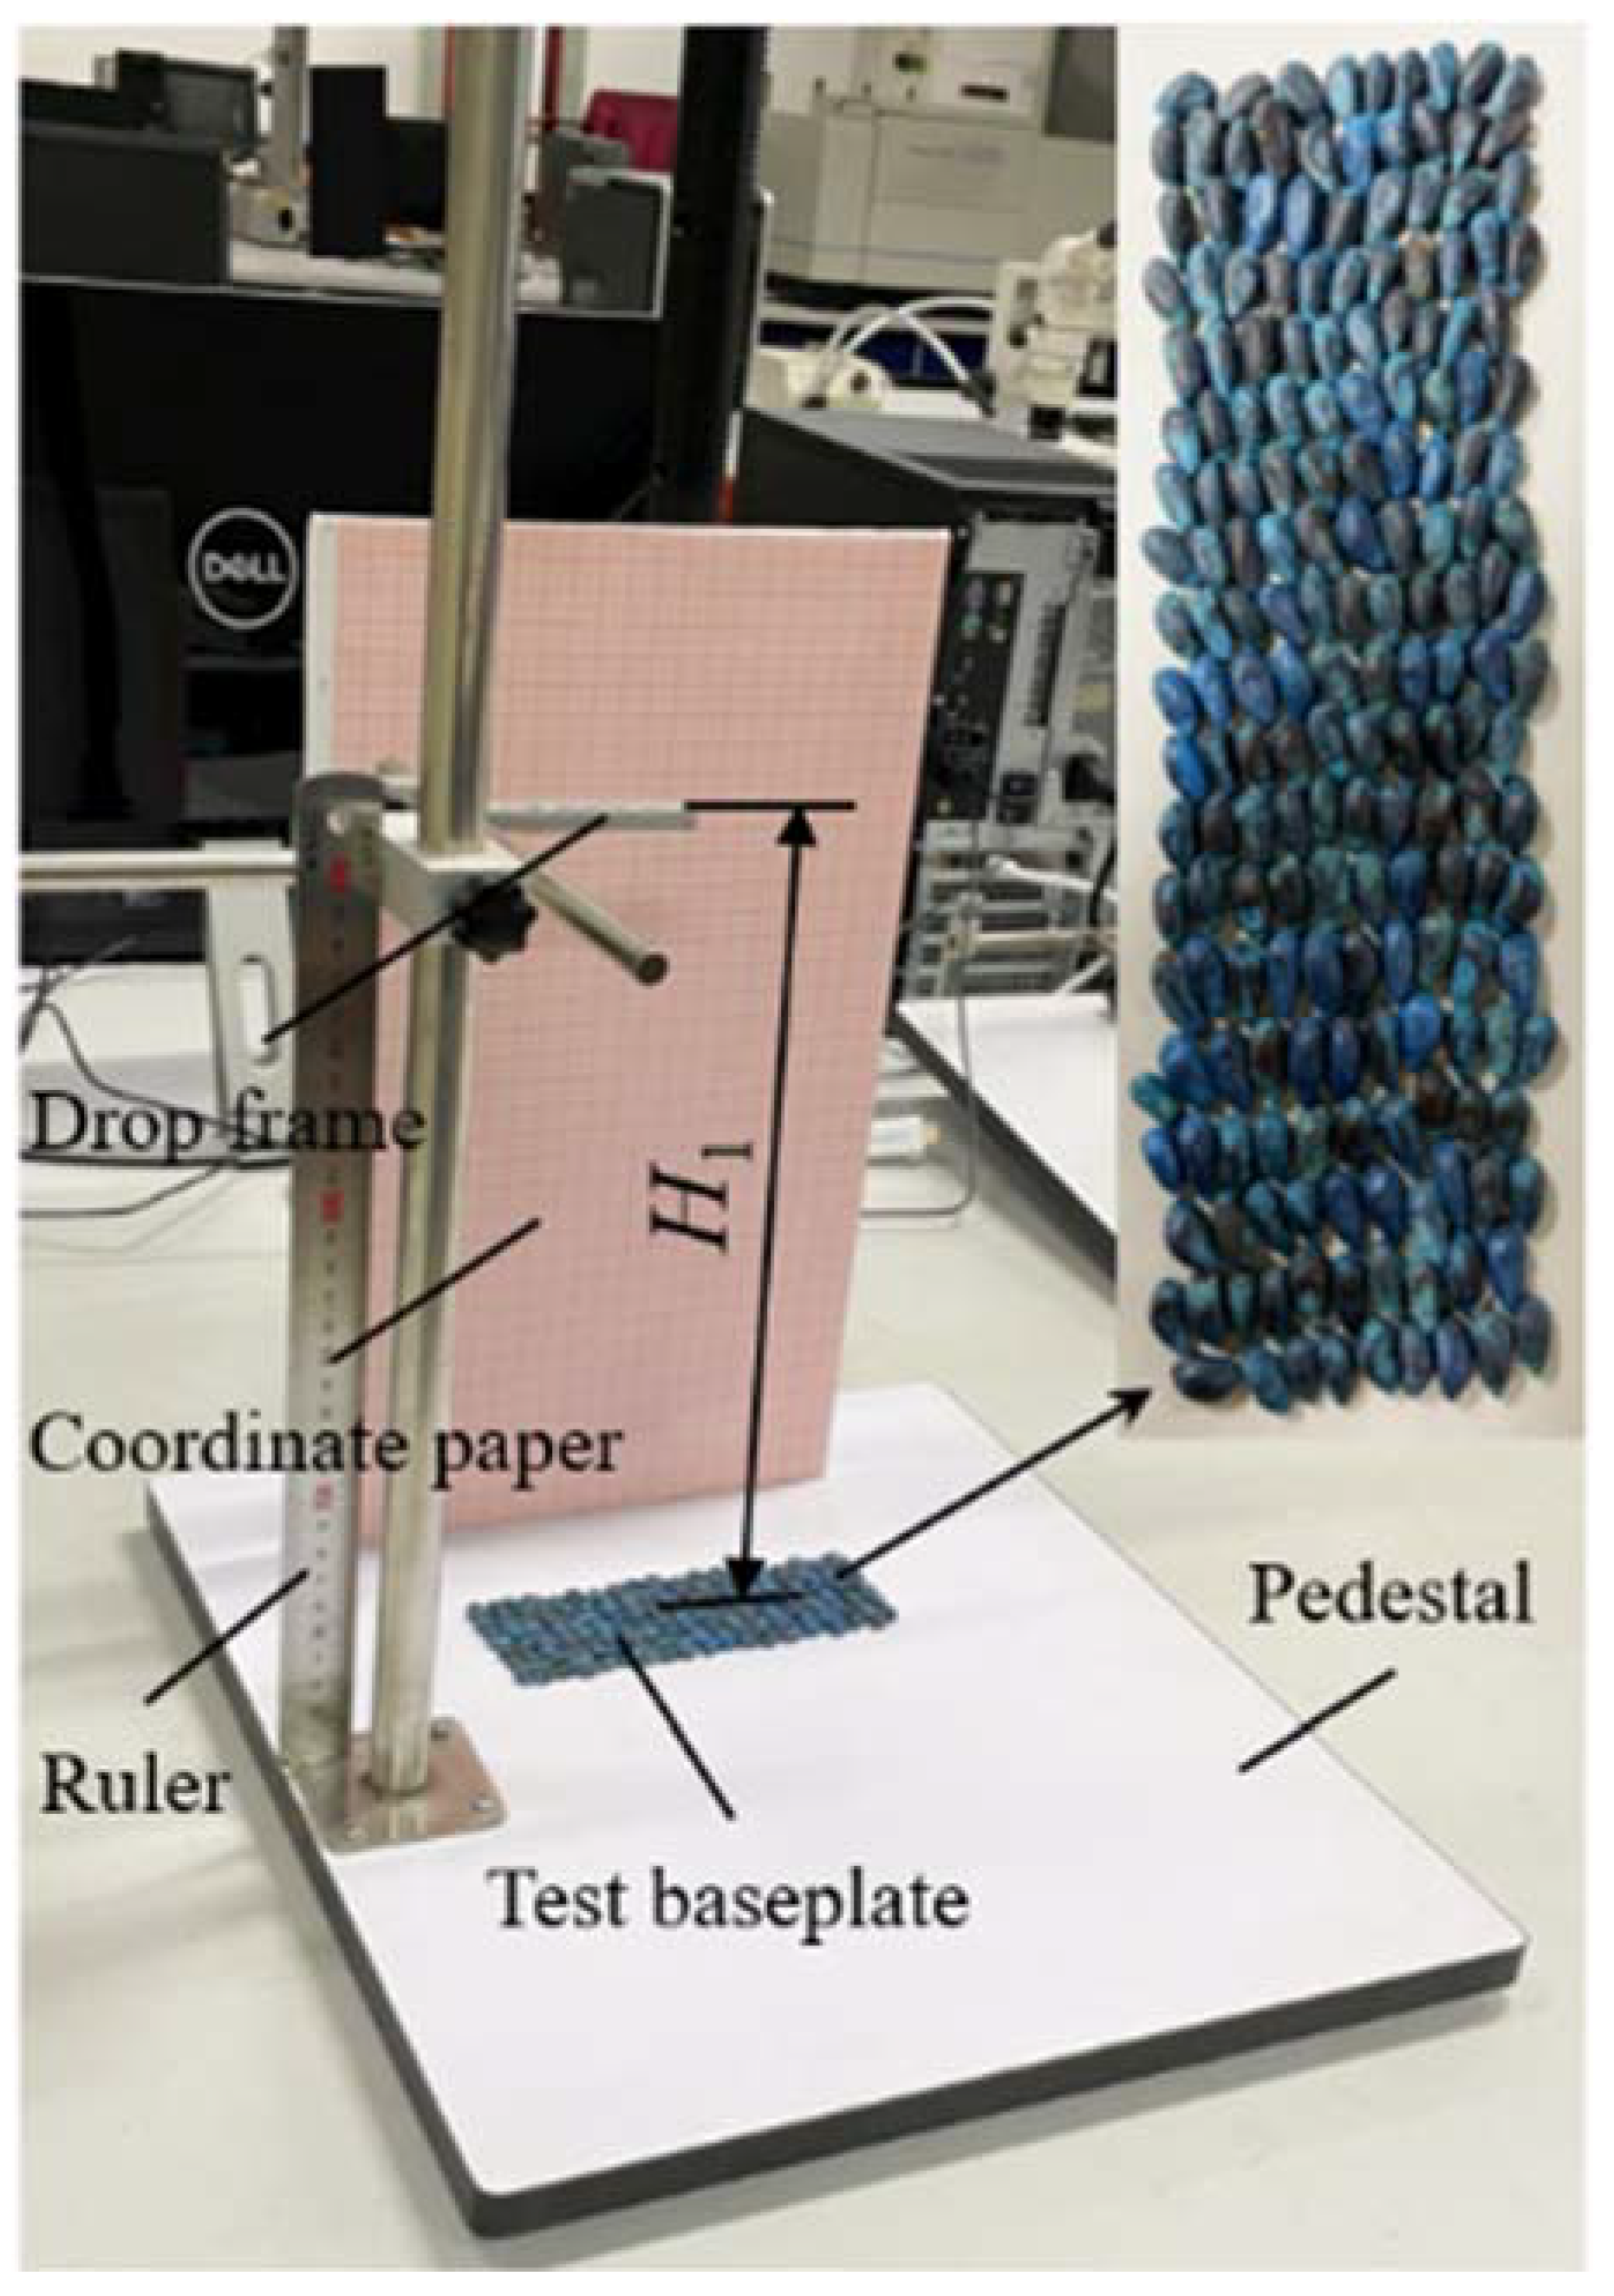
2.2.1. Impact Recovery Coefficient

The impact recovery coefficient can represent the deformation recovery ability of an object after collision, which is defined as the ratio of the normal relative separation velocity of two objects at the contact point after collision to the normal relative approach velocity before collision [28]. In this paper, the impact bounce test was used to determine the impact recovery coefficient between cotton seed and contact materials, as shown in Figure 1. Thereby, 40 cotton seeds were randomly selected to fall freely along the same height on the upper surface of the end of the drop frame and collide with the test baseplate; their motion trajectory was recorded by the iPhone 12 camera (240 fps, Apple Inc., Cupertino, CA, USA), and combined with the rear coordinate paper to obtain the highest height of the cotton seed after collision with the test baseplate. According to the physical definition of the impact recovery coefficient, the recovery coefficient between the cotton seed and the test baseplate can be expressed as the ratio of the normal instantaneous separation speed ν2 and the instantaneous approach speed ν1 of the cotton seed and the test baseplate at the contact point, that is, the calculation formula of the impact recovery coefficient of the cotton seed and test baseplate is:
e = v 2 v 1 = 2 g H 2 2 g H 1 = H 2 H 1
where e is the impact recovery coefficient; ν2 is the normal instantaneous separation speed, m·s−1; ν1 is the instantaneous approach speed, m·s−1; H2 is the highest bouncing height of cotton seed after collision with the test baseplate, m; H1 is the initial falling height of cotton seed, m; g is the gravitational acceleration, m·s−2.
The impact recovery coefficient between cotton seed and different contact materials were measured by replacing the test baseplate with the contact materials, and when determining the impact recovery coefficient of cotton seed–cotton seed, the test baseplate was composed of closely arranged cotton seeds with similar thickness and pasted on the tape. Each group of tests was repeated 40 times, and after the tests, it was calculated that the range of impact recovery coefficient of cotton seed–tough photosensitive resin was 0.04~0.42, and the average value plus or minus one standard deviation from the mean was 0.13 ± 0.08; the range of impact recovery coefficient of cotton seed–fully transparent photosensitive resin was 0.03~0.33, and the average value plus or minus one standard deviation from the mean was 0.12 ± 0.07; the range of impact recovery coefficient of cotton seed–cotton seed was 0.01~0.18, and the average value plus or minus one standard deviation from the mean was 0.06 ± 0.05.

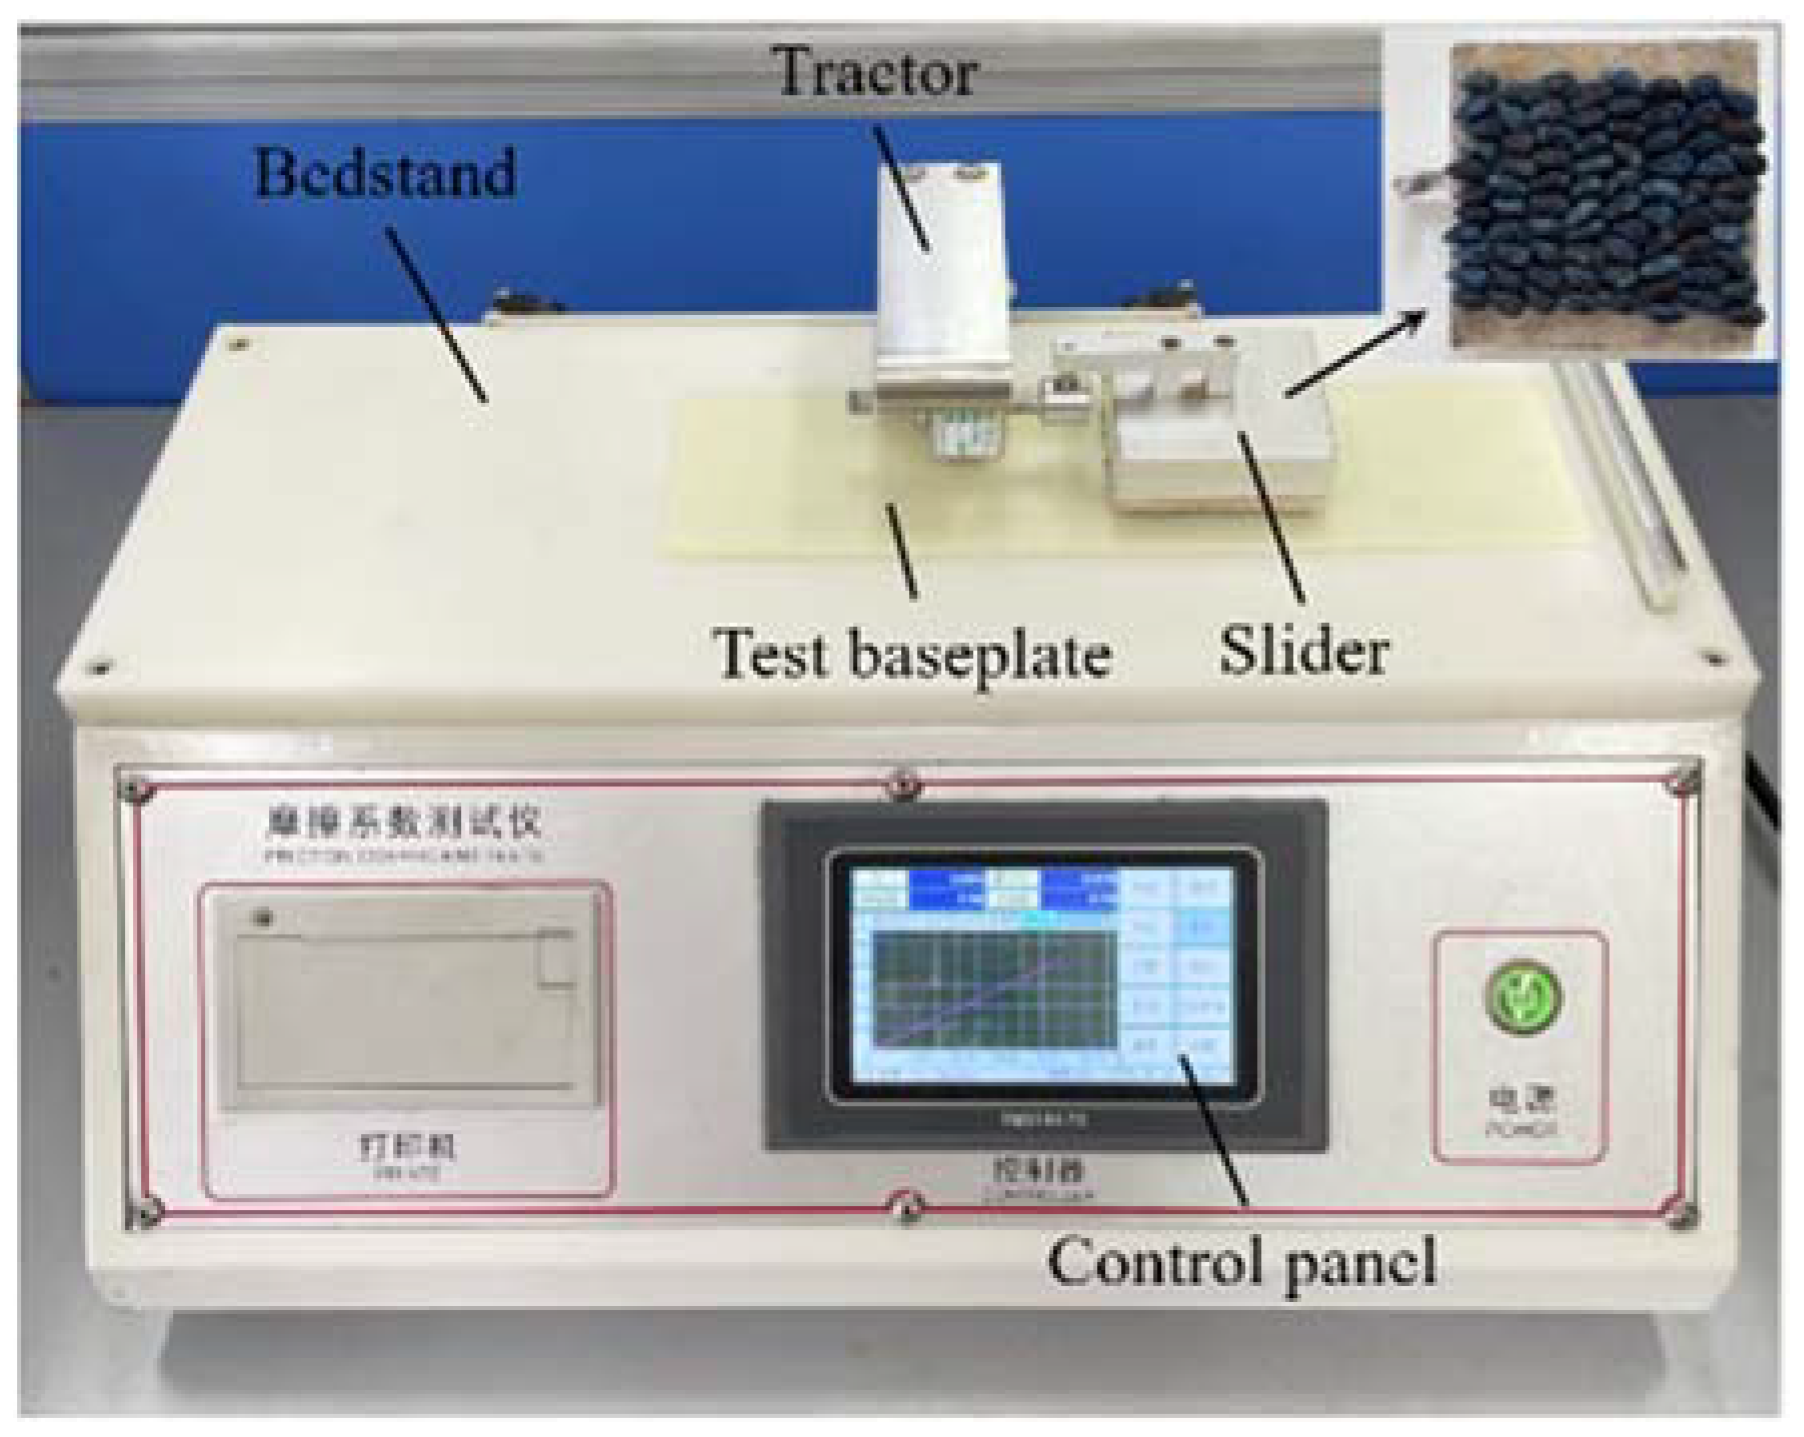
2.2.2. Static Friction Coefficient

During the operation process of the seed-metering device, most of the contact of cotton seed–cotton seed and cotton seed–seed-metering device is point contact, and the tangential resultant force is usually reflected by static friction force, so the determination of static friction coefficient has a certain impact on the simulation results [29]. Based on the processing mode and materials of the seed-metering device, the static friction coefficient of cotton seed–tough photosensitive resin, cotton seed-full transparent photosensitive resin and cotton seed–cotton seed were measured by the Friction Coefficient Tester (Xiamen EAST Instrument Co., Ltd., ST-MXZ-1 type, Xiamen, China). The measuring device is shown in Figure 2.
Before the test, several cotton seeds with similar thickness were selected to be closely arranged and pasted on the tape, and fixed on the bottom of the slider in reverse, so that the seed side was outward. Meanwhile, the test baseplate was pasted on the bedstand. During the test, the slider was hung on the tractor, and the cotton seeds at its bottom were in direct contact with the test baseplate. The relevant parameters on the measuring device were set as follows: forward speed was 100 mm/min, displacement was 75 mm, return speed was 300 mm/min. Each group of tests was repeated 5 times. After the tests, the measurement results and average values of the static friction coefficient of each group were output through the printer on the control panel. By changing the test baseplate, it was measured that the range of static friction coefficient of cotton seed–tough photosensitive resin was 0.30~0.42, and the average value plus or minus one standard deviation from the mean was 0.32 ± 0.05; the range of static friction coefficient of cotton seed–fully transparent photosensitive resin was 0.26~0.32, and the average value plus or minus one standard deviation from the mean was 0.29 ± 0.02; the range of the static friction coefficient of cotton seed–cotton seed was 0.53~0.61, and the average value plus or minus one standard deviation from the mean was 0.56 ± 0.03.

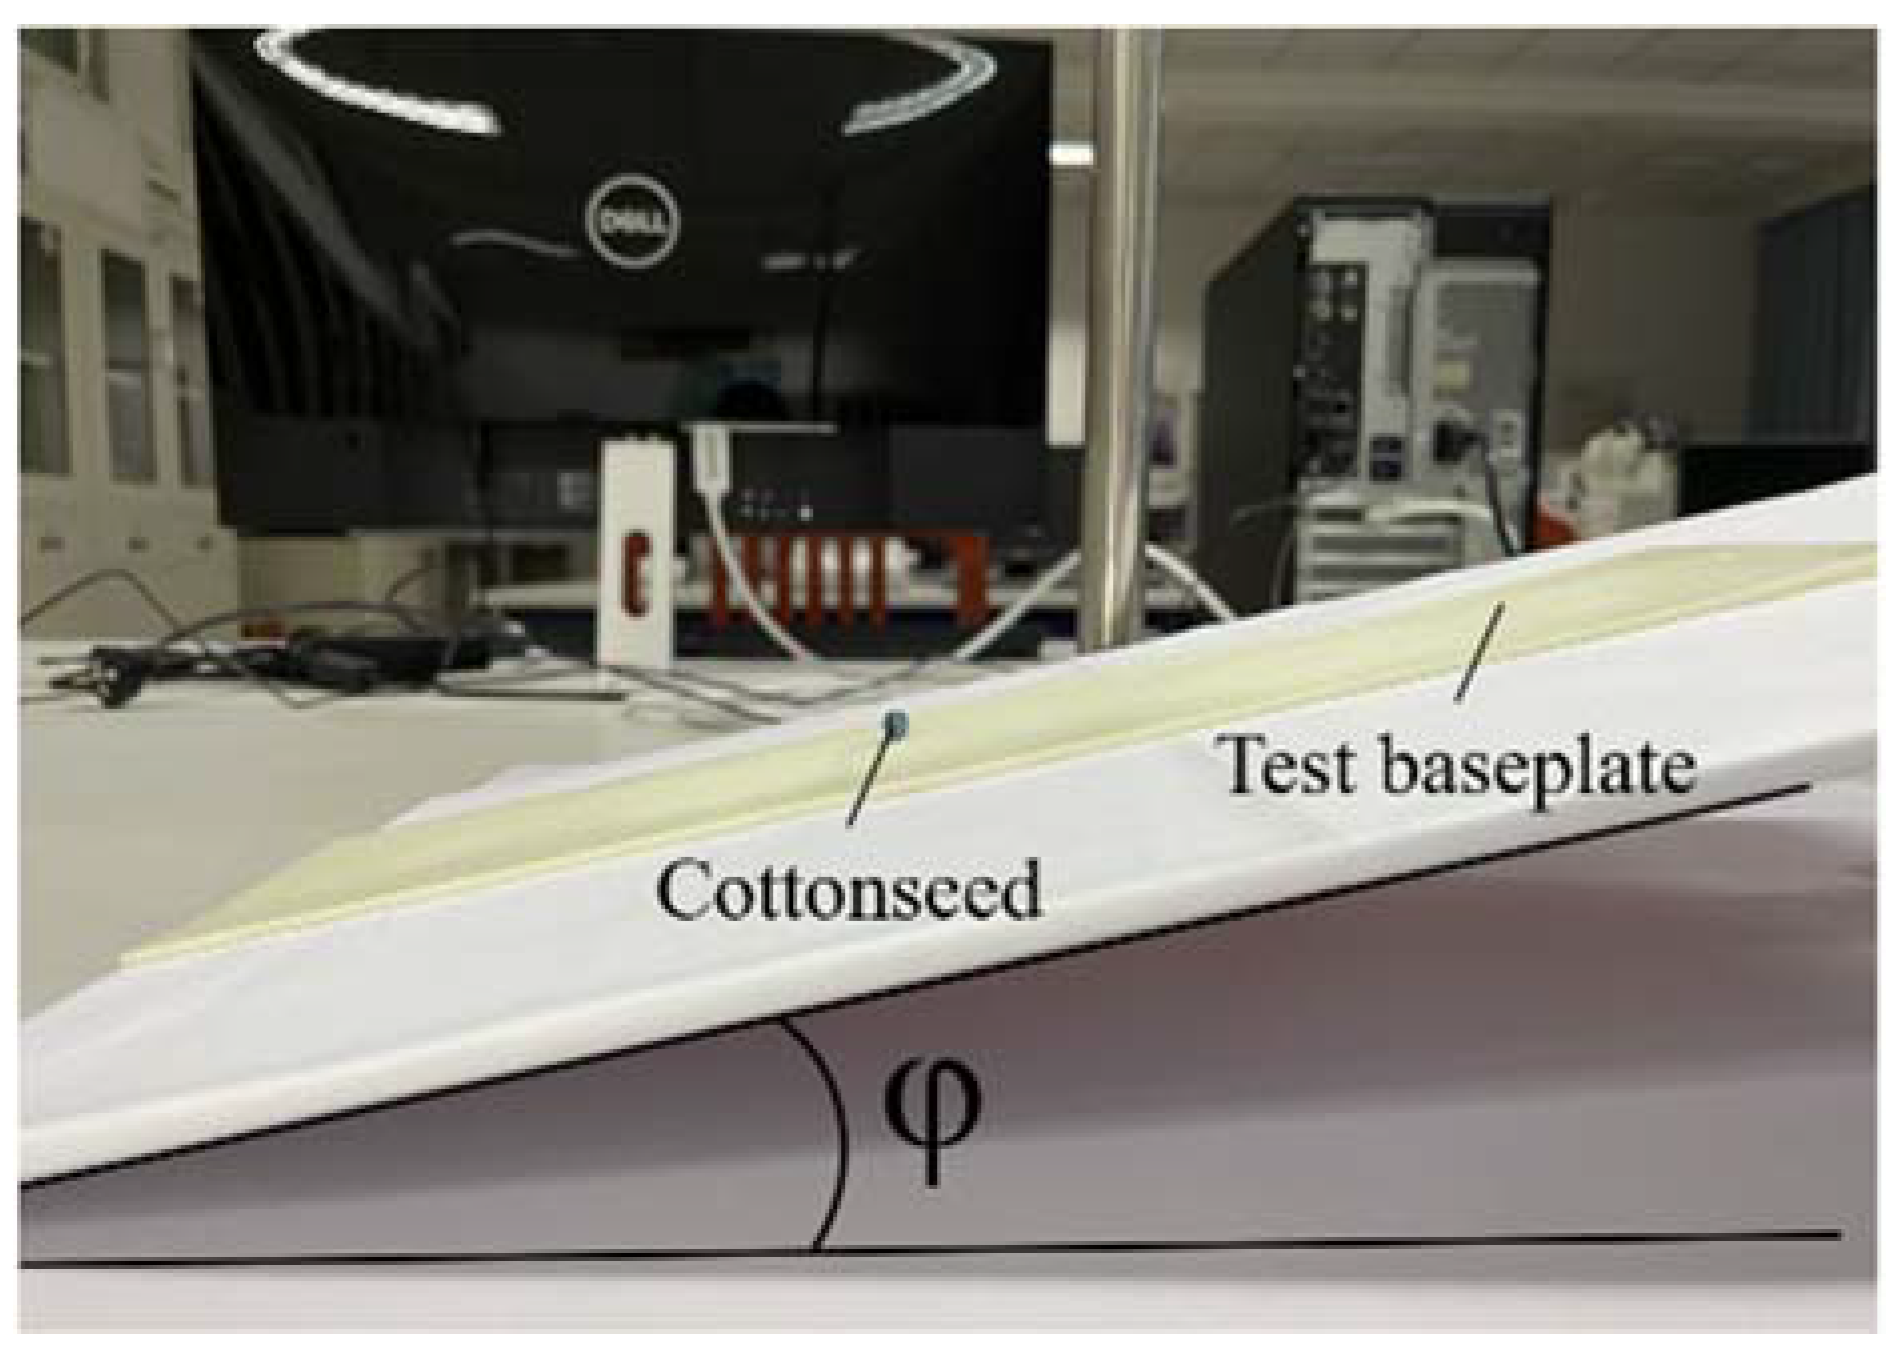
2.2.3. Rolling Friction Coefficient

The rolling friction coefficient reflects the rolling friction characteristics of the particles and the contact surface, which is related to the surface stiffness of the contact materials and the external dimension and quality of the particle [30]. In this paper, the slope method was used to determine the rolling friction coefficient between the cotton seed and its contact materials. The measuring device is shown in Figure 3.
In order to ensure the initial movement of cotton seeds along the inclined plane in the rolling state, 10 cotton seeds with similar width and thickness (the average difference between width and thickness was 0.25 mm) in the ellipsoidal shape cotton seeds were selected as the test objects, and the test baseplate materials were tough photosensitive resin, fully transparent photosensitive resin, and seed plate. Before the test, a cotton seed was placed on the upper surface of the test baseplate, and its long axis direction was parallel to the lower edge of the test baseplate. The angle between the test baseplate and the horizontal plane was slowly increased until the cotton seed began to roll down, and the inclination angle of the test baseplate was recorded at this moment, its tangent value was the rolling friction coefficient between the cotton seed and the test baseplate. Ten replicate tests were conducted for each cotton seed, with a total of 100 trials. After the test, it was calculated that the range of rolling friction coefficient of cotton seed–tough photosensitive resin was 0.09~0.35, and the average value plus or minus one standard deviation from the mean was 0.19 ± 0.06; the range of rolling friction coefficient of cotton seed–fully transparent photosensitive resin was 0.07~0.33, and the average value plus or minus one standard deviation from the mean was 0.18 ± 0.05; the range of rolling friction coefficient of cotton seed–cotton seed was 0.01~0.32, and the average value plus or minus one standard deviation from the mean was 0.15 ± 0.07.

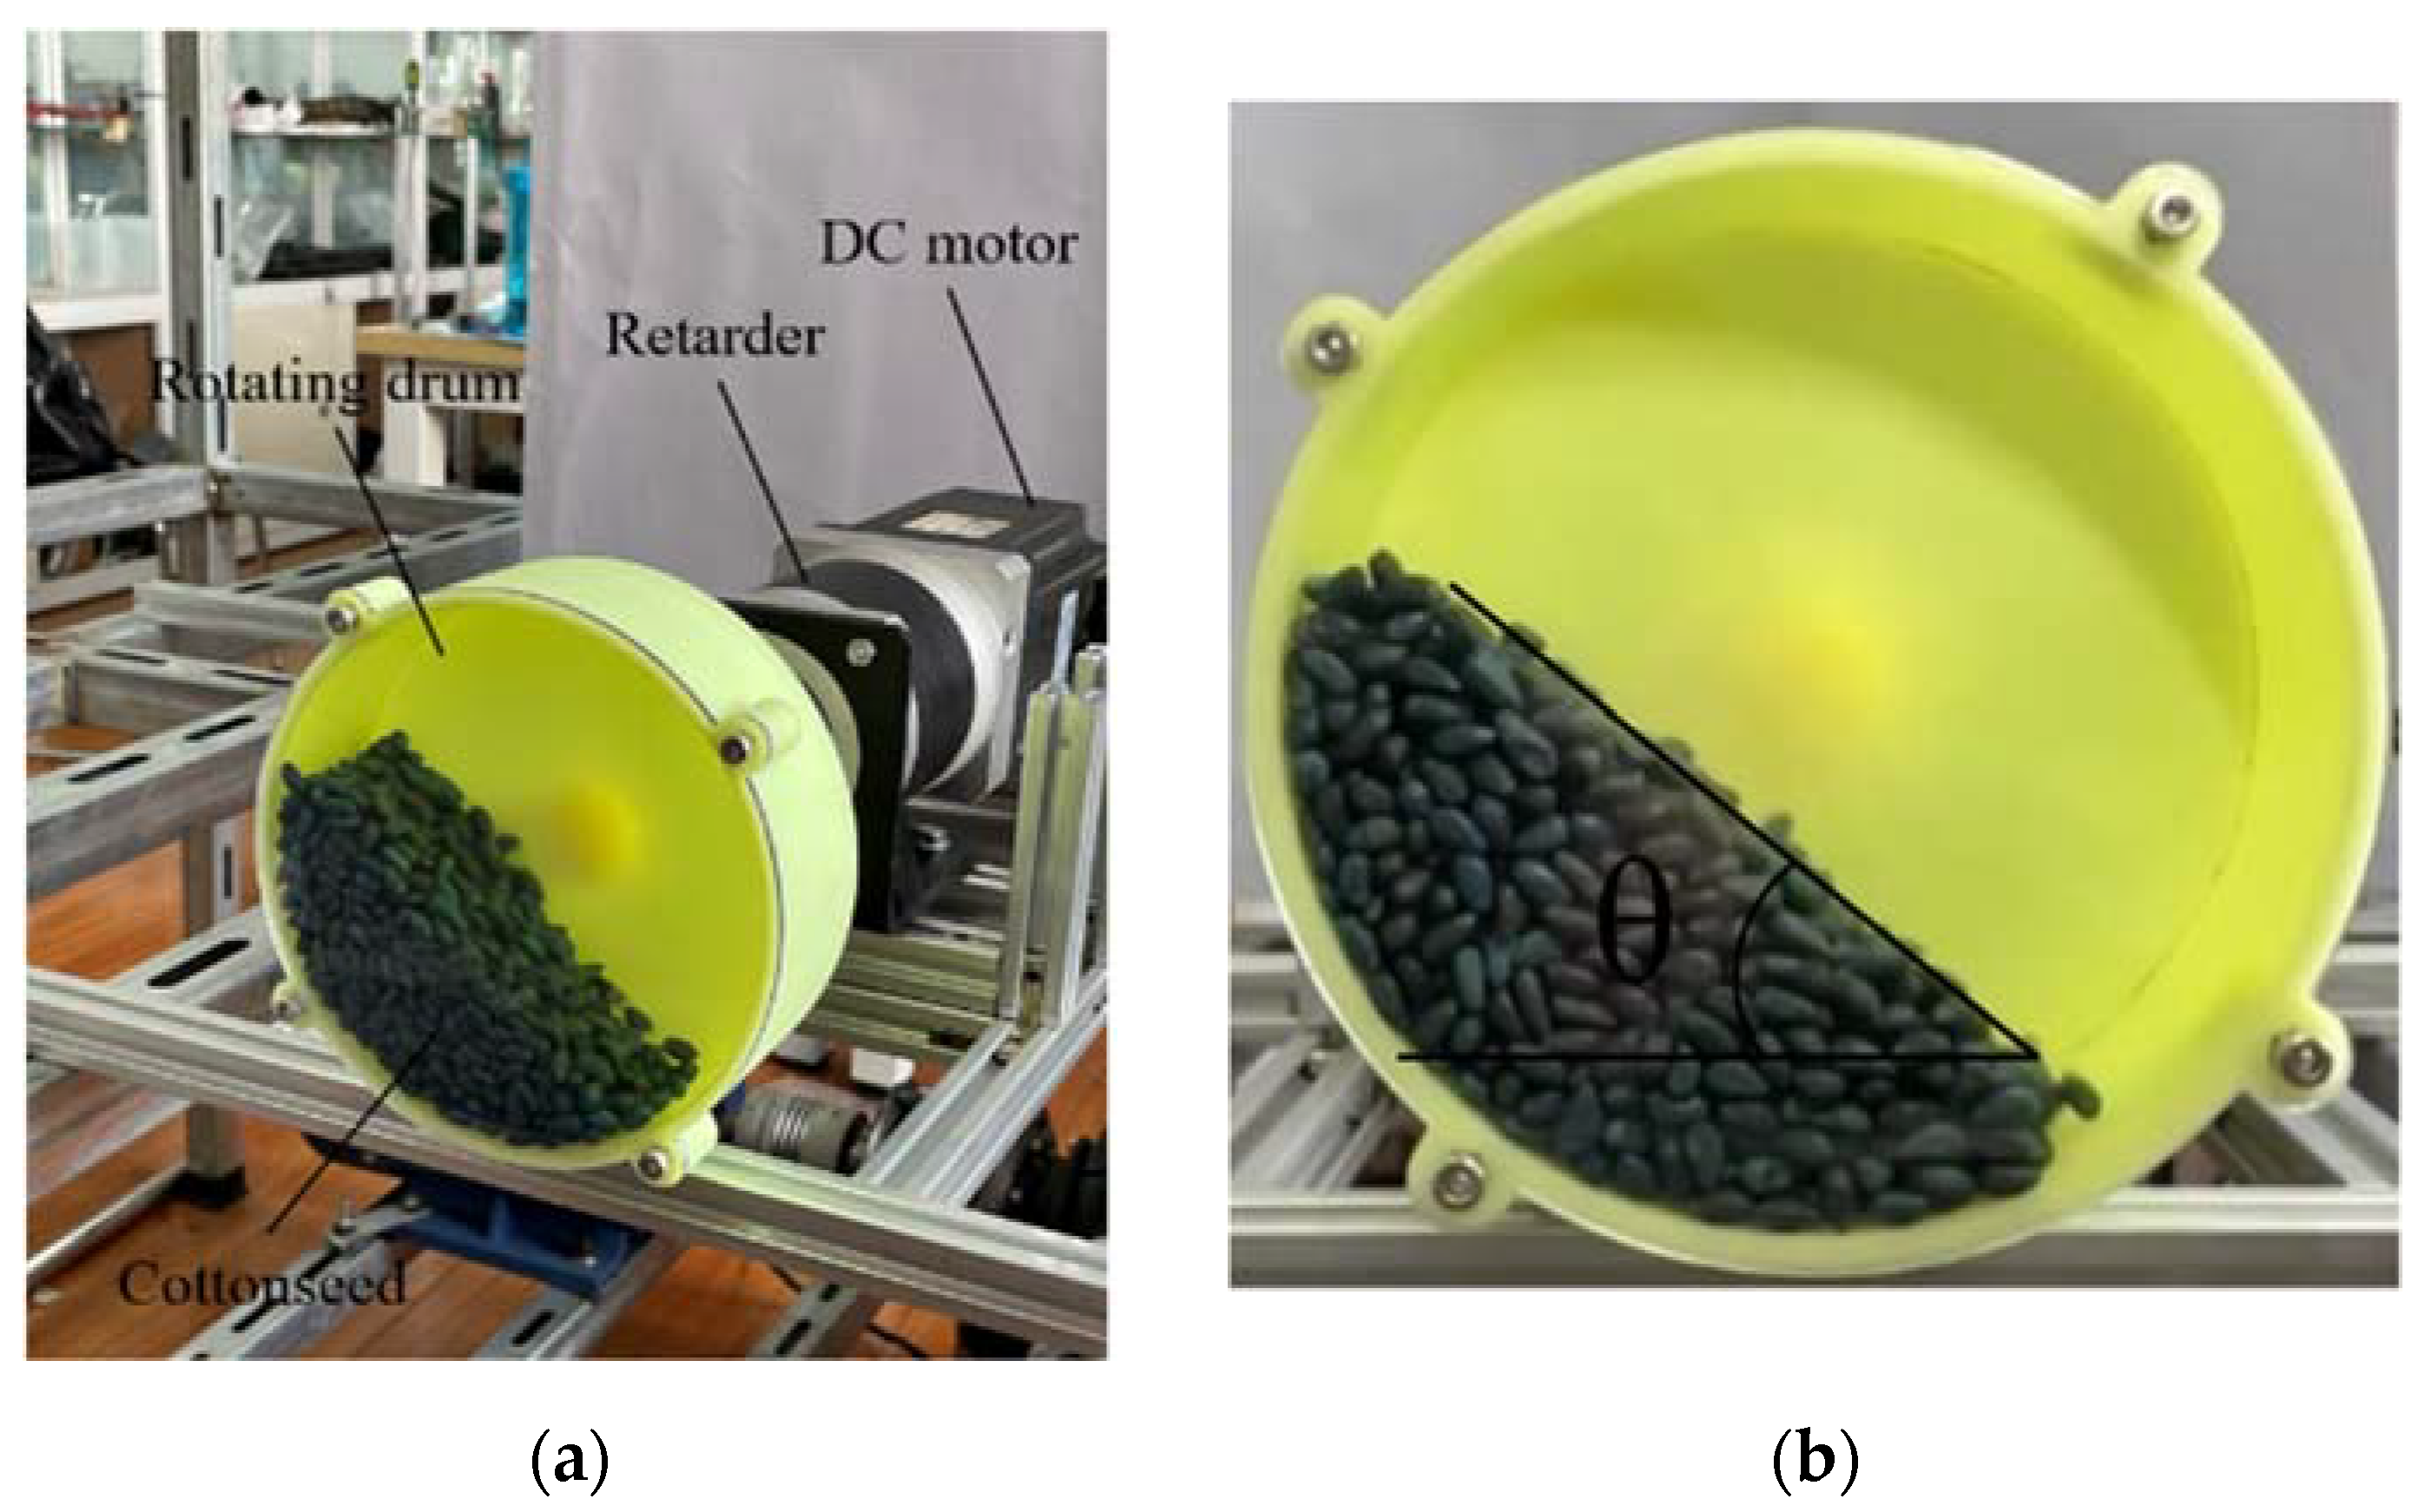
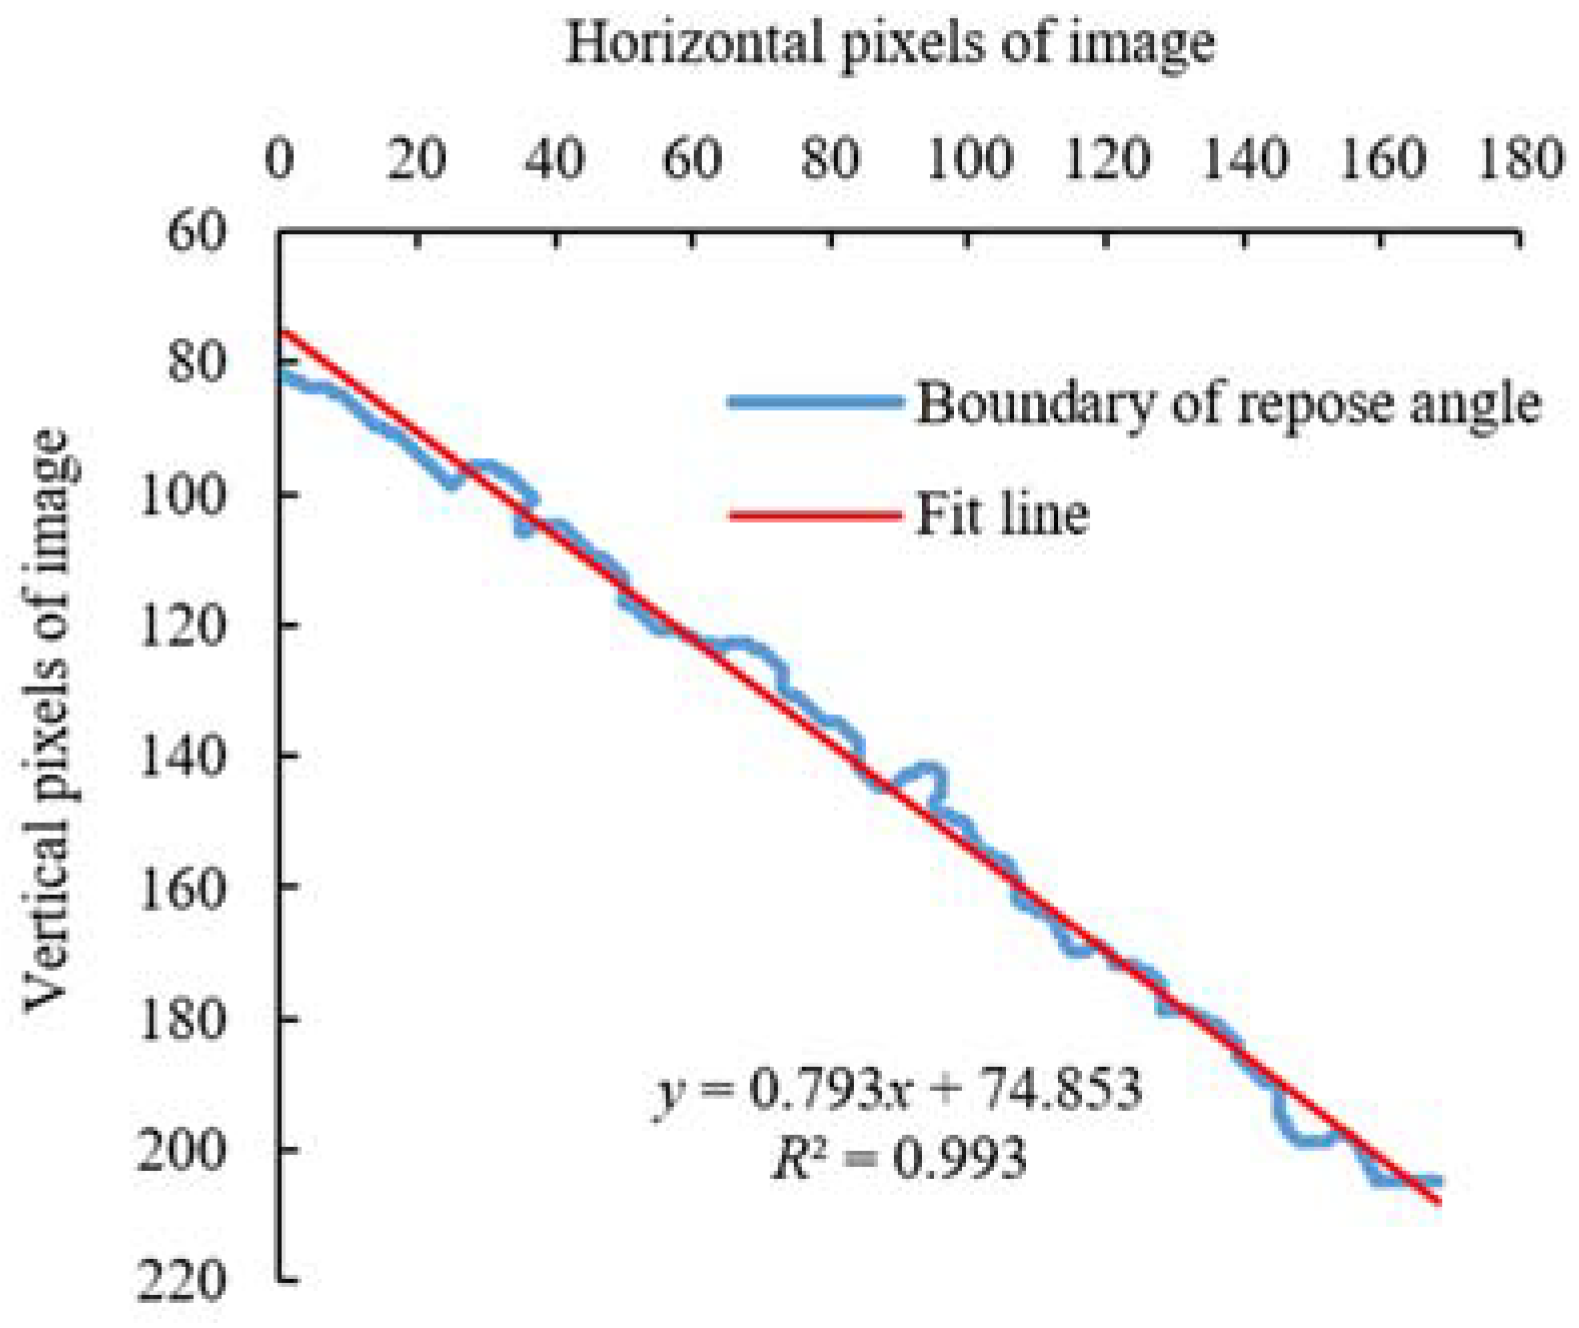
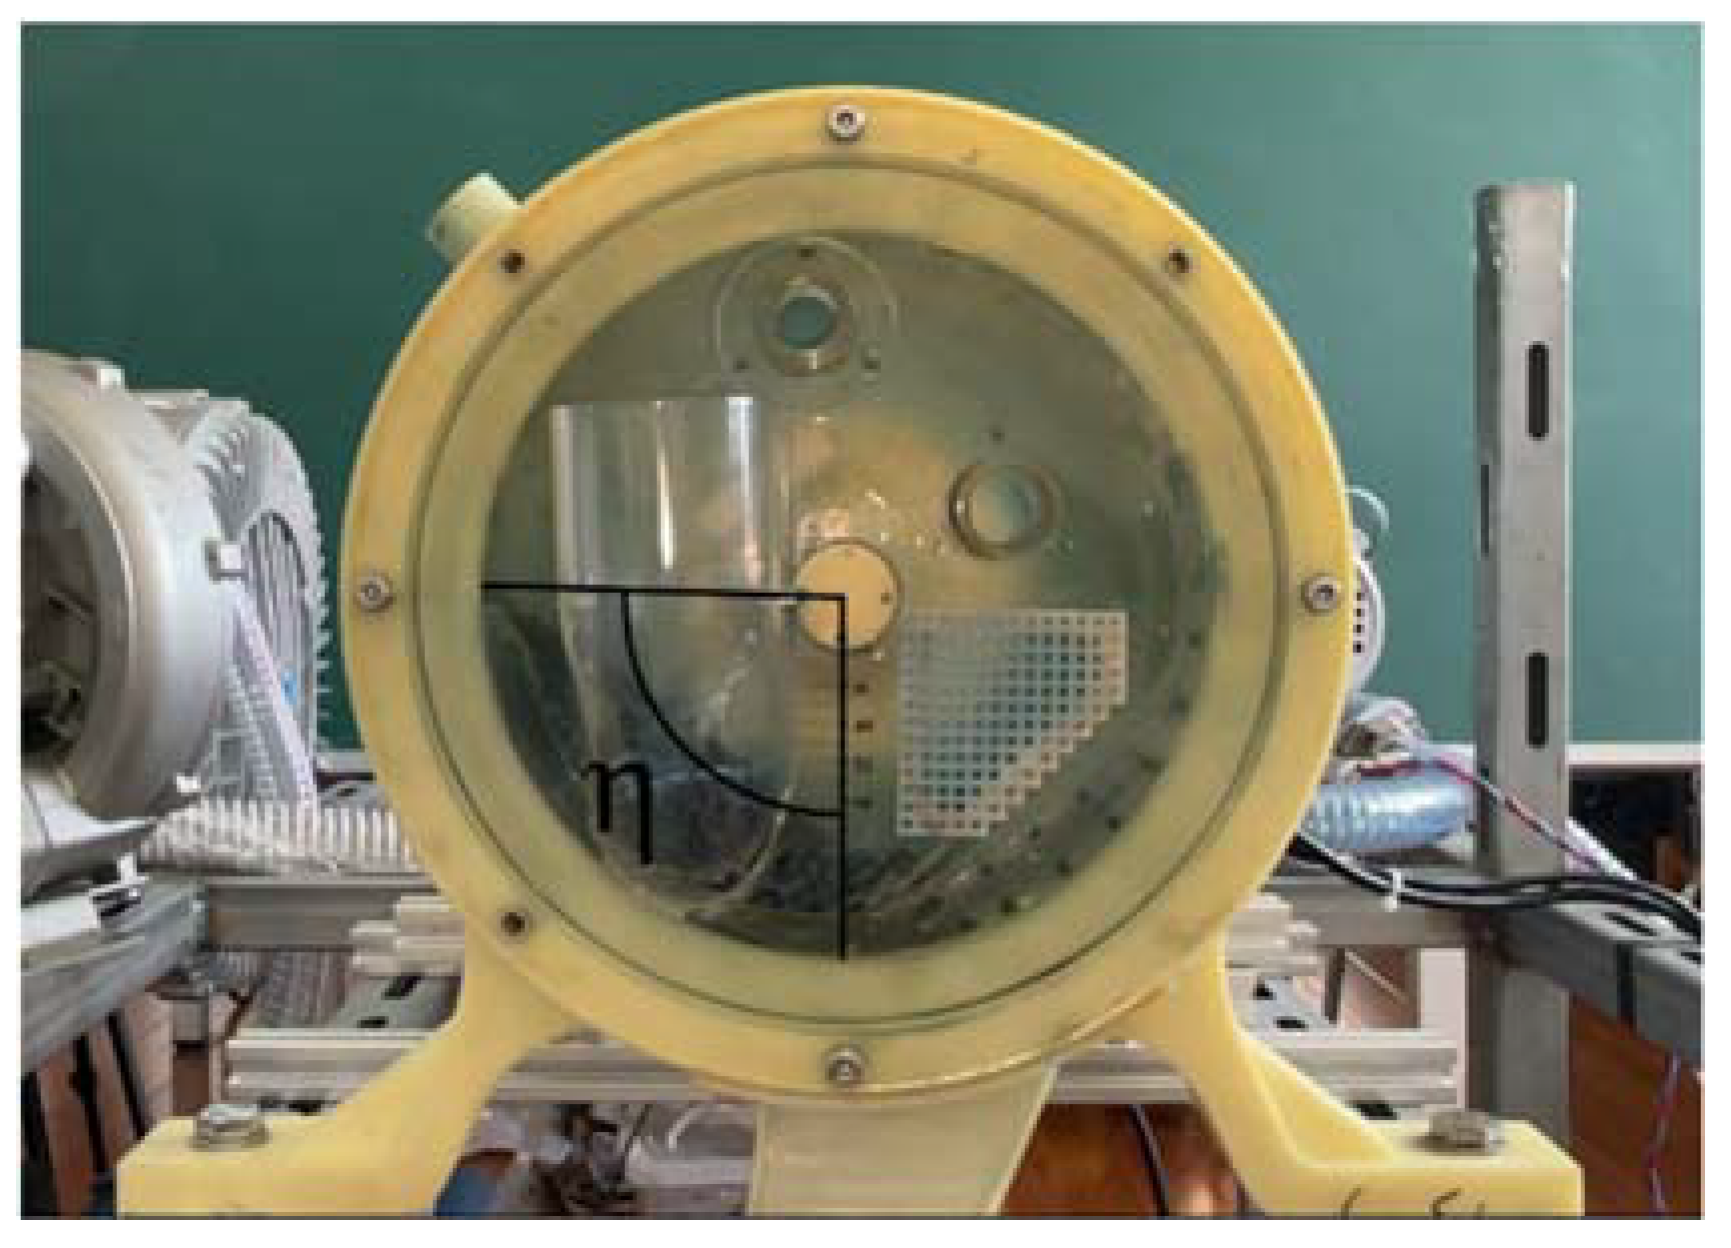
2.3. Determination of Dynamic Repose Angle of Coated Delinted Cotton Seeds

The dynamic repose angle of the cotton seeds was measured by rotating drum apparatus, as shown in Figure 4. The drum was driven to rotate by a DC motor (Beijing Times Brilliant Technology Co., Ltd., 86BL130S78-430TK9 type, Beijing, China) and a planetary gear retarder (Beijing Times Brilliant Technology Co., Ltd., PL80 type, reduction ratio 70, Beijing, China) via coupling. Based on the processing materials of the seed-metering device, the drum shell and cover were made of tough photosensitive resin and fully transparent photosensitive resin, respectively. The drum had an inner diameter of ϕ 140 mm and a width of 46 mm. During the experiment, 1200 cotton seeds were randomly selected and filled into the drum and rotated at a speed of 10 rpm, and the camera was used to record the movement of cotton seeds facing the end of the drum. After the cotton seeds reached the stable motion state, the images of the seed group at 10 moments were randomly intercepted, and a series of image processing such as graying, threshold segmentation, morphological processing, boundary detection and least square fitting were carried out through the Matlab program to obtain the inclination angle of the upper surface of the seed group of each image, and the average value was taken as the dynamic repose angle of the cotton seeds. The dynamic repose angle of cotton seeds was measured to be (38.87 ± 0.59)° by the experiment. The boundary fitting curve of the cotton seed dynamic repose angle is shown in Figure 5.
The particles flow states in the rotating drum included sliding, slumping, rolling, cascading, cataracting and centrifuging, which were related to Froude number, rotational speed, critical wall friction coefficient and filling degree [31]. Among them, the Froude number is the ratio of centrifugal force to gravitational force, and its calculation formula is Fr = Rω2/g, where R is the drum radius, m; and ω is the angular velocity of the drum, rad·s−1. After calculation, the Froude number in this paper was Fr = 7.82 × 10⁻³. According to the research of Mellmann [32], a rolling flow regime exists when the Froude number is between 10−4 < Fr < 10−2, and wall friction is more than critical wall friction. By observing the video of cotton seeds movement, it was found that the upper surface of the cotton seed pile was flat, and the upper cotton seeds dropped rapidly, the lower cotton seeds rose slowly, and the whole cotton seed pile was in a rolling state.

2.4. Selection of Contact Model, Modeling of Cotton Seed and Pretest of Discrete Element Simulation

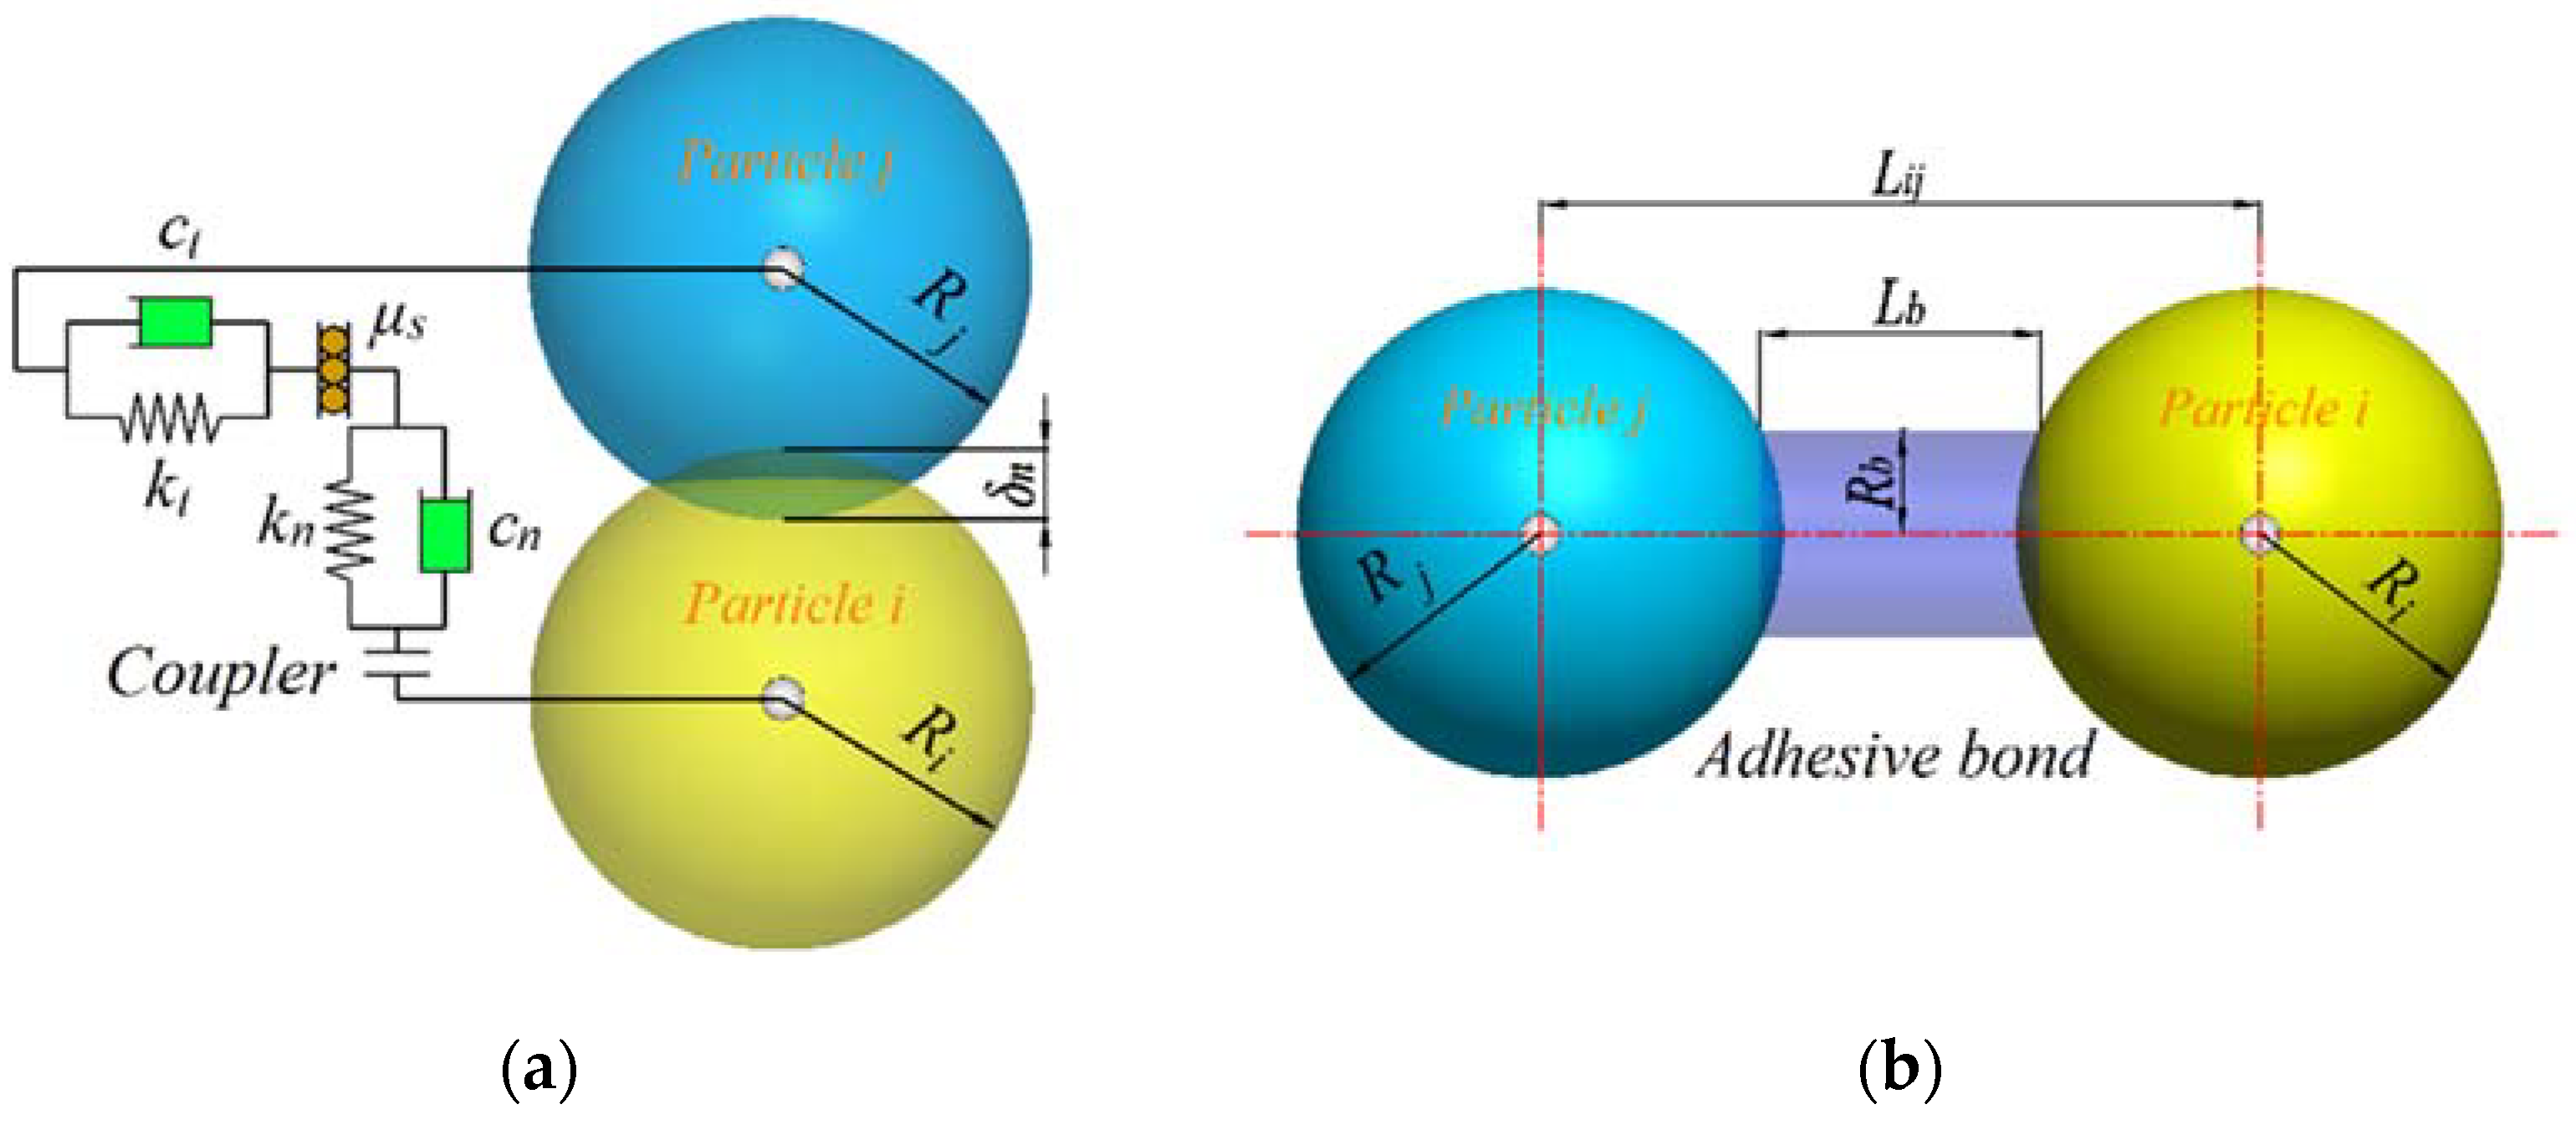
2.4.1. Selection of Contact Model

A contact model can describe the contact behavior between elements, which is the core of the discrete element method [33]. Contact modes are divided into a hard-sphere model and a soft-sphere model. The hard-sphere model ignores the contact force and deformation between particles, and its contact process is simplified as instantaneous collision between two particles and the relevant kinematic parameters are determined by the law of momentum conservation. It is mainly applied to sparse and high-speed particle flow. The soft-sphere model takes into account the small deformation generated by particle collision, and utilizes constitutive relation and Newton’s second law to describe the particle motion, and can simulate the process of multiple particles collision at the same time. It is suitable for sparse to dense, quasi-static to high-speed particle flow, and is widely used in the numerical simulation of engineering problems [34]. Because of the relative density of cotton seeds in the inner cavity of the seed-metering device, the soft-sphere model was selected as the contact model between particles in this paper.
The soft-sphere model includes the common Hertz-Mindlin (no slip), Hertz-Mindlin with bonding, Hertz-Mindlin with JKL, Hertz-Mindlin with RVD Rolling Friction, etc. According to different simulation objects, appropriate contact models should be selected. Since the bonded-particle model was used to establish cotton seed simulation models, that is, a single cotton seed was formed by a plurality of independent fraction particles through adhesive bonds, the Hertz-Mindlin with bonding model was selected as the contact model between fraction particles in the cotton seed. During the operation of the seed-metering device, the contact objects of the coated delinted cotton seeds are the cotton seed group and the rigid parts of the seed-metering device. Because all the cotton seeds were delinted by foam acid and wrapped with seed coating agent, there was no obvious adhesion phenomenon on the surface of the cotton seeds during contact. Therefore, the classical Hertz-Mindlin (no slip) contact model was employed as a contact model of cotton seed–cotton seed and cotton seed–seed-metering device. The Hertz-Mindlin (no slip) model simulates the contact process of particles using a vibration motion equation. Normal contact is simplified as spring and damper, and tangential contact is simplified as spring, damper and slider. The contact force is calculated based on the normal overlap δn and tangential overlap δt caused by contact collision. The particle contact force model is shown in Figure 6a, and in the figure, the coupler is used to determine the pairing relationship between the two elements in contact, and no force is introduced into the system.
The normal force Fn on the particle is the normal resultant force under the joint action of spring and damper. The formula is as follows [35]:
F n = k n δ n 3 2 + c n υ n r e l
where Fn is normal force, N; kn is the normal stiffness, N·m−1; δn is normal overlap, m; cn is normal damping coefficient; υ n r e l is normal component of relative velocity, m·s−1.
The normal stiffness kn and normal damping coefficient cn are defined as [36]:
{ k n = 4 3 E * R * c n = 2 5 6 In   e In 2   e + π 2 2 E * m * R * δ n E * = ( 1 ν i 2 E i + 1 ν j 2 E j ) 1 R * = ( 1 R i + 1 R j ) 1 m * = ( 1 m i + 1 m j ) 1
where E* is equivalent elasticity modulus, Pa; R* is equivalent radius, m; m* is equivalent mass, kg; νi and νj are the Poisson’s ratio of particle i and j; Ei and Ej are the elasticity modulus of particle i and j, Pa; Ri and Rj are the radius of particle i and j (note that for particle impacts with a geometry section, Rj →∞), m; mi and mj are the masses of particle i and j (note that for particle impacts with a geometry section, mj →∞), kg.
The tangential force Ft on the particle is the tangential resultant force under the joint action of spring and damper, but it is also constrained by Coulomb friction. The tangential force Ft can be expressed as:
F t = min [ k t δ t 2 5 6 In   e In 2 e + π 2 k t m * υ t r e l , μ s F n ]
where Ft is tangential force, N; kt is the tangential stiffness, N·m−1; δt is tangential overlap, m; υ t r e l is tangential component of relative velocity, m·s−1; and μs is the static friction coefficient.
The tangential stiffness kt is defined as [37]:
{ k t = 8 G * R * δ n G * = 2 ν i G i + 2 ν j G j
where G* is equivalent shear modulus, Pa; Gi and Gj are the shear modulus of particle i and j, Pa.
The rolling friction is very important for simulations; this can be described by the torque of the particle contact point as:
T i = μ r F n R 1 ω i
where Ti is rolling torque, N·m; μr is rolling friction coefficient; R1 is the distance from the contact point to the centroid of particle i, m; and ωi is the unit angular velocity vector of particle i at the contact point, rad·s−1.
Hertz-Mindlin with bonding contact is a mechanical model that adds bonding force and moment to the standard Hertz-Mindlin (no slip) model. The cotton seed discrete element model is formed by multiple independent fraction particles through adhesive bonds, which can bear a certain degree of normal and tangential relative movement. The schematic illustration of two particles connected by an adhesive bond is shown in Figure 6b. Before the pre-set bonding time tbond, the fraction particles contact solution adopts the above Hertz-Mindlin (no slip) model. When reaching the bonding time tbond, an adhesive bond is generated between two fraction particles whose center position is less than the contact radius. At this time, the ratio of particle normal force to moment (Fn,t/Tn,t) returns to zero, and the following equation shall be applied to calculate and update the bonding force and moment in each time step after:
{ δ F n = υ n r e l k n π R b 2 δ t δ F t = υ t r e l k t π R b 2 δ t δ M n = 1 2 ω n k n π R b 4 δ t δ M t = 1 4 ω t k t π R b 4 δ t
where δFn is increment of bond normal force, N; Rb is adhesive bond radius, m; δt is time step, s; δFt is increment of bond tangential force, N; δMn is increment of bond normal torque, N·m; ωn is normal angular velocity, rad·s−1; δMt is increment of bond tangential torque, N·m; ωt is tangential angular velocity, rad·s−1.
When the maximum normal stress or tangential shear stress between bonded particles exceeds its critical value, the adhesive bond breaks. The maximum values of normal stress and tangential shear stress are defined as follows:
{ σ max < F n π R b 2 + 4 M t π R b 3 τ max < F t π R b 2 + 2 M n π R b 3
where σmax is normal stress maximum, N; τmax is tangential shear stress maximum, N; Mt is bond tangential torque, N·m; and Mn is bond normal torque, N·m.
Since the main working link of the inside-filling pneumatic cotton precision seed-metering device is completed by airflow, and it is not easy to damage the seeds [4], this paper did not consider the breakage of cotton seed in the simulation process, and only calibrated the relevant contact parameters between the cotton seed and contact materials required in the above contact models.

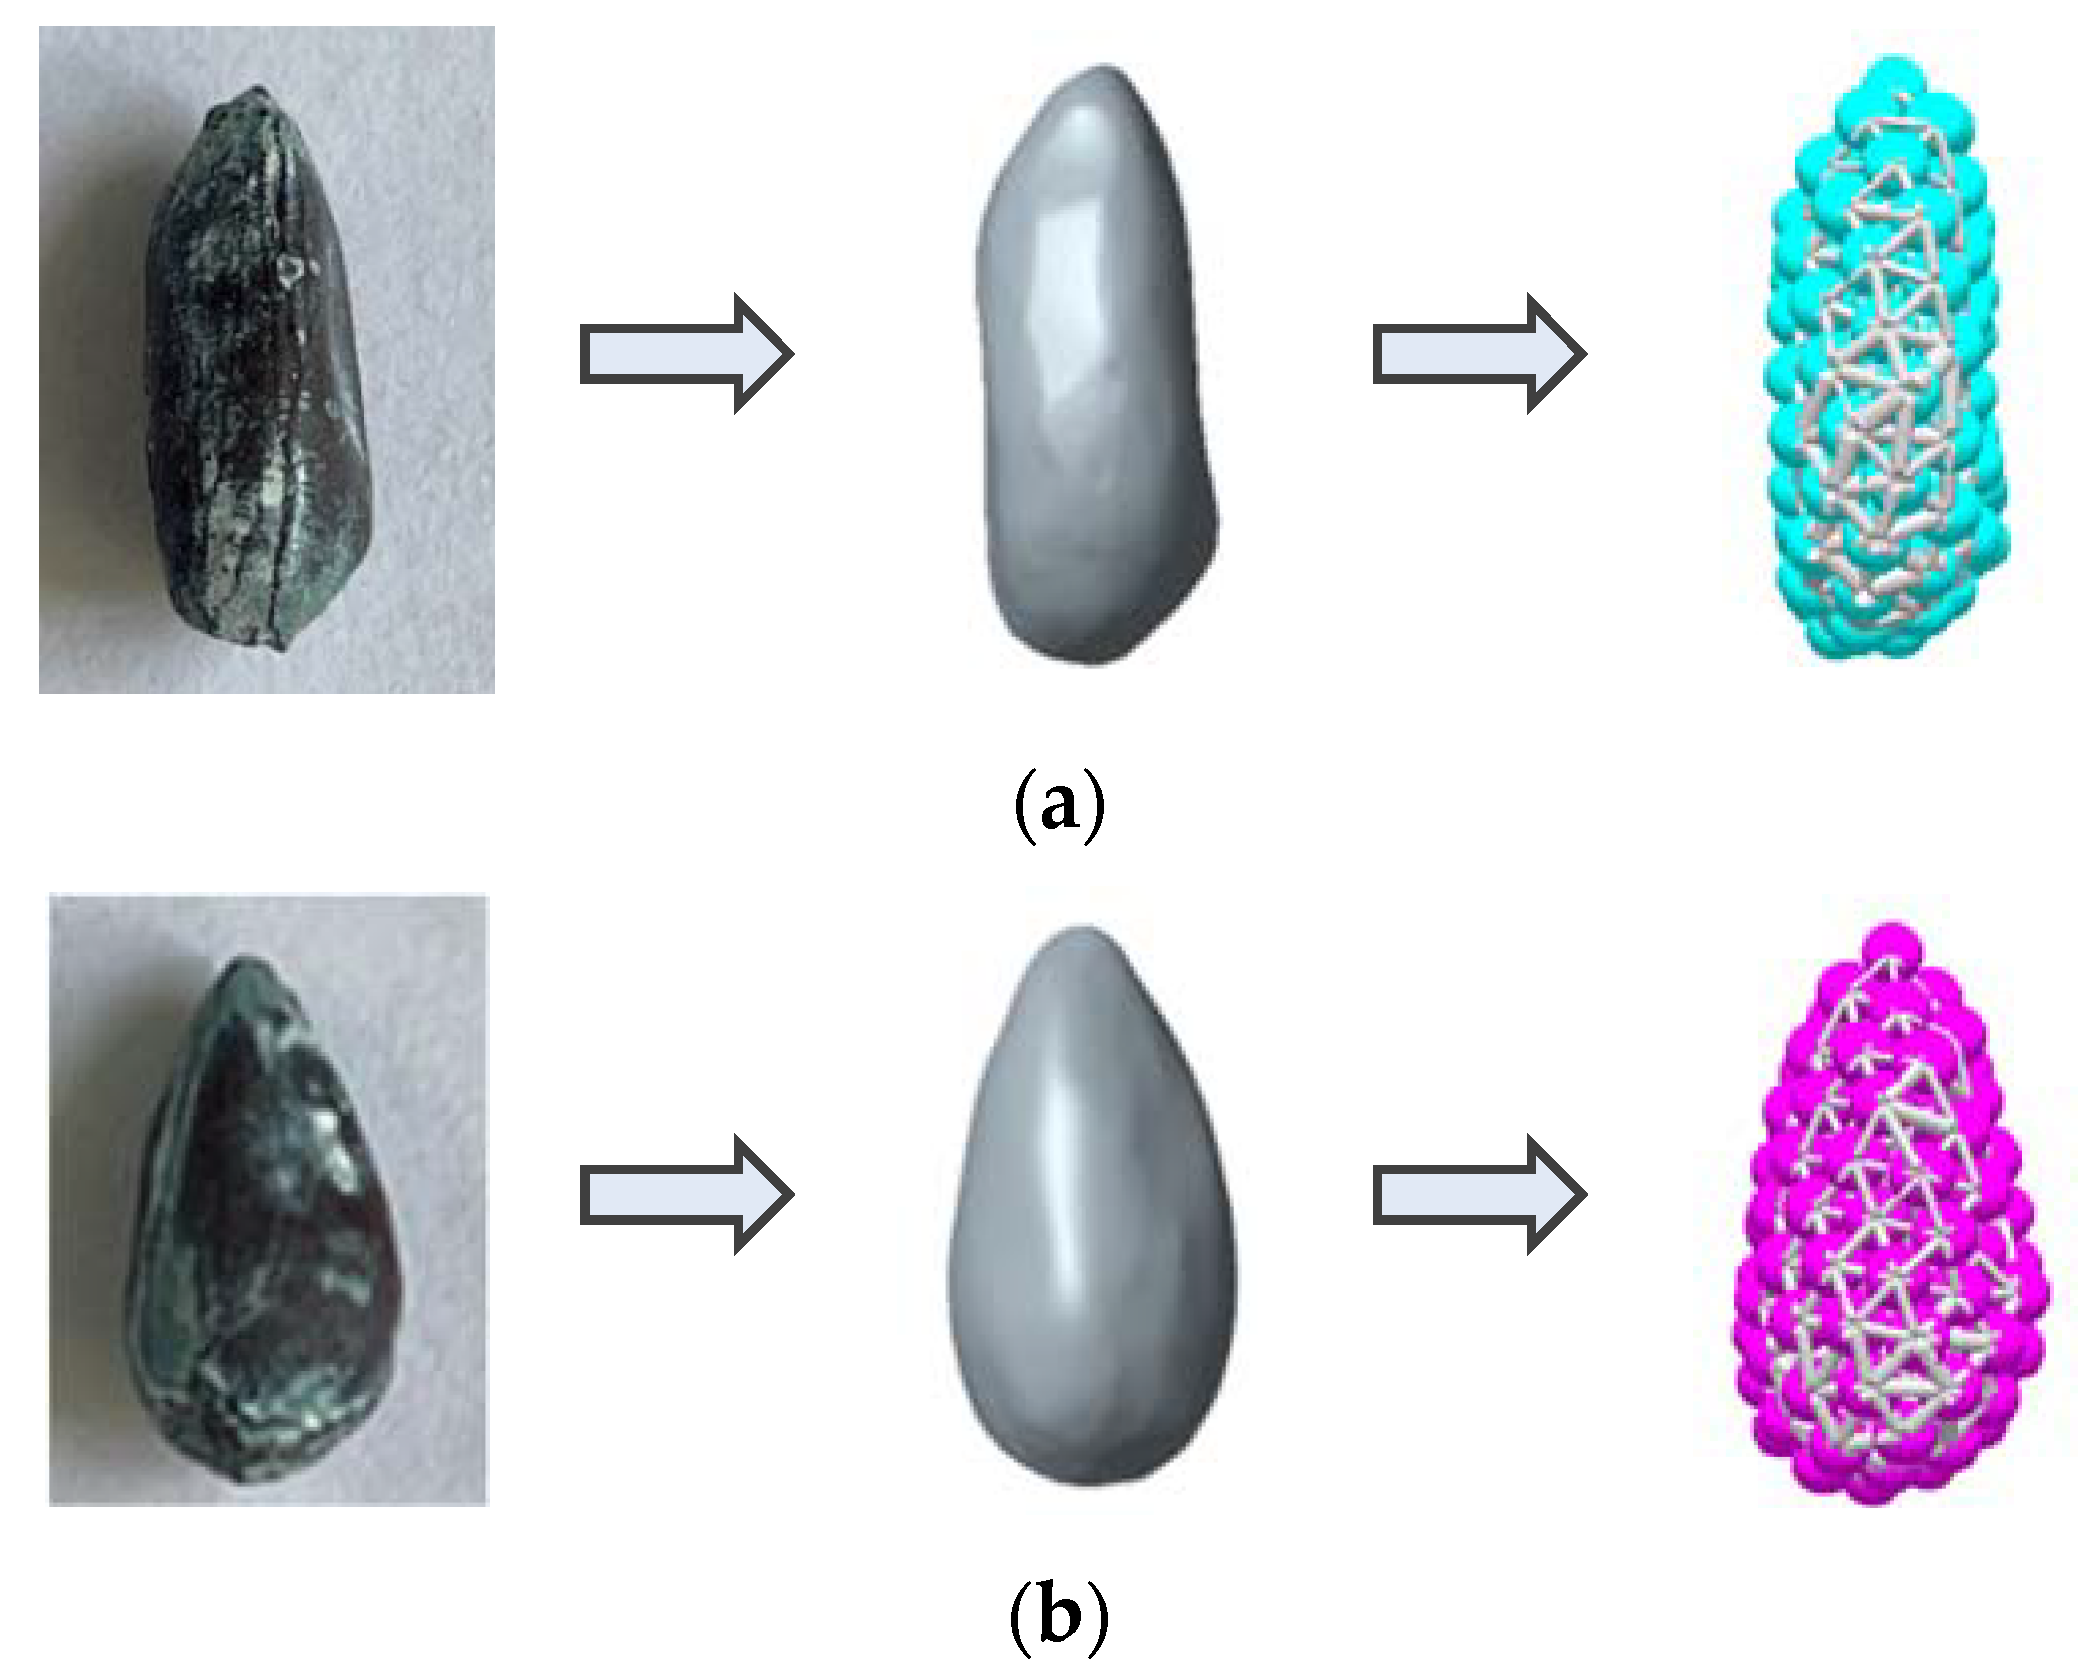
2.4.2. Modeling of Coated Delinted Cotton Seed

Cotton seeds are natural products with irregular shape and size. In order to establish the simulation model accurately, an ellipsoidal cotton seed (9.19 mm × 5.08 mm × 4.45 mm) and a flat cotton seed (9.26 mm × 4.82 mm × 3.39 mm) with triaxial sizes close to the average value of the triaxial size of cotton seeds were selected. Based on the theory of reverse engineering technology, the point cloud data of cotton seeds surface were obtained by XTOM-MATRIX (XTOP 3D Technology Co., Ltd., Shenzhen, China), a blue light three-dimensional scanner, and then imported into Geomagic Studio software (3D Systems Inc., Rock Hill, SC, USA). After a series of processing, such as impurity removal, noise reduction, encapsulation, nail deletion, surface fitting and merging, the three-dimensional contour models of the cotton seeds were reconstructed, and then the solid models of ellipsoidal and flat cotton seeds were obtained through Pro/E software (PTC Inc., Boston, MA, USA). Furthermore, the solid models were imported into EDEM software (DEM Solutions Ltd., Edinburgh, UK) in .stl format, and the fraction particles with a certain radius were filled in the cotton seeds. After the number of particles was not increased after standing for five hours, the relative coordinates of fraction particles were derived, and combined with the Hertz-Mindlin with bonding contact model, the fraction particles were agglomerated by adhesive bonds as the cotton seed simulation models. As shown in Figure 7, from left to right are the physical images, three-dimensional scanning models and bonded-particle models of flat and ellipsoidal cotton seeds. If the above fraction particle radius was smaller, the cotton seed simulation model would fit the solid model better, the simulation time would increase, and the calculation efficiency would decrease. However, when the fraction particle radius is larger, the simulation model error will increase, which is difficult to provide accurate guidance for subsequent research. Therefore, the fraction particle radius in this paper was selected as 0.45 mm after comprehensive consideration. At this time, the flat cotton seed consisted of 127 Fraction_flat particles with a radius of 0.45 mm, and the ellipsoidal cotton seed consisted of 146 Fraction_ellipsoidal particles with a radius of 0.45 mm. The density of fraction particle was calculated as:
ρ = m N V F
where ρ is the density of fraction particle, kg·m−3; m is the mass of a single cotton seed, kg; N is the number of fraction particles; and VF is the volume of the single fraction particle, m3.
The mass of 1000 cotton seeds was 94.50 g. After calculation, the density of Fraction_flat particles composing the flat cotton seeds was 1.95 × 10³ kg·m−3 and the density of Fraction_ellipsoidal particles composing the ellipsoidal cotton seeds was 1.70 × 10³ kg·m−3.

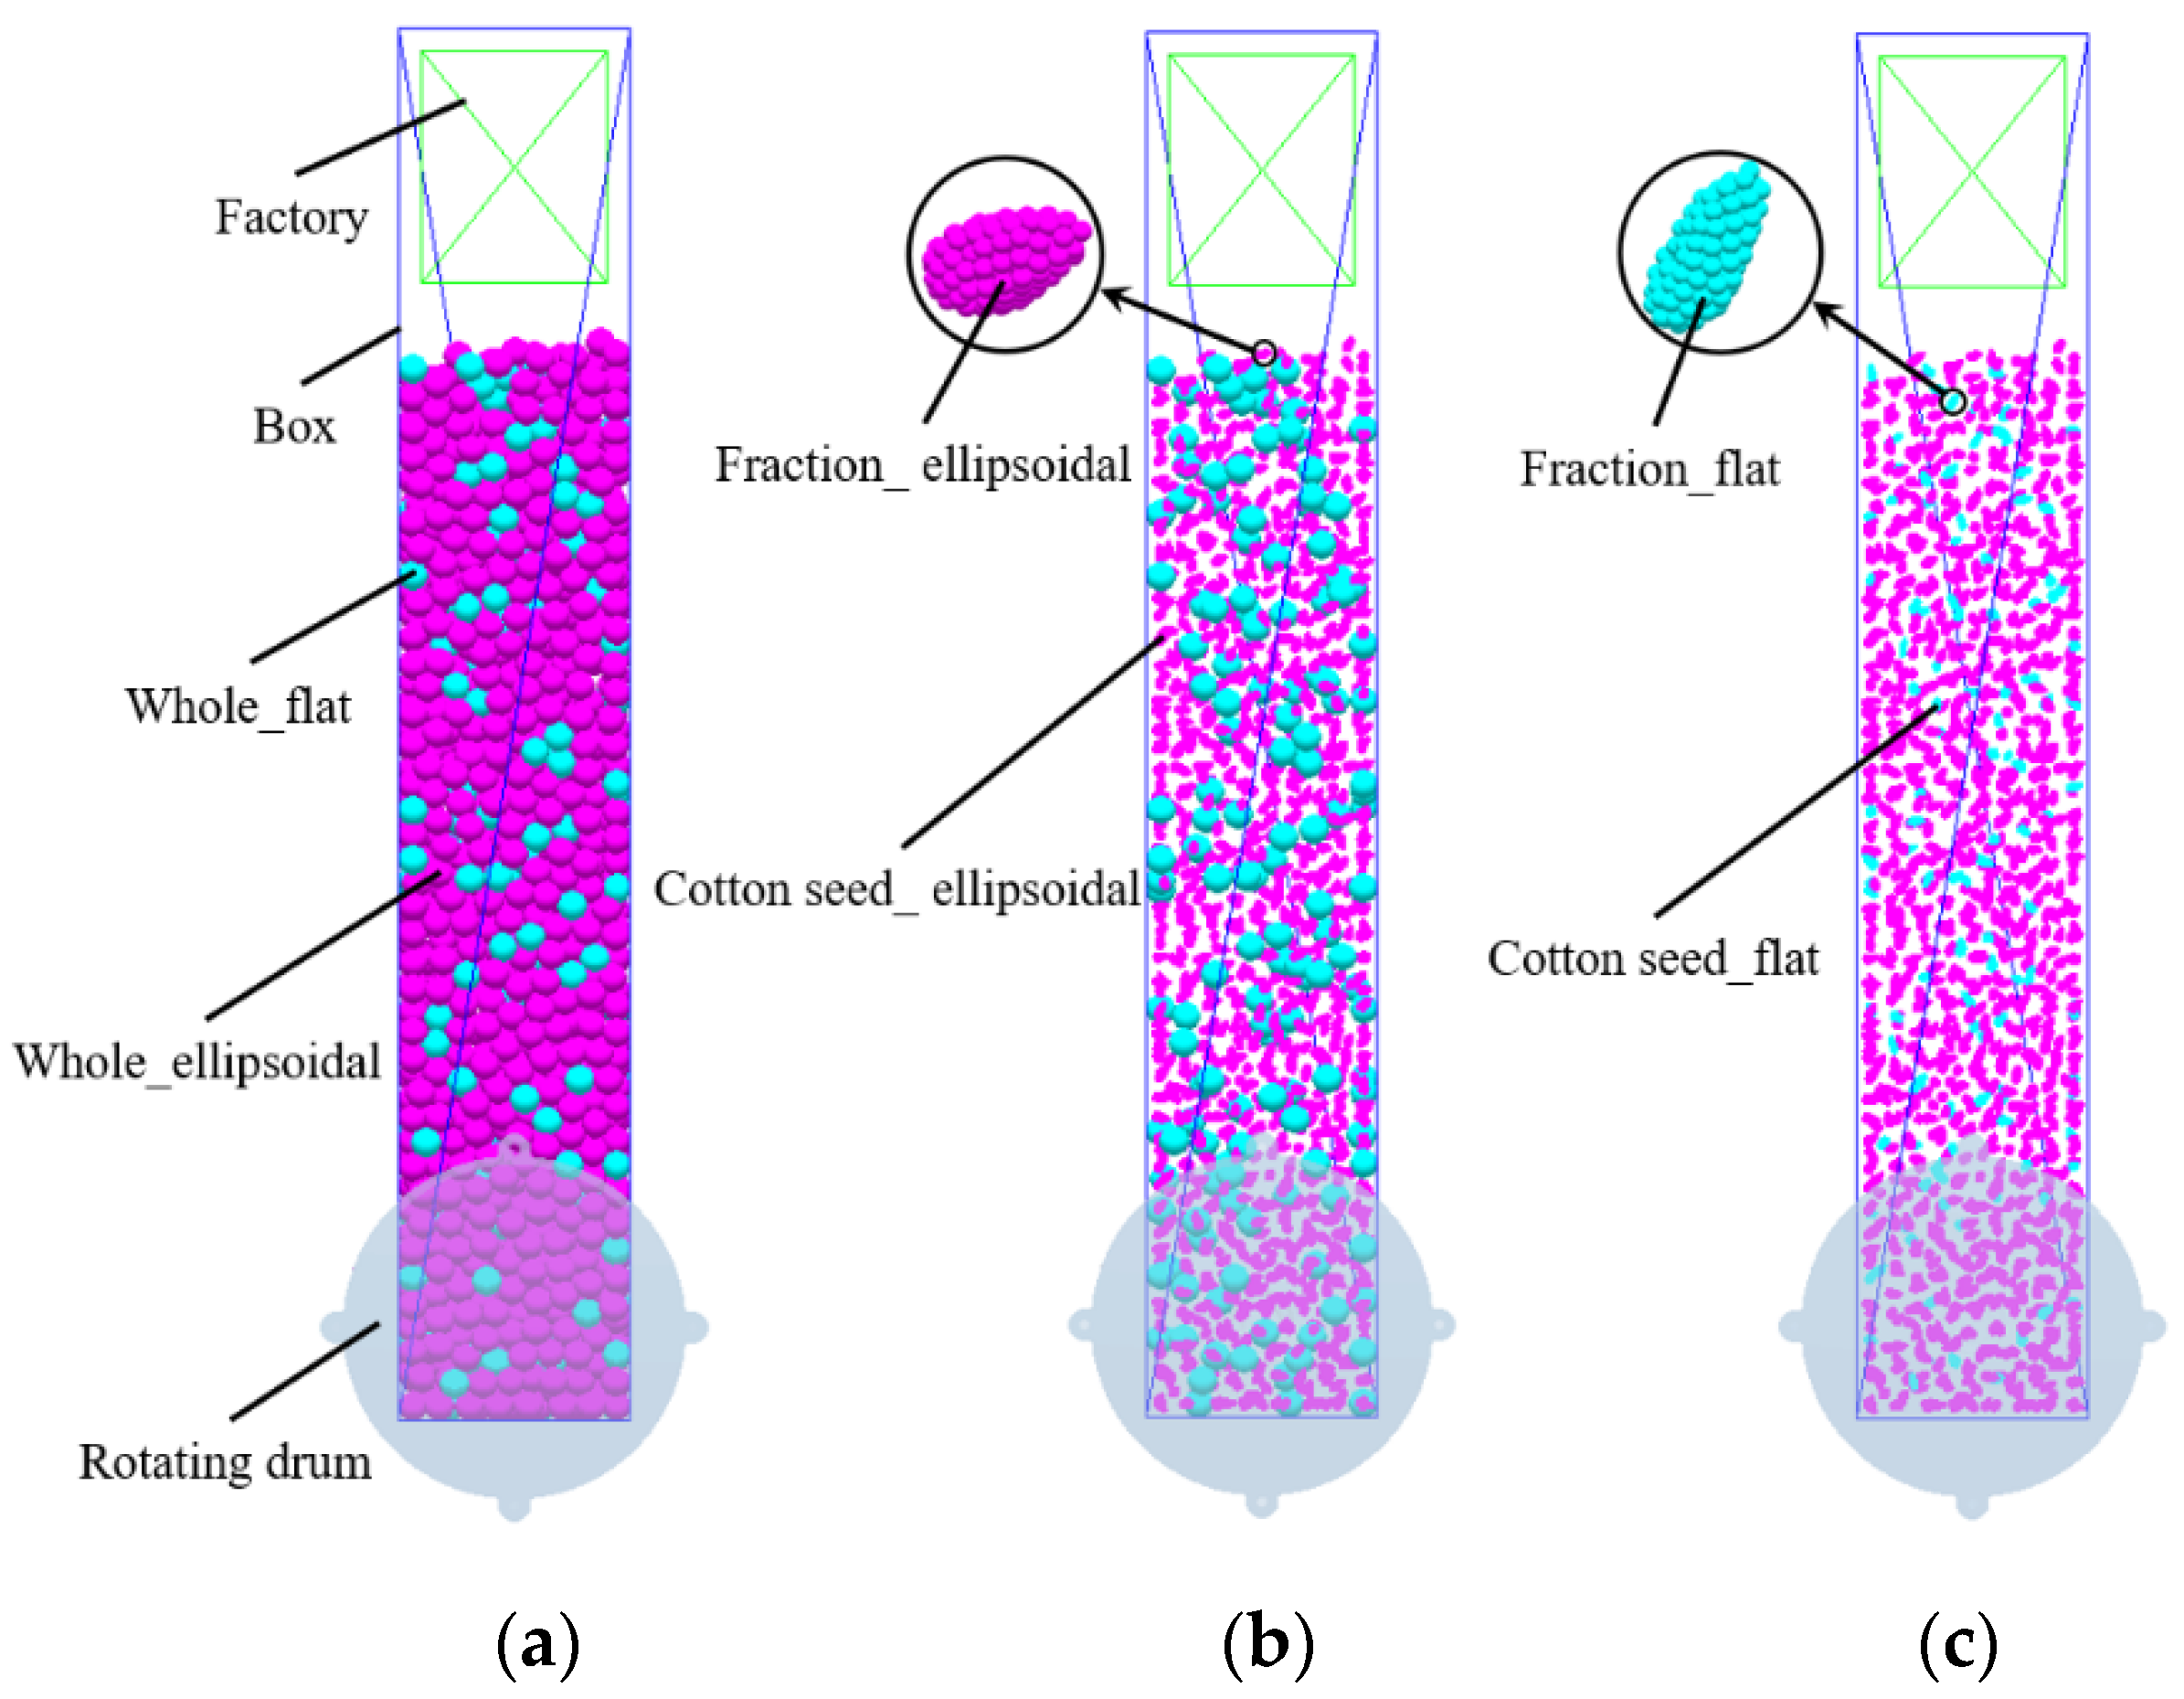
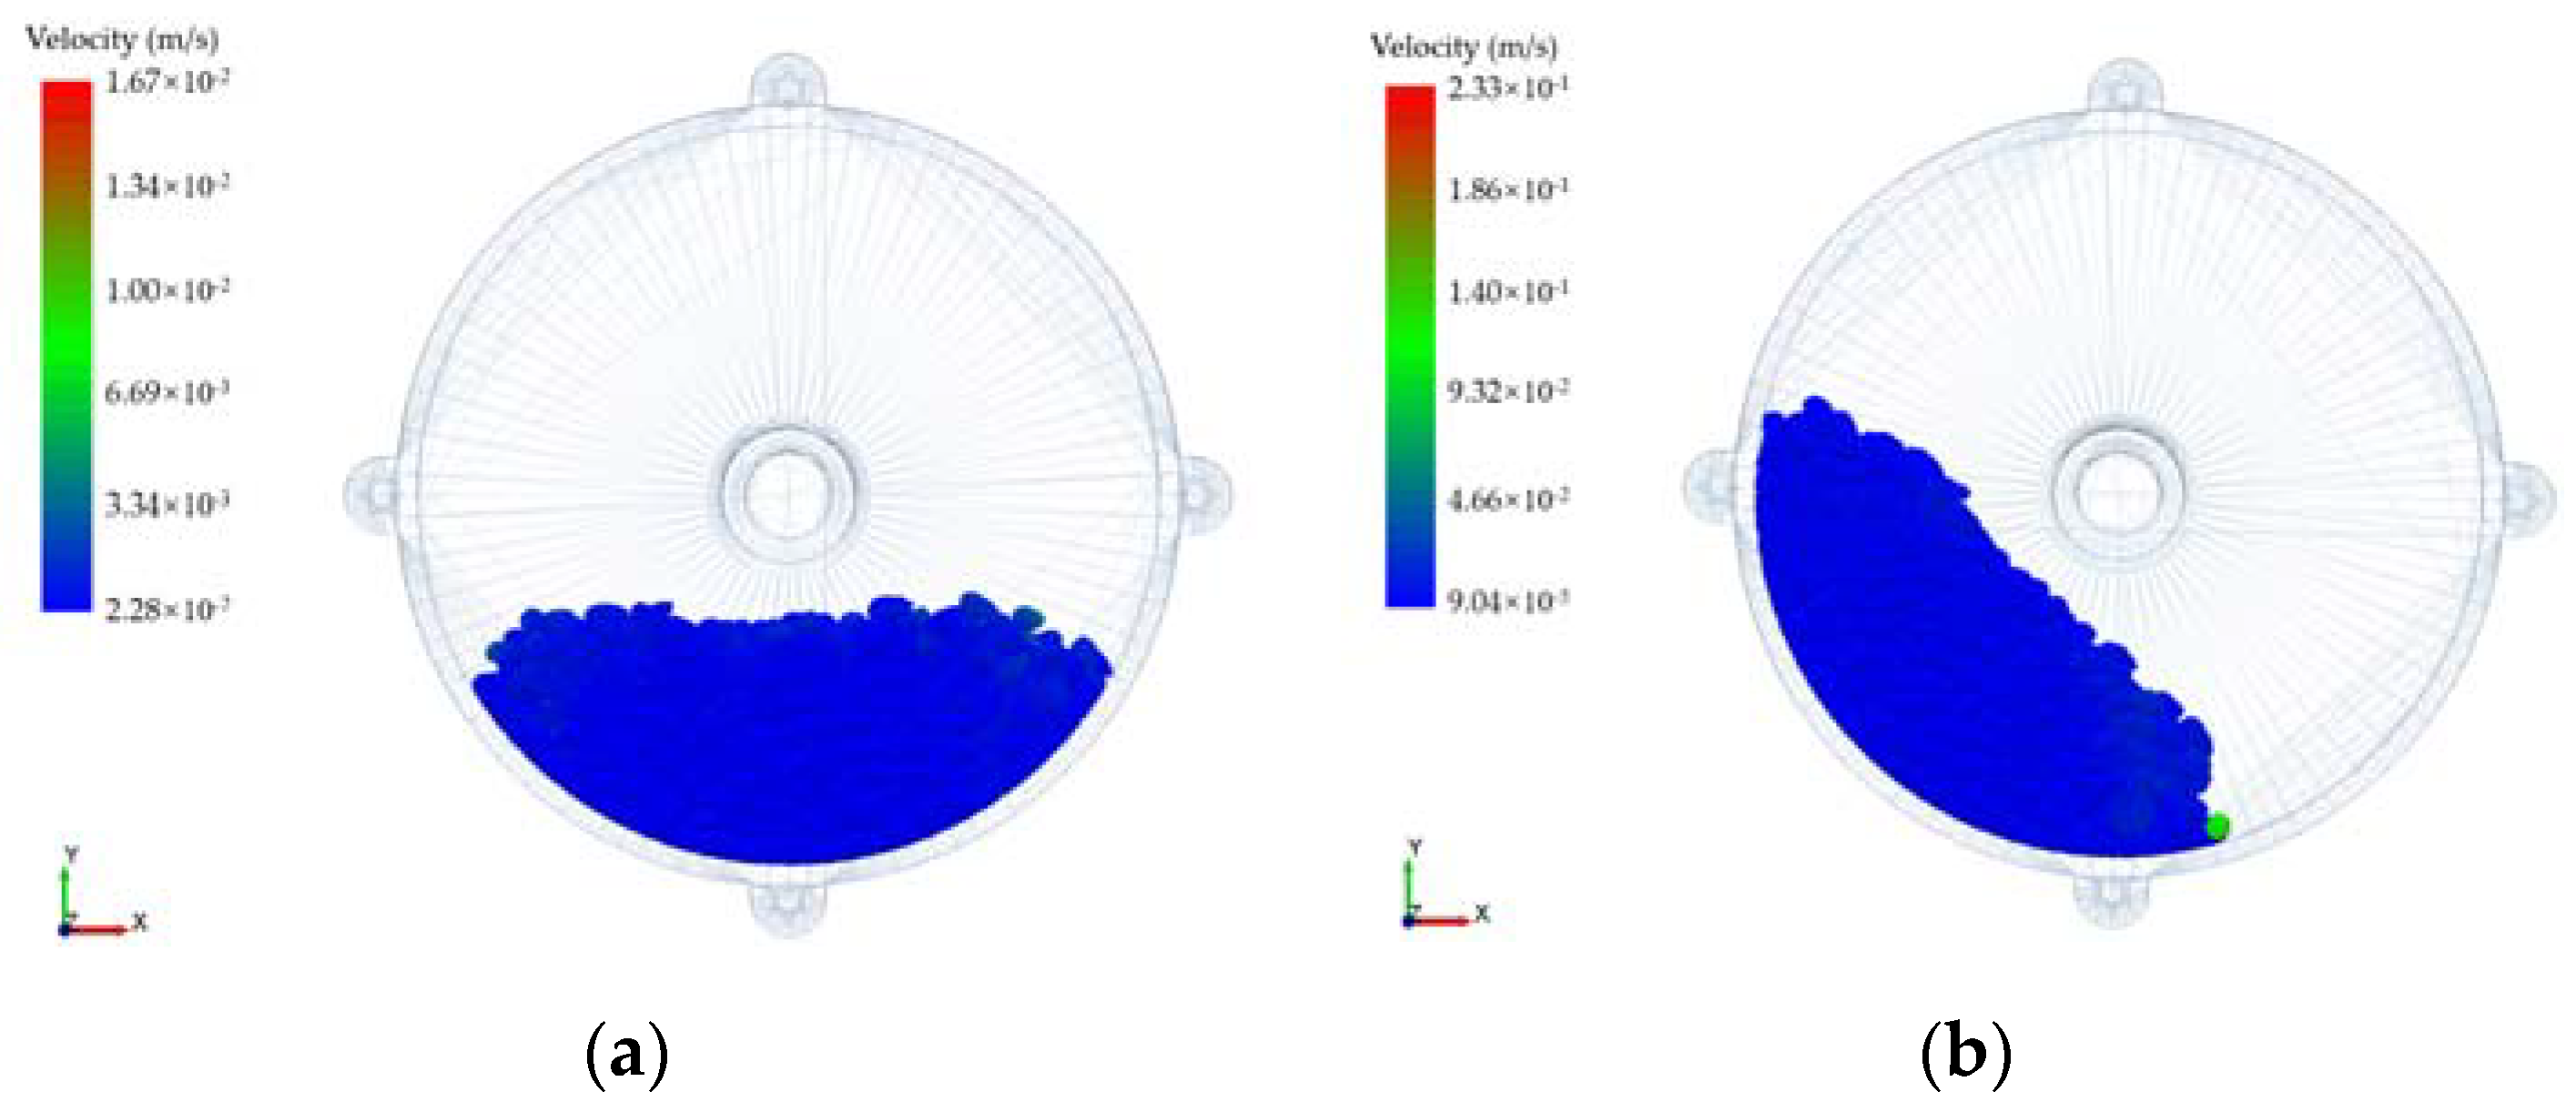
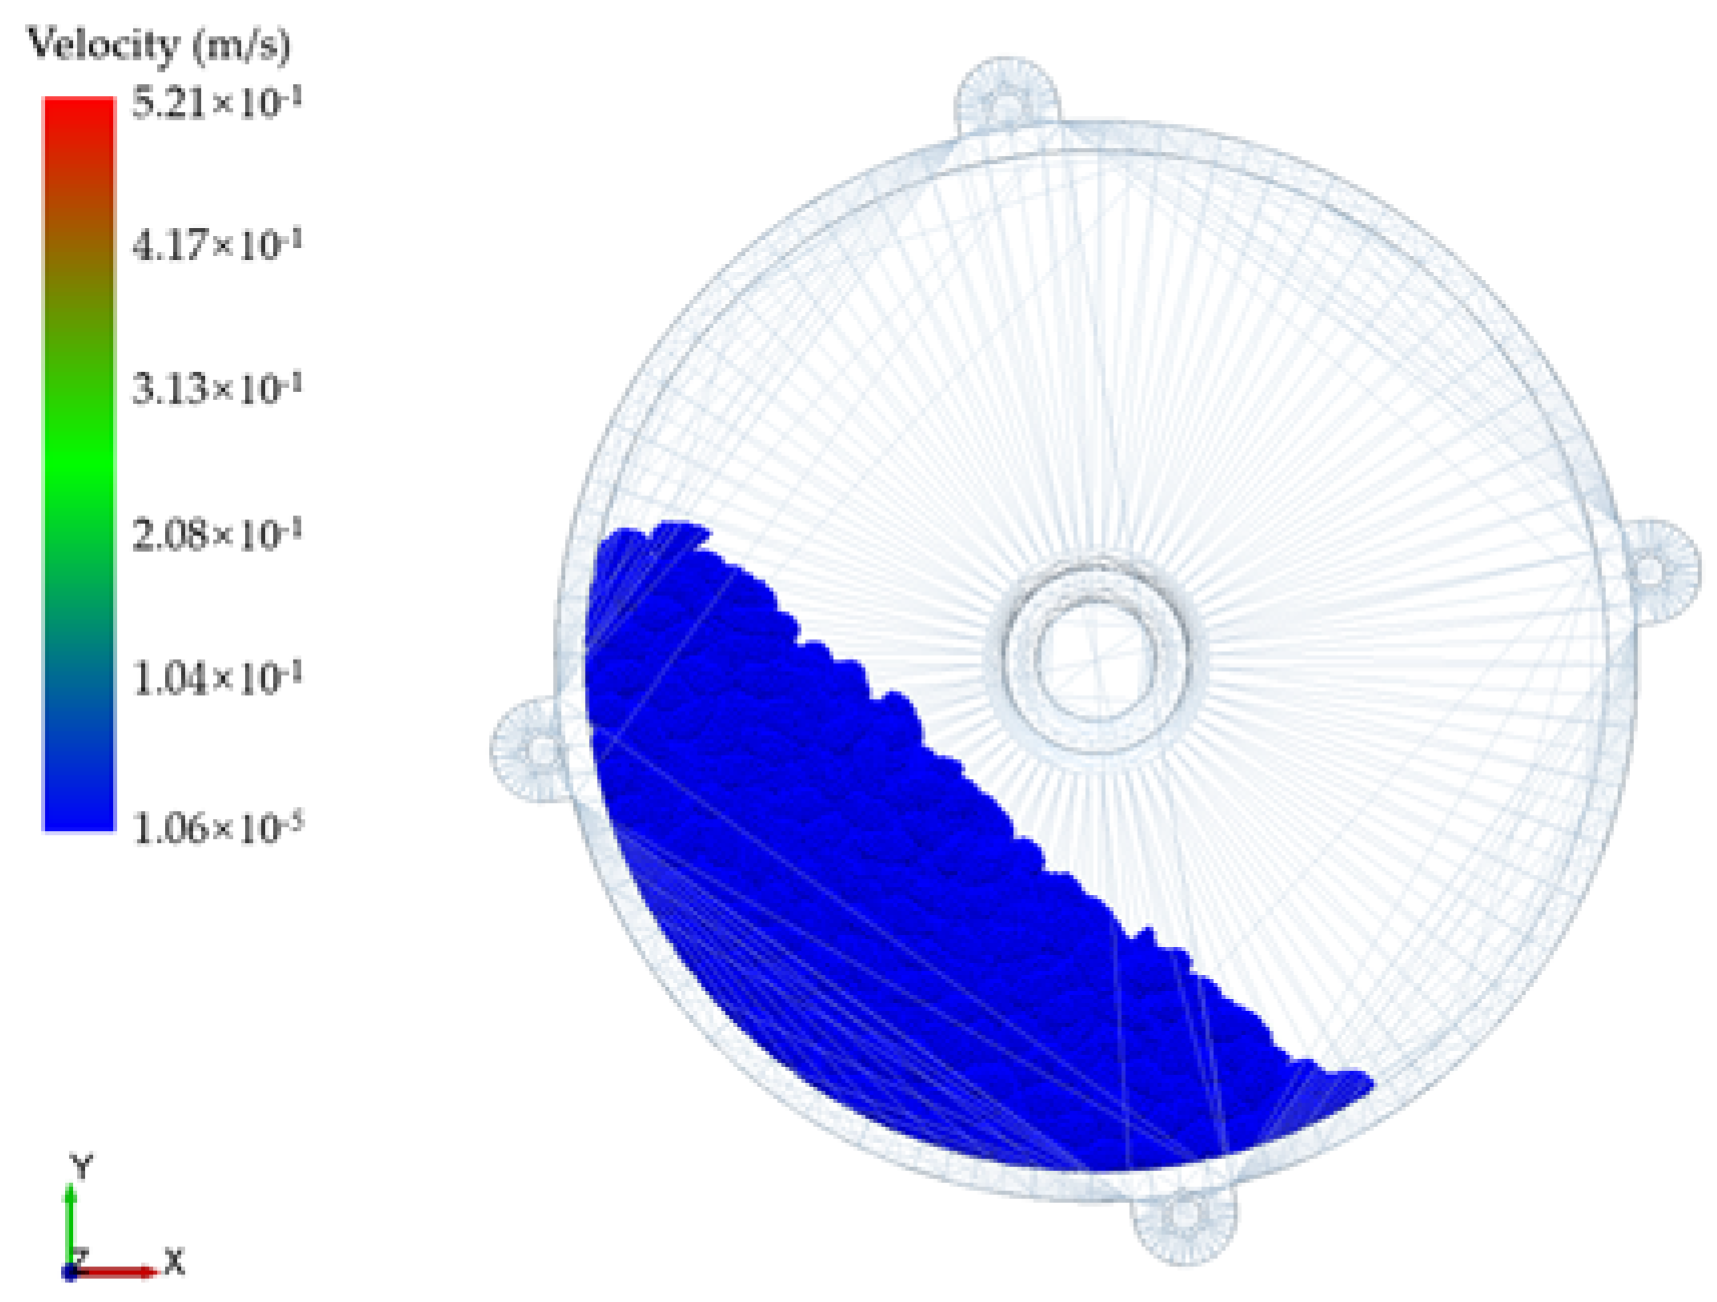
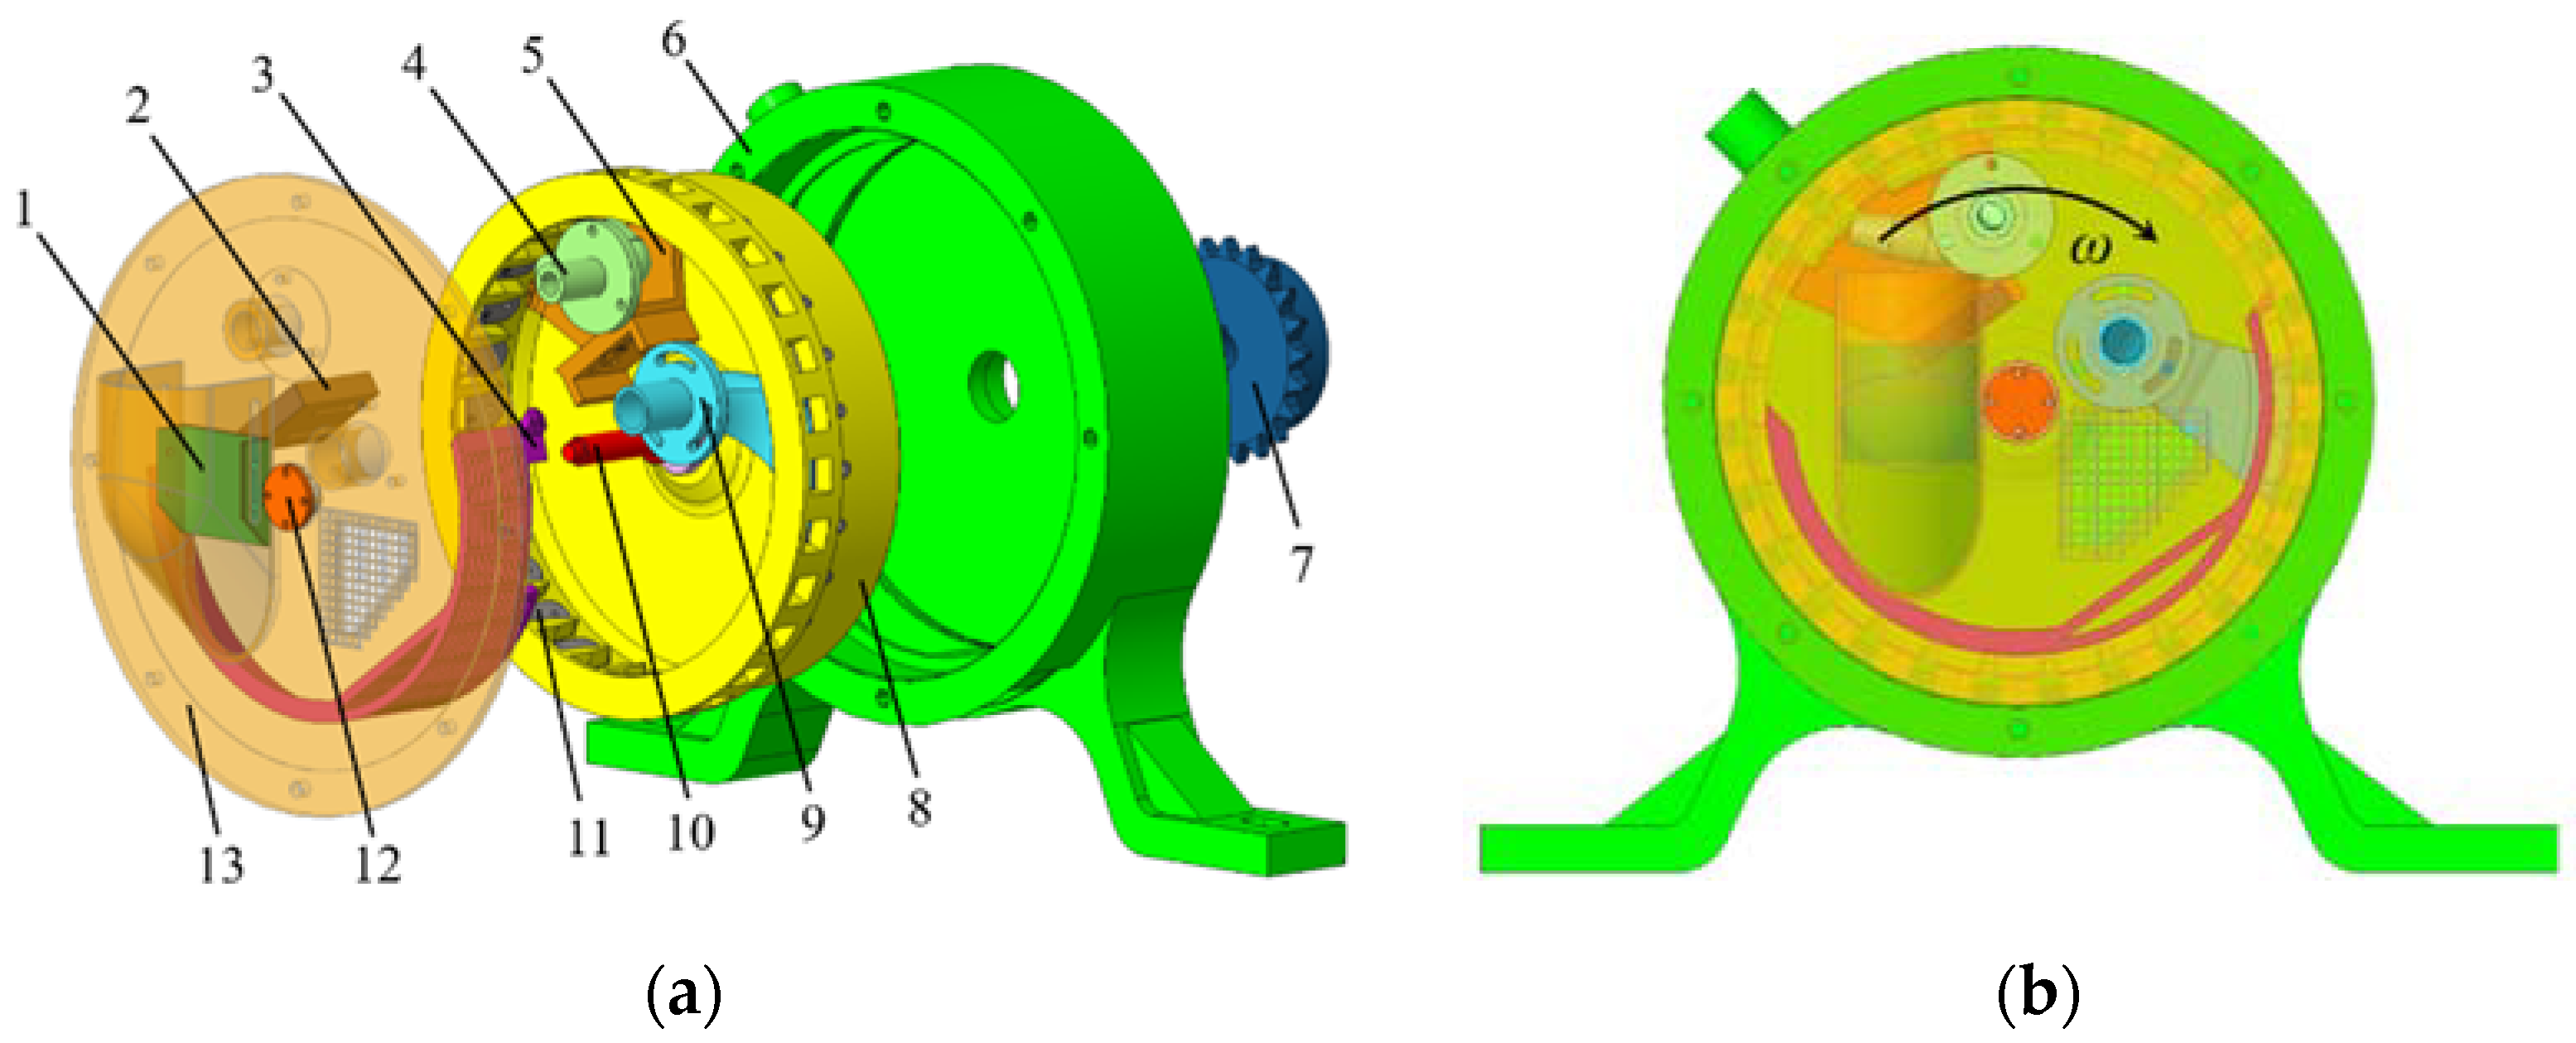
2.4.3. Pretests of Discrete Element Simulation of the Rotating Drum

In order to check whether the measured values of the above contact parameters were applicable to the input of the corresponding parameters in the EDEM software, the simulation pretest was carried out in the same way as the measurement of the dynamic repose angle in the physical test, in which the drum shell and cover materials were set as the tough photosensitive resin and fully transparent photosensitive resin, respectively, and all contact parameters were input into the measured average values. In order to generate 1200 cotton seeds uniformly and the ratio of the number of ellipsoidal to flat shape was 22:3 the cotton seed particle models were generated by Hertz-Mindlin with bonding contact model and application programming interface (API) particle replacement method. Before the simulation, the type of drum shell and cover was set to virtual, and the closed solid model box (100 × 600 × 45 mm) and the virtual particle factory were created. Then, 1056 Whole_ellipsoidal particles for replacing ellipsoidal cotton seeds were generated in the particle factory, with a generation rate of 4400 pcs/s, and 144 Whole_flat particles for replacing flat cotton seeds were generated, with a generation rate of 600 pcs/s. In order to avoid interfering with each other when generating the adhesive bonds between cotton seeds, the volume of Whole_ellipsoidal and Whole_flat particles should be larger than the maximum volume of cotton seeds, and the radius of their particles was chosen to be 6 mm. After the generation was completed, all the Whole_ellipsoidal particles were replaced with Cotton seed_ellipsoidal at the corresponding position using the API file and the ellipsoidal cotton seed filling particle Fraction_ellipsoidal coordinates, and after the ellipsoidal cotton seed generation was stabilized, the Whole_flat particles were replaced with Cotton seed_flat in the same way. The generation process of cotton seeds discrete element models is shown in Figure 8. After the cotton seeds accumulated at the bottom of the Box under the effect of gravity, the Box type was changed to virtual and the drum shell and cover type were changed to solid, and then the cotton seeds further fell and rested at the bottom of the drum, as shown in Figure 9a. Next, the drum was rotated at a speed of 10 rpm for 10 s. After the completion of the simulation, the cotton seeds stacking state is shown in Figure 9b.
As can be seen from Figure 9, when the contact parameters were all put into measured average values, there was little difference in the cotton seeds stacking state before and after the drum rotation. The simulation post-processing revealed that there was less relative movement between the cotton seeds, and the seed group made a sliding movement along the inner wall of the drum, which was not consistent with the cotton seeds flow state in the physical test. This was mainly because the cotton seed was filled by a large number of fraction particles in a tangential manner, so there were gaps between the fraction particles, making the surface roughness of the discrete element model of the cotton seed increased, which led to the seed group movement state being inconsistent with the actual situation. Therefore, it was necessary to calibrate the contact parameters of the cotton seeds in the EDEM software.
The contact parameters of the cotton seeds included the impact recovery coefficient, static friction coefficient and rolling friction coefficient of the cotton seed–tough photosensitive resin, cotton seed–fully transparent photosensitive resin, and cotton seed–cotton seed. Since the cotton seeds are non-spherical particles, in order to maintain their more realistic rotational speeds, the rolling friction coefficients were set to 0 during the calibration of the contact parameters [38]. At this time, the remaining parameters were set to be the same as the above simulation test, and after the simulation was completed, the cotton seeds stacking state was shown in Figure 10.
As can be seen from Figure 10, when all the rolling friction coefficients were set to 0 and the other contact parameters were set to the measured average values, the cotton seeds stacked on the inner wall of the rotating drum for sliding movement, which was not consistent with the cotton seeds flow state in the physical test. In addition, the dynamic repose angle of the cotton seeds was measured to be 43.18°, which was larger than the physical measured value. Therefore, it was necessary to calibrate the impact recovery coefficient and static friction coefficient of the cotton seed–tough photosensitive resin, cotton seed–fully transparent photosensitive resin and cotton seed–cotton seed. By randomly taking the six contact parameters in the measured range of their physical tests and conducting pretests, it was found that when the input values of contact parameters in the simulation tests were all within the physical measured range, the cotton seeds motion states in the simulation process were sliding movements, so the suitable contact parameters could not be obtained in this range, and the value range needed to be adjusted appropriately.
In order to obtain a suitable range of the contact parameters, single-factor pretests were conducted for each of the above six contact parameters, with the level values set to 0.01 and 1. The remaining parameters were set to be the same as the previous simulation test. It was found that when the impact recovery coefficients of the cotton seed–tough photosensitive resin, cotton seed–fully transparent photosensitive resin and cotton seed–cotton seed were set to 0.01 or 1, respectively, the motion states of the cotton seed pile were all sliding movements; when the static friction coefficients of the cotton seed–tough photosensitive resin and cotton seed–fully transparent photosensitive resin were set to 0.01, respectively, the motion states of cotton seed pile were sliding movements, whereas when they were set to 1, the motion states of cotton seed pile were rolling movements, and the simulated dynamic repose angles were both much larger than the physical measured value. When the static friction coefficient of the cotton seed–cotton seed was set to 0.01, the motion state of the cotton seed pile was rolling, and the dynamic repose angle was less than the physical measured value, whereas when it was set to 1, the motion state was a sliding movement. Considering the rolling motion state of cotton seed pile and the small, measured value of the dynamic repose angle, the static friction coefficient of cotton seed–cotton seed was reduced to obtain the suitable range of the contact parameters. Since the physical measured range of the static friction coefficient of the cotton seed–cotton seed was 0.53~0.61, the range of static friction coefficient of cotton seed–cotton seed was set to 0~0.1, 0~0.2, 0~0.3, 0~0.4 and 0~0.5, respectively, and the ranges of the remaining five contact parameters were set to the physical measured ranges. By taking the six contact parameters in their ranges randomly and then conducting simulation tests, it was found that when the static friction coefficient of cotton seed–cotton seed was adjusted to 0~0.1, the motion states of cotton seed pile were all rolling. Therefore, the range of static friction coefficient of cotton seed–cotton seed was set to 0~0.1 in the subsequent tests.

2.5. Calibration of Cotton Seeds Contact Parameters

Due to the large number of contact parameters involved in this paper, referring to the research of Wang et al. [39], the Plackett–Burman test was designed by Design-Expert 10.0.4 software (Stat-Ease Inc., Minneapolis, MN, USA) to screen out the test factors that had significant influence on the simulated dynamic repose angle. Combined with Box–Behnken test, the regression model between the dynamic repose angle and the test factors was established, and the optimal working parameters combination of the test factors was obtained through the optimization solution module. Furthermore, the reliability of the simulation contact parameters was verified through the rotating drum apparatus and seed-metering device experiments. Lastly, the single-factor simulation tests were conducted using a rotating drum apparatus with rolling friction coefficient as the test factor to explore the influence law of the rolling friction coefficient on the dynamic repose angle.

2.5.1. Plackett–Burman Test

The Plackett–Burman test is a multi-factor two-level experimental design method that compares the difference between the two levels of each factor and the overall difference to determine the factor significance. Based on Design-Expert 10.0.4 software, the Plackett–Burman test was carried out with the above six contact parameters as the test factors. The range of each test factor was selected as shown in Table 2, where G, H, J, K and L were virtual parameters. The maximum, minimum, and average values of the range intervals in the table were coded as levels +1, −1, and 0, respectively. The Plackett–Burman test took the simulated dynamic repose angle as the test index, and the tests were conducted in a total of 12 sets. Each set of simulation tests was repeated 5 times, and the average value was recorded as the simulated dynamic repose angle.

2.5.2. Box–Behnken Test

Based on the factors that have significant effects on the dynamic repose angle in the above Plackett–Burman test, the Box–Behnken central combination test was carried out with the simulated dynamic repose angle as the test index. The significant test factors adopted the test levels in Table 2, and the non-significant contact parameters were input into the measured average values of the physical tests. A total of 17 sets of tests were performed. Each set of simulation tests was repeated 5 times, and the average value was recorded as the simulated dynamic repose angle.

2.5.3. Validation Tests

In order to verify the accuracy of the discrete element models and simulation contact parameters of coated delinted cotton seeds, the rotating drum and seed-metering device were used for verification tests.

Validation Test of Rotating Drum

In the simulation test for the rotating drum, the contact parameters were input into the optimized data, and the drum speed was 10 rpm. The dynamic repose angle was taken as the test index to compare the difference between the simulation and physical tests.

Validation Test of Seed-Metering Device

The seed-metering device in this paper adopted the inside-filling pneumatic cotton precision seed-metering device, with the structure as shown in Figure 11, mainly including the front shell, altitude adjusting plate for the seed layer, seed protection board, seeding plate, eliminating finger, seed disturbing air nozzle, seed throwing air nozzle, seeding shaft and back shell, etc. Among the components in direct contact with cotton seeds, the front shell, seed protection board and altitude adjusting plate for the seed layer were made of fully transparent photosensitive resin, and the seeding plate and back shell were made of tough photosensitive resin. The simulation geometry model was constructed according to the 1:1 scale of the physical model. In order to improve the simulation efficiency, the related entity models were simplified, and the components that had no interference with this test, such as eliminating finger, seed disturbing air nozzle and the seed throwing air nozzle, were removed in the physical and simulation tests. In the physical test, 1200 cotton seeds, the number of which met the normal operation requirements of the seed-metering device, were randomly selected and filled into the inner cavity through the seed entrance of the front shell, and the rotation speed of the seeding plate was set to 10 rpm. After the movement of the cotton seeds was stabilized, the pictures of the motion of seed group were randomly intercepted for 10 moments to determine the central angle of the coverage area of the cotton seeds in the inner cavity of the seed-metering device, with the lowest end of the seed protection board as the starting point and the highest point of the seed group movement as the ending point, and the average value was taken as the cotton seeds filling angle η, as shown in Figure 12. Meanwhile, with the optimized contact parameters of the cotton seeds as the input values, the simulation test of the seed-metering device was carried out under the same conditions as the physical test, and the simulated filling angle of cotton seeds was measured to compare the difference between the simulation and physical tests.

2.5.4. Single-Factor Test for Rolling Friction Coefficient

Based on the obtained simulated contact parameters, the single-factor simulation tests were conducted using a rotating drum apparatus with a rolling friction coefficient of the cotton seed–tough photosensitive resin, cotton seed–fully transparent photosensitive resin, and cotton seed–cotton seed as the test factors. The rolling friction coefficient of cotton seed–tough photosensitive resin included three levels: 0.09, 0.22 and 0.35. The rolling friction coefficient of cotton seed–fully transparent photosensitive resin consisted of three levels: 0.07, 0.20 and 0.33. The rolling friction coefficient of cotton seed–cotton seed also included three levels: 0.01, 0.165 and 0.32. The remaining contact parameters were set to the best ones obtained, the drum speed was 10 rpm, and the simulated dynamic repose angle was taken as the test index. Each set of simulation tests were repeated 5 times, and the average value was recorded as the simulated dynamic repose angle.

3. Results and Discussion

3.1. Plackett–Burman Test

The protocol and results of Plackett–Burman test are shown in Table 3.
In order to analyze the significance of the effect of test factors on test index, the analysis module of Design-Expert 10.0.4 software was used to analyze the variance of the test results, and the results of significance analysis for each factor are shown in Table 4. As can be seen from the table, the static friction coefficient of cotton seed–tough photosensitive resin (B), impact recovery coefficient of cotton seed–cotton seed (E), and static friction coefficient of cotton seed–cotton seed (F) had a highly significant effect on the simulated dynamic repose angle (p ≤ 0.01), and other test factors had no significant effect on the simulated dynamic repose angle (p > 0.05). As shown by the Pareto chart in Figure 13, the static friction coefficient of cotton seed–cotton seed (F), static friction coefficient of cotton seed–tough photosensitive resin (B) and static friction coefficient of cotton seed–fully transparent photosensitive resin (D) had positive effects on the simulated dynamic repose angle, the impact recovery coefficient of cotton seed–cotton seed (E), impact recovery coefficient of cotton seed–tough photosensitive resin (A), and impact recovery coefficient of cotton seed–fully transparent photosensitive resin (C) had negative effects on the simulated dynamic repose angle, that is, the simulated dynamic repose angle increased with the increase in the static friction coefficient and decreased with the increase in the recovery coefficient, which was consistent with the results of Kanakabandi and Goswami [15]. From both Table 4 and Figure 13, it can be seen that the order of test factors affecting the simulated dynamic repose angle was: static friction coefficient of cotton seed–cotton seed (F) > static friction coefficient of cotton seed–tough photosensitive resin (B) > impact recovery coefficient of cotton seed–cotton seed (E) > static friction coefficient of cotton seed–fully transparent photosensitive resin (D) > impact recovery coefficient of cotton seed–tough photosensitive resin (A) > impact recovery coefficient of cotton seed–fully transparent photosensitive resin (C).

3.2. Box–Behnken Test

3.2.1. Significance Analysis and Regression Model

The protocol and results of Box–Behnken test are shown in Table 5.
The analysis module of Design-Expert 10.0.4 software was used to perform multiple regression analysis on the above test results and establish a quadratic regression model of the test index and factors. The results of significance analysis are shown in Table 6. As can be seen from the table, the regression equation was highly significant and did not fail to fit, and the regression equation for the test index fitted the test data well. All linear terms B, E and F had a highly significant effect on the simulated dynamic repose angle, the interaction term BF and quadratic term B2 had a significant effect on the dynamic repose angle, and the remaining terms had no significant effect on the dynamic repose angle. The quadratic regression equation between the simulated dynamic repose angle and the factors is as follows:
θ = 36 . 39 + 1.25 B 0.56 E + 3.52 F + 0.34 B E + 0.44 B F 0.11 E F 0.52 B 2 + 0.24 E 2 0.25 F 2

3.2.2. Parameter Optimization

In order to find the best combination of parameters for each test factor, the physical test value of 38.87° for the dynamic repose angle was taken as the optimization target, combined with the boundary conditions, and the multi-factor optimization solution was carried out for the established quadratic regression model. The objective function and constraint conditions are as follows:
{ t arg et   value = 38 . 87 ° s . t . { 0.30 B 0.42 0.01 E 0.18 0 F 0.10
Several sets of optimal solutions were obtained by using the optimization module of Design-Expert 10.0.4 software, from which the combination of parameters closest to the measured average values of the physical tests of each factor was selected with reference to Hou et al. as [17]: 0.33 for static friction coefficient of cotton seed–tough photosensitive resin; 0.06 for impact recovery coefficient of cotton seed–cotton seed; 0.10 for static friction coefficient of cotton seed–cotton seed. The remaining non-significant parameters were the measured average values of physical tests, that is, 0.13 for impact recovery coefficient of cotton seed–tough photosensitive resin, 0.12 for impact recovery coefficient of cotton seed–fully transparent photosensitive resin, 0.29 for static friction coefficient of cotton seed–fully transparent photosensitive resin.

3.3. Validation Tests

3.3.1. Validation Test of Rotating Drum

The rotating drum method was used for the verification test, and the simulated dynamic angle of repose was measured to be (38.63 ± 0.91)°, with the relative error of 0.62% compared with the measured average value of 38.87° in the physical test. The velocity vector diagram of cotton seeds in the rotating drum simulation test is shown in Figure 14. It can be seen from the figure that the upper layer cotton seeds moved downward at a faster speed, and because the falling state of each cotton seed was inconsistent, its velocity vectors were different. The lower layer cotton seeds near the wall rose slightly slower, and the moving direction was tangential to the wall due to the frictional effect of the wall. The movement velocity of the middle layer of cotton seeds was the slowest, and it can be seen from the change in velocity color in the figure that the movement velocity of the lower layer cotton of seeds gradually decreased along the radial direction of the rotating drum to the middle layer of cotton seeds. In the simulation process, the overall motion characteristics of cotton seeds were consistent with the physical test.

3.3.2. Validation Tests of Seed-Metering Device

The measured value of the cotton seed filling angle η in the seed-metering device was (91.82 ± 1.86)° by the physical test. Taking the optimized cotton seed contact parameters as the input values, the simulation test of the seed-metering device was carried out under the same conditions as the physical test, and the simulated filling angle of cotton seeds was measured to be (92.97 ± 1.73)°, with the relative error of 1.25% compared with the physical test. The simulation validation test process of the seed-metering device is shown in Figure 15.
According to the validation tests on the rotating drum and seed-metering device, the relative errors between the physical test and the simulation test were less than 2%, indicating that the accuracy and reliability of the discrete element models of the cotton seeds and the calibrated contact parameters were good, which can provide a reference for the selection of the simulation parameters of the coated delinted cotton seeds in the subsequent DEM-CFD coupling simulation analysis of the pneumatic precision seed-metering device.

3.4. Single-Factor Test for Rolling Friction Coefficient

The results of the single-factor test for rolling friction coefficient are shown in Figure 16. As can be seen from the figure, the dynamic repose angle increased with the increase in the rolling friction coefficient, which was in agreement with the finding of Cunha et al. [40]. The simulated dynamic repose angles were all larger than the physical measured value. Moreover, the rolling friction coefficient of cotton seed–cotton seed had a more significant effect on the dynamic repose angle, while the rolling friction coefficients of cotton seed–tough photosensitive resin and cotton seed–fully transparent photosensitive resin had a smaller effect on the dynamic repose angle.
From the above, it can be seen that the static friction coefficient and rolling friction coefficient had positive effects on the simulated dynamic repose angle, and the impact recovery coefficient had a negative effect on the simulated dynamic repose angle. If the rolling friction coefficient became larger than zero, the static friction coefficient and the impact recovery coefficient could not both remain unchanged, and needed to be adjusted to reduce the increase in dynamic repose angle caused by the rolling friction.
This study demonstrates the feasibility of using the rotating drum apparatus to calibrate the cotton seed discrete element simulation parameters with the dynamic repose angle as the evaluation index. The discrete element contact parameters of cotton seeds and their influence on the dynamic repose angle obtained in the paper can provide reference for the setting of cotton seed contact parameters in the discrete element simulation analysis of the cotton seed-metering device, thus improving the simulation accuracy and guiding the optimization design of the cotton seed-metering device. However, there are still some deficiencies in this study, for example, only a specific cotton seed was considered. For different varieties of cotton seeds, the settings of the discrete element contact parameters need to be further studied. At this time, special attention should be paid to the influence law of the contact parameters on the dynamic repose angle obtained in this paper, which would be helpful for the acquisition of cotton seed simulation parameters.

4. Conclusions

(1)
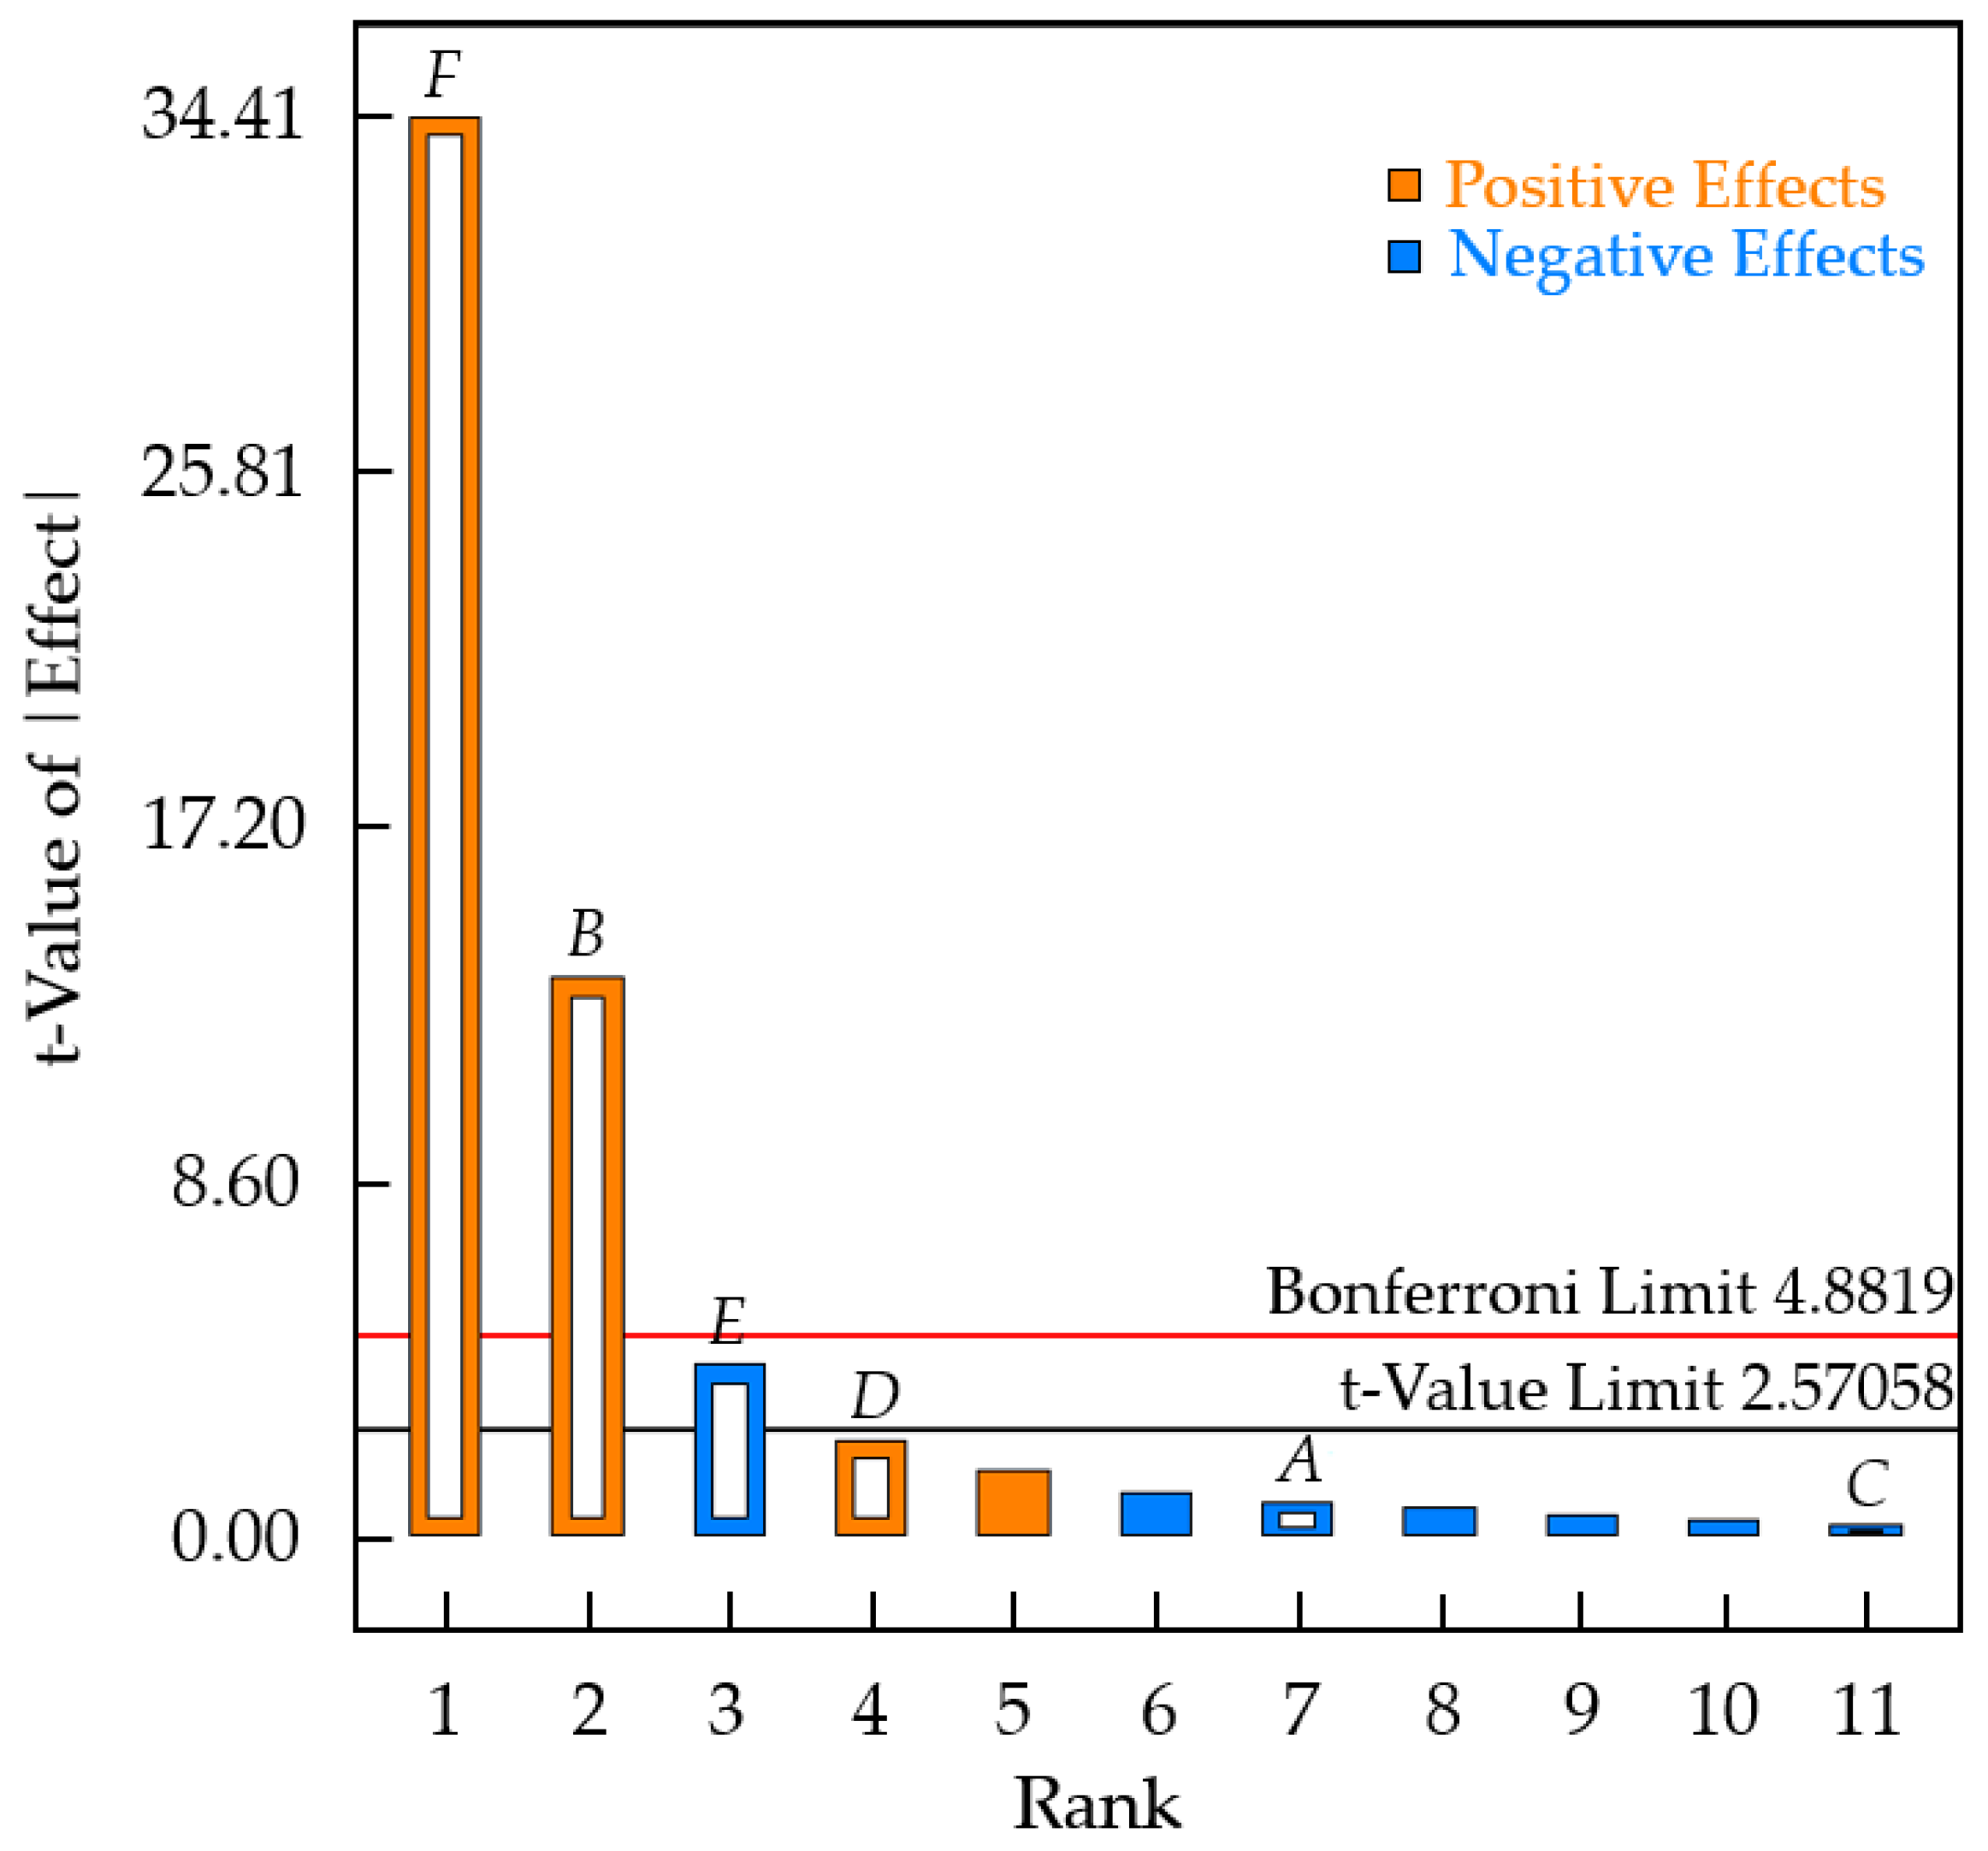
The results of the Plackett–Burman test showed that the static friction coefficient of cotton seed–tough photosensitive resin, the impact recovery coefficient of cotton seed–cotton seed, and the static friction coefficient of cotton seed–cotton seed had highly significant effects on the simulated dynamic repose angle, and other contact parameters had no significant effect on the simulated dynamic repose angle; the static friction coefficient had a positive effect on the simulated dynamic repose angle, and the impact recovery coefficient had a negative effect on the simulated dynamic repose angle.
(2)
The results of the Box–Behnken test showed that the established quadratic regression model between test factors and the simulated dynamic repose angle had good accuracy and reliability. The optimal combination of contact parameters solved by the Design-Expert 10.0.4 software optimization module was 0.33 for the static friction coefficient of cotton seed–tough photosensitive resin, 0.06 for the impact recovery coefficient of cotton seed–cotton seed, 0.10 for the static friction coefficient of cotton seed–cotton seed, 0.13 for the impact recovery coefficient of cotton seed–tough photosensitive resin, 0.12 for the impact recovery coefficient of cotton seed–fully transparent photosensitive resin, and 0.29 for the static friction coefficient of cotton seed–fully transparent photosensitive resin.
(3)
The results of the validation tests of the rotating drum and seed-metering device showed that the relative errors of physical and simulation tests were less than 2% under the optimal combination of contact parameters, indicating that the discrete element models and calibrated contact parameters of the coated delinted cotton seeds had good accuracy and reliability.
(4)
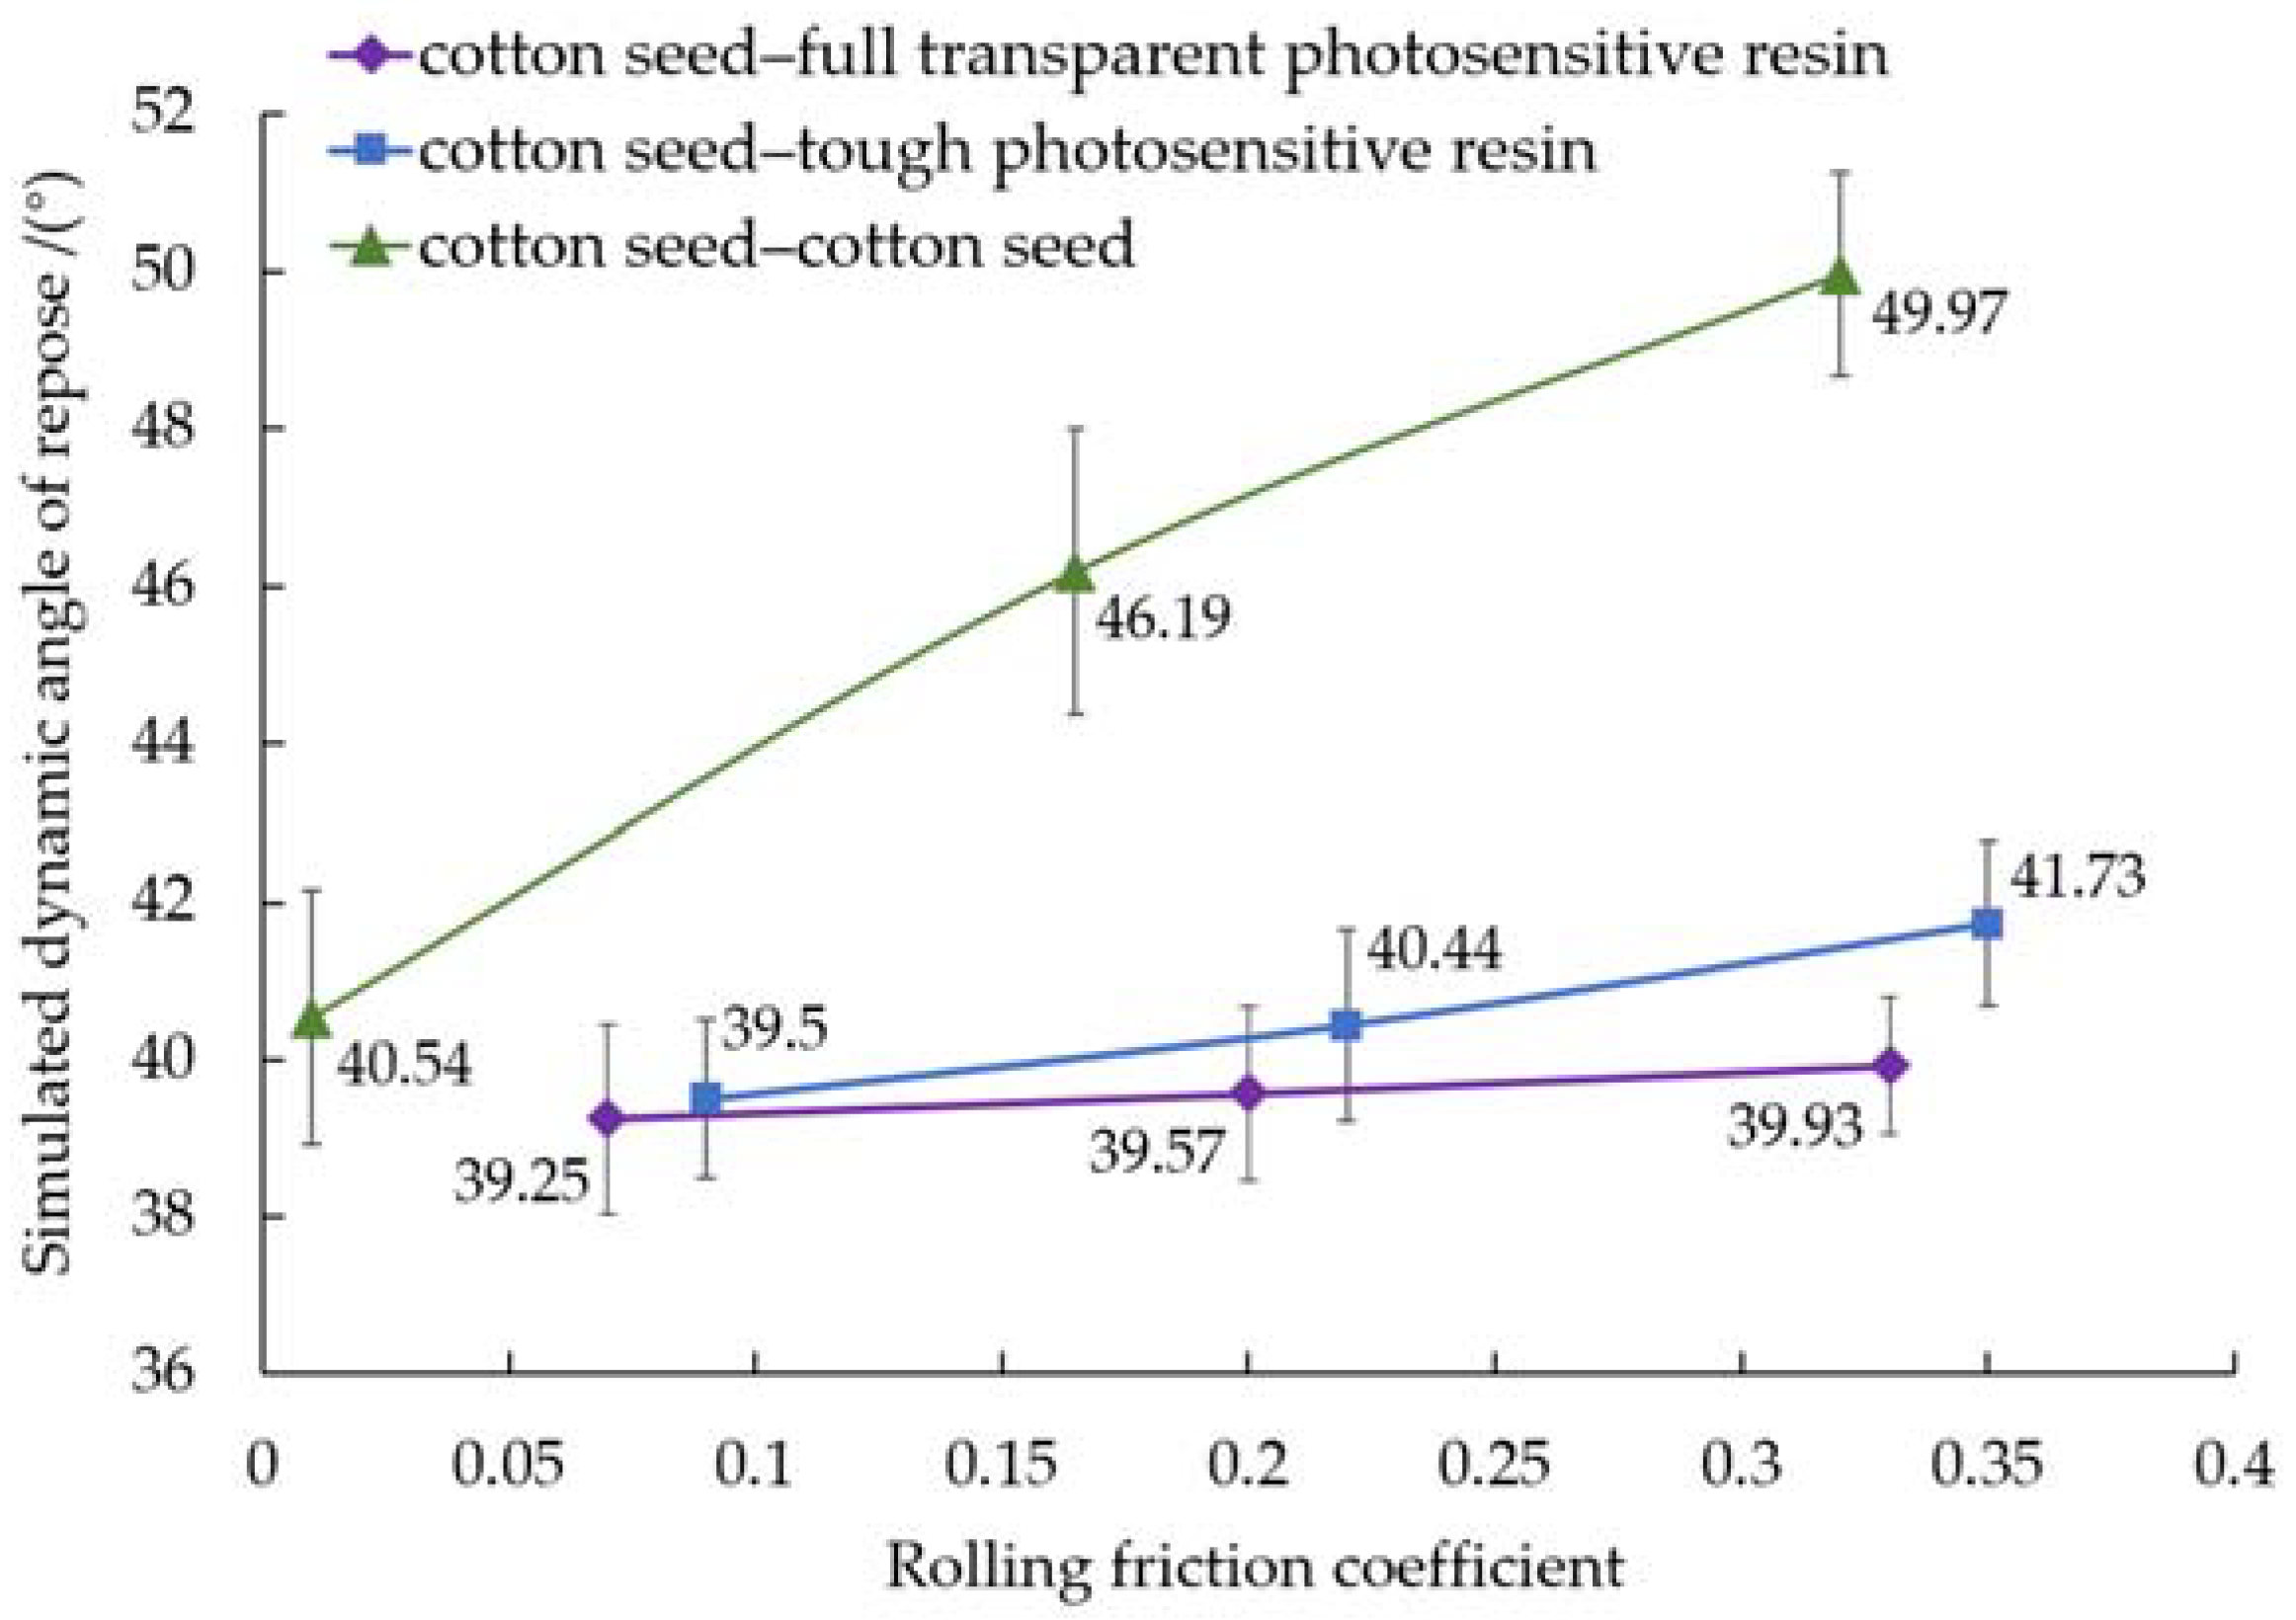
The results of the single-factor test for the rolling friction coefficient showed that the rolling friction coefficient had a positive effect on the simulated dynamic repose angle.

Author Contributions

Conceptualization, M.H., J.X. and Y.Z.; methodology, M.H.; software, M.H., M.Z. and Z.L.; validation, M.H., J.X., Y.Z., C.L., M.Z. and Z.L.; formal analysis, M.H.; investigation, M.H., M.Z. and Z.L.; resources, M.H.; data curation, M.H.; writing—original draft preparation, M.H.; writing—review and editing, M.H., C.L. and J.X.; visualization, M.H.; supervision, J.X.; project administration, J.X.; funding acquisition, J.X. All authors have read and agreed to the published version of the manuscript.

Funding

This research was funded by the Research Funds for Public Welfare Industries (Agriculture) (Grant No.201503136) and National Key Research and Development Program (Grant No.2017YFD0301303).

Institutional Review Board Statement

Not applicable.

Informed Consent Statement

Not applicable.

Data Availability Statement

The data presented in this study are available on demand from the first author at ([email protected]).

Acknowledgments

The authors would like to thank their schools and colleges, as well as the funding of the project. All supports and assistance are sincerely appreciated.

Conflicts of Interest

The authors declare no conflict of interest.

References

  1. Mao, S.C.; Li, Y.B.; Dong, H.Z.; Bie, S.; Lin, Y.Z.; Dong, H.L. Cotton Cultivation in China, 1st ed.; Shanghai Science and Technology Press: Shanghai, China, 2013; pp. 55–65. [Google Scholar]
  2. Zhang, C.Y.; Kang, J.M.; Peng, Q.J.; Zhang, L.L.; Wang, X.Y.; Jian, S.C. Design and Test of Secondary Seed Feeding Mechanism of Air-suction Roller Dibbler for Cotton. Trans. Chin. Soc. Agric. Mach. 2021, 52, 106–116. [Google Scholar]
  3. Ni, X.D.; Xu, G.J.; Wang, Q.; Peng, X.R.; Wang, J.; Hu, B. Design and Experiment of Pneumatic Cylinder Array Precision Seed-metering Device for Cotton. Trans. Chin. Soc. Agric. Mach. 2017, 48, 58–67. [Google Scholar]
  4. Hu, M.J.; Xia, J.F.; Zheng, K.; Du, J.; Liu, Z.Y.; Zhou, M.K. Design and Experiment of Inside-filling Pneumatic High Speed Precision Seed-metering Device for Cotton. Trans. Chin. Soc. Agric. Mach. 2021, 52, 73–85. [Google Scholar]
  5. Ibrahim, E.J.; Liao, Q.X.; Wang, L.; Liao, Y.T.; Yao, L. Design and experiment of multi-row pneumatic precision metering device for rapeseed. Int. J. Agri. Biol. Eng. 2018, 11, 116–123. [Google Scholar]
  6. Yazgi, A.; Degirmencioglu, A. Measurement of seed spacing uniformity performance of a precision metering unit as function of the number of holes on vacuum plate. Measurement 2014, 56, 128–135. [Google Scholar] [CrossRef]
  7. Singh, R.C.; Singh, G.; Saraswat, D.C. Optimisation of Design and Operational Parameters of a Pneumatic Seed Metering Device for Planting Cotton seeds. Biosyst. Eng. 2005, 92, 429–438. [Google Scholar] [CrossRef]
  8. Wang, Y.B.; Li, H.W.; Hu, H.N.; He, J.; Wang, Q.J.; Lu, C.Y.; Liu, P.; He, D.; Lin, X. DEM—CFD coupling simulation and optimization of a self-suction wheat shooting device. Powder Technol. 2021, 393, 494–509. [Google Scholar] [CrossRef]
  9. Li, Z.D.; Yang, W.C.; Wu, Y.Y.; He, S.; Wang, W.W.; Chen, L.Q. Performance analysis and experiments of seed filling assisted by groove-tooth of pneumatic disc precision metering device for rapeseed. Trans. CSAE 2020, 36, 57–66. [Google Scholar]
  10. Gao, X.J.; Zhou, Z.Y.; Xu, Y.; Yu, Y.B.; Su, Y.; Cui, T. Numerical simulation of particle motion characteristics in quantitative seed feeding system. Powder Technol. 2020, 367, 643–658. [Google Scholar] [CrossRef]
  11. Du, X.; Liu, C.L.; Jiang, M.; Zhang, F.Y.; Yuan, H.; Yang, H.X. Design and experiment of self-disturbance inner-filling cell wheel maize precision seed-metering device. Trans. CSAE 2019, 35, 23–34. [Google Scholar]
  12. Lei, X.L.; Liao, Y.T.; Zhang, Q.S.; Wang, L.; Liao, Q.X. Numerical simulation of seed motion characteristics of distribution head for rapeseed and wheat. Comput. Elec. Agri. 2018, 150, 98–109. [Google Scholar] [CrossRef]
  13. Han, D.D.; Zhang, D.X.; Jing, H.R.; Yang, L.; Cui, T.; Ding, Y.Q.; Wang, Z.D.; Wang, Y.X.; Zhang, T.L. DEM-CFD coupling simulation and optimization of an inside-filling air-blowing maize precision seed-metering device. Comput. Elec. Agri. 2018, 150, 426–438. [Google Scholar] [CrossRef]
  14. Zhang, R.F.; Jiao, W.; Zhou, J.L.; Qi, B.; Liu, H.; Xia, Q.Q. Parameter Calibration and Experiment of Rice Seeds Discrete Element Model with Different Filling Particle Radius. Trans. Chin. Soc. Agric. Mach. 2020, 51, 227–235. [Google Scholar]
  15. Kanakabandi, C.K.; Goswami, T.K. Determination of properties of black pepper to use in discrete element modeling. J. Food Eng. 2019, 246, 111–118. [Google Scholar] [CrossRef]
  16. Cabiscol, R.; Finke, J.H.; Kwade, A. Calibration and interpretation of DEM parameters for simulations of cylindrical tablets with multi-sphere approach. Powder Technol. 2018, 327, 232–245. [Google Scholar] [CrossRef]
  17. Hou, Z.F.; Dai, N.Z.; Chen, Z.; Qiu, Y.; Zhang, X.W. Measurement and calibration of physical property parameters for Agropyron seeds in a discrete element simulation. Trans. CSAE 2020, 36, 46–54. [Google Scholar]
  18. Ma, W.P.; You, Y.; Wang, D.C.; Yin, S.J.; Huan, X.L. Parameter Calibration of Alfalfa Seed Discrete Element Model Based on RSM and NSGA-Ⅱ. Trans. Chin. Soc. Agric. Mach. 2020, 51, 136–144. [Google Scholar]
  19. Yu, Q.X.; Liu, Y.; Chen, X.B.; Sun, K.; Lai, Q.H. Calibration and Experiment of Simulation Parameters for Panax notoginseng Seeds Based on DEM. Trans. Chin. Soc. Agric. Mach. 2020, 51, 123–132. [Google Scholar]
  20. Ghodki, B.M.; Patel, M.; Namdeo, R.; Carpenter, G. Calibration of discrete element model parameters: Soybeans. Comput. Part. Mech. 2019, 6, 3–10. [Google Scholar] [CrossRef]
  21. Mohammad, M.; Tekeste, M.Z.; Rosentrater, K.A. Calibration and Validation of a Discrete Element Model of Corn Using Grain Flow Simulation in a Commercial Screw Grain Auger. T. Asabe 2017, 60, 1403–1415. [Google Scholar]
  22. Coetzee, C.J.; Els, D.N.J. Calibration of discrete element parameters and the modelling of silo discharge and bucket filling. Comput. Elec. Agri. 2009, 65, 198–212. [Google Scholar] [CrossRef]
  23. Zhou, L.; Yu, J.; Wang, Y.; Yan, D.; Yu, Y. A study on the modelling method of maize-seed particles based on the discrete element method. Powder Technol. 2020, 374, 353–376. [Google Scholar] [CrossRef]
  24. Shi, L.R.; Ma, Z.T.; Zhao, W.Y.; Yang, X.P.; Sun, B.G.; Zhang, J.P. Calibration of simulation parameters of flaxed seeds using discrete element method and verification of seed-metering test. Trans. CSAE 2019, 35, 25–33. [Google Scholar]
  25. Wu, M.C.; Cong, J.L.; Yan, Q.; Zhu, T.; Peng, X.Y.; Wang, Y.S. Calibration and experiments for discrete element simulation parameters of peanut seed particles. Trans. CSAE 2020, 36, 30–38. [Google Scholar]
  26. Hu, M.J.; Zhou, Y.; Tang, Z.C.; Xu, Z.Y.; Wang, H.L.; Wang, P.T. Mechanical properties of the delinted and coated cotton seed. J. Anhui Agric. Univ. 2018, 45, 175–180. [Google Scholar]
  27. Gao, X.J.; Xu, Y.; He, X.W.; Zhang, D.X.; Yang, L.; Cui, T. Design and Experiment of Diversion Turbine of Air-assisted High Speed Maize Precision Seed Metering Device. Trans. Chin. Soc. Agric. Mach. 2019, 50, 42–52. [Google Scholar]
  28. Liu, W.Z.; He, J.; Li, H.W.; Li, X.Q.; Zheng, K.; Wei, Z.C. Calibration of Simulation Parameters for Potato Minituber Based on EDEM. Trans. Chin. Soc. Agric. Mach. 2018, 49, 125–135.e142. [Google Scholar]
  29. Xing, J.J.; Zhang, R.; Wu, P.; Zhang, X.R.; Dong, X.H.; Chen, Y.; Ru, S.F. Parameter calibration of discrete element simulation model for latosol particles in hot areas of Hainan Province. Trans. CSAE 2020, 36, 158–166. [Google Scholar]
  30. Ma, Y.H. Agricultural Material Science, 1st ed.; Chemical Industry Press: Beijing, China, 2015; p. 90. [Google Scholar]
  31. Chou, S.H.; Hu, H.J.; Hsiau, S.S. Investigation of friction effect on granular dynamic behavior in a rotating drum. Adv. Powder Technol. 2016, 27, 1912–1921. [Google Scholar] [CrossRef]
  32. Mellmann, J. The Transverse Motion of Solids in Rotating Cylinders-Forms of Motion and Transition Behaviour. Powder Technol. 2001, 118, 251–270. [Google Scholar] [CrossRef]
  33. Huang, S. Research and Application of Numerical Simulation of Fluid Machinery, 1st ed.; South China University of Technology Press: Guangzhou, China, 2015; pp. 102–105. [Google Scholar]
  34. Wang, G.Q.; Hao, W.J.; Wang, J.X. Discrete Element Method and Its Practice in EDEM, 1st ed.; Northwest University of Technology Press: Xian, China, 2010; pp. 1–33. [Google Scholar]
  35. Bharadwaj, R.; Ketterhagen, W.R.; Hancock, B.C. Discrete element simulation study of a Freeman powder rheometer. Chem. Eng. Sci. 2010, 65, 5747–5756. [Google Scholar] [CrossRef]
  36. Maharjan, R.; Jeong, S.H. High shear seeded granulation: Its preparation mechanism, formulation, process, evaluation, and mathematical simulation. Powder Technol. 2020, 366, 667–688. [Google Scholar] [CrossRef]
  37. Ucgul, M.; Fielke, J.M.; Saunders, C. Three-dimensional discrete element modelling of tillage: Determination of a suitable contact model and parameters for a cohesionless soil. Biosyst. Eng. 2014, 121, 105–117. [Google Scholar] [CrossRef]
  38. Ketterhagen, W.R. Modeling the motion and orientation of various pharmaceutical tablet shapes in a film coating pan using DEM. Int. J. Pharmaceut. 2011, 409, 137–149. [Google Scholar] [CrossRef]
  39. Wang, L.M.; Fan, S.Y.; Cheng, H.S.; Meng, H.B.; Shen, Y.J.; Wang, J.; Zhou, H.B. Calibration of contact parameters for pig manure based on EDEM. Trans. CSAE 2020, 36, 95–102. [Google Scholar]
  40. Cunha, R.N.; Santos, K.G.; Lima, R.N.; Duarte, C.R.; Barrozo, M.A.S. Repose angle of monoparticles and binary mixture: An experimental and simulation study. Powder Technol. 2016, 303, 203–211. [Google Scholar] [CrossRef]
Figure 1. Impact recovery coefficient measuring device.
Agriculture 12 00286 g001
Figure 2. Static friction coefficient measuring device.
Agriculture 12 00286 g002
Figure 3. Rolling friction coefficient measuring device. Note: φ is the rolling friction angle between cotton seed and test baseplate, (°).
Agriculture 12 00286 g003
Figure 4. Determination of dynamic repose angle. (a) Dynamic repose angle measuring device; (b) seed stacking image. Note: θ is the dynamic repose angle of cotton seed, (°).
Agriculture 12 00286 g004
Figure 5. Boundary fitting curve of dynamic repose angle.
Agriculture 12 00286 g005
Figure 6. Contact model. (a) Two particles contact force model; (b) two particles connected by an adhesive bond.
Agriculture 12 00286 g006
Figure 7. Discrete element simulation models of cotton seeds. (a) Flat cotton seed; (b) ellipsoidal cotton seed.
Agriculture 12 00286 g007
Figure 8. Generation process of cotton seeds discrete element models. (a) Whole_ellipsoidal and Whole_flat particles generation; (b) ellipsoidal cotton seeds generation; (c) flat cotton seeds generation.
Agriculture 12 00286 g008
Figure 9. Simulation pretest of drum. (a) Before rotation; (b) after rotation.
Agriculture 12 00286 g009
Figure 10. Cotton seeds stacking state.
Agriculture 12 00286 g010
Figure 11. Structural schematic diagram of the inside-filling pneumatic cotton precision seed-metering device. (a) Decomposition schematic diagram of seed-metering device; (b) front view of the seed-metering device. 1, Altitude adjusting plate for seed layer; 2, base; 3, seed protection board; 4, seed disturbing air nozzle; 5, eliminating finger; 6, back shell; 7, sprocket; 8, seeding plate; 9, seed throwing air nozzle; 10, seeding shaft; 11, suction hole replacement plate; 12, bearing end cover; 13, front shell.
Agriculture 12 00286 g011
Figure 12. Physical test of seed-metering device. Note: η is the filling angle of cotton seeds, (°).
Agriculture 12 00286 g012
Figure 13. Pareto chart.
Agriculture 12 00286 g013
Figure 14. Velocity vector diagram of the cotton seeds in the rotating drum simulation test.
Agriculture 12 00286 g014
Figure 15. The simulation validation test process of seed-metering device.
Agriculture 12 00286 g015
Figure 16. Effect of the rolling friction coefficient on simulated dynamic repose angle.
Agriculture 12 00286 g016
Table 1. Test materials intrinsic parameters.
MaterialsPoisson’s RatioShear Modulus/(Pa)Density/(kg·m−3)
Tough photosensitive resin0.421.04 × 1091140
Fully transparent photosensitive resin0.419.49 × 1081268
Table 2. Plackett–Burman test parameter range table.
SymbolSimulation ParameterLevels
Low Level (−1)Mid Level (0)High Level (+1)
AImpact recovery coefficient of cotton seed–tough photosensitive resin 0.040.230.42
BStatic friction coefficient of cotton seed–tough photosensitive resin 0.300.360.42
CImpact recovery coefficient of cotton seed–fully transparent photosensitive resin 0.030.180.33
DStatic friction coefficient of cotton seed–
fully transparent photosensitive resin
0.260.290.32
EImpact recovery coefficient of cotton seed–cotton seed0.010.0950.18
FStatic friction coefficient of cotton seed–
cotton seed
00.050.10
G, H, J, K, LVirtual parameter−10+1
Table 3. Plackett–Burman test protocol and results.
Test Serial NumberTest FactorsSimulated Dynamic Angle of Repose θ/(°)
ABCDEFGHJKL
111−1111−1−1−11−140.02 ± 1.14
2−111−1111−1−1−1139.43 ± 0.57
31−111−1111−1−1−138.06 ± 0.64
4−11−111−1111−1−133.82 ± 0.82
5−1−11−111−1111−137.33 ± 0.62
6−1−1−11−111−111138.36 ± 1.02
71−1−1−11−111−11130.01 ± 1.64
811−1−1−11−111−1140.49 ± 1.15
9111−1−1−11−111−133.94 ± 1.38
10−1111−1−1−11−11134.08 ± 0.90
111−1111−1−1−11−1131.05 ± 0.90
12−1−1−1−1−1−1−1−1−1−1−131.51 ± 1.50
Table 4. Significance analysis of Plackett–Burman test results.
Test
Factors
Stdized
Effect
Sum of SquaresDegree of FreedomF-Valuep-ValueContribution/%Significance Ranking
A−0.160.0810.710.4390.0515
B2.5819.921183.39<0.0001 **13.1362
C−0.0530.0110.080.7900.0066
D0.450.6015.510.0660.3954
E−0.81.90117.530.009 **1.2563
F6.55128.5811183.87<0.0001 **84.7991
R2 = 0.9964; Adj R2 = 0.9921; CV = 0.92%; Adeq precision = 39.41
Note: p ≤ 0.01 (Highly significant, **).
Table 5. Box–Behnken test protocol and results.
Test Serial NumberBEFSimulated Dynamic Angle of Repose θ/(°)
1−1−1035.95 ± 1.20
21−1037.40 ± 2.12
3−11034.15 ± 1.02
411036.98 ± 0.79
5−10−131.24 ± 0.86
610−133.21 ± 0.59
7−10137.15 ± 2.06
810140.90 ± 2.28
90−1−133.21 ± 0.88
1001−132.30 ± 0.88
110−1140.70 ± 0.62
1201139.34 ± 0.73
1300036.07 ± 0.89
1400036.39 ± 0.74
1500036.95 ± 0.94
1600036.01 ± 1.40
1700036.55 ± 0.78
Table 6. Variance analysis of Box–Behnken test results.
Source of VariationSum of SquaresDegree of FreedomF-Valuep-Value
Model116.88995.34<0.0001 **
B12.50191.76<0.0001 **
E2.52118.500.0036 **
F98.911726.12<0.0001 **
BE0.4813.500.1038
BF0.7915.810.0467 *
EF0.0510.370.5614
B21.1318.300.0236 *
E20.2511.840.2166
F20.2611.940.2059
Residual0.957
Lack of Fit0.3730.840.5400
Pure Error0.594
Cor Total117.8316
R2 = 0.9919; Adj R2 = 0.9815; CV = 1.02%; Adeq precision = 33.68
Note: p ≤ 0.01 (Highly significant, **); 0.01 < p ≤ 0.05 (Significant, *).
Publisher’s Note: MDPI stays neutral with regard to jurisdictional claims in published maps and institutional affiliations.

