Article

Dynamic Resistant Starch Accumulation in Contrasting Wheat Genotypes Highlights the Lipid Metabolic Pathway Related to Resistant Starch Synthesis

1
Hubei Key Laboratory of Food Crop Germplasm and Genetic Improvement, Food Crops Institute, Hubei Academy of Agricultural Sciences, Wuhan 430064, China
2
Institute of Crop and Nuclear Technology Utilization, Zhejiang Academy of Agricultural Sciences, Hangzhou 310021, China
3
Hubei Key Laboratory of Waterlogging Disaster and Agriculture Use of Wetland/Hubei Collaborative Innovation Centre for Grain Industry, Yangtze University, Jingzhou 434025, China
*
Authors to whom correspondence should be addressed.
These authors contributed equally to this work.
Submission received: 20 December 2021 / Revised: 7 February 2022 / Accepted: 17 February 2022 / Published: 21 February 2022

Abstract

:
Resistant starch (RS) shows several health benefits. Enhancing the RS content of wheat is of major commercial importance. However, knowledge regarding the RS synthesis mechanism in wheat remains limited. In this study, the dynamic accumulation of RS during the filling process in two wheat (Triticum aestivum L.) genotypes with contrasting RS contents (H242, high RS content; H189, low RS content) were investigated. The results demonstrate that beyond 25 days after pollination (DAP), the RS content of H189 was relatively stable, but that of H242 continued to increase. Secondary accumulation was observed in the high-RS-content wheat genotype. A comparative transcriptome analysis between H242 and H189 at 20 DAP and 35 DAP showed that the differentially expressed genes were mainly involved in glycerolipid metabolism, glycerophospholipid metabolism and glucuronate interconversions. Furthermore, weighted gene coexpression network analysis suggested that lipid metabolic pathways such as the glycerophospholipid metabolism pathway might be involved in RS synthesis, and lipid-related genes upregulated beyond 25 DAP resulted in RS secondary accumulation. This work provides insight into the characteristics and mechanisms of RS synthesis.

1. Introduction

Resistant starch (RS) is defined as the portion of starch that passes undigested through the small intestine of healthy individuals [1]. Previous results have indicated that the consumption of RS can reduce the risk of diseases such as obesity [2], diabetes [3], cardiovascular disease [4] and colon tumours [5]. Research on RS has attracted broad attention due to its benefits for human health [6].
RS has been classified as RS1 (physically embedded starch), RS2 (natural starch granules), RS3 (retrograde starch), RS4 (chemically modified starch) or RS5 (five-type self-assembled-starch complexes). Recently, RS5 was redefined as five-type self-assembled-starch complexes, such as amylose–lipid, starch–fatty, starch–monoglycerides and starch–lipid protein [7]. The enzymatic resistance of the amylose–lipid complex depends on the lipid’s molecular structure and the crystalline morphology of the helices [8]. The amylose–lipid complexes are commonly found in both native starch granules and processed starch [9]. Starch can be assembled into RS in vitro by adding vitro lipids [10]. Higher lipid contents have been observed to be accompanied by higher RS contents in rice grain endosperm [11], and the in vitro stimulation of digestion to remove in vivo rice lipids reduces RS content [12]. Furthermore, the amylose–lipid complex can affect white rice RS content [13]. These studies suggest that lipids play an important role in starch properties. Therefore, the relationship between lipidic pathways and RS synthesis needs to be further explored during grain development.
Studies have confirmed that several starch synthesis genes also regulate RS formation in grains. The null mutation of the soluble starch synthase gene SSIIIa leads to an increase in rice RS content [14]. Knocking out or silencing the starch-branching enzyme gene SBEII can increase RS contents in barley, rice and wheat [15,16,17,18]. The RS content decreases following the loss of the functional granule-bound starch synthase gene GBSSI in wheat [19].
RS biosynthesis is a complex quantitative trait that is regulated by multiple genes. In rice, 17 significant RS-related quantitative trait loci (QTLs) have been identified on chromosomes 1, 2, 3, 5, 6, 7, 8, 9 and 11 [20,21,22]. In the lentil, ten single-nucleotide polymorphisms (SNPs) (on chromosomes 1, 3, 6 and 7) have been associated with seed RS content [23]. A genome-wide association study (GWAS) based on 209 spring barley varieties identified 40 SNP markers related to grain RS content [24]. In wheat, 14 QTLs related to grain RS content have been identified, two of which are additive QTLs on chromosome 4A, which can explain 11.47% and 12.53% of the observed phenotypic variation [25,26].
The seed-filling phases can be divided into division and expansion (0–14 days after pollination, DAP), grain filling (14–28 DAP), maturation and desiccation (28 DAP to maturity) [27]. The rate of starch accumulation reaches a maximum in the grain-filling phase and then decreases gradually [28]. The expression levels of genes involved in sucrose hydrolysis and those encoding sugar enzymes are significantly increased in the grain-filling phase [29]. Studies have illustrated that transcription factors (TFs) regulate starch-related gene expression at different stages [30]. bHLH TF family genes are activated at 3 DAP [31]. The ZIP TF family is preferentially expressed in endosperm during grain development to regulate starch synthesis [32]. Furthermore, the overexpression of TaMYB13-1 can enhance starch accumulation in transgenic wheat [33], and MYB14 [34] and bHLH genes [35] are also involved in grain starch synthesis.
Wheat (Triticum aestivum L.) is one of the main staple crops worldwide [32,36]. RS is one component of wheat starch that has been proven to be good for human health [37]. Several studies aimed at increasing RS contents through physical, chemical, and genetic regulation have been reported [10,38]. However, the accumulation characteristics and mechanism of RS during wheat grain development have not been fully elucidated. To gain insights into RS biosynthesis in wheat, we monitored the dynamic changes in RS contents during the filling process in two wheat genotypes with contrasting RS contents. Comparative transcriptome analysis was used to identify differentially expressed genes (DEGs) and pathways involved in RS biosynthesis. This study revealed crucial molecular pathways between the two contrasting genotypes, providing important insights into the mechanisms underlying RS biosynthesis in wheat.

2. Materials and Methods

2.1. Plant Materials and Field Experiments

Two wheat cultivars with contrasting RS contents, H189 (low RS content) and H242 (high RS content), were used in this study. The field experiments were carried out at the experimental station of Yangtze University (30°21’ N, 112°31’ E, elevation 32 m) in Hubei Province from 2017 to 2018. The plots were 25 m2 (10 m × 2.5 m), and three replications were performed for each cultivar. The row spacing was 25 cm. Pest, disease and weed control were performed according to local management practices.

2.2. Grain TGW, TS and RS Measurement

Ears of wheat were sampled on the 5th, 10th, 15th, 20th, 25th, 30th, 35th and 40th DAP. At each sampling point, one hundred ears per cultivar were randomly collected and divided into two portions: one portion was stored at −80 °C for future transcriptomic analysis, and the other was dried at 80 °C to measure the thousand-grain weight (TGW), total starch (TS) content and RS content. Whole-grain flour was prepared from seeds by grinding in a pulveriser Perten Laboratory Mill 3100 (SEEDBURO, Des Plaines, IL, USA), which was fitted with a 0.8 mm screen. TS and RS contents were determined with a K-TSTA-100A total starch kit (Megazyme, Bray, Ireland) and a K-RSTAR resistant starch assay kit (Megazyme, Bray, Ireland), respectively, following the manufacturer’s instructions. These kits measure TS and RS as a percentage of whole grain, and we further calculated the TS and RS contents per seed based on thousand grain weight. All samples were measured with three biological replicates and three technical repeats.

2.3. RNA Extraction and Sequencing

Seed samples from 20 DAP (H189_20 and H242_20) and 35 DAP (H189_35 and H242_35) were used for transcriptome analysis. The total RNA of each sample was extracted using the TRIzol reagent (TIANGEN, Beijing, China) following the manufacturer’s instructions. Total RNA samples were treated with DNase to degrade possible genomic DNA contamination. The concentration, integrity, and purity of the RNA samples were determined using a NanoDrop spectrophotometer (NanoDrop Technologies, Wilmington, NC, USA) and an Agilent 2100 BioAnalyzer (Agilent Technologies, Santa Clara, CA, USA). Library preparation for RNA-Seq was conducted using the MGIEasy mRNA Kit (BGI, Shenzhen, China) according to the manufacturer’s protocol, including mRNA enrichment, fragment interruption, adapter addition, size selection, and polymerase chain reaction amplification. Magnetic beads were used to enrich eukaryotic mRNA, and the mRNA was randomly broken by fragmentation buffer. Finally, cDNA libraries were sequenced on the MGIseq 2000 platform (GOOALGENE, Wuhan, China). Three biological replicates of each sample were analysed. From twelve samples, we obtained 609 million total filtered reads, of which 555 million could be mapped to the Arabidopsis genome assembly, with 26.9 to 43.5 million uniquely mapped reads per sample.

2.4. Data Filtering, DEG Identification and Functional Annotation

Adaptor and low-quality sequences were removed using fastp with the default parameters [39]. The clean reads were mapped to IWGSC1.0 [40]. Gene expression levels were estimated by the fragments per kilobase of transcript per million fragments mapped (FPKM) method. Genes satisfying the criteria of a |log 2 (fold change) | > 1 and the p-value < 0.05 were defined as DEGs by DESeq. Gene Ontology (GO) and Kyoto Encyclopedia of Genes and Genomes (KEGG) analyses of the DEGs were performed using the OmicShare tools (http://www.omicshare.com/tools, accessed on, 30th April 2021), and the standard for filtration was a p-value < 0.05. Moreover, TBtools software was used to generate Venn diagrams and heatmaps [41].

2.5. Weighted Gene Coexpression Network Analysis

Gene coexpression networks were constructed using the WGCNA package in R software [42]. The DEGs were further divided into modules by using WGCNA, and the correlation of each module with RS content was calculated. The gene regulatory network was drawn using Cytoscape v. 3.8.2 [43].

2.6. Quantitative Real-Time PCR for RNA-seq Validation

The same RNA samples employed for RNA-seq library construction were used for quantitative real-time PCR (qRT-PCR) validation [44]. First-strand cDNA was synthesised using the UEIris RT mix with DNase (All-in-one) kit (US Everbright, Suzhou, China) according to the manufacturer’s instructions. qRT-PCR was performed using 2x SYBR Green qPCR Master mix (S2014, US Everbright, China) on a QuantStudio™ 7 Flex Real-Time PCR System (Applied Biosystems, Waltham, MA, USA). A total of 15 genes were selected to identify their expression patterns. The primers for the selected genes and the TaActin gene were designed using Primer Premier 5.0, and they are listed in Table S1. qRT-PCR was conducted in triplicate (technical repeats) with three biological replicates for each sample, and relative gene expression levels were calculated using the 2–ΔΔCt method.

3. Results

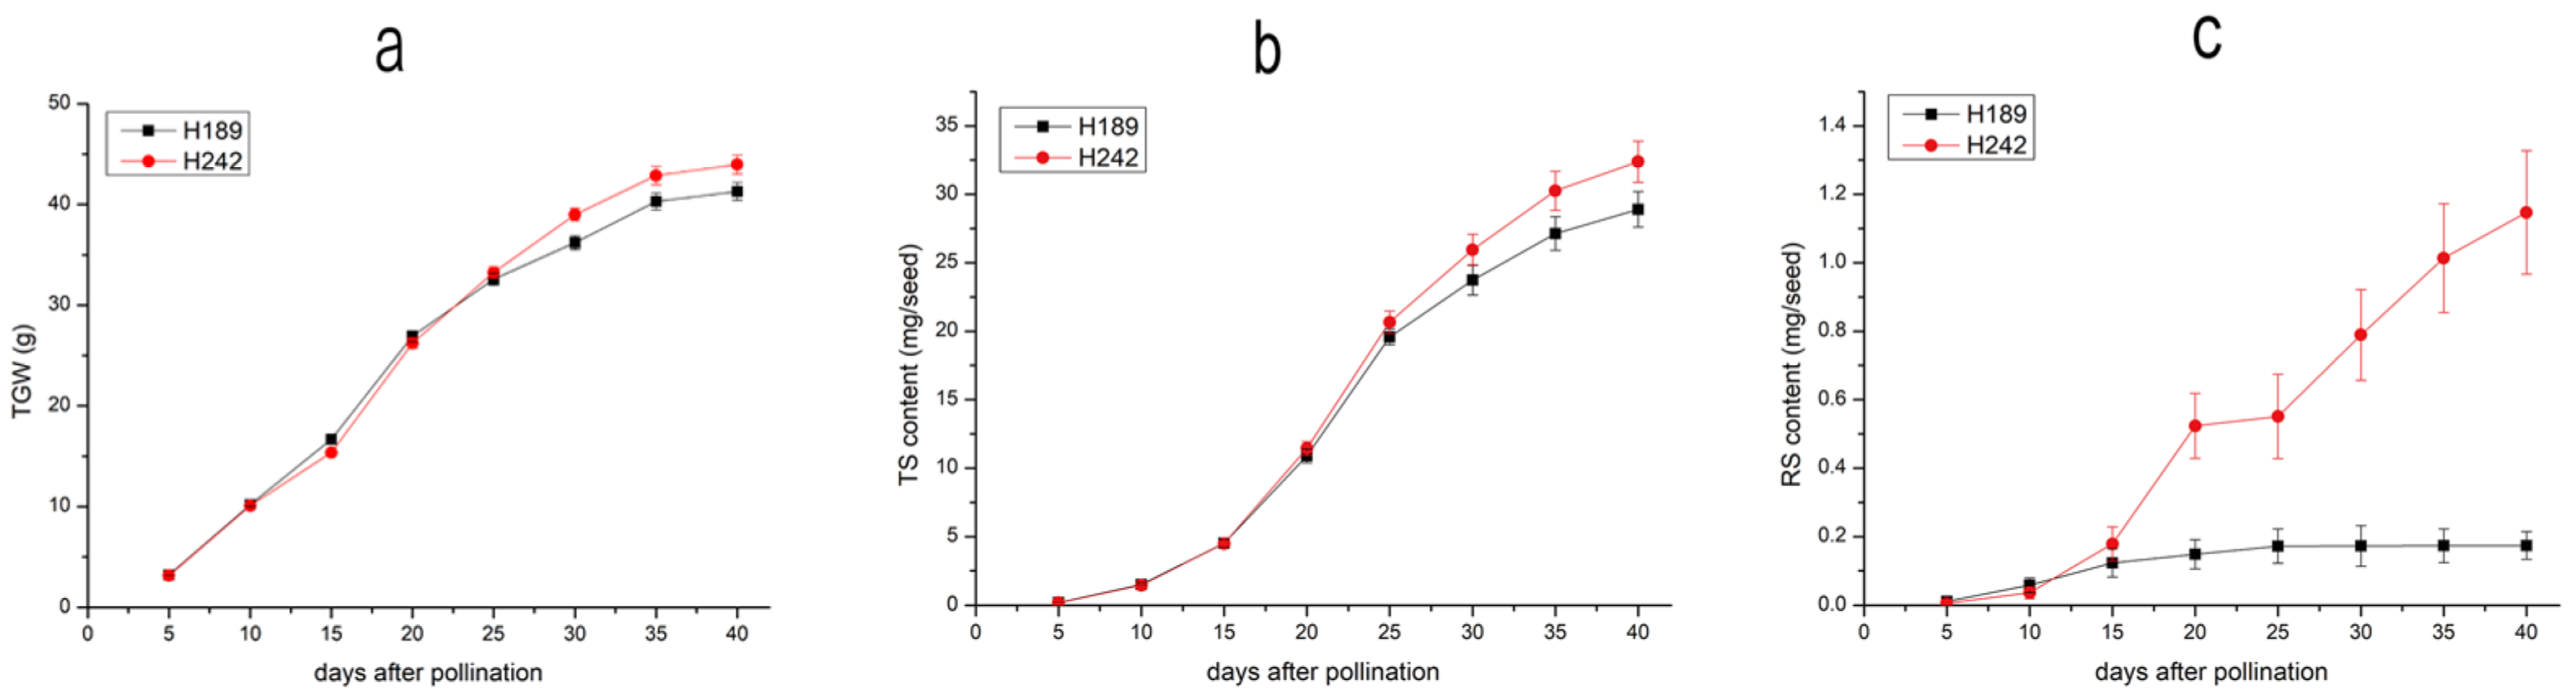
3.1. Grain TGW, TS and RS Contents and Accumulation Rates

TGW increased gradually with the development of grain filling. At 40 DAP, the TGWs of H242 and H189 were 43.956 g and 41.294 g, respectively (Figure 1a). The TGW accumulation rate of the two cultivars reached a maximum at 15–20 DAP (2.171 g day-1 in H242, 2.047 g day−1 in H189) and then decreased (Table 1). No significant differences in the TGW accumulation rate were observed between H242 and H189 in the early (0–10 DAP) and late stages (30–40 DAP) of grain filling (p < 0.05), but there were significant differences between the two cultivars at 10–30 DAP (p < 0.05).
The TS contents of H242 and H189 increased with grain filling. The TS of H242 was higher than that of H189 at 40 DAP (28.904 mg seed−1 in H189, 32.381 mg seed−1 in H242) (Figure 1b). The TS accumulation rates of both materials increased continuously before 25 DAP and then decreased. The TS accumulation rates reached a maximum of 1.844 mg seed−1 day−1 (H242) and 1.740 mg seed−1 day−1 (H189) at 20–25 DAP (Table 1). There were no significant differences in the TS accumulation rate between H242 and H189 before 25 DAP (p < 0.05), but significant differences were observed beyond 25 DAP (p < 0.05).
With the development of grain filling, the RS content of H242 increased gradually, but that of H189 was relatively stable beyond 25 DAP (Figure 1c). The final RS contents of H242 and H189 were 1.147 mg seed−1 and 0.174 mg seed−1 at 40 DAP. In terms of H242 RS productivity, the highest RS accumulation rate of H242 was 69.0 μg seed−1 day−1 at 15–20 DAP, which was significantly higher than that of H189 (5.0 μg seed−1 day−1) (Table 1). After 15 DAP, the RS accumulation rate of H189 began to decrease, and RS accumulation nearly stopped beyond 25 DAP. Remarkably, the RS accumulation rate of H242 dropped to 5.5 μg seed−1 day−1 at 20–25 DAP, then increased again to 47.7 μg seed−1 day−1 from 25 to 30 DAP and subsequently decreased. The final RS accumulation rates of H189 and H242 were 0.1 μg seed−1 day−1 and 26.7 μg seed−1 day−1, respectively. There were no significant differences in the rate of accumulation between the two cultivars in the initial (0–5 DAP) stage (p < 0.05). However, highly significant differences were observed in the two cultivars beyond 25 DAP (p < 0.05).

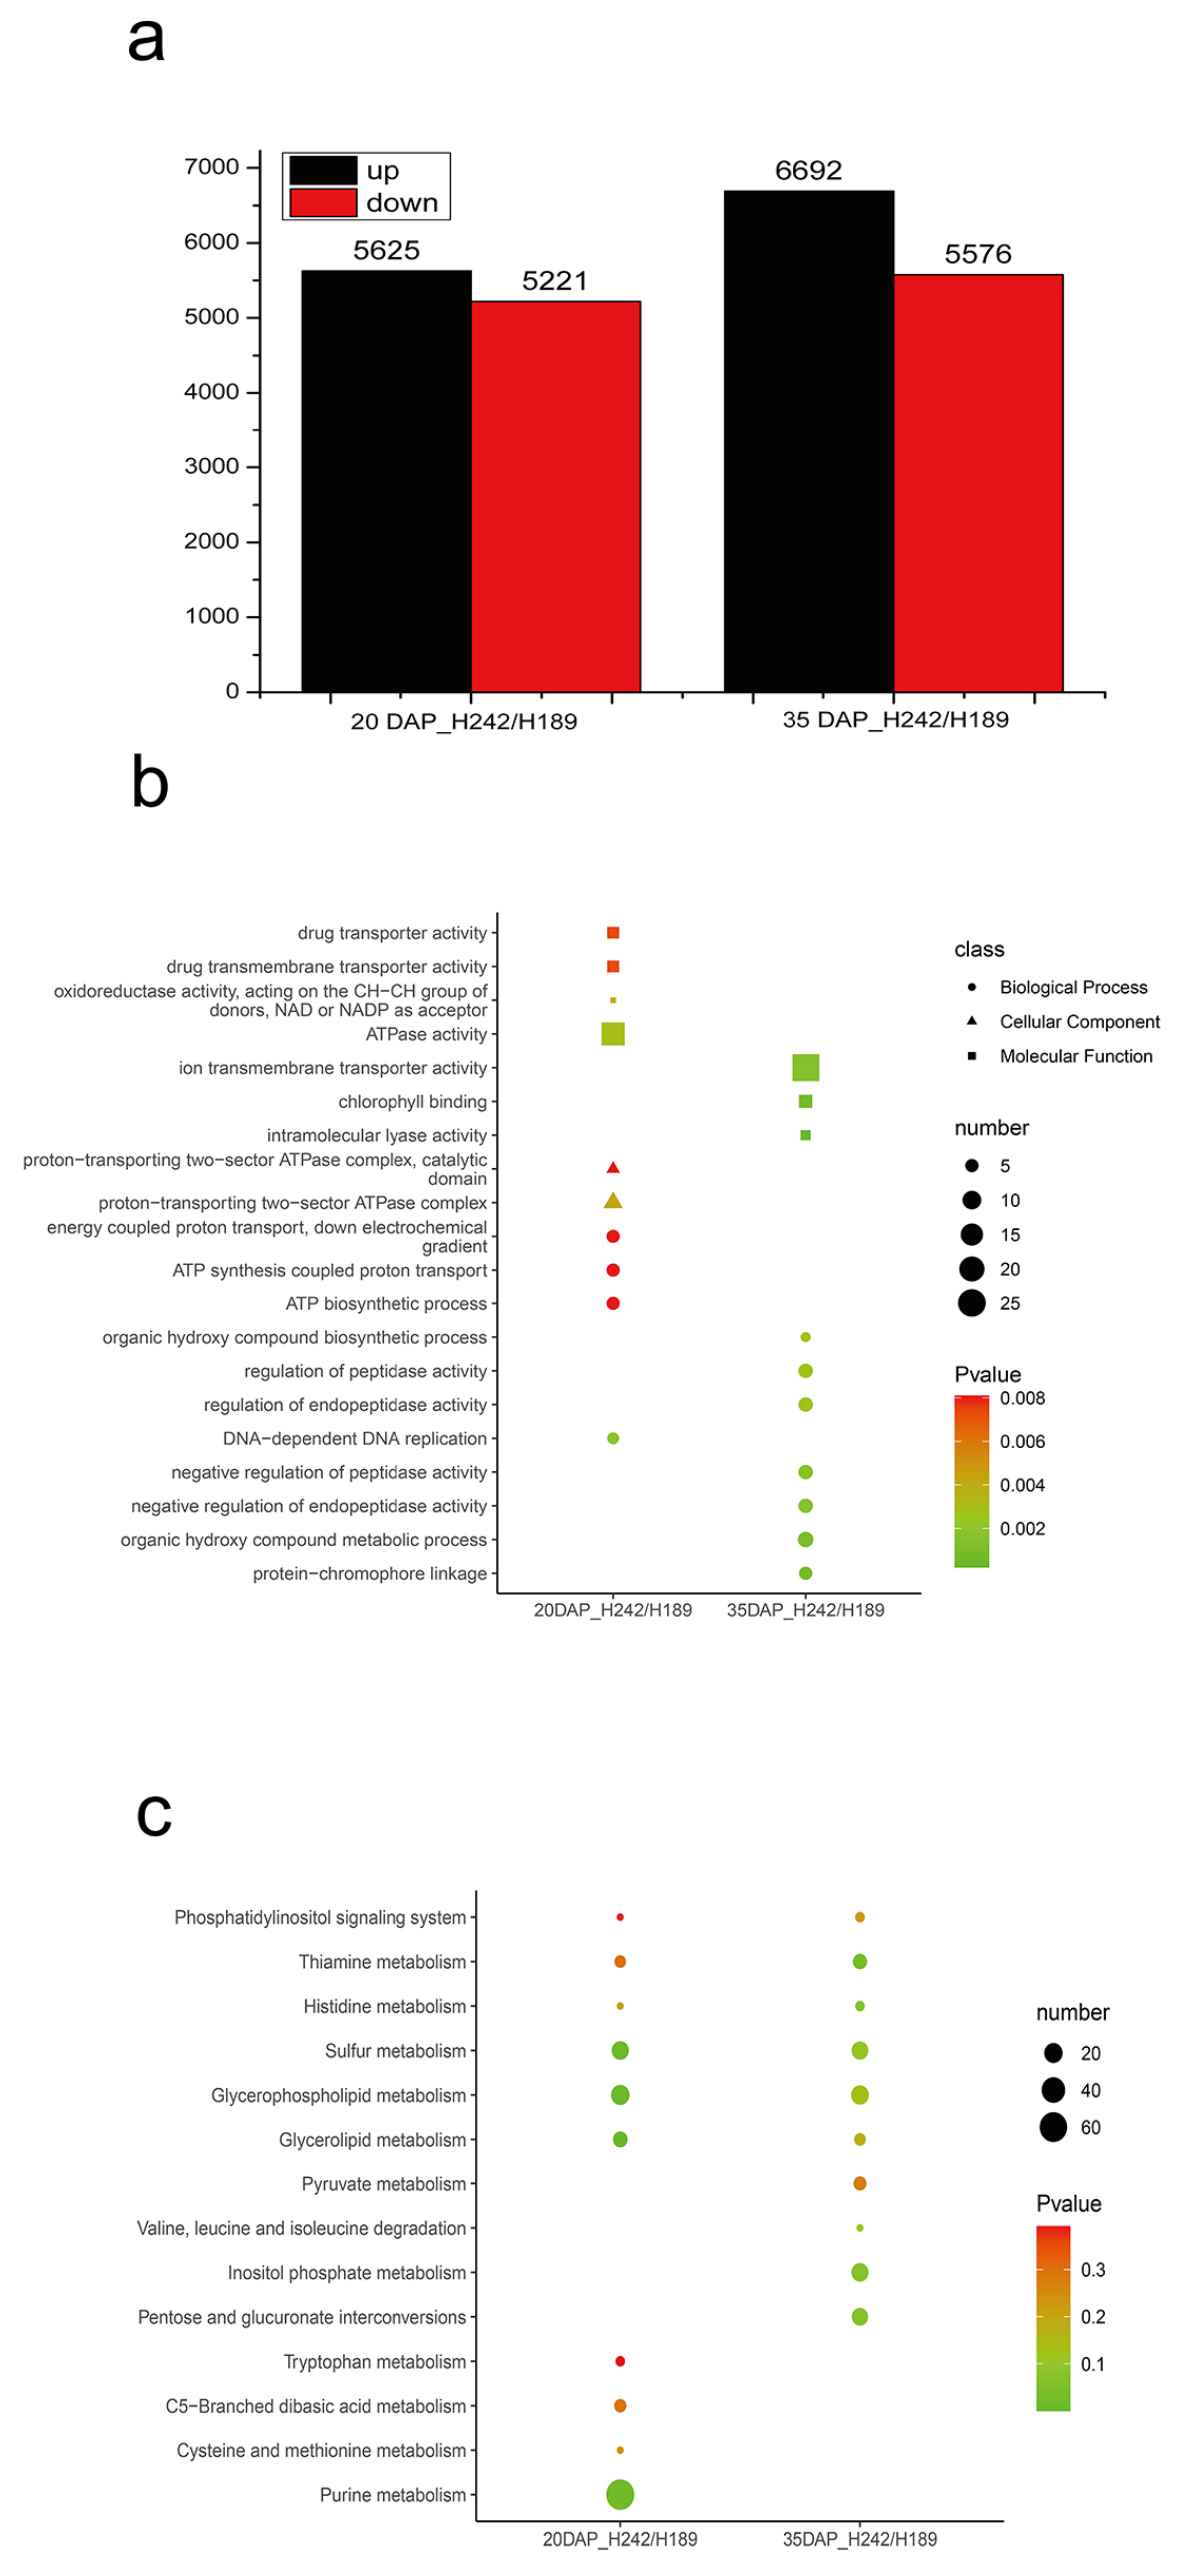
3.2. Differential Gene Expression Analysis

A total of 10,846 (6692 up- and 5576 downregulated) and 12,268 (6692 up- and 5576 downregulated) DEGs were identified between H242 and H189 at 20 and 35 DAP, respectively (Figure 2a). GO term enrichment analysis was performed to identify terms in the biological process (BP), molecular function (MF), and cellular component (CC) categories (Figure 2b). At 20 DAP_H242/H189, a total of 122 GO terms were significantly enriched (p < 0.05), including DNA-dependent DNA replication (GO:0006261), ATPase activity (GO:0016887), oxidoreductase activity (GO:0016628), the proton-transporting two-sector ATPase complex (GO:0016469) and the ATP biosynthetic process (GO:0006754). At 35 DAP_H242/H189, 141 GO terms were significantly enriched (p < 0.05), including intramolecular lyase activity (GO:0016872), chlorophyll binding (GO:0016168), protein–chromophore linkage (GO:0018298), the organic hydroxy compound metabolic process (GO:1901615) and regulation of peptidase activity (GO:0052547) (Figure 2b).
To examine the DEG-associated pathways, they were searched using the KEGG pathway database (Figure 2c). A total of 50 pathways were enriched in 20 DAP_H242/H189, among which glycerolipid metabolism (ko00561), glycerophospholipid metabolism (ko00564), sulphur metabolism (ko00920) and purine metabolism (ko00230) were significantly enriched (p < 0.05). Ten genes were significantly enriched in glycerolipid metabolism (p < 0.05), and glycerophospholipid metabolism pathways were enriched with 20 genes. The DEGs of 35 DAP_H242/H189 were found to be involved in 56 distinct metabolic pathways, including thiamine metabolism (ko00730), pentose and glucuronate interconversions (ko00040), histidine metabolism (ko00340), and inositol phosphate metabolism (ko00562).

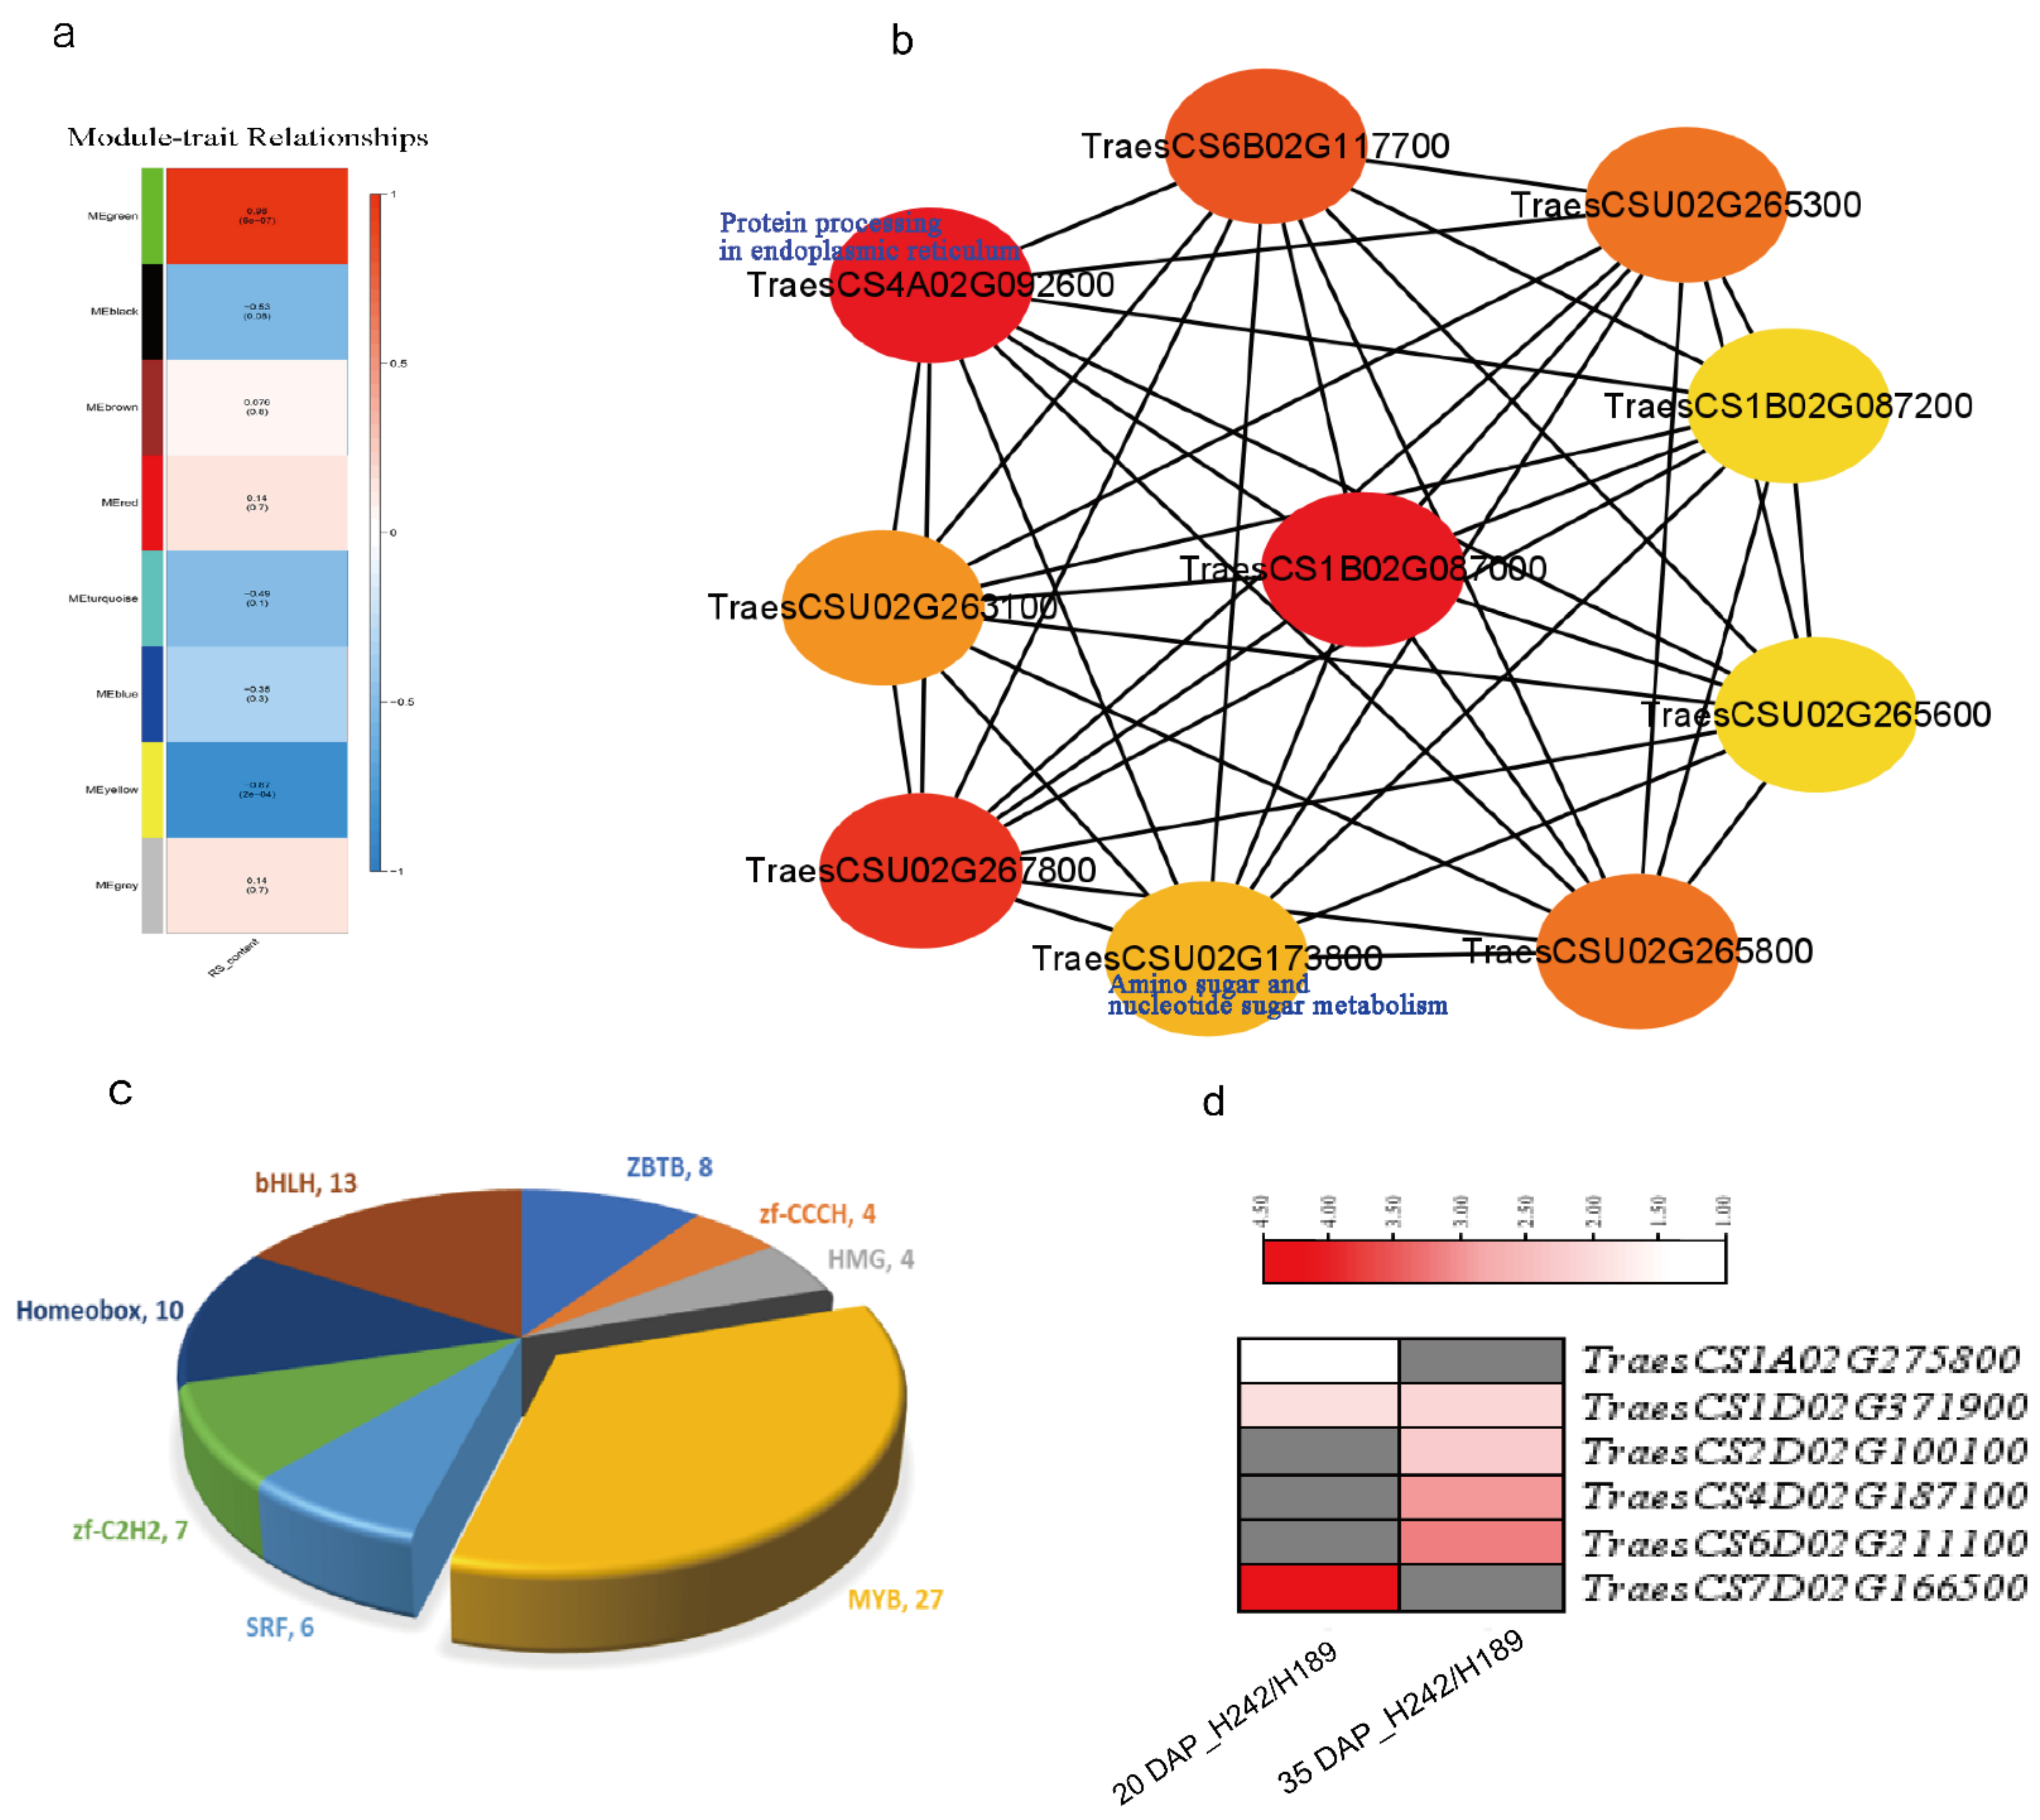
3.3. Pathways and TFs Involved in RS Formation Revealed by WGCNA

To further study the patterns of association between the DEGs and RS contents in the two genotypes, WGCNA was performed to explore gene modules to evaluate synergistic expression. After the filtering of low-expression genes (FPKM < 5), the remaining genes were classified into eight different modules. The green module showed the highest positive correlation with the RS content (r2 = 0.96, p = 6 × 10⁻⁷) (Figure 3a). A total of 99 genes were identified in the green module. We constructed the coexpression regulatory network of the genes with the top ten weights in this module, which included genes involved in protein processing in the endoplasmic reticulum and amino sugar and nucleotide sugar metabolism (Figure 3b). KEGG enrichment analysis showed that 14 pathways were significantly enriched, including diterpenoid biosynthesis (ko00904), pentose and glucuronate interconversions (ko00040), protein processing in the endoplasmic reticulum (ko04141), inositol phosphate metabolism (ko00562), fatty acid elongation (ko00062) α-linolenic acid metabolism (ko00592) and fatty acid biosynthesis (ko00061) (Table S2). Moreover, the genes in the green module were matched with MYB, homeobox and bHLH TFs. The TraesCS1D02G371900 gene, which encodes MYB, was upregulated at both 20 and 35 DAP in H242 (Figure 3c). Seven homeobox genes and five bHLH-related genes were differentially expressed in two critical periods. Interestingly, all of these genes were expressed at higher levels in H242 than in H189.
The lipid metabolism pathway was selected and presented due to its strong enrichment according to DEG functional annotation. There were two significant metabolic processes in the lipid metabolism pathway: glycerolipid metabolism (ko00561) and glycerophospholipid metabolism (ko00564). Furthermore, KEGG analysis revealed that the main genes matching KEGG Orthology (KO) IDs encoded glycerol-3-phosphate O-acyltransferase (k00629), glycerol-3-phosphate cytidylyltransferase (k00980), lecithin-cholesterol acyltransferase (k00650) and phosphatidylethanolamine/phosphatidyl-N-methylethanolamine N-methyltransferase (k00570) (Figure S1), and these pathway interactions together regulated lipid synthesis. Moreover, we further analysed the expression patterns of genes associated with lipid metabolism (Figure 4). And the fold change in lipid related genes expression (log 2FC) was in Table S3. Relative to H189, 8 genes were upregulated and 11 genes were downregulated in H242 at 20 DAP, and 7 and 11 genes were up- and downregulated, respectively, at 35 DAP. Interestingly, the TraesCS3A02G022600 gene, encoding glycerol-3-phosphate O-acyltransferase, was upregulated in H242 at both 20 and 35 DAP.

3.4. Validation of RNA-Seq Analysis by qRT-PCR

The expression of DEGs was validated using qRT-PCR. A total of 15 genes were selected, 5 of which were associated with lipids, while 10 were selected randomly. The log2-fold change values of these selected transcripts showed a highly significant correlation (r2 = 0.81625, n = −0.07) between the RNA-Seq and qRT-PCR data, indicating that the transcriptome data were accurate and reliable (Figure S2).

4. Discussion

4.1. Secondary Accumulation of Grain RS

“S”-type accumulation patterns of TGW and TS were observed in this study, which is consistent with previous research [45]. The TS and TGW were enhanced slowly in initial, linear growth and most rapidly around the time of the medium term and nearly ceasing by the end of the period of grain filling. Similarly, the identified correlations between RS and TGW and between RS and TS were consistent with previous studies [28]. However, limited information is available on the RS accumulation characteristics during grain development. In the present study, secondary accumulation was observed in the wheat cultivar with a high RS content beyond 25 DAP. The secondary accumulation of grain RS was also observed in rice. Previous research on the dynamic accumulation patterns of three indica rice RS mutants from 5 to 30 days after flowering showed that the RS accumulation rate showed the greatest secondary increase in the rice mutant with the highest RS content [28].
We speculated that the secondary accumulation pattern of RS may have been due to the combination of starch with lipids, fatty acids, etc., to form RS5. In fact, previous research on rice grains showed that the RS content presented a highly significant correlation with the lipid content [46]. It is possible that many types of RS are synthesised in the early stages of seed development but that RS5 is the main type synthesised continuously in the later stage, explaining why the second peak value is lower than the first peak value. The secondary accumulation leads to an increase in the RS content in the middle and late stages of grain development, which contributes to the formation of high-RS grains. More research will be necessary to develop a hypothesis about secondary accumulation in high-RS grain genotypes.

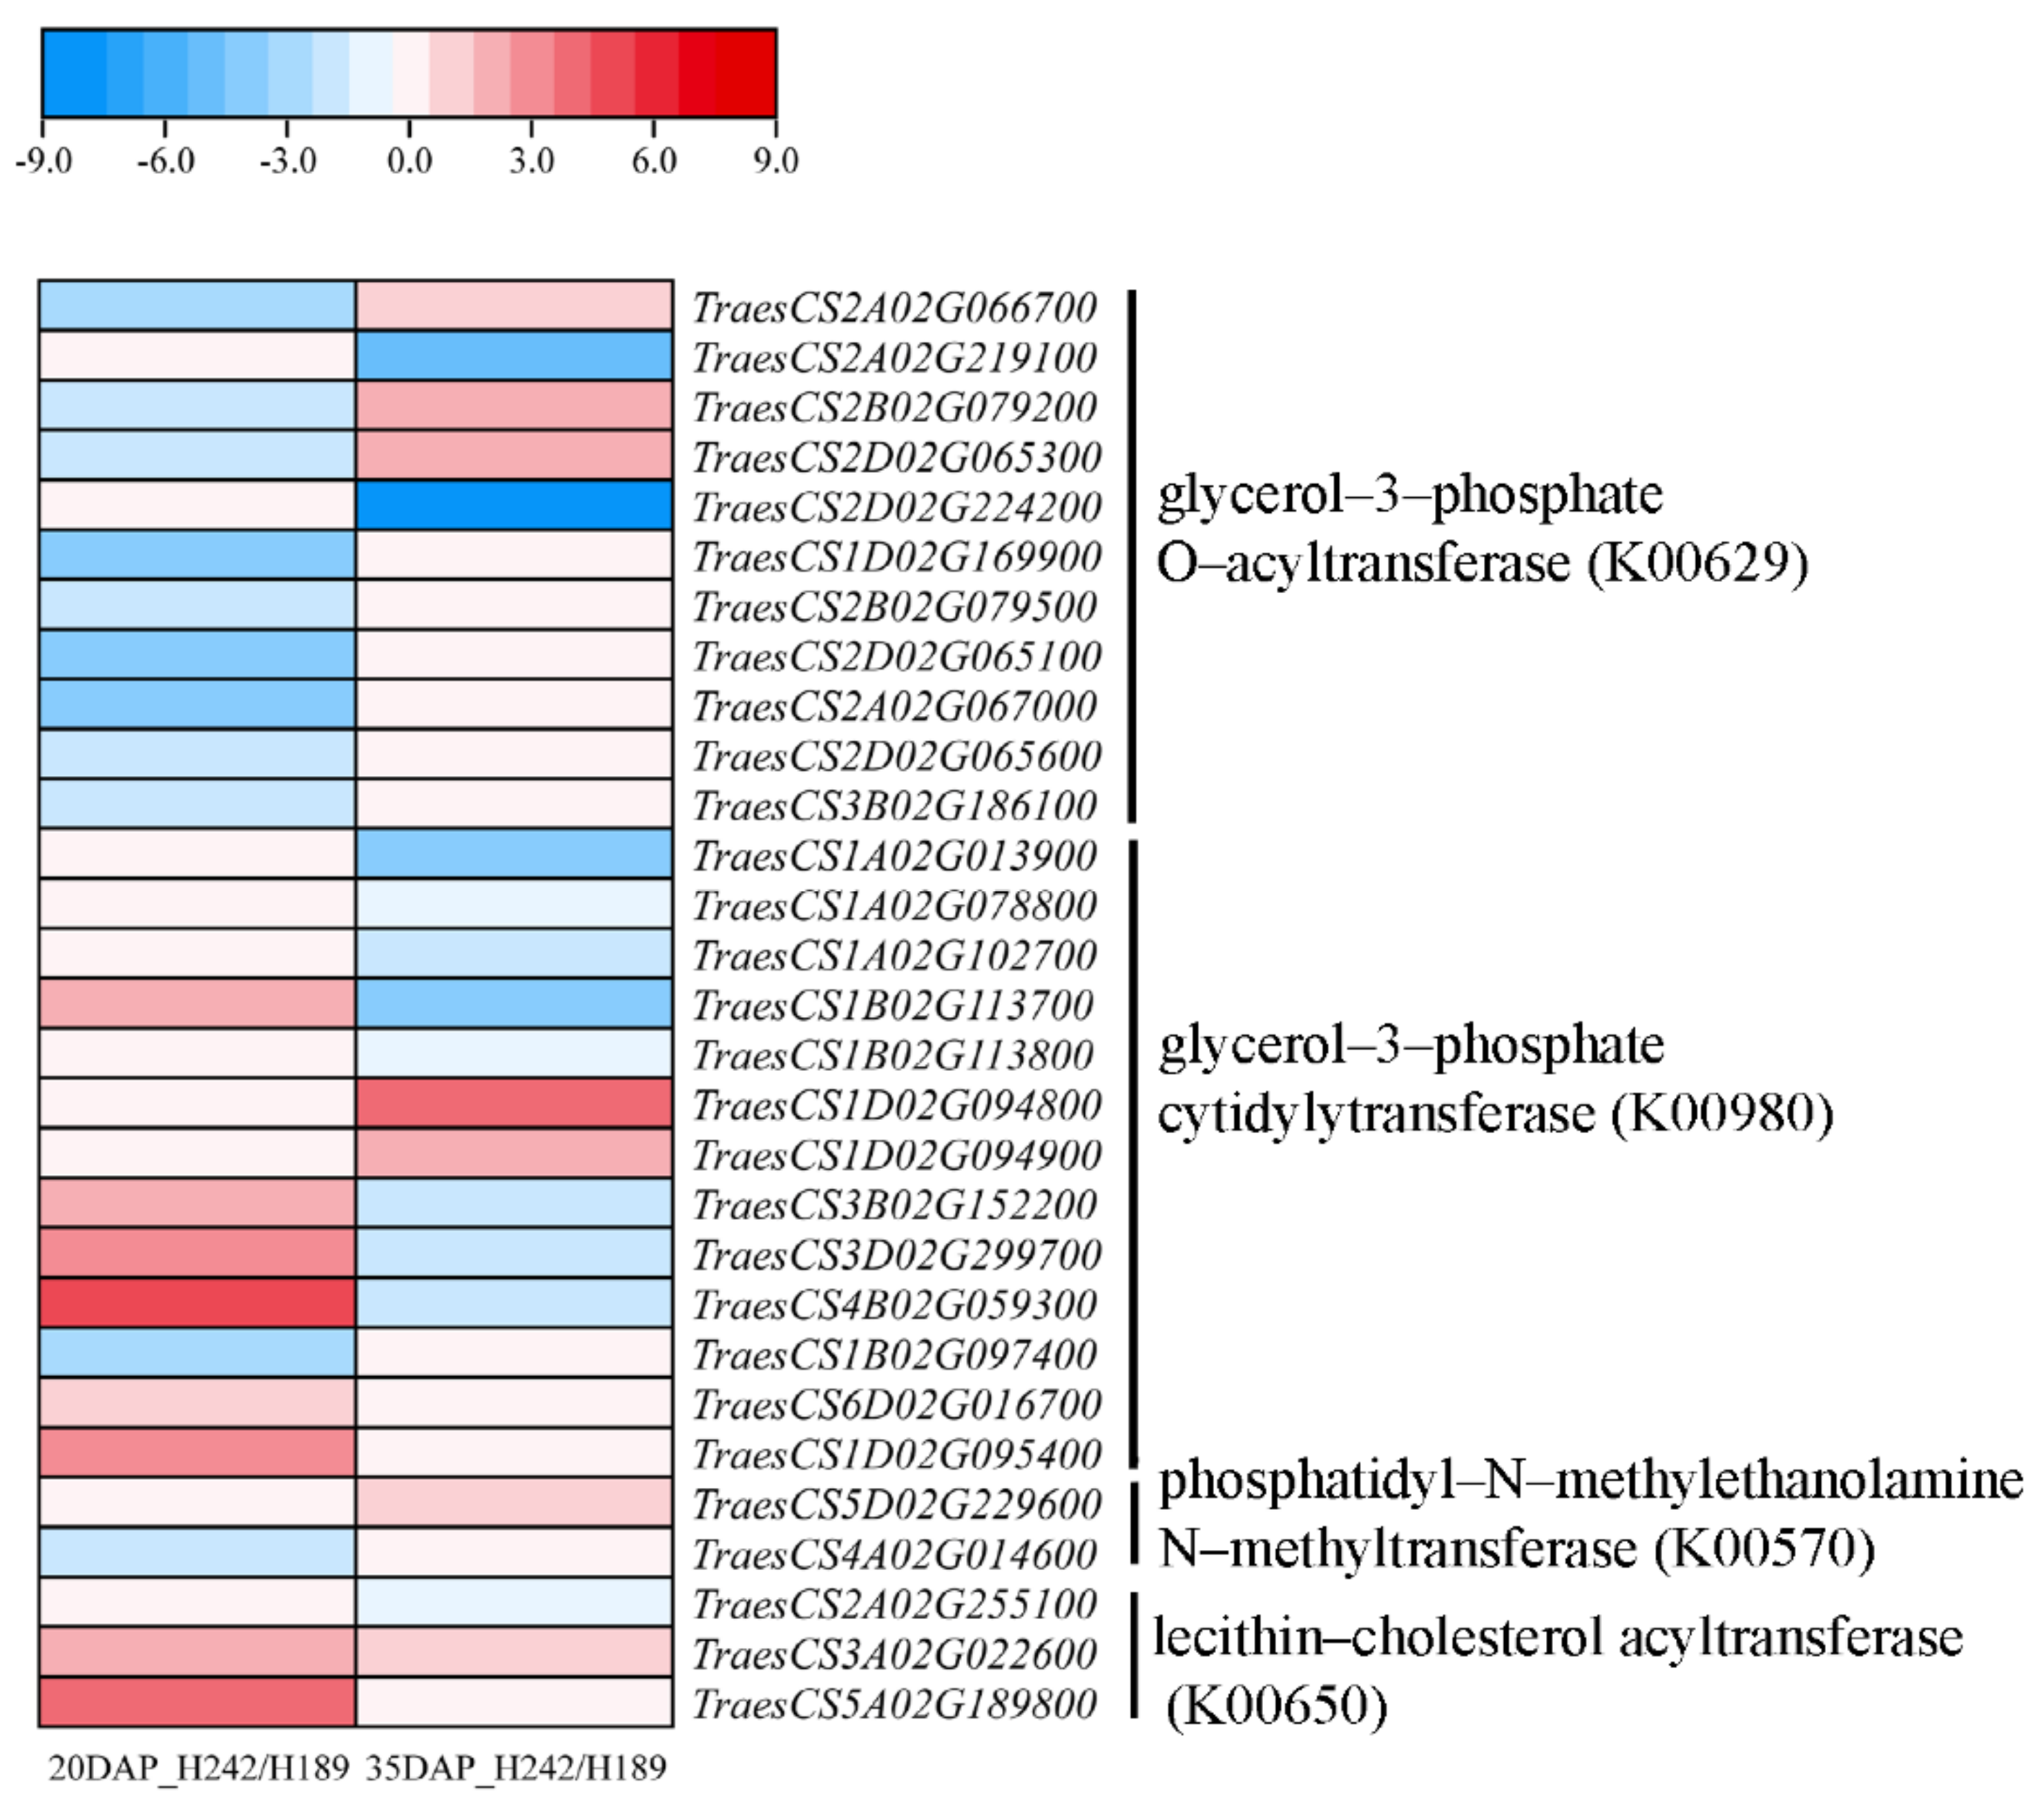
4.2. Lipid Pathways Play a Key Role in RS Formation in High-RS-Content Wheat

Plant lipids mainly include glycerides, glycerophosphatide and sterol lipids [47]. The hydrophilic hydroxyl groups of α-1,4 glucan helices are arranged on the outer surface, whereas methylene groups and the oxygens of the glucosidic bonds line the inner core, forming a hydrophobic cavity, and the lower hydrophilicity of longer lipid chains [48] results in their combination with starch [49]. The formation of starch–lipid complexes reduces swelling power and slows the rate of enzymatic digestion [50]. The amylose–lipid complex formed by the combination of lipids and amylose has been defined as RS 5 due to its resistance to enzymatic hydrolysis [7]; thus, lipid and RS contents are positively correlated [38]. Furthermore, experiments have verified that the RS content significantly increases after adding lipids to starch [10]. Research has shown that a amylose–lipid complex and an amylose–amylopectin network were formed in the unsaturated fatty acid–starch complexes samples, which restricted the penetration of enzymes into starch granules; thus, they exhibited the highest resistant starch content [51]. In the present study, TraesCS3A02G022600, confirmed to encode glycerol-3-phosphate 1-O-acyltransferase (GPAT), was found to be upregulated at 20 and 35 DAP. GPAT is a key enzyme in the biosynthesis of glycerolipids [52]. Different GPATs have been characterised in plants, among which plastidial GPAT is a soluble form [53]. A study of microalgae suggested that MiGPAT1 is involved in phospholipid formation, and the overexpression of GPAT in this alga leads to increased phospholipid levels [54]. Our research showed that this gene was upregulated to form free lipids, which then bound to starch, resulting in RS. This may have led to the secondary increase in the RS accumulation rate of H242. The functional verification of this gene will require further analysis.
The research about lipid synthesis has reported that MYB TFs contribute to lipid synthesis during grain filling [55]. HD-ZIP, a member of the homeobox superfamily of transcription factors, contains a leucine zipper after a homeodomain (HD) [56], and the leucine zipper structure has been demonstrated to initiate and be involved in lipid binding [57]. The MYB96 transcription factor regulates lipid contents during seed development [58]. The significant enrichment of MYB, homeobox and lipid metabolism pathways observed in the present study proved that the RS content can be increased in the high-RS cultivar by regulating lipid synthesis through multiple pathways. Interestingly, three genes encoding MYB TFs were upregulated only in H242 at 35 DAP. We speculated that the high expression of lipid- and MYB-related genes led to an increase in the lipid content, after which lipids combined with starch to form RS. Our results indicate that lipids play a crucial role in the synthesis of RS during the growth and development of wheat grains. Whether the trend of high RS accumulation is also present in other high-RS-content cultivars of wheat or other crops needs further confirmation. This important discovery provides useful insight into the context of research on high-RS crops, and we can study research lipid-related genes to better understand the mechanism whereby lipids participate in RS synthesis.

5. Conclusions

In the present study, we investigated the dynamic changes in RS contents, the transcriptome and gene coexpression networks to reveal the mechanism of RS synthesis. Our results reveal the secondary accumulation in wheat with a high RS content and show that upregulated lipid-related genes contributed to increasing the RS content beyond 25 DAP. This work provides insight into RS synthesis and has implications for future high-RS wheat cultivation.

Supplementary Materials

The following supporting information can be downloaded at: https://0-www-mdpi-com.brum.beds.ac.uk/article/10.3390/agriculture12020308/s1, Figure S1: The pathway of glycerophospholipid metabolism; Figure S2: Validation of candidate genes by qRT-PCR; Table S1: List of genes and their primer pairs used for RT-qPCR validation; Table S2: Genes in green module KEGG enriched pathways; Table S3: Fold change in lipid related genes expression (log2FC).

Author Contributions

Y.-H.X., W.H. and C.-H.J. conceived and designed the experiments. H.-P.W., H.-Y.C., X.W., J.-H.Z., G.L. and Y.-G.H. carried out the experiments; H.-P.W., W.H., B.L., L.X. and S.Z. analysed the data; H.-P.W., W.H. and Y.-H.X. wrote the manuscript; Y.-H.X., W.H. and C.-H.J. revised the manuscript. All authors have read and agreed to the published version of the manuscript.

Funding

This work was carried out with the financial support from the Third China National Survey and Collection Action on Crop Germplasm Resources, Hubei Outstanding Youth Fund (2021CFA064) and Hubei Key Research and Development Program (2021BBA225).

Data Availability Statement

The raw transcriptome sequencing data generated and used for analysis in this study are deposited in the NCBI Sequence Read Archive (SRA) database (Bioproject PRJNA782220) as per the NCBI submission guidelines.

Acknowledgments

This work was carried out with financial support from the Third China National Survey and Collection Action on Crop Germplasm Resources, Hubei Outstanding Youth Fund (2021CFA064) and Hubei Key Research and Development Program (2021BBA225).

Conflicts of Interest

The authors declare that have no conflict of interest.

References

  1. Englyst, K.; Goux, A.; Meynier, A.; Quigley, M.; Englyst, H.; Brack, O.; Vinoy, S. Inter-laboratory validation of the starch digestibility method for determination of rapidly digestible and slowly digestible starch. Food Chem. 2018, 245, 1183–1189. [Google Scholar] [CrossRef] [PubMed]
  2. Meenu, M.; Xu, B. A critical review on anti-diabetic and anti-obesity effects of dietary resistant starch. Crit. Rev. Food Sci. Nutr. 2019, 59, 3019–3031. [Google Scholar] [CrossRef] [PubMed]
  3. Koh, G.Y.; Rowling, M.J. Resistant starch as a novel dietary strategy to maintain kidney health in diabetes mellitus. Nutr. Rev. 2017, 75, 350–360. [Google Scholar] [CrossRef] [PubMed]
  4. McRae, M.P. Dietary Fiber Is Beneficial for the Prevention of Cardiovascular Disease: An Umbrella Review of Meta-analyses J. Chiropr. Med. 2017, 16, 289–299. [Google Scholar] [CrossRef]
  5. Wang, Q.; Wang, P.; Xiao, Z. Resistant starch prevents tumorigenesis of dimethylhydrazine-induced colon tumors via regulation of an ER stress-mediated mitochondrial apoptosis pathway. Int. J. Mol. Med. 2018, 41, 1887–1898. [Google Scholar] [CrossRef]
  6. Hansson, S.O.; Åman, P.; Becker, W.; Koning, D.-J.; Lagerkvist, C.J.; Larsson, I.; Lehrman, A.; Risérus, U.; Stymne, S. Breeding for public health: A strategy. Trends Food Sci. Technol. 2018, 80, 131–140. [Google Scholar] [CrossRef]
  7. Gutiérrez, T.J.; Tovar, J. Update of the concept of type 5 resistant starch (RS5): Self-assembled starch V-type complexes. Trends Food Sci. Technol. 2021, 109, 711–724. [Google Scholar] [CrossRef]
  8. Li, L.; Liu, Z.; Zhang, W.; Xue, B.; Luo, Z. Production and Applications of Amylose-Lipid Complexes as Resistant Starch: Recent Approaches. Starch-Stärke 2021, 73, 2000249. [Google Scholar] [CrossRef]
  9. Hasjim, J.; Ai, Y.; Jane, J.L. Novel applications of amylose-lipid complex as resistant starch type 5. Resist. Starch 2013, 79–94. [Google Scholar] [CrossRef]
  10. Okumus, B.N.; Tacer-Caba, Z.; Kahraman, K.; Nilufer-Erdil, D. Resistant starch type V formation in brown lentil (Lens culinaris Medikus) starch with different lipids/fatty acids. Food Chem. 2018, 240, 550–558. [Google Scholar] [CrossRef]
  11. Zhang, X.; Shen, Y.; Zhang, N.; Bao, J.; Wu, D.; Shu, X. The effects of internal endosperm lipids on starch properties: Evidence from rice mutant starches. J. Cereal Sci. 2019, 89, 102804. [Google Scholar] [CrossRef]
  12. Ye, J.; Hu, X.; Luo, S.; McClements, D.J.; Liang, L.; Liu, C. Effect of endogenous proteins and lipids on starch digestibility in rice flour. Food Res. Int. 2018, 106, 404–409. [Google Scholar] [CrossRef] [PubMed]
  13. Yi, X.; Li, C. Main controllers for improving the resistant starch content in cooked white rice. Food Hydrocoll. 2022, 122, 107083. [Google Scholar] [CrossRef]
  14. Zhou, H.; Wang, L.; Liu, G.; Meng, X.; Jing, Y.; Shu, X.; Kong, X.; Sun, J.; Yu, H.; Smith, S.M.; et al. Critical roles of soluble starch synthase SSIIIa and granule-bound starch synthase Waxy in synthesizing resistant starch in rice. Proc. Natl. Acad. Sci. USA 2016, 113, 12844–12849. [Google Scholar] [CrossRef] [Green Version]
  15. Miura, S.; Koyama, N.; Crofts, N.; Hosaka, Y.; Abe, M.; Fujita, N. Generation and starch characterization of non-transgenic BEI and BEIIb double mutant rice (Oryza sativa) with ultra-high level of resistant starch. Rice 2021, 14, 1–16. [Google Scholar] [CrossRef]
  16. Carciofi, M.; Blennow, A.; Jensen, S.L.; Shaik, S.S.; Henriksen, A.; Buléon, A.; Holm, P.B.; Hebelstrup, K.M. Concerted suppression of all starch branching enzyme genes in barley produces amylose-only starch granules. BMC Plant Biol. 2012, 12, 1–16. [Google Scholar] [CrossRef] [Green Version]
  17. Hazard, B.; Zhang, X.; Colasuonno, P.; Uauy, C.; Beckles, D.M.; Dubcovsky, J. Induced mutations in the starch branching enzyme II (SBEII) genes increase amylose and resistant starch content in durum wheat. Crop Sci. 2012, 52, 1754–1766. [Google Scholar] [CrossRef]
  18. Tabassum, J.; Ahmad, S.; Hussain, B.; Mawia, A.M.; Zeb, A.; Ju, L. Applications and potential of genome-editing systems in rice improvement: Current and future perspectives. Agronomy 2021, 11, 1359. [Google Scholar] [CrossRef]
  19. Ahuja, G.; Jaiswal, S.; Hucl, P.; Chibbar, R.N. Genome-specific granule-bound starch synthase I (GBSSI) influences starch biochemical and functional characteristics in near-isogenic wheat (Triticum aestivum L.) lines. J. Agric. Food Chem. 2013, 61, 12129–12138. [Google Scholar] [CrossRef]
  20. Biselli, C.; Volante, A.; Desiderio, F.; Tondelli, A.; Gianinetti, A.; Finocchiaro, F.; Taddei, F.; Gazza, L.; Sgrulletta, D.; Cattivelli, L.; et al. GWAS for starch-related parameters in japonica rice (Oryza sativa L.). Plants 2019, 8, 292. [Google Scholar] [CrossRef] [Green Version]
  21. Zeng, Y.; Sun, D.; Du, J.; Pu, X.Y.; Yang, S.M.; Yang, S.M.; Yang, T.; Yang, J.Z. Identification of QTLs for resistant starch and total alkaloid content in brown and polished rice. Genet. Mol. Res. 2016, 15, 15037268. [Google Scholar] [CrossRef] [PubMed]
  22. Bao, J.; Zhou, X.; Xu, F.; He, Q.; Park, Y.J. Genome-wide association study of the resistant starch content in rice grains. Starke 2017, 69, 1600343. [Google Scholar] [CrossRef]
  23. Johnson, N.; Boatwright, J.L.; Bridges, W.; Thavarajah, P.; Kumar, S.; Shipe, E.; Thavarajah, D. Genome-wide association mapping of lentil (Lens culinaris Medikus) prebiotic carbohydrates toward improved human health and crop stress tolerance. Sci. Rep. 2021, 11, 1–12. [Google Scholar] [CrossRef] [PubMed]
  24. Shu, X.; Backes, G.; Rasmussen, S.K. Genome-wide association study of resistant starch (RS) phenotypes in a barley variety collection. J. Agric. Food Chem. 2012, 60, 10302–10311. [Google Scholar] [CrossRef]
  25. Pang, H.; Wang, L.; Wang, H.L.; Xu, H.J.; Li, W.H. QTL mapping for kernel starch content in wheat. J. Triticeae Crops. 2014, 34, 1–7. [Google Scholar] [CrossRef]
  26. Mishra, A. Molecular and genetics basis of amylase resistant starch variation in bread wheat Triticum aestivum L. Doctoral Dissertation, Panjab University, Lahore, Pakistan, 2019. [Google Scholar]
  27. Shewry, P.R.; Mitchell, R.A.; Tosi, P.; Wan, Y.; Underwood, C.; Lovegrove, A.; Freeman, J.; Toole, G.A.; Mills, E.N.C.; Ward, J.L. An integrated study of grain development of wheat (cv. Hereward). J. Cereal. Sci. 2012, 56, 21–30. [Google Scholar] [CrossRef]
  28. Shu, X.; Sun, J.; Wu, D. Effects of grain development on formation of resistant starch in rice. Food Chem. 2014, 164, 89–97. [Google Scholar] [CrossRef]
  29. Yu, Y.; Zhu, D.; Ma, C.; Cao, C.; Wang, Y.; Xu, Y.; Zhang, W.; Yan, Y. Transcriptome analysis reveals key differentially expressed genes involved in wheat grain development. Crop J. 2016, 4, 92–106. [Google Scholar] [CrossRef] [Green Version]
  30. Gonzalez, D.H. Plant Transcription Factors: Evolutionary, Structural and Functional Aspects. Elsevier: Amsterdam, The Netherlands, 2016; pp. 3–11. [Google Scholar] [CrossRef]
  31. Feng, F.; Qi, W.; Lv, Y.; Yan, S.; Xu, L.; Yang, W.; Yuan, Y.; Chen, Y.; Zhao, H.; Song, R. OPAQUE11 is a central hub of the regulatory network for maize endosperm development and nutrient metabolism. Plant Cell 2018, 30, 375–396. [Google Scholar] [CrossRef] [Green Version]
  32. Song, Y.; Luo, G.; Shen, L.; Yu, K.; Yang, W.; Li, X.; Sun, J.; Zhan, K.; Cui, D.; Liu, D.; et al. TubZIP28, a novel bZIP family transcription factor from Triticum urartu, and TabZIP28, its homologue from Triticum aestivum, enhance starch synthesis in wheat. New Phytol. 2020, 226, 1384–1398. [Google Scholar] [CrossRef]
  33. Kooiker, M.; Drenth, J.; Glassop, D.; McIntyre, C.L.; Xue, G.P. TaMYB13-1, a R2R3 MYB transcription factor; regulates the fructan synthetic pathway and contributes to enhanced fructan accumulation in bread wheat. J. Exp. Bot. 2013, 64, 3681–3696. [Google Scholar] [CrossRef] [PubMed] [Green Version]
  34. Xiao, Q.; Wang, Y.; Du, J.; Li, H.; Wei, B.; Wang, Y.; Li, Y.; Li, Y.; Yu, G.; Liu, H.; et al. ZmMYB 14 is an important transcription factor involved in the regulation of the activity of the ZmBT1 promoter in starch biosynthesis in maize. FEBS J. 2017, 284, 3079–3099. [Google Scholar] [CrossRef] [PubMed] [Green Version]
  35. Parween, S.; Anonuevo, J.J.; Butardo, V.M., Jr.; Misra, G.; Anacleto, R.; Llorente, C.; Kosik, O.; Romero, M.V.; Bandonill, E.H.; Mendioro, M.S.; et al. Balancing the double-edged sword effect of increased resistant starch content and its impact on rice texture: Its genetics and molecular physiological mechanisms. Plant Biotechnol. J. 2020, 18, 1763–1777. [Google Scholar] [CrossRef] [PubMed] [Green Version]
  36. Hussain, B.; Akpınar, B.; Alaux, M.; Algharib, A.M.; Sehgal, D.; Ali, Z.; Appels, R.; Aradottir, G.I.; Batley, J.; Bellec, A.; et al. Wheat Genomics and Breeding: Bridging the Gap. AgriRxiv 2021. [Google Scholar] [CrossRef]
  37. Lal, M.K.; Kumar, A.; Raigond, P.; Dutt, S.; Changan, S.S.; Chourasia, K.N.; Tiwari, R.K.; Kumar, D.; Sharma, S.; Chakrabarti, S.K.; et al. Impact of Starch Storage Condition on Glycemic Index and Resistant Starch of Cooked Potato (Solanum tuberosum) Tubers. Starke 2021, 73, 1900281. [Google Scholar] [CrossRef]
  38. Xia, J.; Zhu, D.; Wang, R.; Cui, Y.; Yan, Y. Crop resistant starch and genetic improvement: A review of recent advances. Theor. Appl. Genet. 2018, 131, 2495–2511. [Google Scholar] [CrossRef]
  39. Chen, S.; Zhou, Y.; Chen, Y.; Gu, J. fastp: An ultra-fast all-in-one FASTQ preprocessor. Bioinformatics 2018, 34, i884–i890. [Google Scholar] [CrossRef]
  40. Appels, R.; Eversole, K.; Stein, N.; Feuillet, C.; Keller, B.; Rogers, J.; Pozniak, C.J.; Choulet, F.; Distelfeld, A.; Poland, J.; et al. Shifting the limits in wheat research and breeding using a fully annotated reference genome. Science 2018, 361, eaar7191. [Google Scholar] [CrossRef] [Green Version]
  41. Chen, C.; Chen, H.; Zhang, Y.; Thomas, H.R.; Frank, M.H.; He, Y.; Xia, R. TBtools: An Integrative Toolkit Developed for Interactive Analyses of Big Biological Data. Mol. Plant 2020, 13, 1194–1202. [Google Scholar] [CrossRef]
  42. Langfelder, P.; Horvath, S. WGCNA: An R package for weighted correlation network analysis. BMC Bioinform. 2008, 9, 1–13. [Google Scholar] [CrossRef] [Green Version]
  43. Saito, R.; Smoot, M.E.; Ono, K.; Ruscheinski, J.; Wang, P.-L.; Lotia, M.; Pico, A.R.; Bader, G.D.; Ideker, T. A travel guide to Cytoscape plugins. Nat. Methods 2012, 9, 1069–1076. [Google Scholar] [CrossRef] [PubMed] [Green Version]
  44. Schmittgen, T.D.; Livak, K.J. Analyzing real-time PCR data by the comparative CT method. Nat. Protoc. 2008, 3, 1101–1108. [Google Scholar] [CrossRef] [PubMed]
  45. Wang, Z.; Li, W.; Qi, J.; Shi, P.; Yin, Y. Starch accumulation; activities of key enzyme and gene expression in starch synthesis of wheat endosperm with different starch contents. J. Food Sci. Technol. 2014, 51, 419–429. [Google Scholar] [CrossRef] [PubMed] [Green Version]
  46. Shu, X.; Jia, L.; Ye, H.; Li, C.; Wu, D. Slow digestion properties of rice different in resistant starch. J. Agric. Food Chem. 2009, 57, 7552–7559. [Google Scholar] [CrossRef]
  47. Fahy, E.; Cotter, D.; Sud, M.; Subramaniam, S. Lipid classification; structures and tools. Biochim. Biophys. Acta Mol. Cell Biol. Lipids 2011, 1811, 637–647. [Google Scholar] [CrossRef] [Green Version]
  48. Wang, S.; Chao, C.; Cai, J.; Niu, B.; Copeland, L.; Wang, S. Starch–lipid and starch–lipid–protein complexes: A comprehensive review. Compr. Rev. Food Sci. Food Saf. 2020, 19, 1056–1079. [Google Scholar] [CrossRef] [Green Version]
  49. Putseys, J.; Lamberts, L.; Delcour, J. Amylose-inclusion complexes: Formation; identity and physico-chemical properties. J. Cereal. Sci. 2010, 51, 238–247. [Google Scholar] [CrossRef]
  50. Wang, S.; Copeland, L. Molecular disassembly of starch granules during gelatinization and its effect on starch digestibility: A review. Food Funct. 2013, 4, 1564–1580. [Google Scholar] [CrossRef]
  51. Cai, C.; Tian, Y.; Sun, C.; Jin, Z. Resistant structure of extruded starch: Effects of fatty acids with different chain lengths and degree of unsaturation. Food Chem. 2022, 374, 131510. [Google Scholar] [CrossRef]
  52. Wang, J.; Singh, S.K.; Geng, S.; Zhang, S.; Yuan, L. Genome-wide analysis of glycerol-3-phosphate O-acyltransferase gene family and functional characterization of two cutin group GPATs in Brassica napus. Planta 2020, 251, 1–16. [Google Scholar] [CrossRef]
  53. Waschburger, E.; Kulcheski, F.R.; Veto, N.M.; Margis, R.; Margis-Pinheiro, M.; Turchetto-Zolet, A.C. Genome-wide analysis of the Glycerol-3-Phosphate Acyltransferase (GPAT) gene family reveals the evolution and diversification of plant GPATs. Genet. Mol. Biol. 2018, 41, 355–370. [Google Scholar] [CrossRef] [PubMed]
  54. Sun, L.P.; Ouyang, L.L.; Bao, H.; Liu, J.-G.; Sun, Z.; Zhou, Z.-G. Comparison between two isoforms of glycerol-3-phosphate acyltransferase in microalga Myrmecia incisa: Subcellular localization and role in triacylglycerol synthesis. Algal Res. 2021, 54, 102172. [Google Scholar] [CrossRef]
  55. Chandrasekaran, U.; Xu, W.; Liu, A. Transcriptome profiling identifies ABA mediated regulatory changes towards storage filling in developing seeds of castor bean (Ricinus communis L.). Cell Biosci. 2014, 4, 1–12. [Google Scholar] [CrossRef] [PubMed] [Green Version]
  56. Ariel, F.D.; Manavella, P.A.; Dezar, C.A.; Chan, R.L. The true story of the HD-Zip family. Trends Plant Sci. 2007, 12, 419–426. [Google Scholar] [CrossRef]
  57. Schrick, K.; Nguyen, D.; Karlowski, W.M.; Mayer, K.F. START lipid/sterol-binding domains are amplified in plants and are predominantly associated with homeodomain transcription factors. Genome Biol. 2004, 5, 1–16. [Google Scholar] [CrossRef] [Green Version]
  58. Kim, H.U. Lipid metabolism in plants. Plants 2020, 9, 871. [Google Scholar] [CrossRef]
Figure 1. Dynamic changes in the resistant starch content, total starch content and thousand-seed weight during wheat grain filling. All data are the means ± SD of three biological replicates. (a) Dynamic changes in the resistant starch content per seed during wheat grain filling. (b) Dynamic changes in the total starch content per seed during wheat grain filling. (c) Dynamic changes in the thousand-grain weight during wheat grain filling.
Agriculture 12 00308 g001
Figure 2. Gene expression profiling at 20 and 35 DAP. (a) Differentially expressed genes (DEGs) at 20 and 35 DAP. (b) GO functional classification of the DEGs at 20 and 35 DAP regarding biological processes, cellular components and molecular functions. (c) Enriched KEGG pathways of DEGs at 20 and 35 DAP.
Agriculture 12 00308 g002
Figure 3. Identification of coexpression network modules related to wheat grain RS content. (a) Correlation analysis between modules and RS content traits by WGCNA. The colour of each grid indicates the correlation between the module and RS data: red represents a positive correlation, blue represents a negative correlation, and the number in each grid represents the correlation coefficient and the p value. (b) Gene network of the green module, which is positively correlated with RS contents (r2 = 0.96). Redder colour of circles indicates higher degrees of connectivity in each module. (c) Classification and number of transcription factors (TFs). (d) Heatmap of DEGs encoding members of MYB family. Grey means no differential expression.
Agriculture 12 00308 g003
Figure 4. Heatmap of DEGs involved in lipid metabolism.
Agriculture 12 00308 g004
Table 1. Accumulation rates of the thousand-kernel weight, total starch and resistant starch. All data are the means ± SD of three biological replicates.
Days after PollinationTGW Accumulation RateTS Accumulation RateRS Accumulation Rate
(g day−1)(mg seed−1 day−1)(μg seed−1 day−1)
H189H242H189H242H189H242
0–50.642 a ± 0.0050.631 a ± 0.0070.039 a ± 0.0020.036 a ± 0.0022.3 a ± 0.32.2 a ± 0.3
5–101.390 a ± 0.0091.385 a ± 0.0210.263 a ± 0.0100.256 a ± 0.0089.3 a ± 0.46.0 b ± 0.3
10–151.302 a ± 0.0221.057 b ± 0.0090.598 a ± 0.0210.606 a ± 0.00913.0 b ± 0.428.4 a ± 3.8
15–202.047 b ± 0.0272.171 a ± 0.0231.277 a ± 0.0251.390 a ± 0.0405.0 b ± 0.269.0 a ± 5.3
20–251.132 b ± 0.0081.405 a ± 0.0031.740 a ± 0.0561.844 a ± 0.0594.7 a ± 0.45.5 a ± 0.4
25–300.728 b ± 0.0111.150 a ± 0.0070.830 b ± 0.0131.057 a ± 0.0140.1 b ± 0.047.7 a ± 1.1
30–350.819 a ± 0.0160.772 a ± 0.0330.680 b ± 0.0150.862 a ± 0.0340.1 b ± 0.044.9 a ± 3.1
35–400.199 a ± 0.0070.216 a ± 0.0030.354 b ± 0.0090.425 a ± 0.0090.1 b ± 0.026.7 a ± 2.4
Note: In the same row, values with the same letters show nonsignificant differences, and values with different letters show significant differences (p < 0.05) according to the SNK test.
Publisher’s Note: MDPI stays neutral with regard to jurisdictional claims in published maps and institutional affiliations.

