
The Impact of Agricultural Ecological Capital Investment on the Development of Green Circular Economy


School of Economics and Statistics, Guangzhou University, Guangzhou 510006, China
*
Author to whom correspondence should be addressed.
Agriculture 2022, 12(4), 461; https://0-doi-org.brum.beds.ac.uk/10.3390/agriculture12040461
Submission received: 24 February 2022
/
Revised: 23 March 2022
/
Accepted: 23 March 2022
/
Published: 25 March 2022
(This article belongs to the Special Issue Optimization of Resource Use for Productivity, Efficiency, and Sustainability in Agriculture)
Abstract
:Agricultural ecological capital investment aims to achieve the coordinated and sustainable development of agricultural and rural ecology, economy, and society through a series of inputs to a specific range of agricultural ecological resources, ecological environment, and ecological service capacity. Based on the macro data of 31 provinces (including autonomous regions and municipalities) in China, this paper uses coupling coordination and linear regression models to study the impact of agricultural ecological capital investment on green circular economy development. At the same time, considering the differences between active and passive investment, their impacts on green circular economy development are discussed, respectively. The empirical conclusions are as follows. First, agricultural ecological capital investment plays a significant role in promoting the development of the green circular economy on the whole, but the roles of active investment and passive investment are different. Second, agricultural ecological capital investment positively impacts the development of the green circular economy by increasing green inventions and promoting green credit index. Third, the impacts mechanisms of active and passive investment have on green circular economy are different. Fourth, the impact of agricultural ecological capital investment on the green circular economy is regionally heterogeneous.
1. Introduction
Agricultural ecological capital investment aims to achieve the coordinated and sustainable development of agricultural and rural ecology, economy, and society through a series of inputs to a specific range of agricultural ecological resources, the ecological environment, and ecological service capacity. Agriculture is an industry that meets the basic food needs of human beings. It is not only profoundly influenced by consumers’ choices and production mode but also has an impact on socio-economic development and the ecological environment. Traditional economic development is usually at the expense of natural resources and the ecological environment, and urban pollution is constantly transferred to rural areas, seriously restricting the ecological, economic, and social green and sustainable development of agriculture [1,2]. Agriculture in China has surpassed industry as the largest non-point source of pollution, and to solve this problem, the country has begun to invest capital in agricultural ecology. Agricultural ecological capital investment takes the security of agricultural ecological resources, the security of the agricultural ecological environment, and the sustainable development of the agricultural ecosystem as the fundamental objectives. Through activities like enhancing the technical levels of agricultural ecology, agricultural ecological infrastructure, agricultural natural disaster prevention, agricultural and rural pollution control, agricultural ecological capital investment increases the agricultural ecological capital stock, promotes agricultural and rural economic development, and finally promotes the development of the green and circular economy. Therefore, it is necessary to study the relationship between agricultural ecological capital investment and green circular economy and observe whether it can achieve the ideal effect.
With the concept of ecological restoration and sustainable development becoming more and more popular, there are many scholars who study sustainable agriculture globally and contribute a lot. Łuczka, Kalinowski, and Shmygol [3] suggests that a sustainable agriculture has many functions to fulfill: economic functions (ensuring acceptable incomes to agricultural producers), social functions (ensuring employment, quality of lving, landscape values) and environmental functions (preserving biodiversity, ensuring high quality of soil, air, and water). Goszczyński et al. [4] define sustainable food systems by distinguishing three types of Polish alternative food networks. Wojciechowska-Solis and Barska [5] suggest consumer-oriented sustainable food from the perspective of consumers who are considerate about environment. These papers show the tendency of popularizing green agricultural production, and attach importance to the functions and benefits for consumers, society and environment. They paved the way for the concept of agricultural capital investment.
Investment is needed to help put a sustainable agriculture system into effect, and a large number of scholars have carried out research on ecological capital [6]. People are concerned with both expanding capital accumulation and sustainability [7,8]. Ecological capital investment mainly focuses on natural resources such as land, fisheries, and the ocean. Ogilvy [9] proposed an ecological balance sheet to assess changes in ecological capital assets and their impact on the inflow and outflow of economic benefit. Guo, et al. [10] studied how to realize the strong decoupling relationship between land natural capital and economy. Schaap and Richter [11] studied the effect of technical efficiency as an endogenous variable in bio-economic systems by establishing a fishery capital investment model. Lu, et al. [12] believe that more money and high technology should be invested in improving Marine pollution control to reduce its negative impact on coastal areas and assess the potential socio-economic impact. Zhan, et al. [13] focused on the ecological interdependence and economic benefits among different regions and believed that an ecological compensation mechanism should be established to support the transformation of the economic growth mode. In addition to economic benefits, the government can strongly support the agricultural sector by implementing ecological compensation policies to promote the adoption of environmentally friendly technologies by farmers [14,15]. Łuczka and Kalinowski [16] find that organic farming can contribute significantly to sustainable development. Government subsidies, higher sales prices and higher earnings can increase farmers’ willingness to introduce organic farming. In many low- and middle-income countries, ecological infrastructure interventions are seen as critical strategies for simultaneously alleviating poverty and improving ecosystem functioning [17,18]. Angelstam, et al. [19] suggest a series of locally-oriented actions to help unlock investment in functional ecological infrastructure by prioritizing conservation, management, and restoration through integrated cross-scale, collaborative, and multi-sectoral spatial planning. Social capital and the sense of regional belonging positively impact farmers’ ecological protection behaviors [20].
A green circular economy is a goal that countries all over the world have striven to achieve in recent years. The concept of green circular economy is inclusive, and much literature has discussed how to build a green circular economy from different angles. Kirchherr, Reike, and Hekkert [21] collected 114 definitions of circular economy and assigned them to 17 dimensions. They found that circular economy is most often described as a combination of reducing, reusing, and recycling activities, but these definitions do not show a clear link between the concept of circular economy and sustainable development. The main goal of circular economy is considered to be economic prosperity, followed by environmental quality, while its impact on social equity and future generations is rarely mentioned. Promoting the consistency of the concept of circular economy is the research goal of Kirchherr, Reike, and Hekkert [21], while Sandoval, Jaca, and Ormazabal [22] try to put forward a consensus view on the basic concept of the circular economy framework and emphasize the relationship between the circular economy framework and ecological innovation. They also put forward some remarkable cases of developing ecological innovation for the implementation of circular economy. Grafstrom and Aasma [23] investigate how the four obstacles of technology, market, system, and culture hinder the circular economy implementation from the perspective of theoretical economics. They believe that although the circular economy is different from the traditional “linear” economy, there is no evidence that the circular economy will not follow the same law of the traditional economy, that is, the circular economy is still guided by property rights, the rule of law and price signals. Hartley, Santen, and Kirchherr [24] discussed their expectations of circular economy policies, including more robust standards and norms in production, expansion of circular procurement, tax reduction for circular products, waste trade liberalization, and facilitation through virtual platforms for eco-industrial parks, and awareness campaigns.
The above literature not only provides a rich research basis but also leaves enough research space for this study. The study at hand focuses on agricultural ecological capital investment and divides it into active investment and passive investment. The existing research has no clear definition and unified measurement method for ecological capital investment. Although the measurement methods are different, they all focus on ecological infrastructure construction and pollution control. Agriculture is an industry that meets human basic food needs, and its pollution problem has been severe, so it is necessary to focus on the benefits of agricultural ecological capital investment. First, in this paper, agricultural construction is regarded as an active ecological capital investment (equivalent to ex-ante treatment) [25], and agricultural pollution control is regarded as a passive capital investment (equivalent to ex-post treatment), thus constructing the framework of agricultural ecological capital investment. Second, this paper evaluates the impact of agricultural ecological capital investment on the development of green circular economy. Existing literature mainly studies whether ecological capital investment can solve the problem of sustainable development while maintaining the growth of capital stock, but the relationship between circular economy and sustainable development is not clear. Referring to the previous literature, this paper constructs a green circular economy development index system of 31 provinces (autonomous regions and municipalities) in China from the perspectives of low-carbon development, green development, circular development, and economic development to evaluate the impact of agricultural ecological capital investment on the development of green circular economy. Third, this paper further studies the mechanism and heterogeneity of the impact of agricultural ecological capital investment on the development of green circular economy. Agricultural ecological capital investment includes agricultural construction and pollution control, and one of its objectives is to innovate technology for green innovation [26,27]. Meanwhile, previous literature has proved that circular economy is strongly correlated with ecological innovation. Therefore, this paper incorporates the green invention indicator into the econometric model and studies the mediating effect of green innovation. Banking system stability plays a role in the economic sustainability developing economies [28]. Green credit, known as sustainable financing or environmental financing, is a major force for constructing a green circular economy [29,30]. One of the essential prerequisites for green credit approval is to comply with environmental testing standards, pollution control effects, and ecological protection, turning post pollution control into ex-ante treatment [31]. Therefore, this paper also brings green credit into the impact mechanism system to study its role in the impact of agricultural ecological capital on the development of a green circular economy. In addition, this paper distinguishes regions by the proportion of the primary industry in local GDP. The ecological capital investment studied in this paper is the investment in the primary industry; however, the green circular economy development level is restricted to primary industries, so the relationship between the two is heterogeneous in regions with different proportions of primary industry. At the same time, as mentioned earlier, the total agricultural ecological capital investment is divided into active investment and passive investment, and the mediating indicators selected in this paper include both ex-ante treatment and ex-post treatment, so the initiative of investment makes its influence mechanism also heterogeneous. Based on this, this paper investigates the heterogeneity of the impact of agricultural ecological capital investment on the development level of green circular economy from two aspects of region and investment initiative.
The rest of this paper is arranged as follows. The Section 2 is Meterials and Methods, which describes the fundamental hypotheses, model setting, data, and measurement of core variables. The Section 3 is the Results, focusing on the impact of agricultural ecological capital investment on the development of green circular economy through the coupling coordination model and the OLS method, and the methods of winsorization, changing variables, and adopting the models to test their robustness, and this section also conducts further research on the impact mechanism and heterogeneity of agricultural ecological capital on the development of green circular economy. The Section 4 discusses the results obtained and compares these with other research. The Section 5 draws the conclusion.
2. Meterials and Methods
2.1. Research Hypotheses
Agricultural ecological capital investment influences the development of green circular economy through a series of physical or monetary inputs to a specific range of agricultural ecological resources, ecological environment, and ecological service capacity. Ecological capital has two attributes: one is the natural attribute of ecological resources and ecological environment, which has ecological function and follows ecological law, and it is manifested as the usage value of ecological capital; second, it has the general attribute of capital, aiming at preserving and increasing value and following the law of market supply and demand and competition and showing the value of ecological capital [32]. Agricultural ecological capital investment is the application of ecological capital investment in agriculture. Although there are many definitions of green circular economy, they all emphasize environmental quality and economic prosperity. The former is the goal proposed by ecological capital theory, while the latter is the goal of capital investment. Therefore, this paper holds that ecological capital investment has an important impact on the development of green circular economy. Agriculture depends on natural resources such as land, water, and forest, and agricultural ecological capital investment is an essential branch of ecological capital investment. Thus, this paper puts forward the following hypothesis:
Hypothesis 1 (H1).
Agricultural ecological capital investment has a positive impact on the development of green circular economy.
Agricultural ecological capital investment can achieve coordinated and sustainable development of agricultural and rural ecology, economy, and society by improving the agricultural ecological technology level, agricultural ecological infrastructure construction, agricultural natural disaster prevention and control, and agricultural and rural pollution control. On the one hand, the development of ecological technology and the construction of infrastructure usually need the support of green inventions. Agricultural ecological capital investment can realize the sustainability strategy by increasing the number of green inventions. On the other hand, the ownership of natural resources and environment in China belongs to the state or collectives, so agricultural ecological investment is dominated by the government, supplemented by the participation of enterprises, social groups, and individuals. Green credit from banking institutions is an important policy-oriented measure [33], which helps enterprises and social groups that meet environmental testing standards, pollution control effects, and ecological protection to contribute to ecological governance. Theoretically, agricultural ecological capital investment can improve the development level of green circular economy by increasing the green credit index. Based on the above two aspects, this paper proposes the following hypothesis:
Hypothesis 2 (H2).
The number of green inventions and the green credit index have mediating effects on the impact of agricultural ecological capital investment on the development of green circular economy.
Different regions have different resource advantages and pollution conditions, so the impact of agricultural ecological capital investment on the green circular economy development is regionally heterogeneous. On the one hand, the ecological environment and economic development vary according to the regions. On the other hand, this paper divides agricultural ecological capital investment into active investment and passive investment. Active investment is the investment in agricultural construction, which is the ex-ante governance, while passive investment is the investment in agricultural pollution control, which is the post-ante treatment. Based on Hypothesis 2, this paper chooses the number of green inventions and the green credit index as the mediating variables. Green inventions include technological innovation in both construction and pollution, and the advantage of green credit lies in ex-ante governance, so they play different roles in the impact of active and passive investment on the development of a green circular economy, that is, the influence mechanism of active and passive investment is heterogeneous. Based on this, the following hypothesis is proposed:
Hypothesis 3 (H3).
The heterogeneity of the impact of agricultural ecological capital investment on the development of green circular economy is reflected in two aspects: the region and the influence mechanism of active and passive investment.
2.2. Data and Model Specification
2.2.1. Data
This paper selects 31 provinces (including autonomous regions and municipalities) in China as the research object. Considering the time when China’s ecological capital investment and green circular economy have intensified, and the availability of data, this paper selects the data period from 2015 to 2019, finally obtaining 155 samples. All data in this paper are published by the National Bureau of Statistics, the People’s Bank of China, statistical yearbooks of various provinces, Choice financial terminal, Chinese Research Data Services Platform (CNRDS), and the China Insurance Yearbook. Since the data units of each index differ greatly, this paper adopts the Z-Score method to standardize all data by SPSS.
2.2.2. Coupling Coordination Degree
Before studying the impact of agricultural ecological capital investment on the development of green circular economy, this paper first examines the coupling coordination relationship between agricultural ecological capital investment and the development of green circular economy to initially observe whether the agricultural ecological capital of the province can support its green circular economy development. The coupling degree refers to the interaction between two or more systems, which can realize the dynamic relation of coordinated development and reflect the degree of mutual dependence and restriction between systems. The coordination degree refers to the degree of good coupling in the coupling interaction relationship, which can reflect the coordination status. This model has been applied to explore the forecasting of financial development, technological innovation, and economic growth [34], sustainable development pattern of geo-ecological environment and urbanization [35], and other research to analyze the coordination development level of objects. In this paper, the coordination degree model of agricultural ecological capital investment and green circular economy development is set as follows:
In Equation (1), D represents the coupling coordination degree, and the value is between 0 and 1. The larger the value, the better the coupling coordination degree between agricultural ecological capital and green circular economy development. C is the coupling degree of agricultural ecological capital investment and green circular economy development, and L is the comprehensive coordination index of agricultural ecological capital investment and green circular economy development. The formula of C is:
In Equation (2), u represents the level of agricultural ecological capital investment; grepresents the development level of green circular economy, and r is the mediation coefficient, which is set as 2. The formula of L is:
In Equation (3), α and β are weight coefficients. In this paper, agricultural ecological capital investment and green circular economy development are regarded as equally important, so α = β = 0.5.
2.2.3. Regression Model
This research aims to explore the causal relationship between agricultural ecological capital investment and green circular economy development. Firstly, the general impact of agricultural ecological capital investment on green circular economy development is discussed. In this paper, the green circular economy development level is taken as the explained variable, and the agricultural ecological capital investment is taken as the explanatory variable. The OLS method is used for regression analysis, and the empirical model is constructed as follows:
In Equation (4), stands for the development level of green circular economy in province i in year t; represents the agricultural ecological capital investment in province i in year t; is the control variable matrix, and the specific variables will be explained in Section 2.3.3; is the random error term. The size and significance of are specifically focused on.
Then by dividing agricultural ecological capital investment into active investment and passive investment, this paper explores the influence of the two on the development level of green circular economy, and they are respectively taken as the influencing factors for regression. At the same time, considering that there may be endogeneity between passive investment and the explained variable, this paper adds the first-order lag term of passive investment for investigation [36], and the model is built as follows:
In Equation (5), represents the active investment of agricultural ecological capital of province i in year t; represents the passive investment of agricultural ecological capital of province i in year t−1. The meanings of other variables are the same as those in Equation (4). The sizes and the significance of are paid particular attention.
2.3. Variables
2.3.1. Measurement of the Explained Variables
This paper refers to Liang [37] and constructs a green circular economy development indicator system as the explained variable, which is composed of four parts: low-carbon development, green development, circular development, and economic development. There are 17 indicators in the third level of the indicator system. Using the dual incentive dynamic comprehensive measurement model and the minimum variance method, the development level of green circular economy in 31 provinces (excluding Hong Kong, Macao, and Taiwan) in China from 2015 to 2019 is calculated. The specific indicators and weights are shown in Table 1.
2.3.2. Measurement of the Explanatory Variables
Existing research rarely involves the selection of agricultural ecological capital investment indicators. This paper builds an indicator system based on the research objectives. In this paper, investment in agricultural construction is regarded as active investment, which is the sum of five items: investment in environmental protection, expenditure of land, resources, and meteorology departments, expenditure in agriculture, forestry, and water, investment in geological disaster prevention, and investment in rural fixed assets. Agricultural pollution control is regarded as passive investment in this paper. Although the country invests in agricultural pollution control, it is not reflected separately in the statistical data. As the existing research indicates that China is still in the stage of dual growth of economy and environmental pollution, this paper, based on the environmental Kuznets curve, uses the product of the ratio of primary industry in GDP and total pollution control investment to represent agricultural pollution control. The indicator system of agricultural ecological capital investment is shown in Table 2.
2.3.3. Control Variables and Other Variables
Considering many factors that will affect the development level of green circular economy, this paper refers to previous literature and selects the following control variables:
(1) Forest area (FA). Forests are an important natural resource, known as the “lungs of the earth”, which can reduce environmental pollution and have extremely high social value and natural value, so the forested area in a region has a certain impact on its green development [38]. (2) Urban population density (UPD) This indicator reflects the density of the local population, which has an impact on the productivity and resource consumption of the region [39]. (3) Crops fertilizer usage (CF). On the one hand, fertilizer use has a negative impact on the environment, but on the other hand, it has a positive impact on output and economy to a certain extent [40]. (4) Crops sown area (CSA). This indicator reflects agricultural economic development to a certain extent since it shows the basic element of agricultural production input from the aspect of land input [41]. (5) Electric energy production (EEP). This indicator reflects the impact on the development of green circular economy from the aspect of energy output. (6) Electricity consumption (EC). This indicator reflects the impact of energy consumption on the development of green circular economy [42]. (7) Rural electricity consumption (REC). This indicator focuses on rural electricity consumption and reflects the impact of agricultural technological progress and energy consumption on the development of green circular economy [43].
In addition, in order to further study the impact mechanism of agricultural ecological capital investment on the development of green circular economy, this paper selects two indicators: the number of green inventions (GIN) and the green credit index (GDI).
(1) Number of green inventions. Obtained by adding up the number of green inventions obtained in 31 provinces and municipalities in the same year, and can reflect the level of local green technology innovation. (2) Green credit index. It is expressed by 1—interest expense of six high energy-consuming industries/total industrial interest expense, and it can reflect the contribution of local financial institutions to the ex-ante governance of environmental pollution affected by green policies. Since there is no relevant data on Tibet, the research on the situation of Tibet will be temporarily removed when investigating the impact path.
2.3.4. Descriptive Statistics
This subsection provides descriptive statistics for all variables. For each variable, the original data and the statistical results after standardized processing (with Z- in front of the variable name) are given, respectively, as shown in Table 3.
From Table 3, we can find that the units of the original data are quite different. Standardization is conducive to the comparison and discovery of laws without changing the meaning of the original data.
3. Results
3.1. Coupling Coordination Analysis
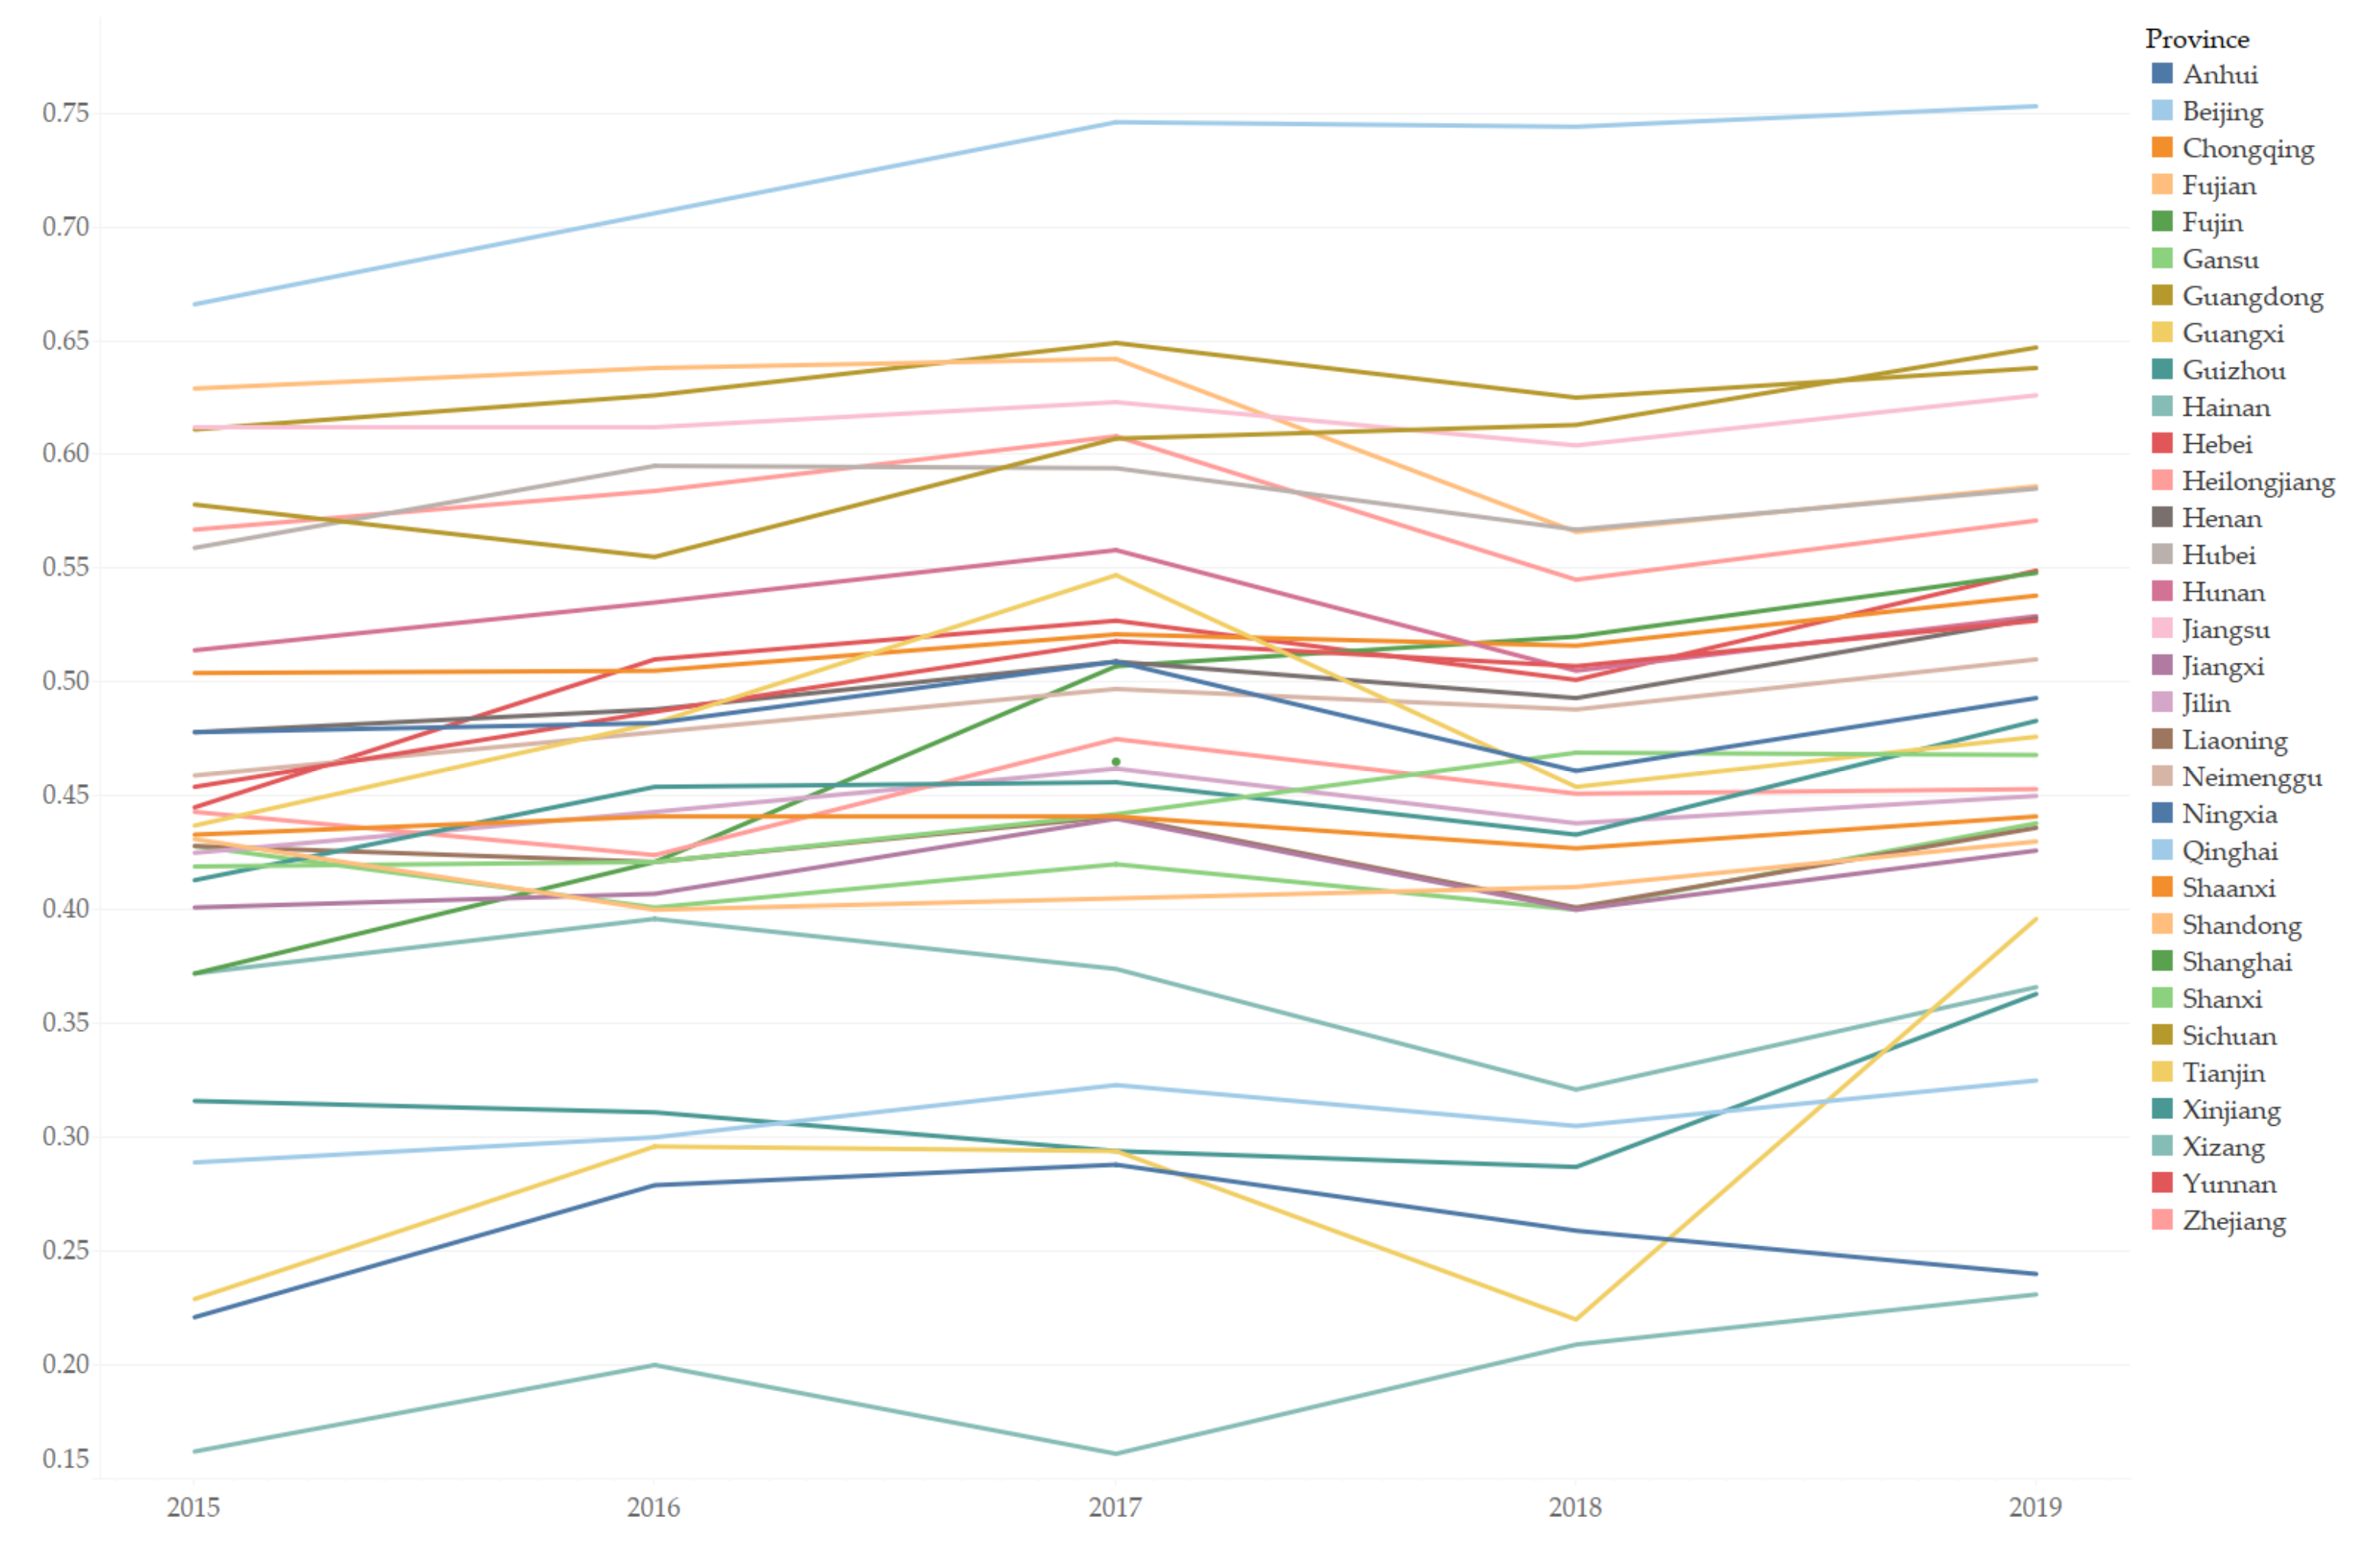
Firstly, the arithmetic average values of agricultural ecological capital investment and green circular economy development in each province from 2015 to 2017 are calculated, and then the ranges are normalized. Secondly, the coupling coordination model, namely Equations (1)–(3), is used to calculate the coupling coordination degree between provincial agricultural ecological capital investment and green circular economy development in China, and the results are shown in Figure 1.
Figure 1 from left to right shows the coupling coordination degree of each province from 2015 to 2019. It can be roughly seen that the overall coupling coordination degrees of Anhui, Beijing, Gansu, Guangdong, Guizhou, Hainan, Hebei, Heilongjiang, Jilin, Liaoning, Inner Mongolia, Qinghai, Shaanxi, Shanghai, and Yunnan have improved in these five years. In contrast, the coupling coordination degrees of the remaining provinces haven’t changed significantly or decreased slightly during the five years. It indicates that the agricultural ecological capital investment in most regions has been increasing support for the development of local green circular economy year by year, which proves that the former has a positive impact on the latter.
3.2. Regression Analysis
After preliminary observation of the relationship between agricultural capital investment and green circular economy development in Section 3.1, in order to verify Hypothesis 1, this paper adopts the OLS method to conduct regression based on Equations (4) and (5), and the results are shown in Table 4.
As can be seen from Table 4, agricultural ecological capital investment has a significant positive impact on the development of green circular economy, where active investment has a significant positive effect, and passive investment has a lagging inhibition effect. According to the specific items in Table 4, with the addition of control variables, Column (1) shows the impact estimation result of total agricultural ecological capital investment, and the coefficient of Z-AECI is 0.519, which is significantly positive at the 1% level; Column (2) lists the one-period lagging estimation results of active investment and passive investment, and the coefficient of Z-AI is 0.520, which is positive at the 5% level, while the coefficient of Z-Pi-lag1 is −0.175, which is significantly negative at the 5% level.
3.3. Robustness Test
3.3.1. Winsorization
In order to ensure the robustness of the above research conclusions, the data are first processed with winsorization to avoid the influence of outliers on the results. There is a big difference in the data of each province, and extreme values may exist. In order to make the data smoother, values below 1% and above 99% percentile values are replaced with adjacent values. Regression results after winsorization are shown in Table 5.
It can be seen from Table 5 that the impact of agricultural ecological capital investment on the development of green circular economy is still significantly positive at the 1% level; the impact of active investment is still significant at the 5% level, while the lagging impact of passive investment becomes significant at 1%, and the coefficients are similar to the regression results in Section 3.2. Therefore, the conclusions are robust.
3.3.2. Changing Models
This part mainly conducts the robustness analysis by changing the model used above and using the original data before standardization. Since the explained variable is the level of green circular economy development, which is roughly continuously distributed in positive values, the left restricted point is 0, and there is no right restricted point. This part tries to use the Tobit model to perform regression. The results are shown in Table 6.
It can be seen from Table 6 that, due to the use of original data, the coefficients of explanatory variables differ greatly from the results obtained in Section 3.1. The coefficient of agricultural ecological capital investment is 9.06 × 10⁻⁹; the coefficient of active investment is 0.000101, and that of passive investment is −0.0000151; they are significant at the 1% level, and the direction is consistent with the original conclusion. So the conclusions are robust.
3.4. Mechanism Analysis
3.4.1. Mediating Effect of the Green Invention Number (GIN)
A large number of scholars have mentioned the relationship between ecological innovation and the circular economy framework, which is considered the key to promoting ecological construction and improving economic efficiency. This paper holds that agricultural ecological capital investment has a significant positive impact on the development of green circular economy, but the role of ecological innovation is not clear. In this paper, the number of green inventions obtained at the provincial level in the year is used as an indicator of ecological innovation, and Equations (4), (6) and (7) are established to verify Hypothesis 2.
In Equation (6), represents the number of green inventions obtained from province i in year t. The meanings and calculation methods of other variables are consistent with those in Equation (4). This part focuses on the size and significance of , , and and carries out the Sobel test to verify the robustness of the mediating effect. The results are shown in Table 7.
Table 7 shows that agricultural ecological capital investment has a positive impact on the development of green circular economy by increasing the number of green inventions obtained in the year. In Table 7, Column (1) verifies the direct impact of agricultural ecological capital investment on the development of green circular economy; Column (2) verifies the impact of agricultural ecological capital investment on the number of green inventions, and the regression coefficient is significantly positive, indicating that agricultural ecological capital investment does lead to an increase in the number of green inventions; Column (3) shows that the influence coefficient of agricultural ecological capital investment on the development of green circular economy is not significant, while the influence coefficient of the number of green inventions on the development of green circular economy is significantly positive, indicating that the number of green inventions plays a full mediating effect in the impact of agricultural ecological capital investment on the development of green circular economy.
3.4.2. Mediating Effect of the Green Credit Index (GDI)
In China, the behavior of financial institutions is one of the important aspects of policies to regulate the economy. There have been a lot of studies on the relationship between green credit and ecological construction in the existing literature. This paper establishes Equations (4), (8) and (9) to study the mediating effect of the green credit index.
In Equation (8), represents the green credit index of province i in year t. The meanings and calculation methods of other variables are consistent with those in Equation (4). This part focuses on the size and significance of , and and carries out the Sobel test to verify the robustness of the mediating effect. The results are shown in Table 8.
It can be seen from Table 8 that agricultural ecological capital investment has a positive impact on the development of green circular economy by increasing the green credit index. In Table 8, Column (1) verifies the direct impact of agricultural ecological capital investment on the development of green circular economy; Column (2) verifies the impact of agricultural ecological capital investment on green credit index, and the significantly positive regression coefficient indicates that agricultural ecological capital investment does lead to the improvement of green credit index; Column (3) shows that the influence coefficient of agricultural ecological capital investment on the development of green circular economy is not significant, and that of green credit index on the development of green circular economy is significantly positive, indicating that the green credit index plays a full mediating effect in the impact of agricultural ecological capital investment on the development of green circular economy.
3.5. Heterogeneity Analysis
3.5.1. Heterogeneity of Influence Mechanisms of Active and Passive Investment
In Section 3.4, we studied the influence mechanism of the agricultural ecological capital investment on the development of green circular economy and found the mediating effects of the number of green inventions and the green credit index. However, in the study in Section 3.2, the impacts of active investment and passive investment on the development of green circular economy are different, so we will explore whether the influence mechanisms of the two are also heterogeneous.
Heterogeneity of Mediating Effects of the Green Inventions Number (GIN)
This part explores whether the number of green inventions plays a mediating role in the influence of both active investment and passive investment on the development of green circular economy. Model construction is shown in Equations (10)–(15).
In Equations (10)–(15), the meanings and calculation methods of all variables are the same as those above. Equations (10)–(12) are the test models of the mediating effect of the number of green inventions on the influence of active investment on the development of green circular economy. Equations (13)–(15) are the test models of the mediating effect of the number of green inventions on the influence of passive investment on the development of green circular economy. The regression results are shown in Table 9.
It can be concluded from Table 9 that the impact mechanisms of active investment and passive investment of agricultural ecological capital on the development of green circular economy are heterogeneous. The number of green inventions of the year plays a completely positive mediating role in the impact of active investment on the development of green circular economy, but it plays a completely negative mediating role in the impact of passive investment. Columns (1)–(3) in Table 10 display the results of the influence mechanism of active investment, and the mediating effect is 0.522, which is significant at the 1% level; Columns (4)–(6) display the influence mechanism of passive investment, and the mediating effect is −0.205, which is significant at the 5% level.
Heterogeneity of Mediating Effects of the Green Credit Index (GDI)
This subsection explores whether the number of green inventions can play a mediating role in the impact of both active investment and passive investment on the development of green circular economy. The model construction is shown in Equations (10), (13), (16)–(19):
In Equations (10)–(19), the meanings and calculation methods of all variables are the same as those above. Equations (10), (16) and (17) represent the testing model of the mediating effect of green credit index in the impact of active investment on the development of green circular economy. Equations (13), (18) and (19) represent the testing model of the mediating effect of green credit index in the impact of passive investment on the development of green circular economy. The regression results are shown in Table 10.
It can be concluded from Table 10 that the influence mechanism of active and passive investment of agricultural ecological capital on the development of green circular economy is heterogeneous. The mediating effect of the green credit index exists in the impact of the active investment, but not in that of the passive investment. Columns (1)–(3) list the influence mechanism results of the active investment, where the mediating effect is 0.535, which is significant at the 1% level. Columns (4)–(6) display the influence mechanism of the passive investment, and the mediating effect is not significant.
3.5.2. Regional Heterogeneity
Different regions have different geographical and economic characteristics, different degrees of dependence on and utilization of natural resources, and different means of economic development. Therefore, this paper considers that the impact of agricultural ecological capital investment on the development of green circular economy has regional heterogeneity. In this paper, the samples are divided into three sub-samples, namely low, middle and high proportion regions, according to the proportion of the primary industry in GDP in each province, and then the regression is carried out respectively. The results are shown in Table 11.
Based on Table 11, we conclude that the impact of agricultural ecological capital investment on the development of green circular economy is regionally heterogeneous. The impact is significantly positive in regions with a low and middle proportion of primary industry in GDP, but it is not significant in the region with a high proportion of primary industry in GDP. In Table 11, the coefficient of agricultural ecological capital investment in the region with a low proportion of primary industry in GDP is 0.559, which is significant at the 5% level; that in the region of a medium proportion of primary industry in GDP is 0.240, which is significant at the 1% level, and that is not significant in the high proportion region.
4. Discussion
This study used the coupling coordination degree model and linear regression method to analyze the relationship between agricultural ecological capital investment and green circular economy development based on 155 annual macro data. In what follows, we discuss our key findings of the research.
First of all, agricultural ecological capital investment has a significant positive impact on green circular economy development, where active investment has a significant positive effect, and passive investment has a lagging inhibition effect. Just as what Łuczka, Kalinowski, and Shmygol [3] have suggested, organic agriculture should fulfill the functions of economy, society, and environment, and this paper believes ecological capital does possess such functions and plays an important role. After the investment in agricultural ecological resources, ecological environment, and ecological service capacity, the local ecological environment and economic development have been developed to a certain extent, and the green circular economic construction progress has been accelerated. Active investment is an investment in agricultural construction, accounting for the lion’s share of the agricultural ecological capital investment. Xu [44] puts forward a series of suggestions for the rural infrastructure contribution aiming at assisting green economy, which can also prove that the use of natural resources and the construction of environmental protection in rural areas can positively promote local low-carbon development, green development, and circular development. Rural infrastructure construction and investment in fixed assets have a positive role in promoting local economic development. Therefore, active investment can promote the development of green circular economy on the whole. Passive investment is pollution control investment, and, just as its name implies, it will be put into use only after pollution is generated. Regarding investment to reduce pollution, Barbier [45] mentioned in 2012 that in a green economy, growth in income and employment should be driven by public and private investments that reduce carbon emissions and pollution, enhance energy and resource efficiency, and prevent the loss of biodiversity and ecosystem services. Therefore, when the green circular economy development level in a region is higher, the less pollution it produces, the less investment in pollution control will be committed. Therefore, the impact of passive investment on the development level of green circular economy is lagging and negative.
Second, agricultural ecological capital investment has a positive impact on the development of green circular economies as a whole by increasing the number of green inventions obtained in the year and the green credit index. On the one hand, according to the neoclassical economic growth theory, technology input is the key to improving productivity. As a confirmation, Chen, Miao, and Zhu [46] calculate agricultural total factor productivity and believe this is the important premise to achieve agricultural green development and clean production. Just as Liu & Dong [47] discovered that technological innovation could considerably improve the green economy efficiency, after the investment of agricultural ecological capital the level of agricultural ecological technology is improved, which is manifested in the increase in the number of green inventions, and it also means the improvement of green production efficiency. At the same time, green inventions provide technical support in constructing a green circular economy system, so the improvement of green production efficiency also promote the green circular economy’s development level. The expression regarding the mediating effect can be seen in another research by Gong, et al. [48], that is, to take rising labor cost as an opportunity to advance technological progress in the green direction, establish a sound market competition environment, and develop green finance to reduce the financing constraints of green technological innovation. Therefore, we can conclude that the number of green inventions plays a mediating role in this influence process. On the other hand, based on the dominant position of Chinese banks, credit transmission is one of the most important monetary policy transmission mechanisms in China. Qi [49] studies the green credit policy more deeply, and points out that the implementation of the policy forces those heavy-polluting companies to make investment decisions more prudently, which not only increases investing efficiency but also benefits the ecological environment. After the investment of agricultural ecological capital, the number of projects that meet the requirements of green credit application increases, and the projects that do not meet the requirements of green credit application are limited, so the green credit index increases accordingly. At the same time, green credit, as sustainable financing or environmental financing, is a typical ex-ante governance method and a major force in constructing a green circular economy. The growth of green credit index also means the improvement of the green circular economy’s development level. Therefore, the green credit index plays a mediating role in the whole impact process.
Third, upon breaking the agricultural ecological capital into active and passive investment, we find that their impact mechanisms are heterogeneous. Green invention includes all green-related technological progress, including both ecological construction and pollution control; thus it is related to both active investment and passive investment. On the one hand, investment in ecological construction promotes green technological innovation in ecological construction so as to promote the green circular economy development level. On the other hand, Gong et al. [48] also mentioned that green technological innovation greatly helps pollution control, so we can conclude that the investment in pollution control promotes the green technological innovation in pollution control, resulting in the reduction of pollution year by year as well as the decrease of the pollution investment year by year; thus the green circular economy development level is also be improved year by year. Therefore, the number of green inventions plays an opposite mediating role in the impact mechanism of active and passive investment. For the green credit, its roles, such as effectively identifying and implementing green projects and contributing to the development of green circular economy, have been expounded in the previous parts of this paper. Zhang, Yang, & Bi [50] suggested that the green credit policy was introduced to mitigate the environmental impact of industrialization by reining in credit loans to companies and projects with poor environmental performance. Therefore, green credit is ex-ante governance, having some overlap with active investment. Those projects that do not meet the requirements are restricted, so the green credit index will increase and thus promote green circular economy development. Passive investment completely belongs to ex-post governance and has no obvious correlation with green credit, so the mediating effect of green credit index in the impact of passive investment is not significant.
Fourth, the impacts of agricultural ecological capital on the development of green circular economy are regionally heterogeneous. Xun and Hu [51] divide cities into four categories according to the natural capital utilization, and discover that cities where capital stock consumption exceed capital flow occupancy contain more severe ecological stress, while cities which featured mild natural capital utilization and a relatively high capacity for sustainable development. The areas with low proportions of primary industry in local GDP in this paper consume more natural capital, where the ecological stress is more severe. We put our additional analysis that in areas with low proportions of primary industry in local GDP, their economic development is less dependent on agriculture; the richness of natural resources is lower than that in areas with high proportions of primary industry in GDP; the pollution caused by secondary industry and tertiary industry is also relatively severe, and there is more room to improve the construction of a green circular economy. Therefore, after capital investment in agricultural ecology, agricultural infrastructure and resource utilization have been strengthened, and environmental pollution control has been greatly improved; thus agricultural ecological capital investment plays a significant role in promoting the green circular economy development level. On the contrary, in areas with high proportions of primary industry in GDP, economic growth and regional development are highly dependent on agriculture and natural resources, and more capital investment in agricultural ecology has been unable to achieve the expected effect. Therefore, in such areas, the role of agricultural ecological capital investment in green circular economy development is not significant enough; thus other aspects need to be considered.
5. Conclusions
As the contradiction between economic development and the environment becomes increasingly prominent, a green circular economy system proves to be the goal of various vital constructions. Traditional economic development is usually at the expense of natural resources and the ecological environment, and urban pollution is constantly transferred to rural areas, which seriously restricts the ecological, economic, and social green and sustainable development of agriculture. Organic farming and sustainable foodstuff come into the public market, for their feature is to fulfill three aspects of function: economic, social and environmental, which are also the elements of green circular economy. Capital investment is required to popularize the environment-friendly technology. Does this kind of investment really work to contribute significantly to the construction of green circular economy? In this context, starting from agricultural ecology, this paper analyzes the relationship between agricultural ecological capital investment and green circular economy development by using the coupling coordination degree model and linear regression method.
We draw conclusions as follows. First, agricultural ecological capital investment plays a significant role in promoting green circular economy development on the whole, but the roles of active investment and passive investment are different. Second, agricultural ecological capital investment positively impacts green circular economy development by increasing green inventions and promoting the green credit index. Third, the impact mechanisms of active and passive investment on green circular economy are different. Fourth, the impact of agricultural ecological capital investment on green circular economy is regionally heterogeneous.
There are still some shortfalls in this paper. First, as for the research model, it should be noted that the coupling coordination degree model used in this paper is simplified, as we assumed that agricultural ecological capital investment and the development of green circular economy are of equal weight, which may be somewhat different from the reality. Meanwhile, the regression model does reflect the causal relationship between the two objects, but cannot smoothly reflect the transition from active investment to passive investment. Second, we merely divide the investment into active and passive aspects. Also, we studied the green circular economy as a whole and we believe any one part in the system can be examined more thoroughly. In summary, more detailed and accurate analysis is recommended.
Author Contributions
Conceptualization, F.Z. and T.L.; methodology, F.Z.; software, F.Z.; validation, F.Z. and T.L.; formal analysis, F.Z.; investigation, F.Z.; resources, T.L.; data curation, F.Z.; writing—original draft preparation, F.Z.; writing—review and editing, T.L.; visualization, F.Z.; supervision, T.L. All authors have read and agreed to the published version of the manuscript.
Funding
This research was funded by the National Social Science Fund of China (NO. 19BTJ049).
Conflicts of Interest
The authors declare no conflict of interest.
References
- Zheng, Q.; Wan, L.; Wang, S.; Wang, C.; Fang, W. Does ecological compensation have a spillover effect on industrial structure upgrading? Evidence from China based on a multi-stage dynamic DID approach. J. Environ. Manag. 2021, 294, 112934. [Google Scholar] [CrossRef] [PubMed]
- Chen, L.; Zhang, Z.; Chen, F.; Zhou, N. A study on the relationship between economic growth and energy consumption under the new normal. Natl. Account. Rev. 2019, 1, 28–41. [Google Scholar] [CrossRef]
- Łuczka, W.; Kalinowski, S.; Shmygol, N. Organic Farming Support Policy in a Sustainable Development Context: A Polish Case Study. Energies 2021, 14, 4208. [Google Scholar] [CrossRef]
- Goszczyński, W.; Śpiewak, R.; Bilewicz, A.; Wróblewski, M. Between Imitation and Embeddedness: Three Types of Polish Alternative Food Networks. Sustainability 2019, 11, 7059. [Google Scholar] [CrossRef] [Green Version]
- Wojciechowska-Solis, J.; Barska, A. Exploring the Preferences of Consumers’ Organic Products in Aspects of Sustainable Consumption: The Case of the Polish Consumer. Agriculture 2021, 11, 138. [Google Scholar] [CrossRef]
- Yu, H.; Wang, Y.; Li, X.; Wang, C.; Sun, M.; Du, A. Measuring ecological capital: State of the art, trends, and challenges. J. Clean. Prod. 2019, 219, 833–845. [Google Scholar] [CrossRef]
- Gras, C.; Caceres, D.M. Technology, nature’s appropriation and capital accumulation in modern agriculture. Curr. Opin. Environ. Sustain. 2020, 45, 1–9. [Google Scholar] [CrossRef]
- Fairbrass, A.; Mace, G.; Ekins, P.; Milligan, B. The natural capital indicator framework (NCIF) for improved national natural capital reporting. Ecosyst. Serv. 2020, 46, 101198. [Google Scholar] [CrossRef]
- Ogilvy, S. Developing the ecological balance sheet for agricultural sustainability. Sustain. Account. Manag. Policy J. 2015, 6, 110–137. [Google Scholar] [CrossRef]
- Guo, S.; Wang, Y.; Huang, J.; Dong, J.; Zhang, J. Decoupling and Decomposition Analysis of Land Natural Capital Utilization and Economic Growth: A Case Study in Ningxia Hui Autonomous Region, China. Int. J. Environ. Res. Public Health 2021, 18, 646. [Google Scholar] [CrossRef]
- Schaap, R.; Richter, A. Overcapitalization and social norms of cooperation in a small-scale fishery. Ecol. Econ. 2019, 166, 106438. [Google Scholar] [CrossRef]
- Lu, X.; Yao, S.; Fu, G.; Lv, X.; Mao, Y. Dynamic simulation test of a model of ecological system security for a coastal tourist city. J. Destin. Mark. Manag. 2019, 13, 73–82. [Google Scholar] [CrossRef]
- Zhan, L.; Lei, Y.; Li, L.; Ge, J. Interprovincial transfer of ecological footprint among the region of Jing-Jin-Ji and other provinces in China: A quantification based on MRIO model. J. Clean. Prod. 2019, 225, 304–314. [Google Scholar] [CrossRef]
- Wang, H.; Wang, X.; Sarkar, A.; Zhang, F. How Capital Endowment and Ecological Cognition Affect Environment-Friendly Technology Adoption: A Case of Apple Farmers of Shandong Province, China. Int. J. Environ. Res. Public Health 2021, 18, 7571. [Google Scholar] [CrossRef] [PubMed]
- Zhang, Q.; Hong, J.; Wu, F.; Yang, Y.; Dong, C. Gains or losses? A quantitative estimation of environmental and economic effects of an ecological compensation policy. Ecol. Appl. 2021, 31, e2341. [Google Scholar] [CrossRef] [PubMed]
- Łuczka, W.; Kalinowski, S. Barriers to the Development of Organic Farming: A Polish Case Study. Agriculture 2020, 10, 536. [Google Scholar] [CrossRef]
- Rasmussen, L.V.; Fold, N.; Olesen, R.S.; Shackleton, S. Socio-economic outcomes of ecological infrastructure investments. Ecosyst. Serv. 2021, 47, 101242. [Google Scholar] [CrossRef]
- Liu, M.; Rao, D.; Yang, L.; Min, Q. Subsidy, training or material supply? The impact path of eco-compensation method on farmers’ livelihood assets. J. Environ. Manag. 2021, 287, 112339. [Google Scholar] [CrossRef]
- Angelstam, P.; Barnes, G.; Elbakidze, M.; Marais, C.; Marsh, A.; Polonsky, S.; Richardson, D.; Rivers, N.; Shackleton, R.; Stafford, W. Collaborative learning to unlock investments for functional ecological infrastructure: Bridging barriers in social-ecological systems in South Africa. Ecosyst. Serv. 2017, 27, 291–304. [Google Scholar] [CrossRef]
- Zhang, S.; Zhao, M.; Ni, Q.; Cai, Y. Modelling Farmers’ Watershed Ecological Protection Behaviour with the Value-Belief-Norm Theory: A Case Study of the Wei River Basin. Int. J. Environ. Res. Public Health 2021, 18, 5023. [Google Scholar] [CrossRef]
- Kirchherr, J.; Reike, D.; Hekkert, M. Conceptualizing the circular economy: An analysis of 114 definitions. Resour. Conserv. Recycl. 2017, 127, 221–232. [Google Scholar] [CrossRef]
- Prieto-Sandoval, V.; Jaca, C.; Ormazabal, M. Towards a consensus on the circular economy. J. Clean. Prod. 2018, 179, 605–615. [Google Scholar] [CrossRef]
- Grafström, J.; Aasma, S. Breaking circular economy barriers. J. Clean. Prod. 2021, 292, 126002. [Google Scholar] [CrossRef]
- Hartley, K.; van Santen, R.; Kirchherr, J. Policies for transitioning towards a circular economy: Expectations from the European Union (EU). Resour. Conserv. Recycl. 2020, 155, 104634. [Google Scholar] [CrossRef]
- Gorelick, J.; Walmsley, N. The greening of municipal infrastructure investments: Technical assistance, instruments, and city champions. Green Finance 2020, 2, 114–134. [Google Scholar] [CrossRef]
- Wang, J.; Xue, Y.; Sun, X.; Yang, J. Green learning orientation, green knowledge acquisition and ambidextrous green innovation. J. Clean. Prod. 2019, 250, 119475. [Google Scholar] [CrossRef]
- Kirschner, M. Why the Circular Economy Will Drive Green and Sustainable Chemistry in Electronics. Adv. Sustain. Syst. 2021, 6, 2100046. [Google Scholar] [CrossRef]
- Ntarmah, A.H.; Kong, Y.; Gyan, M.K. Banking system stability and economic sustainability: A panel data analysis of the effect of banking system stability on sustainability of some selected developing countries. Quant. Finance Econ. 2019, 3, 709–738. [Google Scholar] [CrossRef]
- Hong, M.; Li, Z.; Drakeford, B. Do the Green Credit Guidelines Affect Corporate Green Technology Innovation? Empirical Research from China. Int. J. Environ. Res. Public Health 2021, 18, 1682. [Google Scholar] [CrossRef]
- Ilić, B.; Stojanovic, D.; Djukic, G. Green economy: Mobilization of international capital for financing projects of renewable energy sources. Green Finance 2019, 1, 94–109. [Google Scholar] [CrossRef]
- Huang, Z.; Liao, G.; Li, Z. Loaning scale and government subsidy for promoting green innovation. Technol. Forecast. Soc. Change 2019, 144, 148–156. [Google Scholar] [CrossRef]
- Belt, M.V.D.; Blake, D. Investing in Natural Capital and Getting Returns: An Ecosystem Service Approach. Bus. Strategy Environ. 2015, 24, 667–677. [Google Scholar] [CrossRef]
- Lin, J.-H.; Chen, S.; Tsai, J.-Y. How does soft information about small business lending affect bank efficiency under capital regulation? Quant. Financ. Econ. 2019, 3, 53–74. [Google Scholar] [CrossRef]
- Wang, R.; Tan, J. Exploring the coupling and forecasting of financial development, technological innovation, and economic growth. Technol. Forecast. Soc. Change 2020, 163, 120466. [Google Scholar] [CrossRef]
- Yang, C.; Zeng, W.; Yang, X. Coupling coordination evaluation and sustainable development pattern of geo-ecological environment and urbanization in Chongqing municipality, China. Sustain. Cities Soc. 2020, 61, 102271. [Google Scholar] [CrossRef]
- García-Gómez, C.D.; Bilgin, M.H.; Demir, E.; Díez-Esteban, J.M. Leverage and performance: The case of the U.S. hospitality industry. Quant. Financ. Econ. 2021, 5, 228–246. [Google Scholar] [CrossRef]
- Liang, G. Measurement on the Construction Level of China’s Green, Low-carbon and Circular-Development Economic System. Stat. Decis. 2021, 37, 47–51. [Google Scholar]
- Wang, C.-P.; Li, C.; Liu, S.-T. A Multidimensional Environmental Value Orientation Approach to Forest Recreation Area Tourism Market Segmentation. Forests 2016, 7, 92. [Google Scholar] [CrossRef] [Green Version]
- Li, Y.; Liu, X. How did urban polycentricity and dispersion affect economic productivity? A case study of 306 Chinese cities. Landsc. Urban Plan. 2018, 173, 51–59. [Google Scholar] [CrossRef]
- Kropp, I.; Nejadhashemi, A.P.; Deb, K.; Abouali, M.; Roy, P.C.; Adhikari, U.; Hoogenboom, G. A multi-objective approach to water and nutrient efficiency for sustainable agricultural intensification. Agric. Syst. 2019, 173, 289–302. [Google Scholar] [CrossRef]
- Kwakwa, P.A.; Adusah-Poku, F. Determinants of electricity consumption and energy intensity in South Africa. Green Finance 2019, 1, 387–404. [Google Scholar] [CrossRef]
- Kowalczyk, T.; Badur, J.; Bryk, M. Energy and exergy analysis of hydrogen production combined with electric energy generation in a nuclear cogeneration cycle. Energy Convers. Manag. 2019, 198, 111805. [Google Scholar] [CrossRef]
- Agrawal, S.; Harish, S.; Mahajan, A.; Thomas, D.; Urpelainen, J. Influence of improved supply on household electricity consumption—Vidence from rural India. Energy 2020, 211, 118544. [Google Scholar] [CrossRef]
- Xu, Y. Application of Green Building Design Based on the Internet of Things in the Landscape Planning of Characteristic Towns. Adv. Civ. Eng. 2021, 2021, 6317073. [Google Scholar] [CrossRef]
- Barbier, E.B. The Green Economy Post Rio+20. Science 2012, 338, 887–888. [Google Scholar] [CrossRef]
- Chen, Y.; Miao, J.; Zhu, Z. Measuring green total factor productivity of China’s agricultural sector: A three-stage SBM-DEA model with non-point source pollution and CO2 emissions. J. Clean. Prod. 2021, 318, 128543. [Google Scholar] [CrossRef]
- Gong, R.; Wu, Y.-Q.; Chen, F.-W.; Yan, T.-H. Labor Costs, Market Environment and Green Technological Innovation: Evidence from High-Pollution Firms. Int. J. Environ. Res. Public Health 2020, 17, 522. [Google Scholar] [CrossRef] [Green Version]
- Qi, M. Green Credit, Financial Ecological Environment, and Investment Efficiency. Complexity 2021, 2021, 5539195. [Google Scholar] [CrossRef]
- Liu, Y.; Dong, F. How technological innovation impacts urban green economy efficiency in emerging economies: A case study of 278 Chinese cities. Resour. Conserv. Recycl. 2021, 169, 105534. [Google Scholar] [CrossRef]
- Zhang, B.; Yang, Y.; Bi, J. Tracking the implementation of green credit policy in China: Top-down perspective and bottom-up reform. J. Environ. Manag. 2011, 92, 1321–1327. [Google Scholar] [CrossRef]
- Xun, F.; Hu, Y. Evaluation of ecological sustainability based on a revised three-dimensional ecological footprint model in Shandong Province, China. Sci. Total Environ. 2019, 649, 582–591. [Google Scholar] [CrossRef] [PubMed]
Figure 1.
Coupling coordination degree of agricultural ecological capital and green circular economy development.
Figure 1.
Coupling coordination degree of agricultural ecological capital and green circular economy development.


Table 1.
Green circular economy development indicator system.
| First-Level Indicator | Second-Level Indicator | Third-Level Indicator | Fourth-Level Indicator | Indicator Value Direction | Weight |
|---|---|---|---|---|---|
| Green circular economy development level (GCDE) | Low carbon development | Carbon productivity | Gross Domestic Production (GDP) per unit of carbon dioxide emissions | + 1 | 0.053 |
| Per capita energy consumption | Total energy consumption/Total resident population | − | −0.056 | ||
| Carbon emissions from household energy per capita | Residential energy consumption/total resident population | - | −0.091 | ||
| Carbon emissions per capita | (Total energy consumption × carbon emission coefficient)/total resident population | - | −0.057 | ||
| Green development | Energy consumption | Regional energy consumption elasticity coefficient | - | −0.028 | |
| Ecological environment | Regional forest coverage | + | 0.035 | ||
| Water resources per capita | |||||
| Number of national nature reserves | |||||
| Ecological protection | Regional afforestation area/number of national nature reserves | + | 0.029 | ||
| Circular development | Proportion of coal emission in total energy consumption | Proportion of coal in total energy consumption | - | −0.079 | |
| Unit carbon emission intensity | Carbon dioxide emissions per unit of GDP | - | −0.007 | ||
| Industrial solid waste utilization | Comprehensive utilization of general industrial solid waste | + | 0.013 | ||
| Utilization rate of urban reclaimed water | Total amount of urban sewage recycling/sewage treatment volume | + | 0.018 | ||
| Reuse rate of industrial water | Industrial repeated water consumption/total water consumption | + | 0.015 | ||
| Economic development | Per capita disposable income | Rural and urban per capita disposable income | + | 0.059 | |
| Urbanization rate | - | + | 0.035 | ||
| Urban public transport sharing rate | - | + | 0.068 | ||
| Number of regional professional and technical personnel | - | + | 0.052 | ||
| Number of personnel with high school education or above | - | + | 0.052 |
1 “+” represents that the indicator has a positive impact on the green circular economy, while “-“ represents that the indicator has a negative impact.
Table 2.
Indicator system of agricultural ecological capital investment.
| First-Level Indicator | Second-Level Indicator | Third-Level Indicator |
|---|---|---|
| Agricultural ecological capital investment (AECI) | Active Investment (AI): Agricultural construction (100 million yuan) | Investment in environmental protection |
| Business expenses of land, resources, and meteorology departments | ||
| Agriculture, forestry, and water expenditure | ||
| Investment in geological disaster prevention and control Completed investment in rural fixed assets | ||
| Passive Investment (PI): Agricultural pollution control (ten thousand yuan) | Ratio of primary industry to GDP * Investment in pollution control |
Table 3.
Construction index of agricultural ecological capital investment.
| Variable | Obs | Mean | Std. Dev. | Min | Max |
|---|---|---|---|---|---|
| AI | 155 | 1047.942 | 461.3295 | 259.48 | 2303.63 |
| Z-AI | 155 | 6.81 × 10⁻⁸ | 1 | −1.70911 | 2.72189 |
| PI | 155 | 1756.705 | 1738.461 | 0 | 9164 |
| Z-PI | 155 | 3.88 × 10⁻⁷ | 1 | −1.01049 | 4.26083 |
| AECI | 155 | 1.05 × 10⁷ | 4,614,441 | 2,594,867 | 2.30 × 10⁷ |
| Z-AECI | 155 | −2.58 × 10⁻⁷ | 1 | −1.70905 | 2.72246 |
| GCDE | 155 | 0.2808206 | 0.08047 | 0.188 | 0.765 |
| Z-GCDE | 155 | −6.19 × 10⁻⁸ | 1 | −1.15349 | 6.01692 |
| FA | 155 | 754.375 | 632.016 | 6.81 | 2614.85 |
| Z-FA | 155 | −2.54 × 10⁻⁷ | 1 | −1.18283 | 2.94371 |
| UPD | 155 | 2856.807 | 1100.44 | 1135.53 | 5515 |
| Z-UPD | 155 | −1.26 × 10⁻⁷ | 1 | −1.56417 | 2.41557 |
| CF | 155 | 185.8005 | 147.0279 | 4.82 | 716.09 |
| Z-CF | 155 | 6.43 × 10⁻⁸ | 1 | −1.23093 | 3.60673 |
| CSA | 155 | 5362.513 | 3885.783 | 88.55 | 14,783.35 |
| Z-CSA | 155 | 6.52 × 10⁻⁸ | 1 | −1.35725 | 2.42444 |
| EEP | 155 | 2133.382 | 1425.573 | 44.77 | 5897.22 |
| Z-EEP | 155 | 1.28 × 10⁻⁷ | 1 | −1.4651 | 2.64023 |
| EC | 155 | 2076.082 | 1529.66 | 40.53 | 6695.85 |
| Z-EC | 155 | 2.54 × 10⁻⁷ | 1 | −1.33072 | 3.02013 |
| REC | 155 | 300.8456 | 437.7986 | 1.21 | 1949.11 |
| Z-REC | 155 | 3.23 × 10⁻⁷ | 1 | −0.68441 | 3.76489 |
| GIN | 155 | 1159.865 | 1508.697 | 1 | 6820 |
| Z-GIN | 155 | −1.24 × 10⁻⁹ | 1 | −0.76812 | 3.75167 |
| GDI | 150 | 0.2068067 | 0.1207781 | 0.08 | 0.793 |
| Z-GDI | 150 | −7.15 × 10⁻⁸ | 1 | −1.04901 | 4.85357 |
Table 4.
Regression results.
| (1) | (2) | |
|---|---|---|
| Z-GCDE | Z-GCDE | |
| Z-AECI | 0.519 *** | |
| (2.75) | ||
| Z-AI | 0.520 ** | |
| (2.37) | ||
| Z-PI-lag1 | −0.175 ** | |
| (−2.21) | ||
| _cons | 5.28 × 10⁻⁸ | 0.00313 |
| (0.00) | (0.04) | |
| Control Variables | yes | yes |
| N | 155 | 124 |
| R-sq | 0.237 | 0.256 |
**, *** represent the significance level of 5%, and 1% respectively, and the value in parentheses is the t value.
Table 5.
Regression results after winsorization.
| (1) | (2) | |
|---|---|---|
| Z-GCDE | Z-GCDE | |
| Z-AECI | 0.504 *** | |
| (3.72) | ||
| Z-AI | 0.506 ** | |
| (2.29) | ||
| Z-PI-lag1 | −0.185 *** | |
| (−2.69) | ||
| _cons | −0.00604 | −0.00602 |
| (−0.09) | (−0.07) | |
| Control Variables | yes | yes |
| N | 155 | 124 |
| R-sq | 0.239 | 0.222 |
**, *** represent the significance level of 5%, and 1% respectively, and the value in parentheses is the t value.
Table 6.
Tobit model regression results.
| (1) | (2) | |
|---|---|---|
| GCDE | GCDE | |
| GCDE | ||
| AECI | 9.06 × 10⁻⁹ *** | |
| (3.78) | ||
| AI | 0.000101 *** | |
| (4.28) | ||
| PI-lag1 | −0.0000151 *** | |
| (−2.95) | ||
| _cons | 0.302 *** | 0.300 *** |
| (13.36) | (13.62) | |
| Control Variables | yes | yes |
| var(e.GCDE) | 0.00491 *** | 0.00465 *** |
| (8.80) | (8.80) | |
| N | 155 | 124 |
*** represent the significance level of 1% respectively, and the value in parentheses is the t value.
Table 7.
The mediating effect of the green invention number.
| (1) | (2) | (3) | |
|---|---|---|---|
| Z-GCDE | Z-GIN | Z-GCDE | |
| Z-AECI | 0.504 *** | 0.480 *** | −0.017 |
| (3.72) | (4.51) | (−0.23) | |
| Z-GIN | 1.087 *** | ||
| (19.57) | |||
| _cons | −0.00604 | 0.00108 | −0.00721 |
| (−0.09) | (0.02) | (−0.20) | |
| Control Variables | yes | yes | yes |
| N | 155 | 155 | 155 |
| R-sq | 0.239 | 0.570 | 0.791 |
| Indirect effect | 0.522 *** (4.40) | ||
| Direct effect | −0.017 (−0.227) | ||
| Total effect | 0.504 *** (3.72) | ||
*** represent the significance level of 1% respectively, and the value in parentheses is the t value.
Table 8.
The mediating effect of the green credit index.
| (1) | (2) | (3) | |
|---|---|---|---|
| Z-GCDE | Z-GDI | Z-GCDE | |
| Z-AECI | 0.510 *** | 0.064 *** | −0.024 |
| (3.75) | (4.40) | (−0.37) | |
| Z-GDI | 8.359 *** | ||
| (23.47) | |||
| _cons | 0.02491 | 0.20934 *** | −1.725 |
| (0.35) | (27.72) | (−0.09) | |
| Control Variables | yes | yes | yes |
| N | 150 | 150 | 150 |
| R-sq | 0.260 | 0.452 | 0.850 |
| Indirect effect | 0.535 *** (4.322) | ||
| Direct effect | −0.024 (−0.369) | ||
| Total effect | 0.511 *** (3.75) | ||
*** represent the significance level of 1% respectively, and the value in parentheses is the t value.
Table 9.
Heterogeneity of mediating effects of the number of green inventions.
| (1) | (2) | (3) | (4) | (5) | (6) | |
|---|---|---|---|---|---|---|
| Z-GCDE | Z-GIN | Z-GCDE | Z-GCDE | Z-GIN | Z-GCDE | |
| Z-AI | 0.504 *** | 0.480 *** | −0.017 | |||
| (3.72) | (4.52) | (−0.23) | ||||
| Z-PI | −0.255 ** | −0.205 ** | −0.034 | |||
| (−2.22) | (−2.23) | (−0.57) | ||||
| Z-GIN | 1.087 *** | 1.077 *** | ||||
| (19.56) | (20.37) | |||||
| _cons | −0.006 | 0.001 | −0.007 | −0.006 | 0.001 | −0.007 |
| (−0.09) | (0.02) | (−0.20) | (−0.08) | (0.02) | (−0.20) | |
| Control Variables | yes | yes | yes | yes | yes | yes |
| N | 155 | 155 | 155 | 155 | 155 | 155 |
| R-sq | 0.239 | 0.570 | 0.791 | 0.195 | 0.523 | 0.791 |
| Indirect effect | 0.522 *** (4.40) | −0.205 ** (−2.23) | ||||
| Direct effect | −0.017 (−0.23) | −0.034 (−0.57) | ||||
| Total effect | 0.504 *** (3.72) | −0.255 ** (−2.22) | ||||
**, *** represent the significance level of 5%, and 1% respectively, and the value in parentheses is the t value.
Table 10.
Regression results of the heterogeneity of mediating effects of the green credit index.
| (1) | (2) | (3) | (4) | (5) | (6) | |
|---|---|---|---|---|---|---|
| Z-GCDE | Z-GDI | Z-GCDE | Z-GCDE | Z-GDI | Z-GCDE | |
| Z-AI | 0.511 *** | 0.064 *** | −0.024 | |||
| (3.75) | (4.40) | (−0.37) | ||||
| Z-PI | −0.212 ** | −0.019 | −0.079 | |||
| (−2.02) | (−1.49) | (−1.55) | ||||
| Z-GDI | 8.359 *** | 8.249 *** | ||||
| (23.46) | (24.70) | |||||
| _cons | 0.025 | 0.209 *** | −1.725 *** | 0.021 | 0.209 *** | −1.703 *** |
| (0.35) | (27.72) | (−21.26) | (0.29) | (26.16) | (−22.21) | |
| Control Variables | yes | yes | yes | yes | yes | yes |
| N | 150 | 150 | 150 | 150 | 150 | 150 |
| R-sq | 0.256 | 0.452 | 0.845 | 0.209 | 0.387 | 0.852 |
| Indirect effect | 0.535 *** (4.32) | −0.155 (−1.48) | ||||
| Direct effect | −0.024 (−0.369) | −0.079 (−1.55) | ||||
| Total effect | 0.511 *** (3.75) | −0.234 ** (−2.02) | ||||
**, *** represent the significance level of 5%, and 1% respectively, and the value in parentheses is the t value.
Table 11.
Regional heterogeneity.
| (1) Low_Prop | (2) Middle_Prop | (3) High_Prop | |
|---|---|---|---|
| Z-GCDE | Z-GCDE | Z-GCDE | |
| Z-AECI | 0.559 ** | 0.240 *** | 0.169 |
| (2.07) | (3.12) | (1.47) | |
| _cons | −1.059 ** | −0.209 *** | −0.469 *** |
| (−2.65) | (−3.60) | (−4.35) | |
| Control Variables | yes | yes | yes |
| N | 51 | 51 | 53 |
| R-sq | 0.71 | 0.421 | 0.302 |
**, *** represent the significance level of 5%, and 1% respectively, and the value in parentheses is the t value.
Publisher’s Note: MDPI stays neutral with regard to jurisdictional claims in published maps and institutional affiliations. |
© 2022 by the authors. Licensee MDPI, Basel, Switzerland. This article is an open access article distributed under the terms and conditions of the Creative Commons Attribution (CC BY) license (https://creativecommons.org/licenses/by/4.0/).
Share and Cite
MDPI and ACS Style
Zou, F.; Li, T. The Impact of Agricultural Ecological Capital Investment on the Development of Green Circular Economy. Agriculture 2022, 12, 461. https://0-doi-org.brum.beds.ac.uk/10.3390/agriculture12040461
AMA Style
Zou F, Li T. The Impact of Agricultural Ecological Capital Investment on the Development of Green Circular Economy. Agriculture. 2022; 12(4):461. https://0-doi-org.brum.beds.ac.uk/10.3390/agriculture12040461
Chicago/Turabian StyleZou, Fanqi, and Tinghui Li. 2022. "The Impact of Agricultural Ecological Capital Investment on the Development of Green Circular Economy" Agriculture 12, no. 4: 461. https://0-doi-org.brum.beds.ac.uk/10.3390/agriculture12040461
Note that from the first issue of 2016, this journal uses article numbers instead of page numbers. See further details here.