Article

QTL Mapping of Leaf Area Index and Chlorophyll Content Based on UAV Remote Sensing in Wheat

1
College of Agronomy, High Quality Special Wheat Crop Engineering Technology Research Center, Xinjiang Agricultural University, Urumqi 830052, China
2
Department of Computer Science and Information Engineering, Anyang Institute of Technology, Anyang 455000, China
3
Research Institute of Grain Crops, Xinjiang Academy of Agricultural Sciences, Urumqi 830091, China
*
Author to whom correspondence should be addressed.
Submission received: 4 March 2022 / Revised: 20 April 2022 / Accepted: 20 April 2022 / Published: 23 April 2022
(This article belongs to the Special Issue QTL Mapping for Yield and Quality Traits in Crops)

Abstract

:
High-throughput phenotypic identification is a prerequisite for large-scale identification and gene mining of important traits. However, existing work has rarely leveraged high-throughput phenotypic identification into quantitative trait locus (QTL) acquisition in wheat crops. Clarifying the feasibility and effectiveness of high-throughput phenotypic data obtained from UAV multispectral images in gene mining of important traits is an urgent problem to be solved in wheat. In this paper, 309 lines of the spring wheat Worrakatta × Berkut recombinant inbred line (RIL) were taken as materials. First, we obtained the leaf area index (LAI) including flowering, filling, and mature stages, as well as the flag leaf chlorophyll content (CC) including heading, flowering, and filling stages, from multispectral images under normal irrigation and drought stress, respectively. Then, on the basis of the normalized difference vegetation index (NDVI) and green normalized difference vegetation index (GNDVI), which were determined by multispectral imagery, the LAI and CC were comprehensively estimated through the classification and regression tree (CART) and cross-validation algorithms. Finally, we identified the QTLs by analyzing the predicted and measured values. The results show that the predicted values of determination coefficient (R2) ranged from 0.79 to 0.93, the root-mean-square error (RMSE) ranged from 0.30 to 1.05, and the relative error (RE) ranged from 0.01 to 0.18. Furthermore, the correlation coefficients of predicted and measured values ranged from 0.93 to 0.94 for CC and from 0.80 to 0.92 for LAI at different wheat growth stages under normal irrigation and drought stress. Additionally, a linkage map of this RIL population was constructed by 11,375 SNPs; eight QTLs were detected for LAI on wheat chromosomes 1BL, 2BL (four QTLs), 3BL, 5BS, and 5DL, and three QTLs were detected for CC on chromosomes 1DS (two QTLs) and 3AL. The closely linked QTLs formed two regions on chromosome 2BL (from 54 to 56 cM and from 96 to 101 cM, respectively) and one region on 1DS (from 26 to 27 cM). Each QTL explained phenotypic variation for LAI from 2.5% to 13.8% and for CC from 2.5% to 5.8%. For LAI, two QTLs were identified at the flowering stage, two QTLs were identified at the filling stage, and three QTLs were identified at the maturity stage, among which QLAI.xjau-5DL-pre was detected at both filling and maturity stages. For CC, two QTLs were detected at the heading stage and one QTL was identified at the flowering stage, among which QCC.xjau-1DS was detected at both stages. Three QTLs (QLAI.xjau-2BL-pre.2, QLAI.xjau-2BL.2, and QLAI.xjau-3BL-pre) for LAI were identified under drought stress conditions. Five QTLs for LAI and two QTLs for CC were detected by imagery-predicted values, while four QTLs for LAI and two QTLs for CC were identified by manual measurement values. Lastly, investigations of these QTLs on the wheat reference genome identified 10 candidate genes associated with LAI and three genes associated with CC, belonging to F-box family proteins, peroxidase, GATA transcription factor, C2H2 zinc finger structural protein, etc., which are involved in the regulation of crop growth and development, signal transduction, and response to drought stress. These findings reveal that UAV sensing technology has relatively high reliability for phenotyping wheat LAI and CC, which can play an important role in crop genetic improvement.

1. Introduction

Wheat is one of the most important staple crops for 4.4 billion people in the world [1,2]. Sustainable wheat production is an important guarantee for food security, which depends on the ability to adapt to environmental stress and extreme climate changes [3,4]. It was reported that drought and high temperatures have reduced the world’s annual wheat output by 9% to 10% [4]. As important phenotypic traits of crops, LAI and CC can effectively reflect crop growth, plant health, etc. and are also an important basis for predicting yield [5]. Therefore, real-time, rapid monitoring and accurate estimation of wheat LAI and CC are helpful to understand the growth information of wheat in a timely manner and guide field management [6].
As more and more crop genomes have been deciphered, the lack of phenotype information corresponding to the genome has become the main bottleneck restricting the exploration of the genotype–phenotype relationship [7]. The lack of efficient methods for phenotype collection and analysis has weakened the field of crop breeding [8]. Low throughput and efficiency, as well as heavy labor and time consumption, are the main problems when collecting phenotypic information in a large area using traditional methods. Using remote sensing technology to estimate vegetation has been widely developed especially for large-scale and long-term crop monitoring. Compared with traditional methods, UAV remote sensing technology has more advantages, e.g., convenient transportation, high flexibility, short operation time, and low investment, which provide a new method for fast, nondestructive, and high-throughput acquisition of field crop phenotypic information [9,10,11,12]. At the same time, many studies found that crop canopy spectral information was significantly related to crop LAI and CC, and they used spectral reflectance and the vegetation index to build mathematic models for estimating LAI and CC [8,13,14,15]. Gong et al. [14] developed a simple method to remotely estimate LAI with UAV imaging for a variety of rice cultivars throughout the entire growing season. Hunt et al. [16] used the UAV multispectral imagery-based green normalized difference vegetation index (GNDVI) to estimate wheat LAI by remote sensing and obtained good prediction (R2 = 0.85). Singhal et al. [17] evaluated an advanced machine learning algorithm kernel ridge regression combined with spectral information and ground-truth chlorophyll data to model the chlorophyll estimation, resulting in high correlation (R2 = 0.7452). Jin et al. [13] used hyperspectral reflectance and the vegetation index to establish wheat CC estimation models (R2 > 0.94) under two growth environments, irrigated land and dry land. These studies indicate that remote sensing technology has become an alternative for traditional phenotype collection and an important tool for crop growth monitoring [10,18].
With the application of UAV remote sensing technology in agriculture, phenotypic data have been recently collected from wheat for use in genetic studies. Combining high-throughput phenotypic data with QTL mapping and a genome-wide association study (GWAS), several agronomic traits in wheat were efficiently investigated. Condorelli et al. [19] used UAV multispectral remote sensing and manual measurement to obtain the normalized difference vegetation index (NDVI) for 248 durum wheat lines, performed GWAS analysis on the population, and found that the number of QTLs detected with UAV-based NDVI increased by 25% compared to the QTLs detected with manual measurement, with 46 QTLs overlapping for the two phenotypic data sources. The individual loci explained 2.69–8.43% of the phenotypic variance. Adeel et al. [20] used UAV remote sensing technology and artificial measurement to collect the plant height of a wheat double haploid (DH) population consisting of 198 wheat lines, and they found that the values of plant height based on imagery were significantly related to the measured values, with five height-related QTLs mapped by the UAV-predicted value, i.e., two more QTLs than detected by the measured value. Among them, three QTLs were coincidently detected by both manual measurement and UAV sensing-based data.
The LAI and CC of wheat are quantitative traits regulated by multiple genes and determined by the interaction between genes and the environment [21]. The genetic characteristics of LAI and CC were investigated in previous reports [5,13,22], but QTL mapping for LAI and CC on the basis of UAV remote sensing technology in wheat is rare. In our previous study, we constructed linkage maps with a 50K SNP array for an RIL population of 309 lines from wheat cross Worrakatta × Berkut, and we conducted QTL mapping of drought resistance at the germination stage [23].
Thus, the major objectives of the present study were to (1) standardize a rapid method for LAI and CC estimation using a UAV platform, (2) identify quantitative trait loci for LAI and CC using UAV and ground-based measurements, and (3) assess genomic prediction accuracy for LAI and CC in wheat.

2. Materials and Methods

2.1. Experimental Materials

The RIL population consisting of 309 lines from the cross of spring wheat cultivars Worrakatta × Berkut was originally from the International Maize and Wheat Improvement Center (CIMMYT). The RIL and parents were planted at the Manas experimental station (86°12′52.2″ E, 44°18′15.7″ N) of the Xinjiang Academy of Agricultural Sciences in 2020. The Manas experimental station has a mid-temperate continental semiarid climate with severe cold winters, hot summers, dryness and low rainfall, sufficient sunshine, high evaporation, and low precipitation. The experiment consisted of two water supply treatments, normal irrigation (NI) and drought stress (DS), and each treatment was repeated twice. Approximately 100 seeds of each RIL and parents were sown in a single row with a row length of 2 m and a space between two rows of 20 cm. Field planting adopts a random block design. Drip irrigation was applied to both treatments; however, watering was stopped after the wheat heading stage in the drought stress treatment. Other field management approaches, such as the fertilization, insect control, and weeding followed local regulations.

2.2. Ground Data Collection

2.2.1. Determination of LAI

The LAI value was determined using an LAI-2200C plant canopy analyzer (LI-COR, Lincoln, NE, USA) at the flowering, filling, and maturation stages of wheat. The value of LAI was calculated using one sky value and four target values for each family and the parents. The sky value was used as the calibration value, and the average of the four target values was taken as the LAI value for each family and the parents. When measuring, the probe of the analyzer was located at the root of the wheat plant and the lens was kept level, avoiding direct sunlight as much as possible.

2.2.2. Determination of CC

Soil plant analysis development (SPAD) can directly reflect the relative chlorophyll content in leaves [24]. The CC was measured with a chlorophyll meter (SPAD-502 Plus, Minolta, Japan). For each RIL family and parents, five wheat plants at the same growth stage were selected and marked for measurement. The CC value on the flag leaf in the main stem was measured at the wheat growth stages of heading, flowering, and grain filling. The average value of five plants in each RIL family or parent was used as the CC value for the subsequent analysis.

2.3. UAV Image Acquisition and Preprocessing

Wheat plant images were collected using an agriculture drone DJI Phantom 4 (Shenzhen Dajiang Technology Co. Ltd., Shenzhen, China) mounting multispectral camera sensors with customer-specified bandpass filters at wavelengths of 840 nm ± 26 nm, 717 nm ± 16 nm, 668 nm ± 16 nm, 560 nm ± 16 nm, and 475 nm ± 16 nm, corresponding to single-color near-infrared (NIR), red-edge, red, green, and blue bands, respectively (Figure 1). Wheat images were collected during a sunny, windless, and cloudless day on 29 May 2020 (heading), 2 June (flowering), 10 June (filling), and 24 June (maturity). During the data acquisition process, the drone flew autonomously according to the set route and recorded images at the same time. The parameters for flight were set as an altitude of 12 m, speed of 1 m/s, head overlapping of 75%, and side overlapping of 75%. The acquisition time was synchronized with the ground data collection.
Pix4Dmapper software (Version 1.4, Pix4d, Lausanne, Switzerland) (https://pix4d.com/) (accessed on 1 June 2021) was used to stitch and process the acquired UAV multispectral images. Briefly, we used the corresponding ground control point data to correct the multispectral images to generate a digital orthophoto map (DOM). Then, the gray board was used to perform reflectance correction on the multispectral images to obtain the reflectance images of the test site, which were saved in TIF format. Finally, the single-band spectral reflectance images of the four growth periods were cropped by ENVI software (Version 5.1, ENVI, Fort Collins, CO, USA, Exelis Visual Information Solutions) (http://www.exelisvis.com) (accessed on 17 June 2021), and the single-band average reflectance of each center of the wheat plot in the study area was extracted as the spectral reflectance of the plot for the further analysis.

2.4. Selection of Vegetation Index

The combination of changes in the reflectance of different bands constitutes vegetation indices, which can reduce the degree of influence of factors such as background soil on vegetation spectra to a certain extent and improve the accuracy of estimating LAI and CC. In this study, five kinds of spectral reflectance (RNIR, Rred-edge, Rgreen, Rred, and Rblue) were used. Two vegetation indices, normalized difference vegetation index (NDVI) [25] and green normalized difference vegetation index (GNDVI) [15], were used for LAI and CC estimation. NDVI can detect crop vegetation growth status and vegetation cover, while GNDVI can evaluate the photosynthetic activity of crops.
NDVI = (RNIR − Rred)/(RNIR + Rred).
GNDVI = (RNIR − Rgreen/(RNIR + Rgreen).

2.5. Algorithm Development for LAI and CC Estimation

The minimize squared error as a criterion was used for the classification and regression tree (CART) [26] to predict LAI and CC. The algorithmic model was built as follows: X and Y were assumed to be the input and output variables, respectively, for which, Y was a continuous variable for measurement of LAI or CC, and X was {GNDVI, NDVI}. Given a training dataset of D = { ( x 1 , y 1 ) , ( x 2 , y 2 ) , , ( x N , y N ) } , where x i = ( x i ( 1 ) , x i ( 2 ) , , x i ( n ) ) is the eigenvector with n number of features, i = 1 , 2 , , N , and N is the total sample size. The partitioning of the feature space was done heuristically, i.e., each partition examined all the values of all the features in the current set one by one and selected the optimal one as the cutoff point according to the squared error minimization criterion. For example, for the j-th feature variable in the training set with value S as the cutoff variable and cutoff point, R 1 ( j , s ) = { x | x ( j ) s } and R 2 ( j , s ) = { x | x ( j ) > s } were used to find the optimal j and s. Thus, j and s were obtained through Equation (3) by minimizing the sum of squared errors of the two regions divided, where c 1 = a v e r a g e ( y i | x i R 1 ( j , s ) ) , c 2 = a v e r a g e ( y i | x i R 2 ( j , s ) ) . After finding the optimal cutoff point (j, s), the input space was divided into two regions in turn, and then the above division process was repeated for each region until the stopping condition was satisfied. Finally, a regression model was generated.
min j , s [ min c 1 x i R 1 ( j , s ) ( y i c 1 ) 2 + min c 2 x i R 2 ( j , s ) ( y i c 2 ) 2 ] .
In the modeling process, 70% of the samples were selected as the modeling set, and 30% of the samples were selected as the validation set. The Kennard–Stone (KS) [27] method was used in the modeling set. The accuracy of the cross-validation procedure was evaluated by the coefficient of determination (R2), root-mean-square error (RMSE), and relative error (RE). The formulas of these statistics are shown below.
R 2 = i = 1 n ( y i ^ y ) 2 i = 1 n ( y i y ) 2 ,
RMSE = i = 1 n ( y i ^ y i ) 2 n ,
RE = i = 1 n | y i y i ^ y i | n ,
where y i ^ is the predicted value of LAI or CC, y i is the measured value of LAI or CC, y is the average value of LAI or CC, and n is the number of verification samples.

2.6. Data Analysis

For the experimental area, we had two replicates, one repetition for model building and evaluation and the other for application of the model. The statistics of all data were implemented in Spyder using Python 3.8.8 on a workstation with an Intel i7-6800 K 3.40 GHz CPU, 16 GB memory, and Nvidia GeForce GTX 2080Ti graphics, running the Win10 operating system. Software Pandas 1.3.2 (Greenwich, CT, USA), Matplotlib 3.4.2 (Washington, DC, USA), Scikit-Learn 0.24.2 (Paris, France), and SPSS 21.0 (Chicago, IL, USA) were applied for statistical analysis, correlation analysis, and the significance of differences test for wheat LAI and CC. In addition, the generalized heritability was calculated using the following equation:
h 2 = δ G 2 δ G 2 + δ G E 2 r + δ E 2 n r ,
where δ G 2 is the genetic variance, δ G E 2 is the genotype × treatment interaction variance, δ E 2 is the error variance, n is the number of treatments, and r is the number of replications.

2.7. QTL Mapping of LAI and CC and Candidate Gene Identification

The linkage maps of this population were constructed using a wheat 50K SNP array in the previous study [23], which consisted of 28 linkage groups with 11,375 SNPs and 2220.26 cM in length, with an average of 1.38 cM per bin marker pair. For each trait of LAI and CC, the mean values of each F6 RIL from two replicates were used for descriptive statistics. QTL analysis was performed using inclusive composite interval mapping (ICIM) in the software QTL IciMapping V4.1 (http://www.isbreeding.net/) (accessed on 5 June 2021). The walking speed for genome scanning was 1.00 cM, with p = 0.001 in stepwise regression. Significant LOD thresholds were evaluated using 1000 permutations tests with type I error set at 0.05. QTLs were named following the rules of International Rules of Genetic Nomenclature (https://wheat.pw.usda.gov/ggpages/wgc/98/Intro.htm) (accessed on 12 June 2021); ‘xjau’ represents Xinjiang Agricultural University.
To predict candidate genes involved in QTL for LAI- and CC-related traits from this study, we searched the QTL flanking markers in the wheat reference genome. First, the sequences of the closest markers of the QTL were blasted against the genome sequences of wheat Chinese Spring in CSS database (IWGSC RefSeq v2.0, https://urgi.versailles.inra.fr/blast_iwgsc/blast.php) (accessed on 7 June 2021), and their physical intervals on the reference genome sequences were identified. Then, for each QTL, the annotations of genes delimited by SNP marker intervals were obtained in EnsemblePlants (http://plants.ensembl.org/index.html) (accessed on 11 June 2021), and the wheat transcriptional expression database was investigated in the Triticeae Multi-omics Center (http://202.194.139.32/expression/index.html) (accessed on 14 June 2021).

3. Results

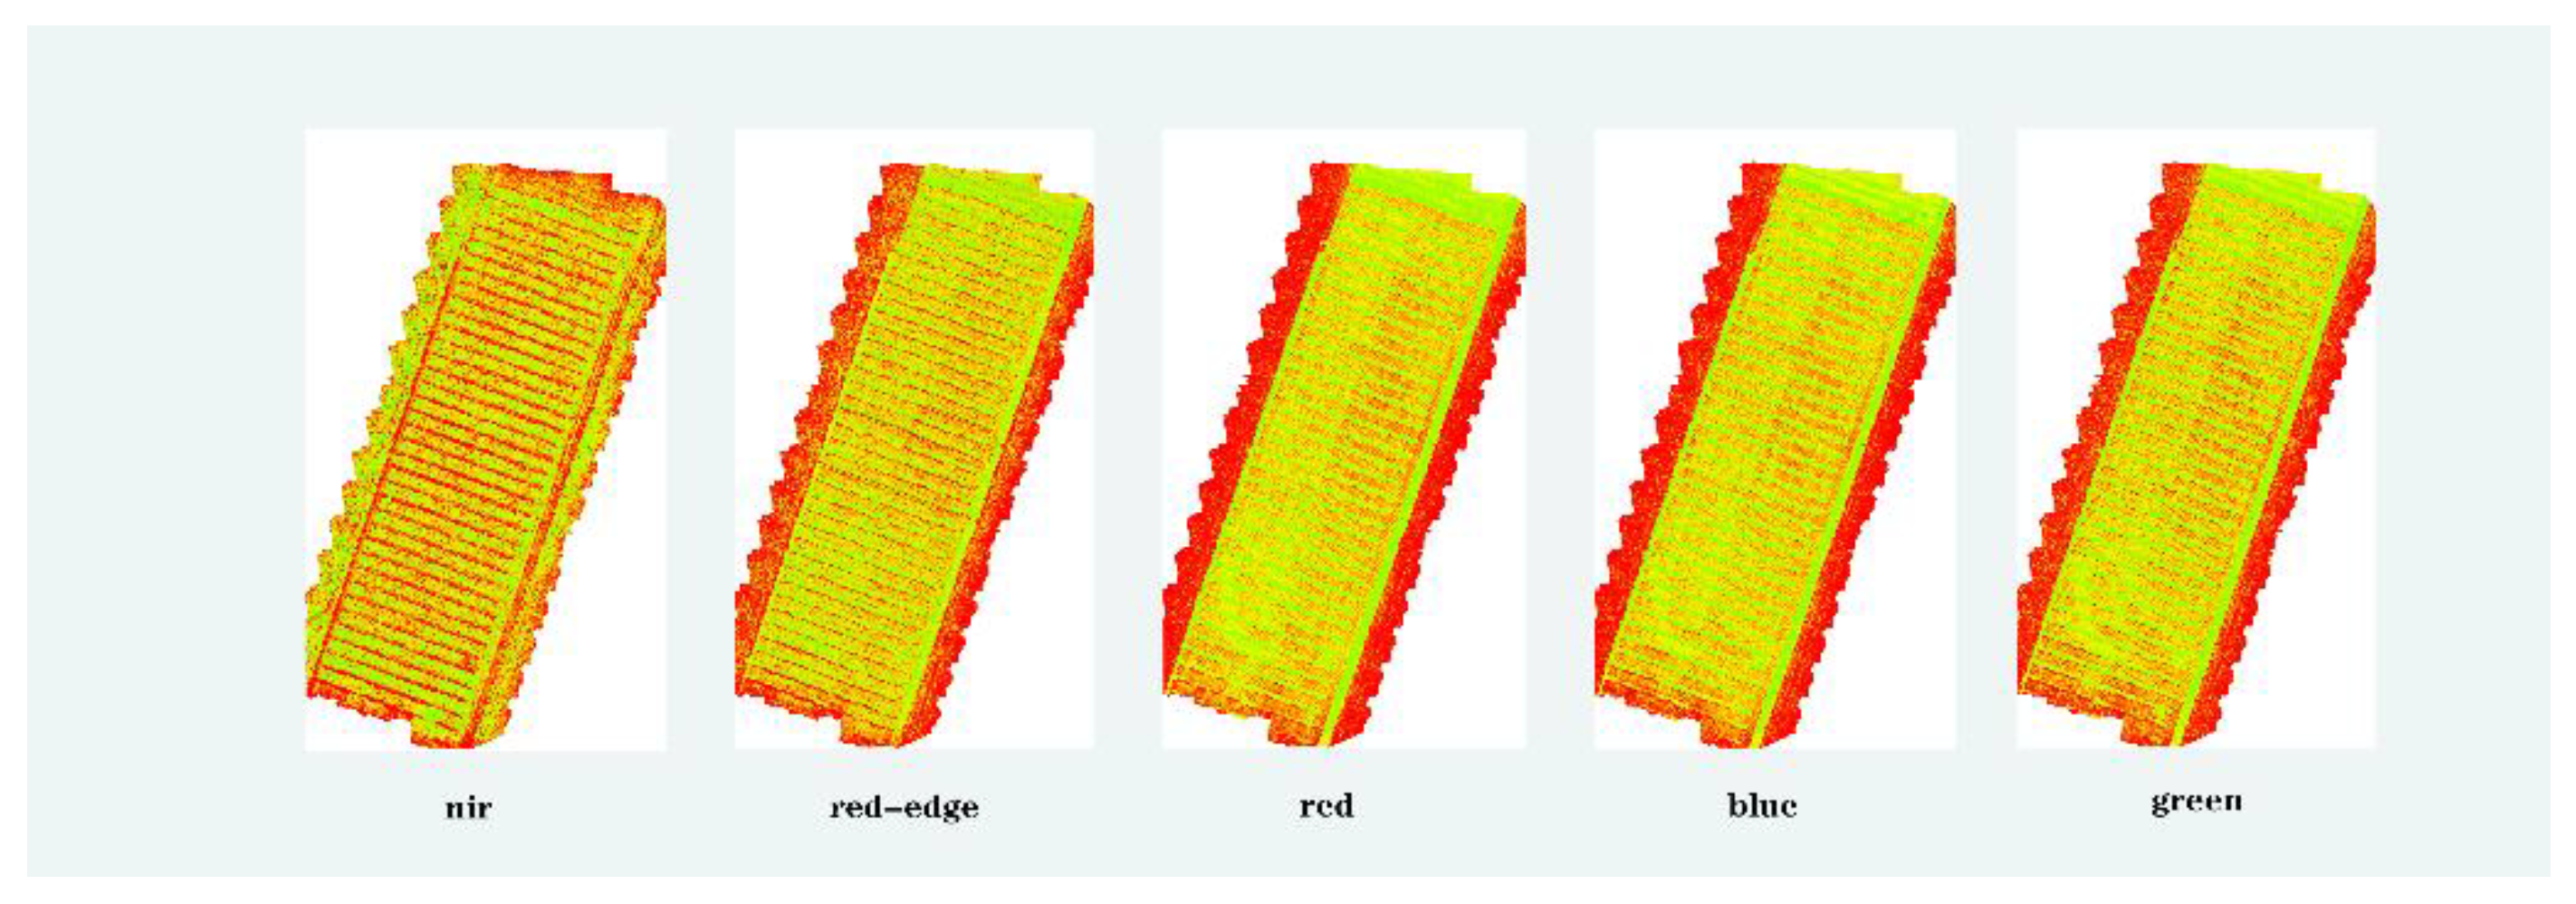
3.1. Multispectral Analysis of Reflectance

The reflectance of five lights (NIR, red-edge, green, red, blue) on wheat plants was compared at the heading, flowering, filling, and maturity stages under normal irrigation (NI) and drought stress (DS) conditions (Table 1).
Different growth stages for LAI and CC were studied. We focused on the flowering, filling, and maturation stages of wheat for LAI and heading, flowering, and grain filling stages for CC. The reflectance changes of the five bands corresponding to wheat LAI were obviously different. Under two water supply treatments, the order of single-spectral reflectance of each growth period was as follows: NIR > Red-edge > green > red > blue. For the normal irrigation treatment, the spectral reflectance of single light was 0.26–0.37 (SD 0.03) in the NIR band, 0.25–0.28 (SD 0.02–0.03) in the red-edge light band, 0.07–0.09 (SE 0.01) in the green light band, 0.05–0.10 (SD 0.01–0.02) in the red light band, and 0.04–0.04 (SD 0.01) in the blue light band. For the drought stress treatment, the spectral reflectance of single light was 0.28–0.32 (SD 0.02–0.03) in the NIR band, 0.29–0.30 (SD 0.02) in the red-edge light band, 0.09–0.10 (SD 0.01–0.02) in the green light band, 0.08–0.14 (SD 0.02–0.04) in the red light band, and 0.05–0.06 (SD 0.01–0.03) in the blue light band. Comparing the two water supply treatments, the values of LAI under drought stress were extremely lower than those under normal irrigation, and the five spectral reflectance values under drought stress were generally greater than those under normal irrigation. The reason could be drought stress reduced effective leaf area for light exposure.
The single-spectral reflectance of wheat CC under normal irrigation was 0.36–0.37 (SD 0.03) for NIR light, 0.25–0.29 (SD 0.03) for red-edge side light, 0.07 (SD 0.01) for green light, 0.05–0.06 (SD 0.01) for red light, and 0.04 (SD 0.01) for blue light. The single-spectral reflectance of wheat CC under drought stress was 0.30–0.33 (SD 0.02–0.03) for NIR light, 0.27–0.28 (SD 0.02) for red-edge light, 0.08–0.10 (SD 0.01–0.02) for green light, 0.07–0.11 (SD 0.02–0.04) for red light, and 0.04–0.06 (SD 0.01–0.03) for blue light. Under the two water supply treatments, the values of spectral reflectance were gradually decreased in the following order: NIR > red-edge > green > red > blue; however, the reflectance of the blue, red, and green light bands in the normal irrigation treatment were higher than that under drought stress. With the increase in CC under normal irrigation, the reflectance of the green light, red light, and blue light bands showed a slight upward trend, whereas the red-edge and NIR bands increased first and then decreased. Under drought stress, the red-edge band showed an upward trend, while the NIR band showed an increase first and then decreased. Under the two water treatments, the reflectance of the NIR band and the blue band was the highest and the lowest, respectively.

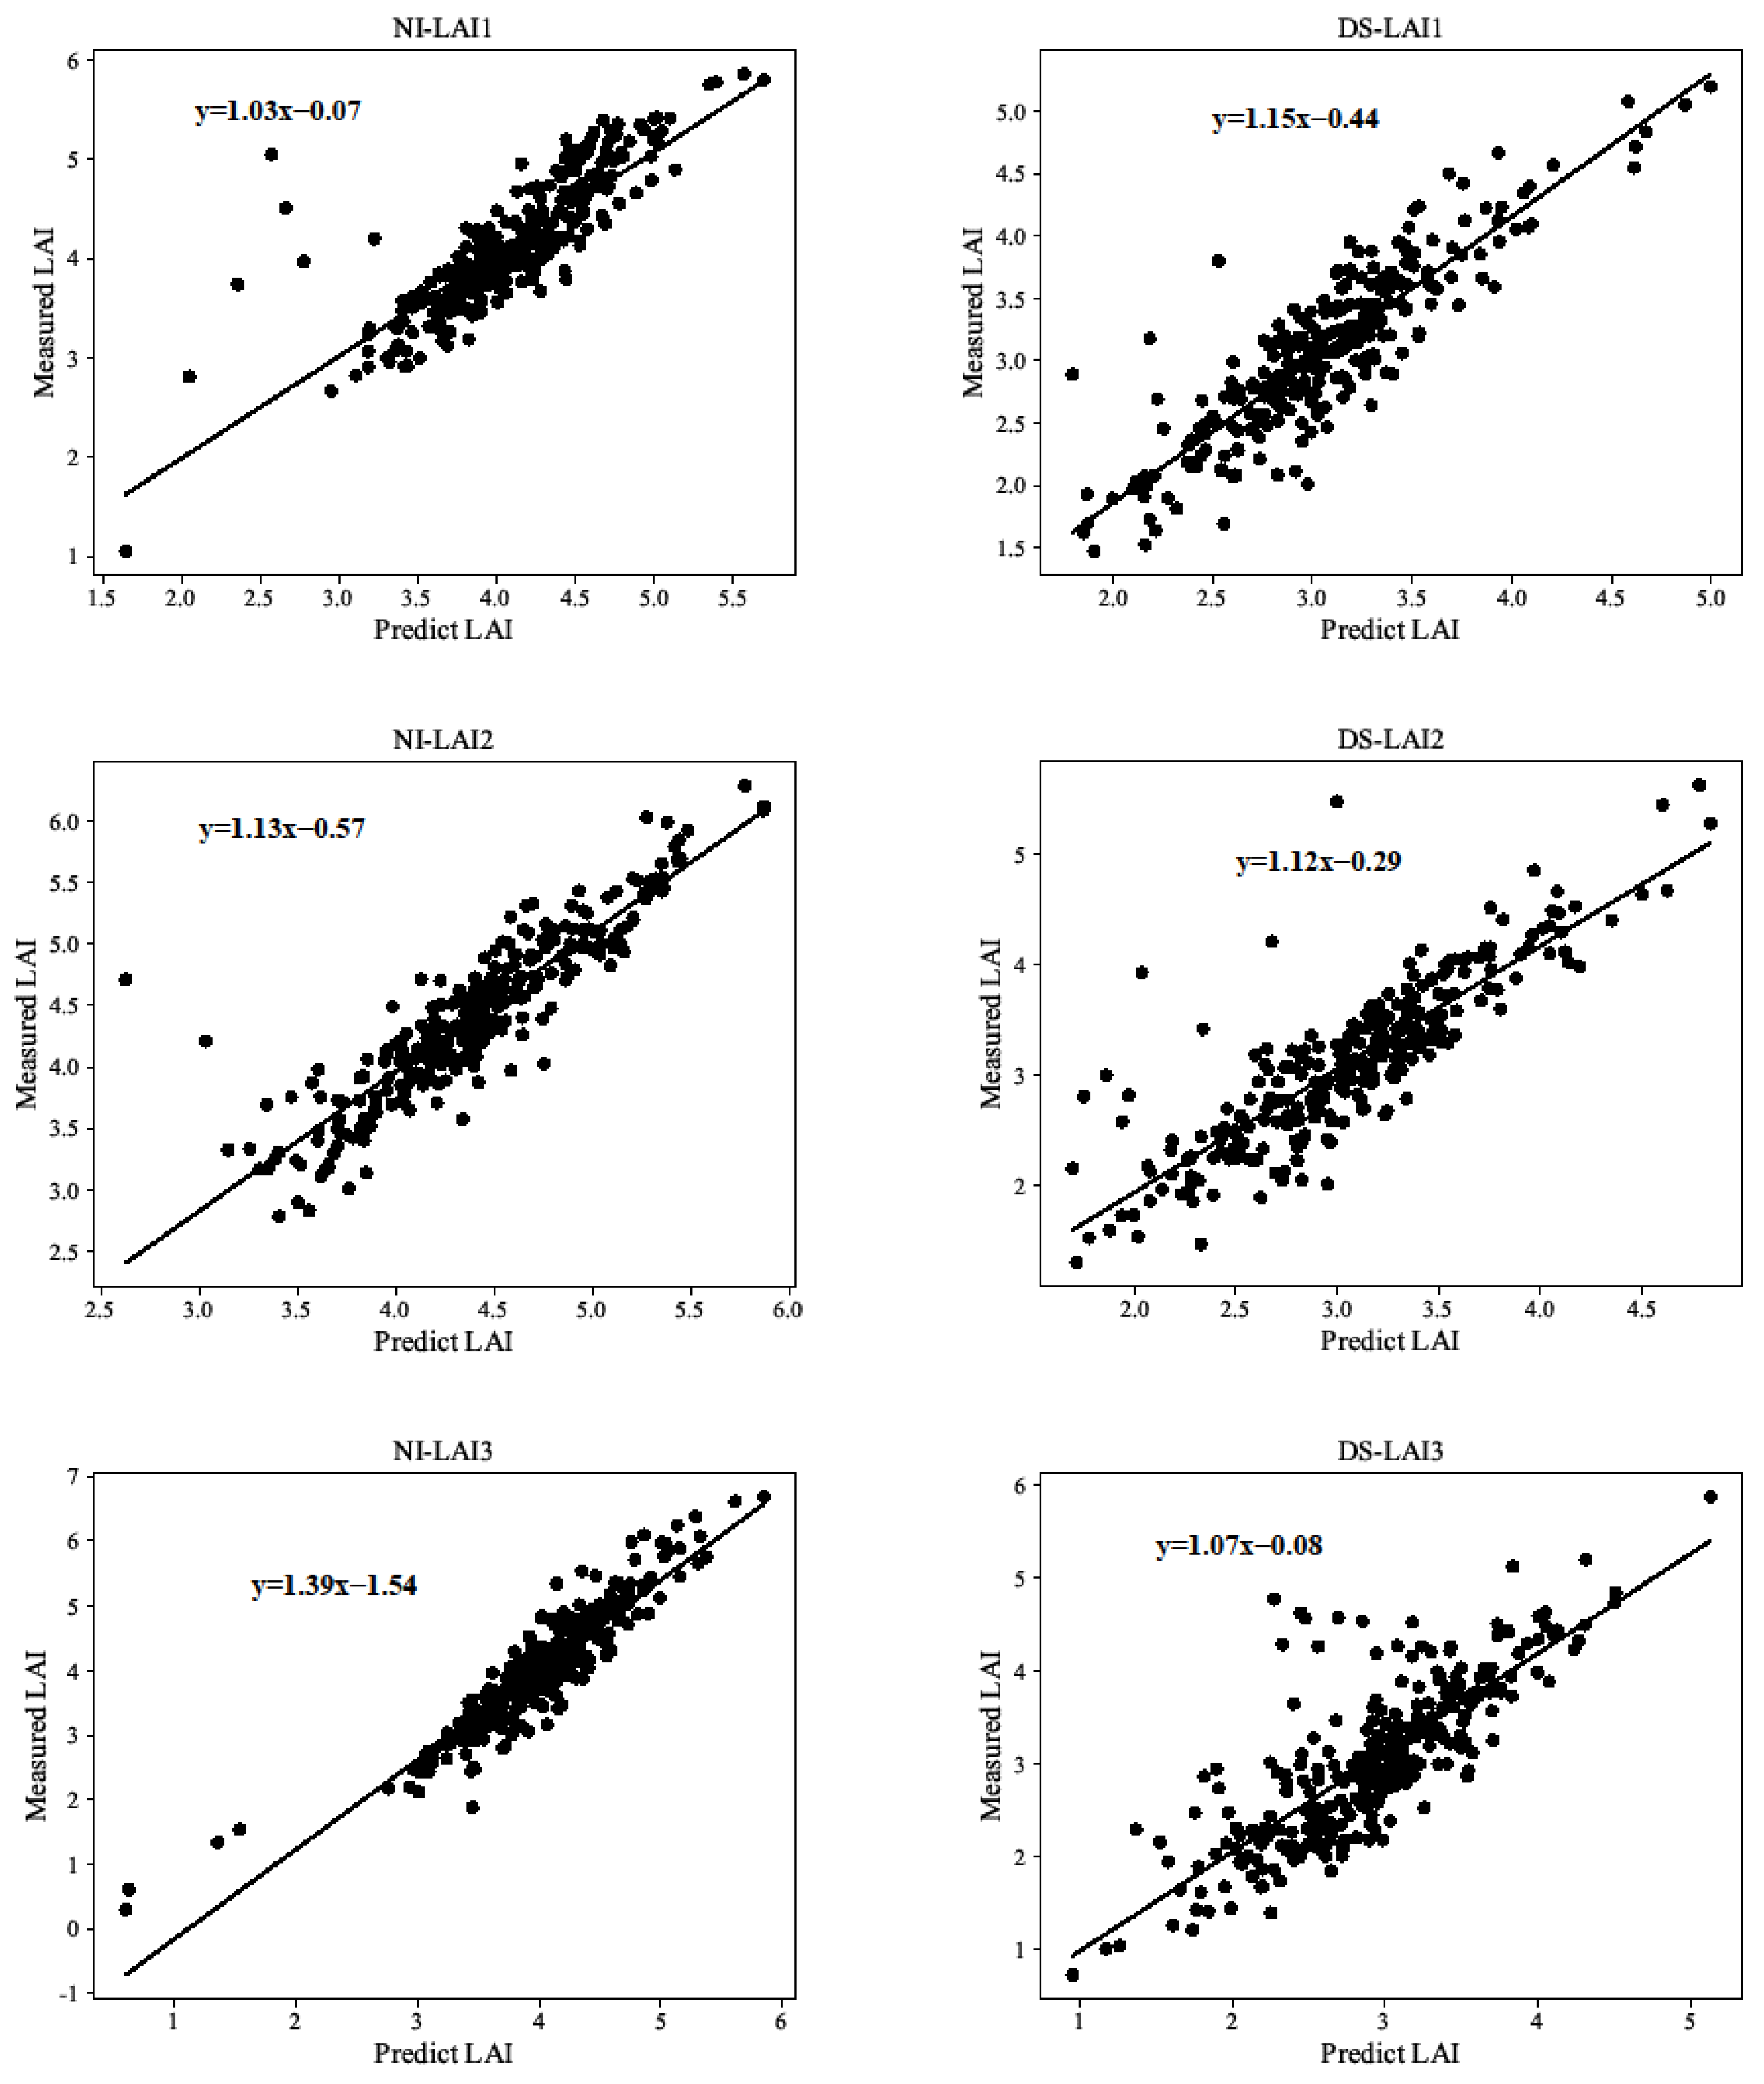
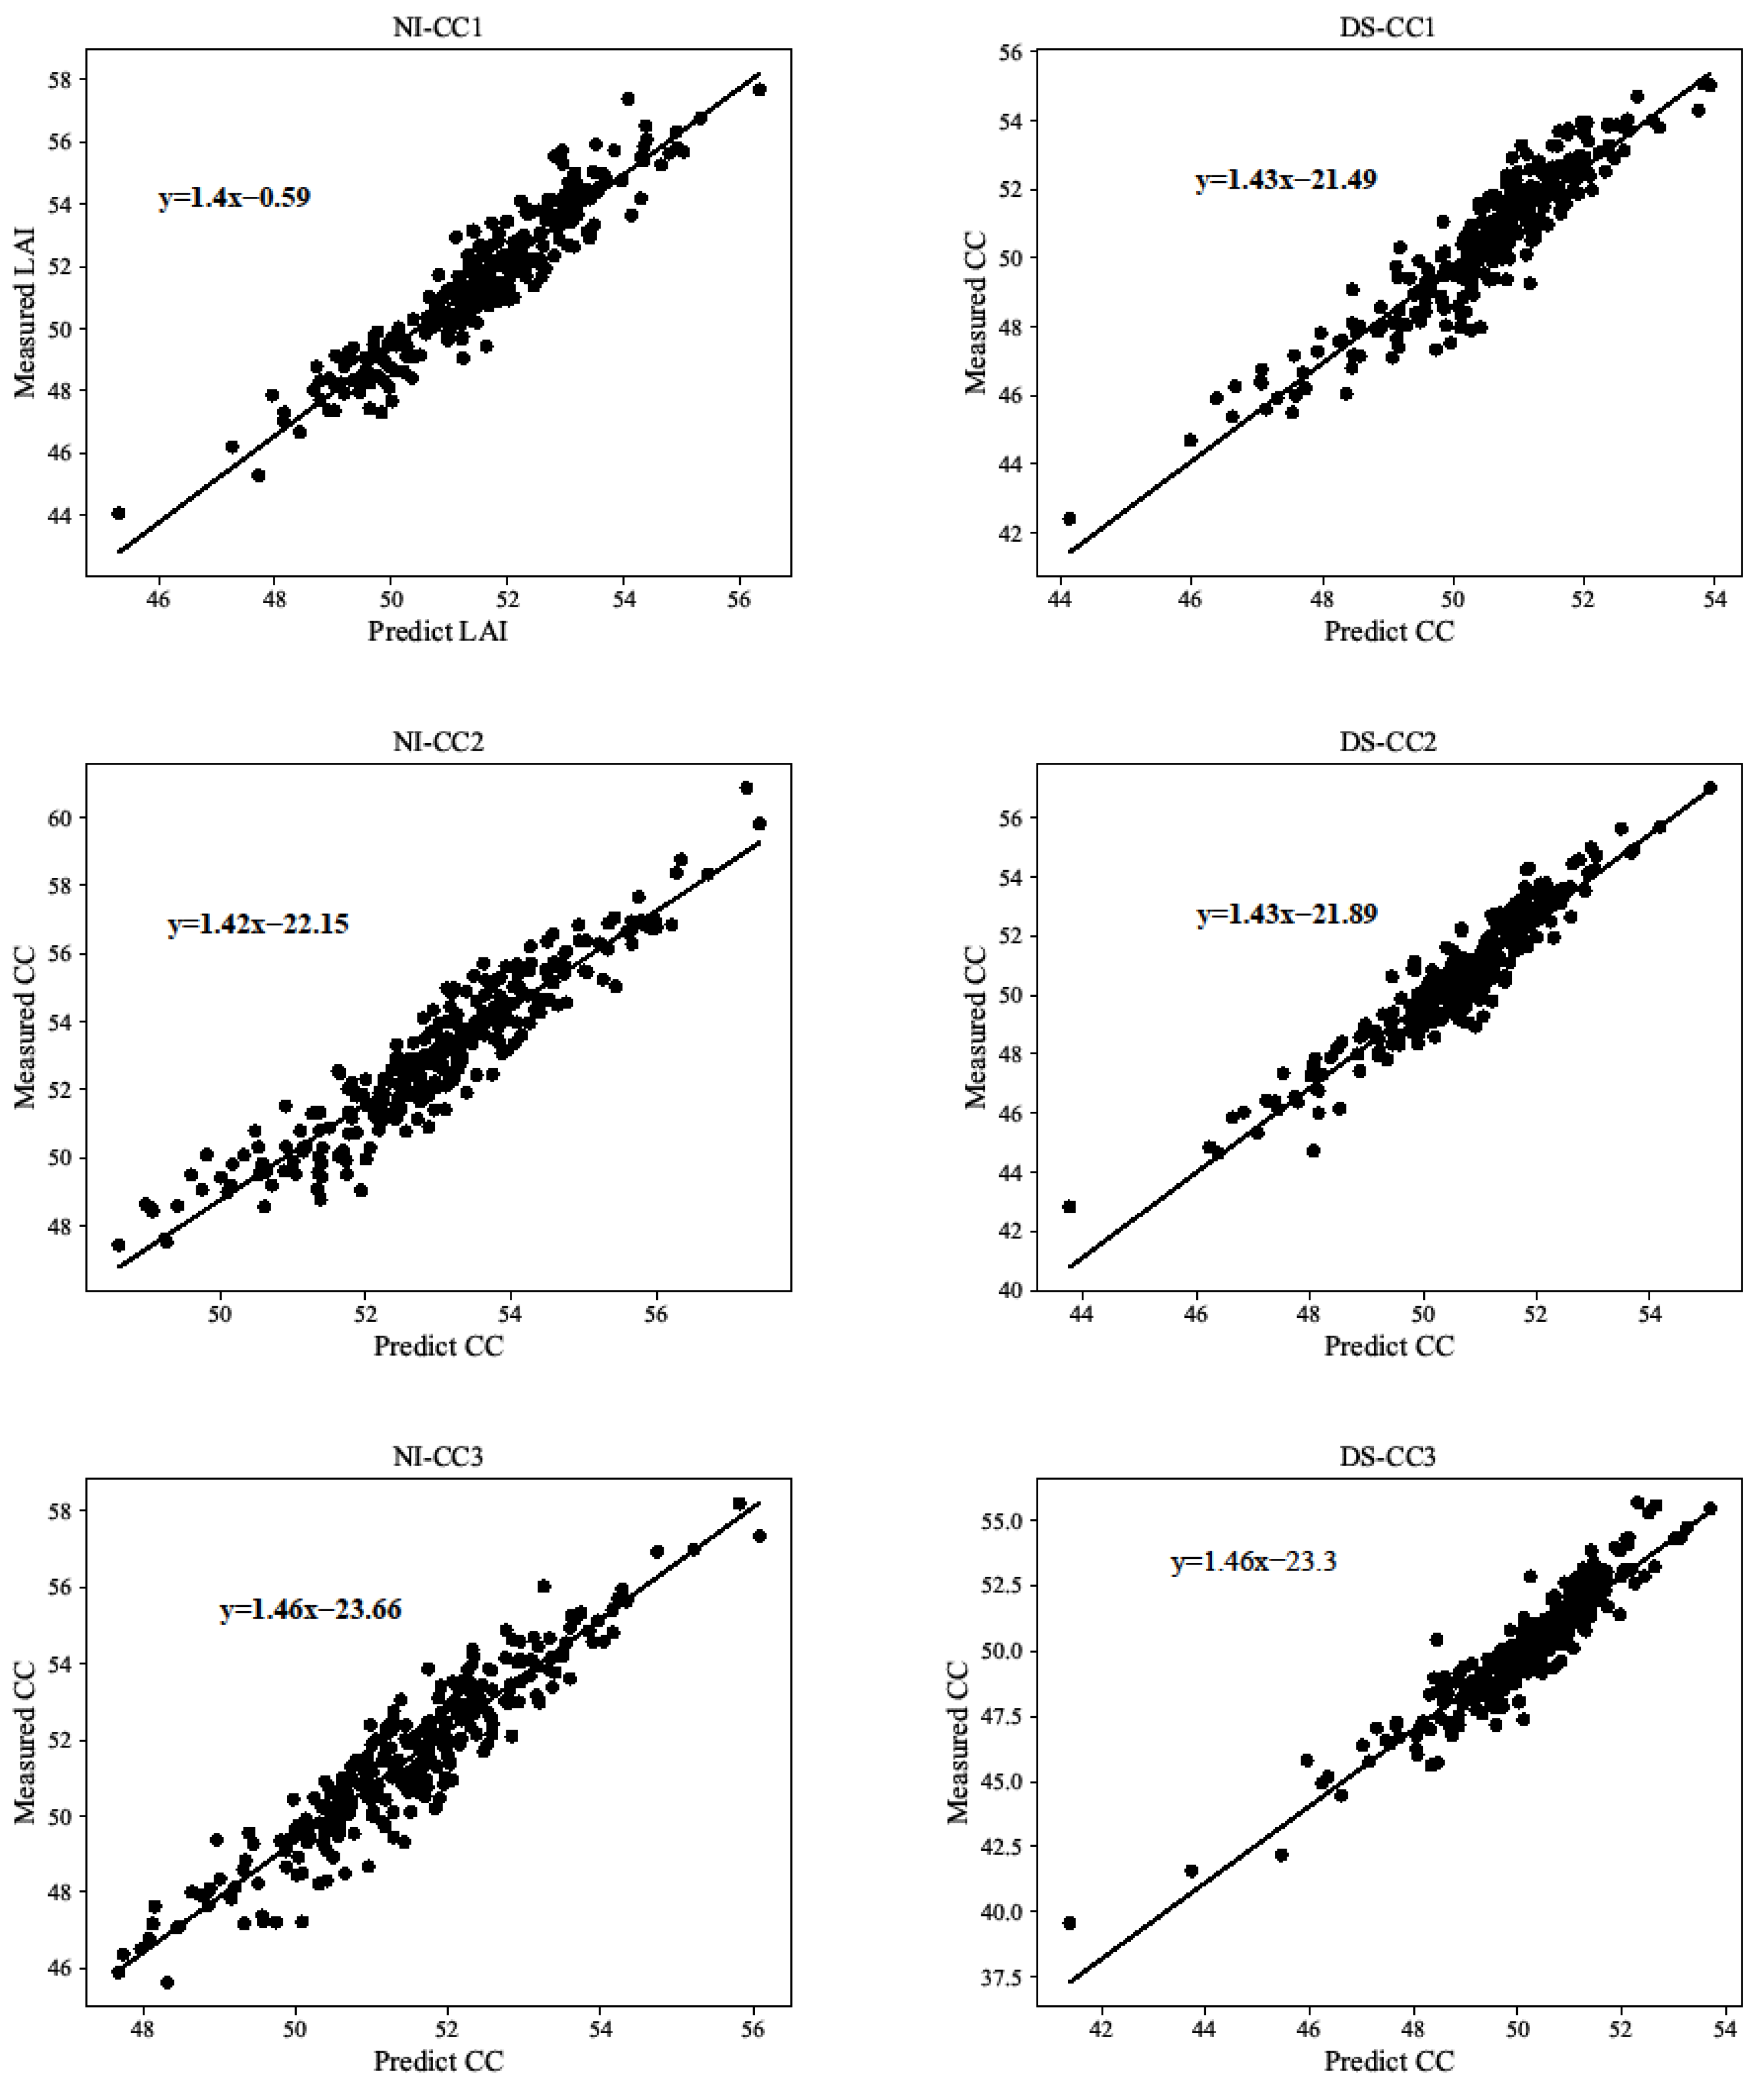
3.2. Estimation of LAI and CC by CART Modeling Verification Analysis

LAI and CC were estimated using the CART model, and its accuracy was evaluated by the determination coefficient (R2), root-mean-square error (RMSE), and relative error (RE) (Table 2, Figure 2 and Figure 3). GNDVI and NDVI with high correlation coefficients were employed for LAI and CC estimation modeling, and we randomly selected 70% of the data for model building and 30% of the data for model validation. For LAI, the estimated values and measured values were positively correlated with a high coefficient (Table 2, Figure 2). Under normal irrigation conditions, the correlation was increased from the flowering to maturity stage, and a higher correlation was observed at the maturity stage with measured LAI > 2.0 (Figure 2). Under drought stress conditions, a similar positive correlation was found between predicted and measured values of LAI at the three growth stages, although the coefficient was slightly decreased after the flowering stage (Figure 2).
The relationship between predicted and measured values of CC also had a positive correlation (Table 2, Figure 3). High coefficients (between 0.86 and 0.88) and low relative errors (between 0.01 and 0.02) were found between the predicted and measured values at the three growth stages under both normal irrigation and drought stress conditions (Table 2).
Overall, the high R2 and low RE values from the above results indicated the feasibility of predicting LAI and CC under different water treatments and different growth periods using CART algorithm modeling.

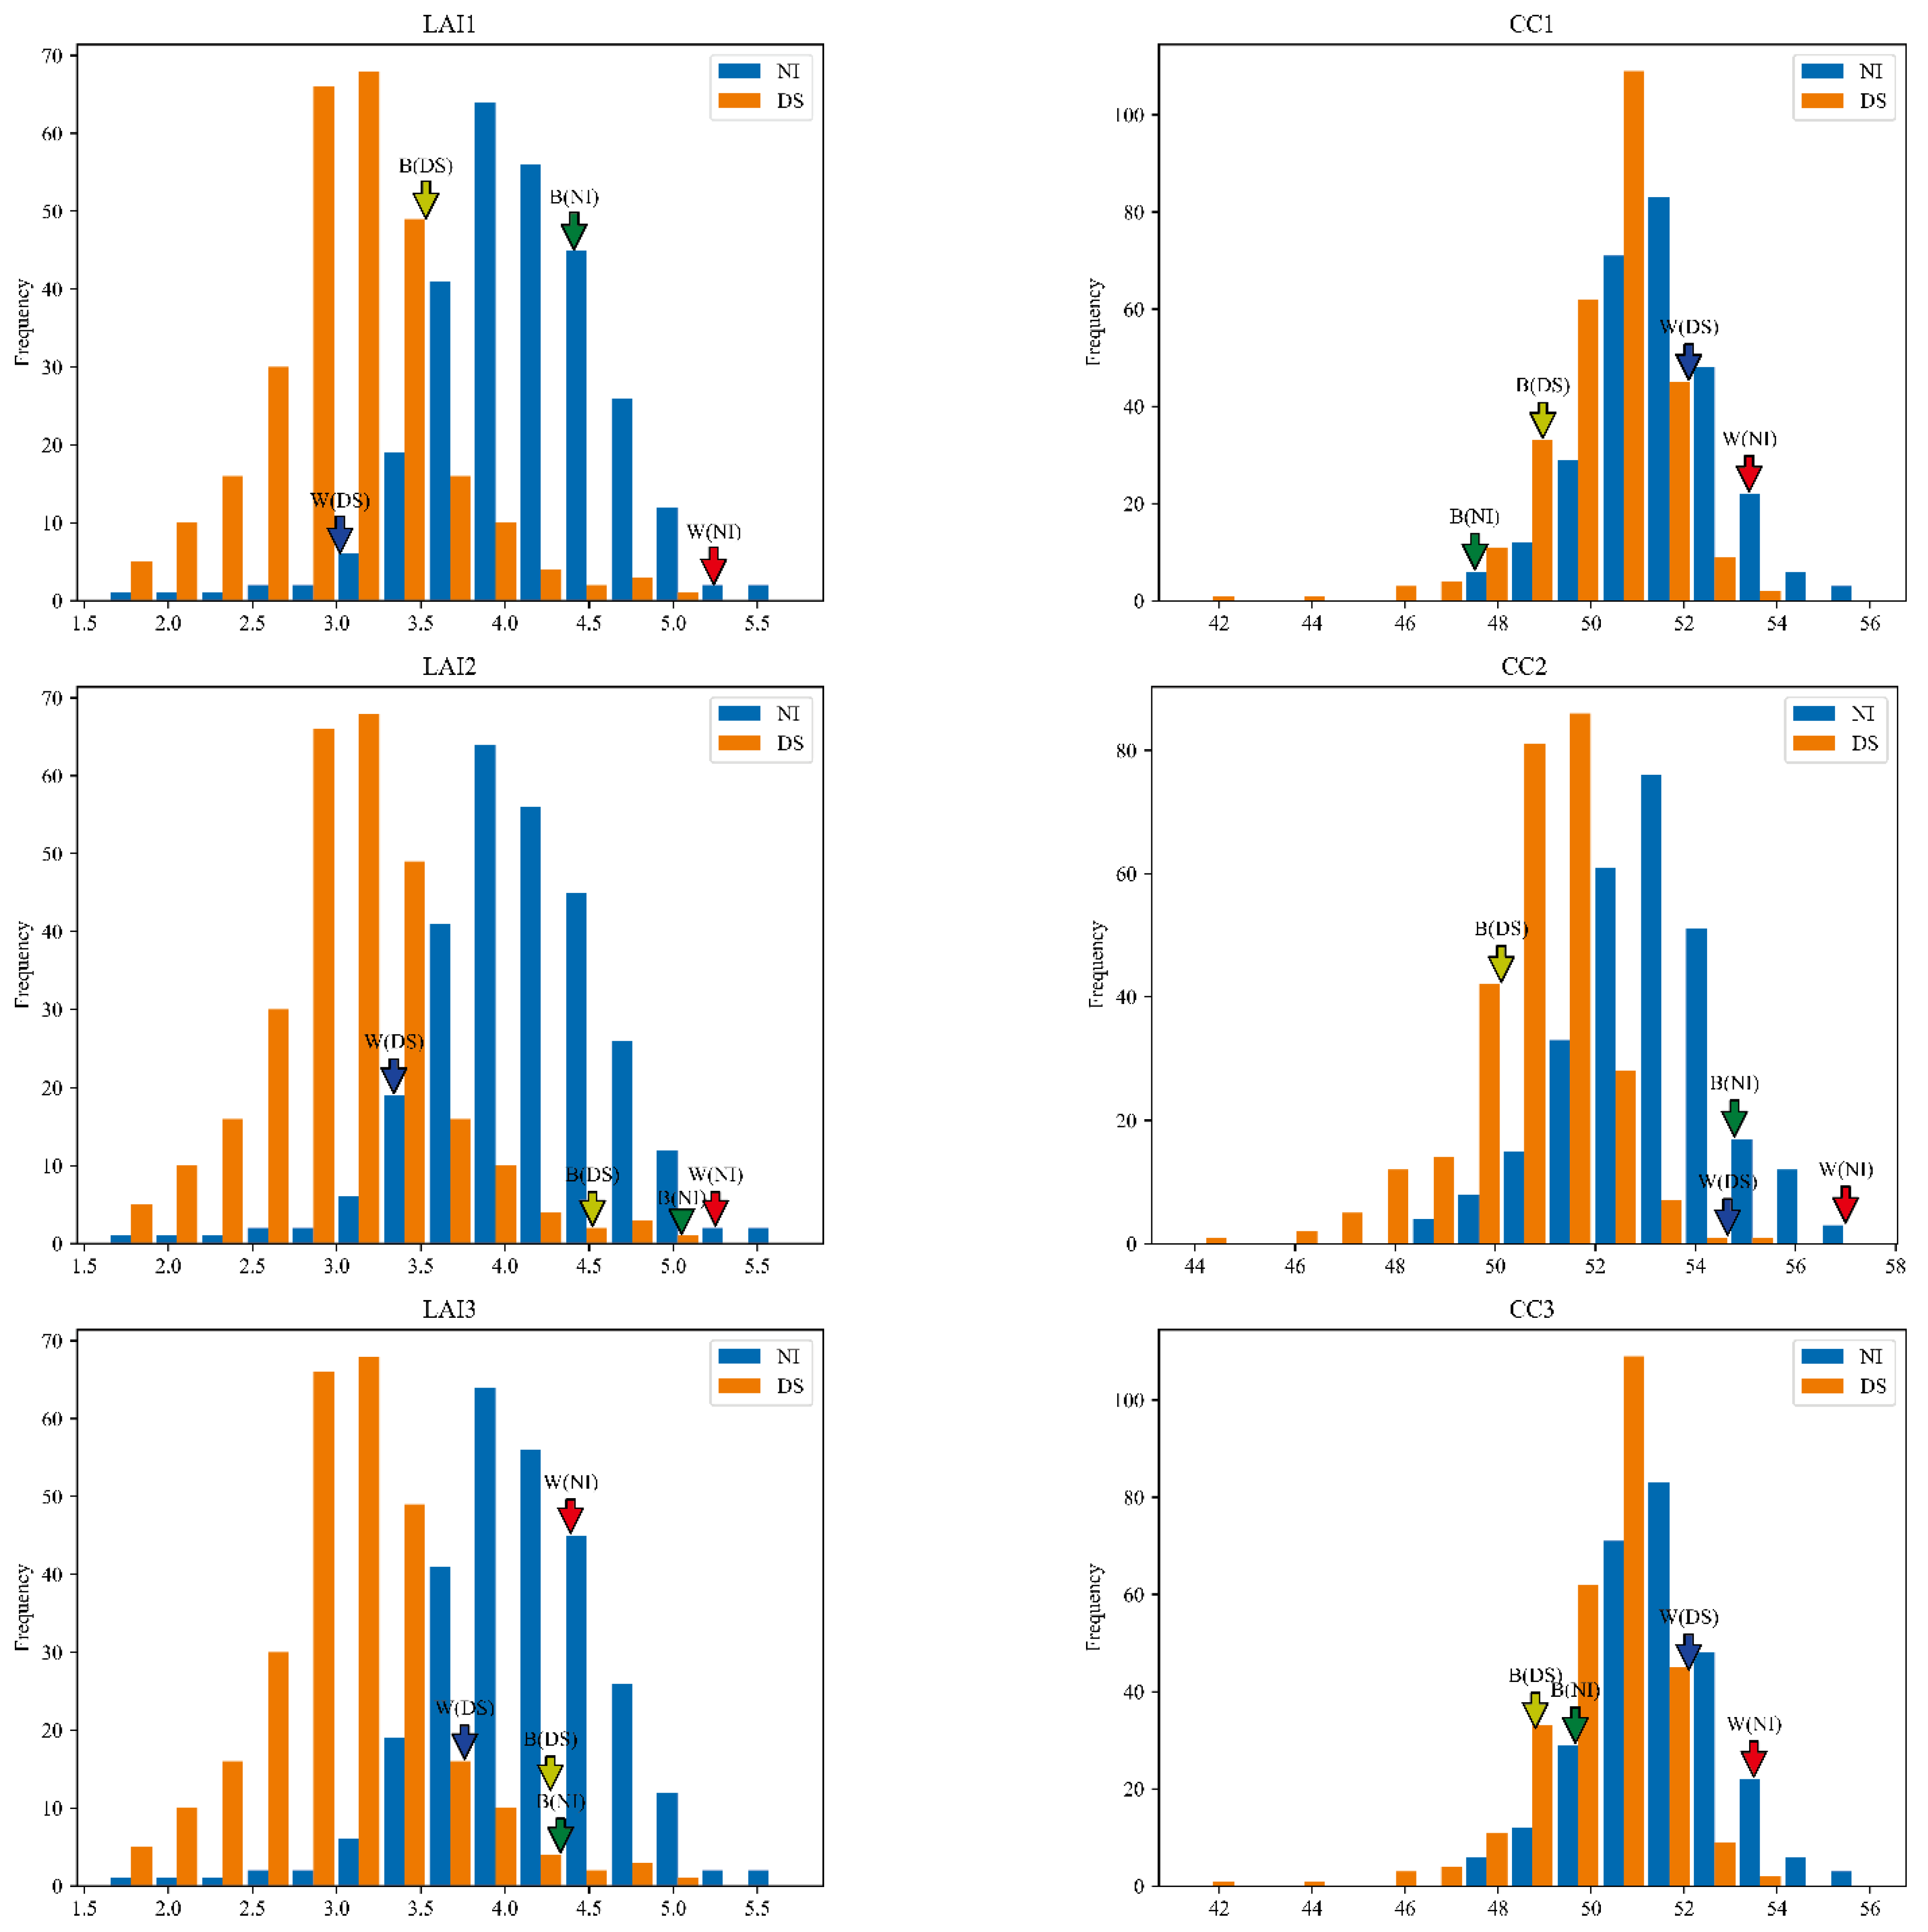
3.3. Genetic Variation of LAI and CC in Wheat RIL Population

The RIL populations showed some differences in LAI and CC at different growth stages under normal irrigation and drought stress (Table 3). Compared with the normal irrigation treatment, the LAI and CC of parent Worrakatta showed a decreasing trend under drought stress at different fertility stages, while parent Berkut showed a relatively stable performance. This shows that parent Berkut was better able to maintain a more stable LAI, as well as a good green holding capacity, under drought stress. Compared with the normal irrigation treatment, the LAI and CC of the RIL population showed a highly significant decrease in different fertility periods under drought stress, indicating that both LAI and CC were sensitive to drought stress. Under both treatments, LAI and CC of the RIL population showed a continuous distribution and wide range at different fertility periods and in the presence of super parental segregation, indicating that this population was suitable for QTL localization analysis. The broad-sense heritabilities of LAI and CC were both high, ranging from 69% to 75% and from 74% to 81%, respectively. This indicated that the phenotypic differences of these two traits were strongly influenced by genetic factors.
Under normal irrigation, the mean LAI of the RIL population ranged from 3.85 to 4.39, with the variation ranging from 2.24 to 6.29, and the CV ranging from 14.9% to 19.9%; the value of mean LAI reached its maximum (4.39) at the filling stage. The mean value ranged from 2.91 to 3.07, with the variation ranging from 1.01 to 5.08, and the CV ranging from 21.0% to 28.2%; the mean value LAI reached its maximum (3.07) at the flowering stage under drought stress. This result showed that drought stress could promote an increase in LAI in a short period of time; however, if the wheat in the field was under long-term drought stress, wheat growth and development were hindered and LAI decreased, which reduced wheat yield.
Under normal irrigation, the mean CC values of the RIL population ranged from 51.31 to 53.10, with the variation ranging from 44.06 to 60.86, and the CV ranging from 4.1% to 4.5%. The mean values ranged from 50.34 to 51.19, with the variation ranging from 39.57 to 57.08, and the CV ranging from 3.9% to 4.2% under drought stress. Under both treatments, the mean CC value reached its maximum at the flowering stage.

3.4. Genetic Variation of Predicted LAI and CC in Wheat RIL Population

The variations of predicted LAI and CC among parents and RIL populations were observed in different growth periods and under different water treatments (Table 4, Figure 4). The values of LAI and CC for parental cultivar Berkut were significantly higher (p < 0.001) than those for Worrakatta at all growth stages under drought stress treatments (Table 4). The estimated values of LAI and CC in the RIL population showed a normal distribution at all growth stages and under different water treatments (Figure 4), indicating that LAI and CC are quantitative traits controlled by multiple genes. The frequency distributions of LAI at the flowering and maturity stages were consistent under normal irrigation or drought stress; however, at the filling stage, the mean values under drought stress were lower than those under normal irrigation conditions (Figure 4, LAI2). For CC, the frequency distributions under drought stress conditions tended to shift to the left, with lower values than those under normal irrigation conditions at all three growth stages (Figure 4). The values of LAI and CC in the RIL population decreased at all growth stages under drought stress compared with normal irrigation conditions, and the heritability of LAI ranged from 57% to 93%, while that of CC ranged from 64% to 80% (Table 4).
A high positive correlation was detected between predicted and measured values for both LAI and CC at different wheat growth stages under two different treatments (Table 5). The correlation coefficient of CC was consistently 0.94 at three wheat growth stages under the normal irrigation treatment, while it was between 0.93 and 0.94 under the drought stress treatment (Table 5). The correlation coefficient of LAI was between 0.83 and 0.92 from the flowering to mature stage under normal irrigation, while it was between 0.80 and 0.88 under drought stress (Table 5).

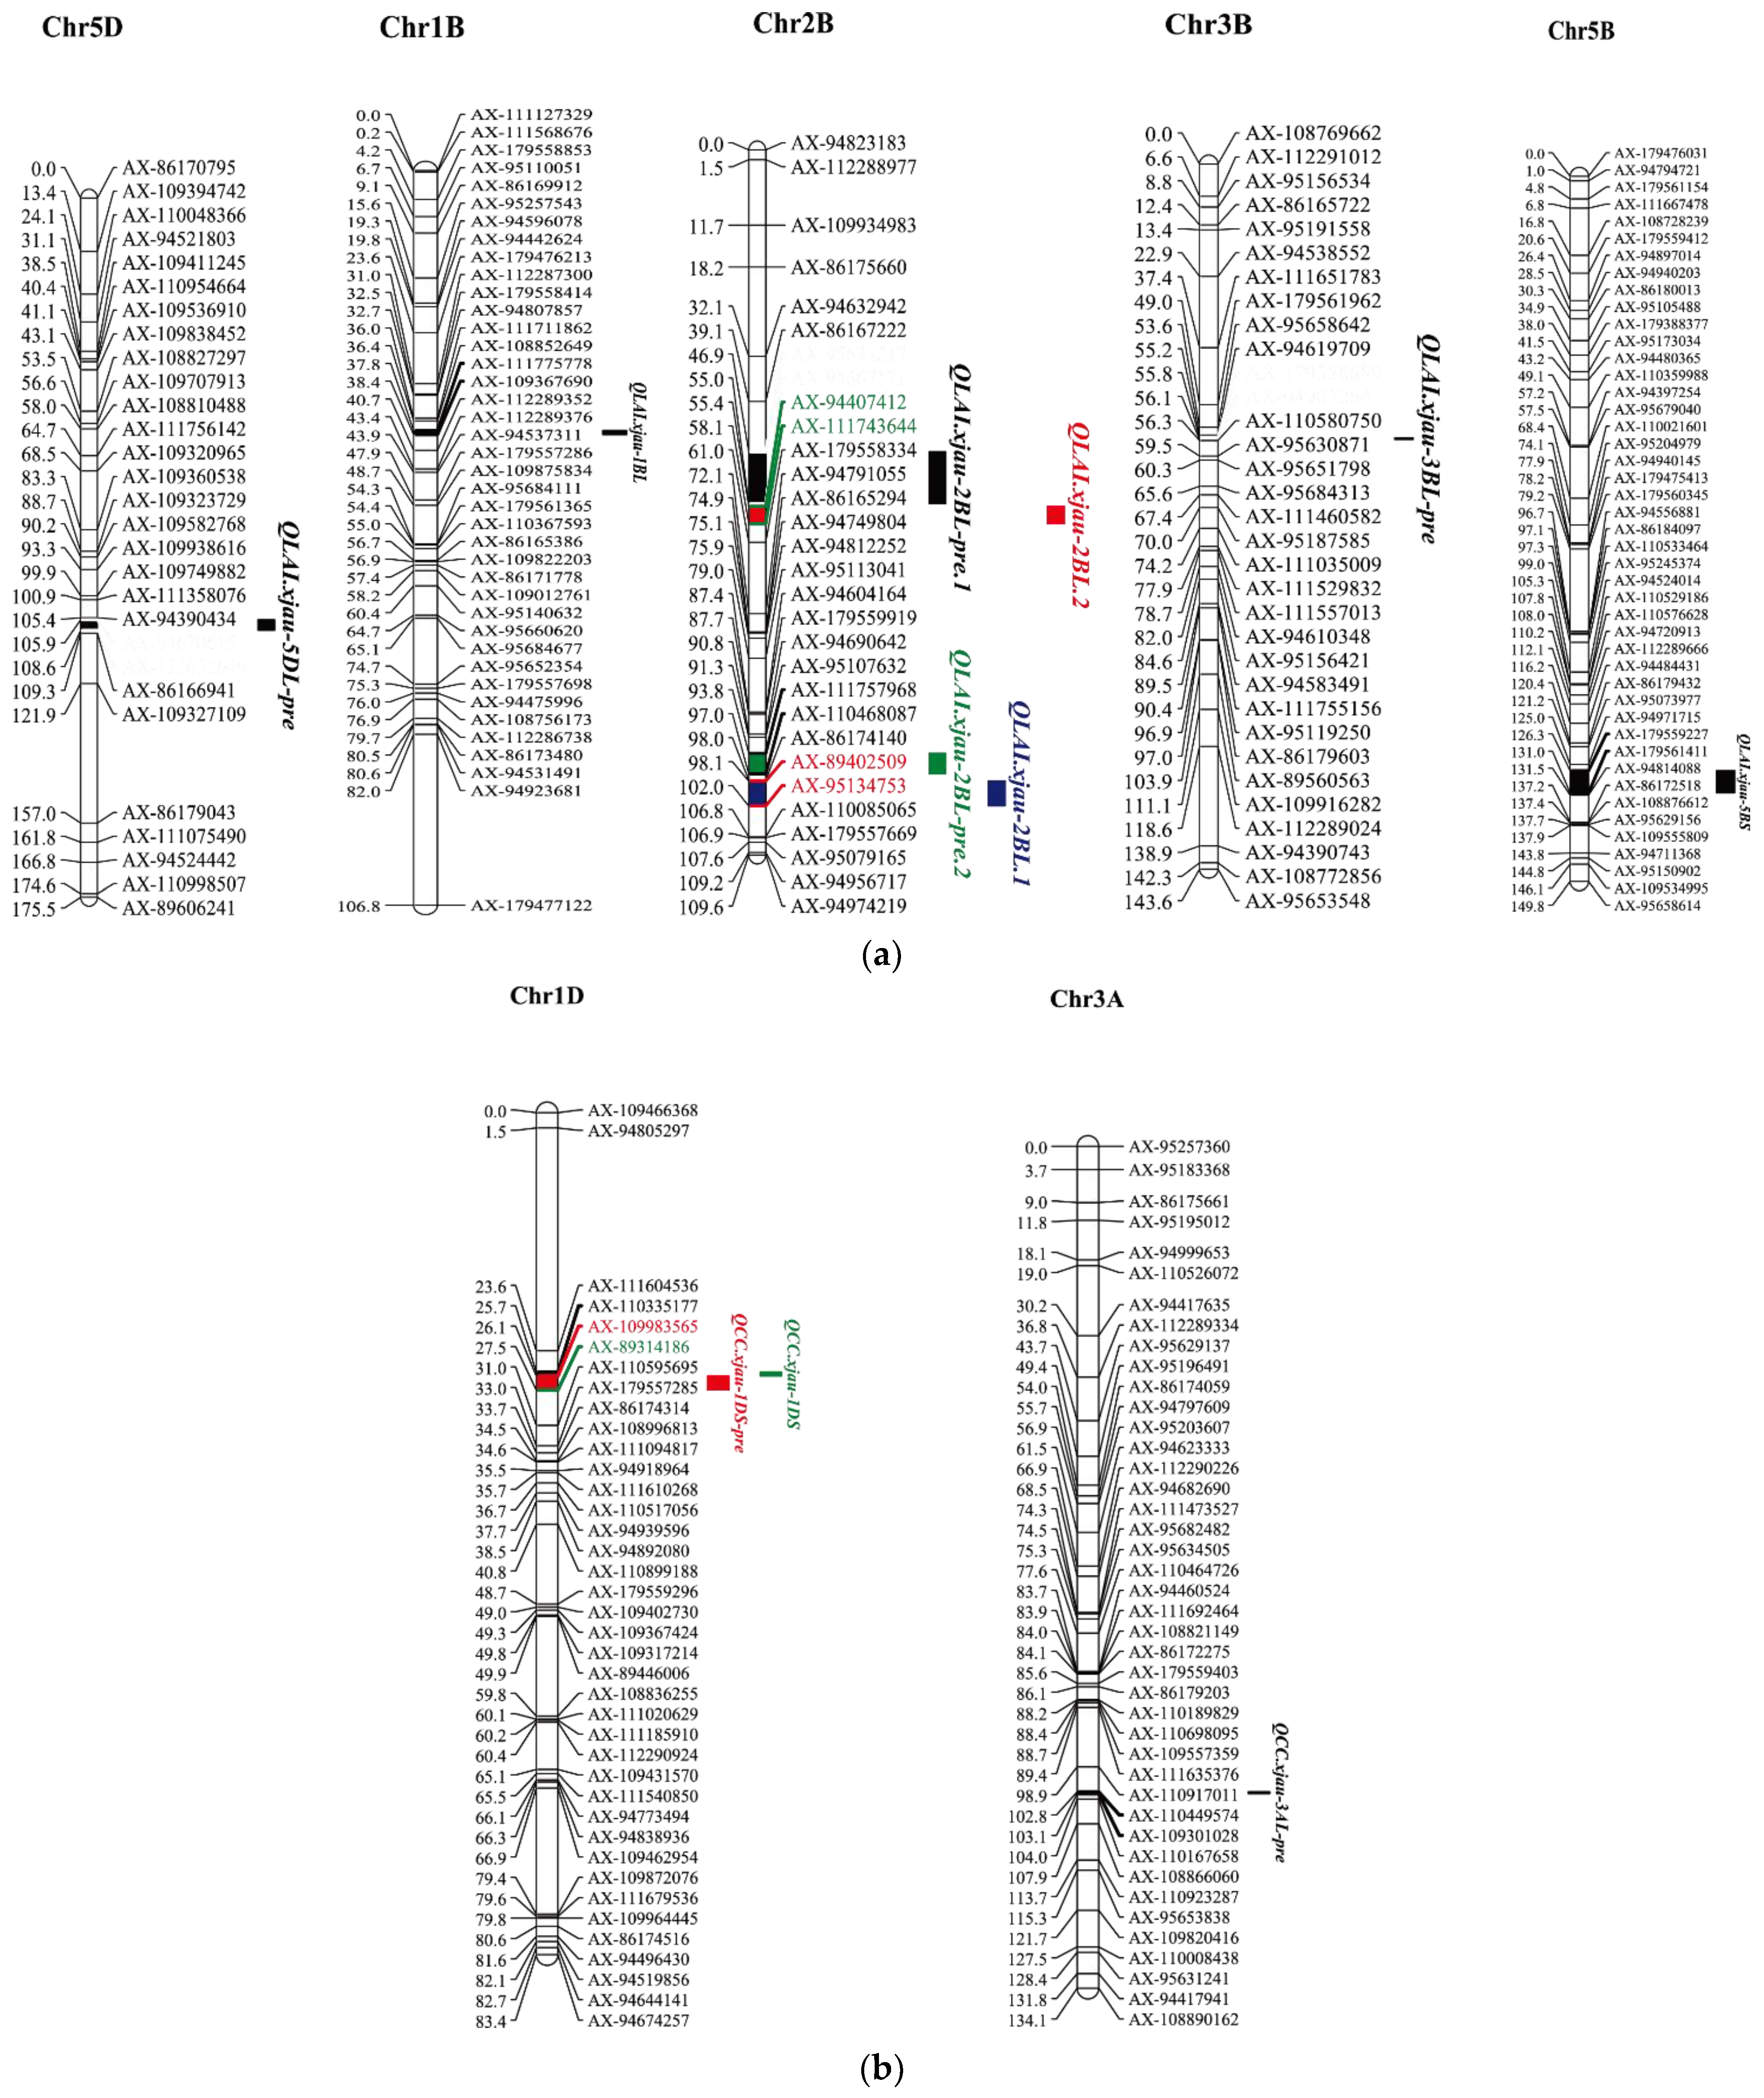
3.5. QTL Mapping of LAI and CC

The genetic map of the RIL population consisted of 28 linkage groups including 11,375 SNP markers [23]. Using the complete interval QTL mapping method, eight QTLs for LAI and three QTLs for CC were mapped on nine chromosomal regions, with three QTLs on chromosome 2BL and one each on 1BL, 1DS, 3AL, 3BL, 5BS, and 5DL. Each QTL explained the phenotypic variation for LAI from 2.5% to 13.8% and for CC from 2.5% to 5.8%. Eight QTLs had positive additive effect values, indicating that the synergistic alleles at these loci derived from the parent Berkut, while two QTLs had negative values, indicating that the synergistic alleles at these loci derived from the parent Worrakatta (Table 6, Figure 5).
Among the eight QTLs for LAI, four QTLs, QLAI.xjau-2BL-pre.1, QLAI.xjau-2BL-pre.2, QLAI.xjau-3BL-pre, and QLAI.xjau-5DL-pre, were detected on the basis of predicted LAI values and four QTLs, QLAI.xjau-1BL, QLAI.xjau-2BL.1, QLAI.xjau-2BL.2, and QLAI.xjau-5BS, were detected on the basis of ground-measured values. QLAI.xjau-5DL-pre was detected at both filling and maturity stages, accounting for 3.6% and 2.5% phenotypic variation (Table 6). Three QTLs for LAI, QLAI.xjau-2BL-pre.2, QLAI.xjau-2BL.2, and QLAI.xjau-3BL-pre, were identified under drought stress treatment, and five QTLs were identified under normal irrigation treatment. QLAI.xjau-2BL-pre.2 and QLAI.xjau-2BL.2 were very closely linked, 2 cM apart, and QLAI.xjau-2BL.2 explained 13.8% of the phenotypic variation at the maturity stage (Table 6).
For chlorophyll content, QCC.xjau-1DS was detected at both heading and flowering stages and explained similar phenotypic variation (5.3% and 5.8%). QCC.xjau-1DS-pre was detected at the heading stage and mapped 1 cM apart from QCC.xjau-1DS, indicating that they are likely the same QTL. QCC.xjau-3AL-pre was detected at the heading stage, explaining 2.5% of the phenotypic variation (Table 6). All QTLs related to CC were detected under normal irrigation treatment.

3.6. Candidate Gene Mining and Comparative Analysis of Predicted and Measured Values

On the basis of the flanking SNP markers of the QTL, the DNA sequences corresponding to these loci were searched in the Chinese Spring reference genome; 10 candidate genes were identified for LAI-related QTLs, and three candidate genes were identified for CC-related QTLs (Table 7). Four candidate genes for LAI belonged to F-box family proteins. On chromosome 1DS, candidate gene TraesCS1D01G284100 encoding a GATA transcription factor was identified from the two closely linked QTLs QCC.xjau-1DS and QCC.xjau-1DS-pre according to predicted and measured CC values, indicating that the two loci are likely same.

4. Discussion

4.1. Spectral Reflectance Difference Analysis

Plant leaves play important roles in the process of photosynthesis and respiration [28]. The formation of a reasonable leaf area in a crop provides an area to guarantee receiving light energy. Chlorophyll is one of the important pigments for light absorption, and its content is significantly related to the photosynthesis rate and growth vigor [29]. Since colored substances, such as plant carotenoids, chlorophylls, and brown pigments, absorb sunlight in the wavelength range of 400–760 nm, the light spectral curve of reflectance in this range is low [30]. In this study, the reflectance of the five spectral bands on wheat decreased in the following order: NIR light > red-edge light > green light > red light > blue light. Because plants mainly absorb red light and blue light, their reflectance is the lowest. The reason for the rapid increase in the reflectance of light in the range from NIR to red-edge light is due to the fact that the colored substances (mainly chlorophyll) in wheat leaves can absorb most of the visible light, but it is difficult to absorb radiation with wavelengths above 700 nm [31].
In this study, we found that the NIR reflectance of wheat LAI under drought stress was higher at all tested growth stages, compared with the NIR reflectance under normal irrigation conditions. LAI is affected by plant height, leaf size, and degree of curling. Drought stress accelerates plant water loss and causes leaf curling and plant height shortening, which decreases the leaf coverage in the wheat population and increases the exposed area of the ground and infrared reflectance. In another aspect, the water in wheat leaves under normal irrigation conditions was higher than that under drought stress, because water can absorb light [32], which is also a reason that the NIR reflectance on wheat was higher under drought stress than under normal irrigation conditions. Compared with normal irrigation conditions, green and red light reflectance increased under drought stress. The reason is that drought stress accelerates plant water evaporation and chlorophyll degradation, reducing the leaf area and chlorophyll content for receiving visible light.

4.2. LAI and CC Modeling Verification

With the rapid application of UAV drone and remote sensing technology on agriculture, more imagery data of crops have been obtained, laying the foundation for investigating crop phenotypes in multiple growth periods and environments and accelerating crop genetic research [7]. Processing the imagery data to extract useful information of the corresponding phenotypes is critical. Machine learning (ML) methodologies can be used to effectively analyze and utilize information-rich datasets, as well as high-dimensional observation data [33]. They have been used in the analysis and modeling of remote sensing data, but the accuracies of different ML methods vary. In this study, we used the CART algorithm [26] to build a model through the inductive learning method. First, the partial sample data were used to construct the decision tree, then the remaining sample data were gradually added to adjust the tree, and finally the decision tree was optimized and completed [34]. According to the greedy algorithm, the whole sample data were used, and the statistical properties of all sample data were obtained. The above two steps effectively resisted the noise pollution of the results. The corresponding predicted values were obtained after modeling by the algorithm, and the predicted values and the measured values were validated by the cross-validation method (Table 2). The verification coefficient of determination R2 of LAI under normal irrigation was 0.70–0.84, while that under drought stress was 0.64–0.78. The verification coefficient of determination R2 for CC was relatively high and consistent under normal irrigation (0.876–0.883) and drought stress (0.86–0.88) conditions. This algorithm was more effective for the phenotype prediction of the normal irrigation treatment, with a higher prediction accuracy and reliability.
Various algorithms and models have been applied to predict wheat LAI and CC through collecting images with UAV and multispectral sensor technologies [12,35,36]. Gao et al. [36] used the UAV hyperspectral vegetation index to model 103 LAIs of multiple wheat single-growth periods, and the verification R2 of the model was 0.783. Other reports of UAV-based multispectral estimated vegetation indices in wheat, as well as other crops, under drought conditions had similar coefficients [11]. The results in our current study demonstrate that both NDVI and GNDVI can be used to estimate LAI and CC in wheat from the flowering to maturity stages.
Although UAV remote sensing technology has been widely used to monitor crop traits recent years, most studies used small numbers of plant genotypes; the collection of high-throughput data in a large number of genotypes, such as a mapping population, is rarely reported. By combining the multispectral imaging with the vegetation index to construct related models in this study, we phenotyped LAI and CC in a mapping population of 309 RILs at three wheat growth stages under two different water treatments. A high correlation was obtained between the UAV imagery-predicted values and ground-measured values. The usefulness of this platform was further demonstrated by the QTL mapping of the drought tolerance traits in the wheat population.

4.3. QTLs and Candidate Genes Association with Predicted and Measured Values of LAI and CC

UAV is a promising platform to predict the timeseries development of crop canopies, and these data can be further used to understand the genetic basis of phenotypic variation [37]. In this study, we identified eight QTLs associated with LAI and two QTLs associated with CC. Three QTLs related to LAI were positioned on chromosome 2BL, and two of them (QLAI.xjau-2BL-pre.1 and QLAI.xjau-2BL.1) were 5 cM apart. For CC, two QTLs were identified on chromosome 1DS (QCC.xjau-1DS-pre and QCC.xjau-1DS), closely linked with 1 cM apart. The effects of these QTL clusters were detected from both predicted and ground-measured values, strengthening the QTL analysis. The positions of three QTLs on chromosome 2BL were so close that they are very likely to be the same locus, and this was also the case for two QTLs on 1DS. Similar findings were also reported by Marco et al. [38]; they proposed that, when two QTLs on the same chromosome of wheat are ≤15 cM apart, the two QTLs can be considered as the same locus. To infer whether there were common interacting QTLs or regions across genetic backgrounds, we compared the QTLs for LAI and CC with the QTLs reported in previous studies. Wang et al. [39] used an RIL population (137 lines) constructed from Shanghai 3/CBRD and Naxos combined with SSR markers to identify the flag leaf width-related QTL on chromosome 2B (90.8 cM), which is 10.2 cM away from the LAI locus QLAI.xjau-2BL-pre.1 detected on chromosome 2BL (101 cM) in this study. Another QTL (QSR.sicau-3B) [40] for spike formation rate (SR) located on chromosome 3B (47cM), which is 9 cM away from the LAI locus QLAI.xjau-3BS-pre detected on chromosome 3BS (56 cM) in the current study. Zhao et al. [41] mapped the RIL population (128 lines) from Ningchun 4 × Ningchun 27 with SSR markers and identified a QTL related to flag leaf length and width on chromosome 5D (107.4 cM), which is 0.6 cM away from QLAI.xjau-5DL-pre for LAI detected in the present study.
The CC-related QTL site QCC.xjau-3AL-pre (103cM) in this study is potentially novel. This QTL was detected in the interval of AX-110449574 and AX-109301028 on chromosome 3AL, explaining 2.5% of the phenotypic variation of CC. There is no CC-related QTL previously reported in this chromosomal region, indicating that this QTL is likely a new genetic locus regulating CC. Therefore, the combination of the UAV image technique with QTL mapping of the RIL population, as reported here, can greatly improve the identification of novel genomic factors underlying the genetic variation under normal irrigation and drought stress conditions and can be used in functional annotation of the wheat genome.
According to the chromosome position and genomic sequences of the QTLs on the reference wheat genome, the potential candidate genes of the QTLs for LAI and CC were annotated in this study. Among 10 candidate genes, TraesCS2B01G623600 and TraesCS2B01G391300 both encode F-box family proteins, which are involved in the regulation of plant stress resistance responses [42]. TraesCS3B01G115100 encodes a Kelch-like protein, which is one of the C-terminal domains of F-box proteins and mediates the F-box protein response to drought stress [43]. TraesCS5D01G408900 encodes peroxidase (POD), which can remove H2O2 produced in plants to reduce the H2O2 damage on plants [44]. POD activity is also significantly related to the drought resistance of plants [45]. TraesCS5D01G411400 encodes a C2H2 zinc finger protein, which can slow down the decrease in leaf water content and increase in antioxidant enzyme activity, leading to a decrease in active oxygen content in plants and an improvement in plant resistance to drought stress [46]. TraesCS1D01G284100 encodes the GATA transcription factor, which participates in the formation of plant chloroplasts [47]. TraesCS3A01G480600 encodes a BTB/POZ domain junction protein, which participates in plant-related signal networks and responds to adversity stress [48,49]. These genes have functions in plant resistance under environmental stress.

5. Conclusions

In this study, UAV multispectral images and manual measurements of LAI and CC from a population of 309 wheat RILs were collected in multiple growth periods under normal irrigation and drought stress conditions. GNDVI and NDVI were used to predict the LAI and CC through the CART algorithm. The predictive model for LAI and CC was judged though cross-validation with good estimations of LAI and CC at three wheat growth stages under two water supply treatments, with R2 ranging from 0.64 to 0.84 for LAI and from 0.86 to 0.88 for CC, RMSE ranging from 0.30 to 0.52 for LAI and from 0.94 to 1.05 for CC, and RE ranging from 0.06 to 0.18 for LAI and from 0.01 to 0.02 for CC. In addition, high correlations (0.87 to 0.91) were found between predicted and measured values for LAI and CC at each growth stage of wheat under different water treatments. These results indicate that the predictive model for LAI and CC had high accuracy and reliability. According to the high-density SNP map of the RIL population, eight QTLs of LAI and three QTLs of CC were mapped, with each QTL explaining 2.5% to 13.8% of the phenotypic variation for LAI and 2.5% to 5.8% of the phenotypic variation for CC. The potential candidate genes of these QTLs were identified in the corresponding chromosomal regions in the wheat reference genome. In addition to three QTLs detected by both measured and estimated values, three QTLs were detected by estimated values. These findings indicate that the application of UAV remote sensing technology can significantly improve the efficiency of high-throughput phenotyping and crop genetic studies.

Author Contributions

W.W., formal analysis, writing—original draft, and writing—review and editing; H.G., conceptualization, project administration, resources, supervision, writing—original draft, and writing—review and editing; X.G., Y.C., Y.R., Z.Z., R.W. and J.C., investigation, methodology, and data curation. All authors have read and agreed to the published version of the manuscript.

Funding

This research was funded by the National Natural Science Foundation of China (32160461), the Xinjiang Major Science and Technology Special Project (2021A02001-1), and the Basic Scientific Research Funding Projects of Public Welfare Scientific Research Institutes in the Xinjiang Uygur Autonomous Region (KY2019009).

Institutional Review Board Statement

Not applicable.

Informed Consent Statement

Not applicable.

Data Availability Statement

The data that support the findings of this study are available in the main body of the paper.

Conflicts of Interest

The authors declare no conflict of interest.

References

  1. Shiferaw, B.; Smale, M.; Braun, H.J.; Duveiller, E.; Reynolds, M.; Muricho, G. Crops that feed the world 10. Past successes and future challenges to the role played by wheat in global food security. Food Secur. 2013, 5, 291–317. [Google Scholar] [CrossRef] [Green Version]
  2. Hassan, M.A.; Yang, M.; Rasheed, A.; Jin, X.; Xia, X.; Xiao, Y.; He, Z. Time-series multispectral indices from unmanned aerial vehicle imagery reveal senescence rate in bread wheat. Remote Sens. 2018, 10, 809. [Google Scholar] [CrossRef] [Green Version]
  3. Zampieri, M.; Ceglar, A.; Dentener, F.; Toreti, A. Wheat yield loss attributable to heat waves, drought and water excess at the global, national and subnational scales. Environ. Res. Lett. 2017, 12, 064008. [Google Scholar] [CrossRef]
  4. Lesk, C.; Rowhani, P.; Ramankutty, N. Influence of extreme weather disasters on global crop production. Nature 2016, 529, 84. [Google Scholar] [CrossRef] [PubMed]
  5. Sean, M.; Ames, H.D.; Holshouser, D.L. Relationship between leaf area index and yield in double-crop and full-season soybean systems. J. Econ. Entomol. 2002, 95, 945–951. [Google Scholar]
  6. Yao, X.; Wang, N.; Liu, Y.; Cheng, T.; Tian, Y.; Chen, Q.; Zhu, Y. Estimation of wheat LAI at middle to high levels using unmanned aerial vehicle narrowband multispectral imagery. Remote Sens. 2017, 9, 1304. [Google Scholar] [CrossRef] [Green Version]
  7. Yang, W.; Guo, Z.; Huang, C.; Duan, L.; Chen, G.; Jiang, N.; Fang, W.; Feng, H.; Xie, W.; Lian, X.; et al. Combining high-throughput phenotyping and genome-wide association studies to reveal natural genetic variation in rice. Nat. Commun. 2014, 5, 5087. [Google Scholar] [CrossRef]
  8. Jonckheere, I.; Fleck, S.; Nackaerts, K.; Muys, B.; Coppin, P.; Weiss, M.; Baret, F. Review of methods for in situ leaf area index determination: Part I. Theories, sensors and hemispherical photography. Agric. For. Meteorol. 2004, 121, 19–35. [Google Scholar] [CrossRef]
  9. Wang, X.Z.; Huang, J.F.; Li, Y.M.; Wang, R.C. Study on hyperspectral and red edge characteristics of rice under different nitrogen supply levels. J. Remote Sens. 2004, 8, 185–192. [Google Scholar] [CrossRef] [Green Version]
  10. Adão, T.; Hruška, J.; Pádua, L.; Bessa, J.; Peres, E.; Morais, R.; Sousa, J.J. Hyperspectral imaging: A review on UAV-based sensors, data processing and applications for agriculture and forestry. Remote Sens. 2017, 9, 1110. [Google Scholar] [CrossRef] [Green Version]
  11. Gao, L.; Yang, G.J.; Li, C.C.; Fang, H.K.; Xu, B.; Wang, L.; Dong, J.H.; Fu, K. Application of an improved method in retrieving leaf area index combined spectral index with PLSR in hyperspectral data generated by unmanned aerial vehicle snapshot camera. Acta Agron. Sin. 2017, 43, 549–557. [Google Scholar] [CrossRef]
  12. Verger, A.; Vigneau, N.; Chéron, C.; Gilliot, J.M.; Comar, A.; Baret, F. Green area index from an unmanned aerial system over wheat and rapeseed crops. Remote Sens. Environ. 2014, 152, 654–664. [Google Scholar] [CrossRef]
  13. Jin, Y.H.; Xiong, H.G.; Zhang, F.; Wang, L.F. Comparison of hyperspectral estimation models for chlorophyll content in spring wheat at jointing stage between irrigated and dryland. Agric. Res. Arid. Areas 2014, 32, 106–111. (In Chinese) [Google Scholar]
  14. Gong, Y.; Yang, K.; Lin, Z.; Fang, S.; Wu, X.; Zhu, R.; Peng, Y. Remote estimation of leaf area index (LAI) with unmanned aerial vehicle (UAV) imaging for different rice cultivars throughout the entire growing season. Plant Methods 2021, 17, 1–16. [Google Scholar] [CrossRef]
  15. Shibayama, M.; Akiyama, T. Seasonal visible, nir and mid-infrared spectra of rice canopies in relation to LAI and above-ground dry phytomass. Remote Sens. Environ. 1989, 27, 119–127. [Google Scholar] [CrossRef]
  16. Hunt, E.R.; Hively, W.D.; Fujikawa, S.J.; Linden, D.S.; Daughtry, C.S.; McCarty, G.W. Acquisition of NIR-green-blue digital photographs from unmanned aircraft for crop monitoring. Remote Sens. 2010, 2, 290–305. [Google Scholar] [CrossRef] [Green Version]
  17. Singhal, G.; Bansod, B.; Mathew, L.; Goswami, J.; Choudhury, B.U.; Raju, P. Estimation of eaf chlorophyll concentration in turmeric (Curcuma longa) using high-resolution unmanned aerial vehicle imagery based on kernel ridge regression. J. Indian Soc. Remote Sens. 2019, 47, 1111–1122. [Google Scholar] [CrossRef]
  18. Kaivosoja, J.; Pesonen, L.; Kleemola, J.; Pölönen, I.; Salo, H.; Honkavaara, E.; Saari, H.; Mäkynen, J.; Rajala, A. A case study of a precision fertilizer application task generation for wheat based on classified hyperspectral data from UAV combined with farm history data. In Proceedings of the SPIE—The International Society for Optical Engineering, San Diego, CA, USA, 9–12 September 2013; p. 8887. [Google Scholar]
  19. Condorelli, G.E.; Maccaferri, M.; Newcomb, M.; Andrade-Sanchez, P.; White, J.W.; French, A.N.; Sciara, G.; Ward, R.; Tuberosa, R. Comparative Aaerial and ground based high throughput phenotyping for the genetic dissection of NDVI as a proxy for drought adaptive traits in durum wheat. Front. Plant Sci. 2018, 9, 893. [Google Scholar] [CrossRef]
  20. Adeel, H.M.; Yang, M.J. Accuracy assessment of plant height using an unmanned aerial vehicle for quantitative genomic analysis in bread wheat. Plant Method 2019, 15, 1–12. [Google Scholar]
  21. Kumar, S.; Sehgal, S.K.; Kumar, U.; Prasad, P.V.; Joshi, A.K.; Gill, B.S. Genomic characterization of drought tolerance-related traits in spring wheat. Euphytica 2012, 186, 265–276. [Google Scholar] [CrossRef]
  22. Wang, S.X.; Zhu, Y.L.; Zhang, D.X.; Shao, H.; Liu, P.; Hu, J.B.; Zhang, H.; Zhang, H.P.; Chang, C.; Lu, J.; et al. Genome-wide association study for grain yield and related traits in elite wheat varieties and advanced lines using SNP markers. PLoS ONE 2017, 12, e0188662. [Google Scholar] [CrossRef] [PubMed] [Green Version]
  23. Ren, Y.; Liu, J.D.; Zhang, J.X.; Dreisigacker, S.; Xia, X.C.; Geng, H.W. QTL mapping of drought tolerance at germination stage in wheat using the 50K SNP array. Plant Genet. Resour. Charact. Util. 2021, 19, 453–460. [Google Scholar] [CrossRef]
  24. Netto, A.T.; Campostrini, E.; de Oliveira, J.G.; Bressan-Smith, R.E. Photosynthetic pigments, nitrogen, chlorophyll a fluorescence and SPAD-502 readings in coffee leaves. Sci. Hortic. 2005, 104, 199–209. [Google Scholar] [CrossRef]
  25. Huete, A.; Didan, K.; Miura, T.; Rodriguez, E.P.; Gao, X.; Ferreira, L.G. Overview of the radiometric and biophysical performance of the MODIS vegetation indices. Remote Sens. Environ. 2002, 83, 195–213. [Google Scholar] [CrossRef]
  26. Breiman, L.; Friedman, J.H.; Olshen, R.A.; Stone, C.J. Classification and Regression Trees (CART). Biometrics 1984, 40, 358. [Google Scholar]
  27. Saptoro, A.; Tadé, M.O.; Vuthaluru, H. A modified Kennard-Stone algorithm for optimal division of data for developing artificial neural network models. Chem. Prod. Process Model. 2012, 7, 16. [Google Scholar] [CrossRef]
  28. Zhang, J.; Cheng, T.; Guo, W.; Xu, X.; Qiao, H.; Xie, Y.; Ma, X. Leaf area index estimation model for UAV image hyperspectral data based on wavelength variable selection and machine learning methods. Plant Methods 2021, 17, 1–4. [Google Scholar] [CrossRef]
  29. Gitelson, A.A. Remote estimation of canopy chlorophyll content in crops. Geophys. Res. Lett. 2005, 32, 1–4. [Google Scholar] [CrossRef] [Green Version]
  30. Zhang, T.; Yang, J.; Guo, L.; Hu, P.; Liu, X.; Huang, P.; Wang, C. A bionic point-source polarisation sensor applied to underwater orientation. J. Navig. 2021, 74, 1–16. [Google Scholar] [CrossRef]
  31. Horler, D.N.; Dockray, M.; Barber, J. The red edge of plant leaf reflectance. Int. J. Remote Sens. 1983, 4, 273–288. [Google Scholar] [CrossRef]
  32. Berger, B.; Parent, B.; Tester, M. High-throughput shoot imaging to study drought responses. J. Exp. Bot. 2010, 61, 3519–3528. [Google Scholar] [CrossRef] [PubMed] [Green Version]
  33. Houborg, R.; McCabe, M.F. A hybrid training approach for leaf area index estimation via Cubist and random forests machine-learning. ISPRS J. Photogramm. 2018, 135, 173–188. [Google Scholar] [CrossRef]
  34. Yang, T.; Gao, X.; Sorooshian, S.; Li, X. Simulating California reservoir operation using the classification and regression-tree algorithm combined with a shuffled cross-validation scheme. Water Resour. Res. 2016, 52, 1626–1651. [Google Scholar] [CrossRef] [Green Version]
  35. Gao, L.; Yang, G.; Yu, H.; Xu, B.; Zhao, X.; Dong, J.; Ma, Y. Retrieving winter wheat leaf area index based on unmanned aerial vehicle hyperspectral remote sensing. Trans. Chin. Soc. Agric. Eng. 2016, 32, 113–120. [Google Scholar]
  36. Jin, X.; Liu, S.; Baret, F.; Hemerlé, M.; Comar, A. Estimates of plant density of wheat crops at emergence from very low altitude UAV imagery. Remote Sens. Environ. 2017, 198, 105–114. [Google Scholar] [CrossRef] [Green Version]
  37. Hu, P.; Chapman, S.C.; Wang, X.; Potgieter, A.; Duan, T.; Jordan, D.; Guo, Y.; Zheng, B. Estimationof plant height using a high throughput phenotyping platform based on unmanned aerial vehicle and self-calibration: Example for sorghum breeding. Eur. J. Agron. 2018, 95, 24–32. [Google Scholar] [CrossRef]
  38. Maccaferri, M.; Sanguineti, M.C.; Corneti, S.; Ortega, J.L.; Salem, M.B.; Bort, J.; DeAmbrogio, E.; del Moral, L.F.; Demontis, A.; El-Ahmed, A.; et al. Quantitative trait loci for grain yield and adaptation of durum wheat (Triticum durum Desf.) across a wide range of water availability. Genetics 2008, 178, 489–511. [Google Scholar] [CrossRef] [Green Version]
  39. Wang, Y.; Zhao, L.; Dong, M.; Ren, Y.; Zhang, L.; Chen, F. QTL localization of wheat plant height and flag leaf-related traits. J. Wheat Crop. 2019, 39, 761–767. (In Chinese) [Google Scholar]
  40. Hu, Y.S.; Ren, T.H.; Li, Z.; Tang, Y.Z.; Ren, Z.L.; Yan, B.J. Molecular mapping and genetic analysis of a QTL controlling spike formation rate and tiller number in wheat. Gene 2017, 634, 15. [Google Scholar] [CrossRef]
  41. Zhao, P.; Xu, F.; Jiang, W.H.; Qi, P.; Li, C.L.; Bai, H.B.; Lv, X.L.; Dong, J.L.; Wang, Z.H. QTL analysis of flag leaf length, width and chlorophyll content in spring wheat. J. Wheat Crop. 2015, 35, 603–608. (In Chinese) [Google Scholar]
  42. Lyzenga, W.J.; Stone, S.L. Abiotic stress tolerance mediated by protein ubiquitination. J. Exp. Bot. 2012, 63, 599–616. [Google Scholar] [CrossRef] [PubMed] [Green Version]
  43. Kipreo, S.E.T.; Pagano, M. The F -box protein family. Genome Biol. 2000, 1, 1–7. [Google Scholar]
  44. Sofo, A.; Dichio, B.; Xiloyannis, C.; Masia, A. Lipoxygenase activity and proline accumulation in leaves and roots of olive trees in response to drought stress. Physiol. Plant 2010, 121, 58–65. [Google Scholar] [CrossRef] [PubMed]
  45. Shao, H.B.; Liang, Z.S.; Shao, M.A. Osmotic regulation of 10 wheat (Triticum aestivum L.) genotypes at soil water deficits. Colloids Surf. Biointerfaces 2006, 47, 132–139. [Google Scholar]
  46. Yin, M.; Wang, Y.; Zhang, L.; Li, J.; Quan, W.; Yang, L.; Wang, Q.; Chan, Z. The Arabidopsis Cys2/His2 zinc finger transcription factor ZAT18 is a positive regulator of plant tolerance to drought stress. J. Exp. Bot. 2017, 68, 2991–3005. [Google Scholar] [CrossRef]
  47. Weiss, D.; Ori, N. Mechanisms of cross talk between gibberellin and other hormones. Plant Physiol. 2007, 144, 1240–1246. [Google Scholar] [CrossRef] [Green Version]
  48. Kim, H.; Kim, S.H.; Seo, D.H.; Chung, S.; Kim, S.W.; Lee, J.S.; Kim, W.T.; Lee, J.H. ABA-HYPERSENSITIVE BTB/POZ PROTEIN 1 functions as a negative regulator in ABA-mediated inhibition of germination in Arabidopsis. Plant Mol. Biol. 2016, 90, 303–315. [Google Scholar] [CrossRef]
  49. Gao, Z.; Chen, Y.F.; Randlett, M.D.; Zhao, X.C.; Findell, J.L.; Kieber, J.J.; Schaller, G.E. Localization of the Raf -like kinase CTR1 to the endoplasmic reticulum of Arabidopsis through participation in ethylene receptor signaling complexes. J. Biol. Chem. 2003, 278, 34725–34732. [Google Scholar] [CrossRef] [Green Version]
Figure 1. UAV image capture and single-band image extraction at the test site.
Agriculture 12 00595 g001
Figure 2. The relationship between the predicted and the measured leaf area index (LAI) values at three wheat growth stages, flowering (LAI1), filling (LAI2), and maturity (LAI3), under normal irrigation (NI) and drought stress (DS) conditions.
Agriculture 12 00595 g002
Figure 3. The relationship between the predicted and the measured chlorophyll content (CC) values at three wheat growth stages, heading (CC1), flowering (CC2), and filling (CC3), under normal irrigation (NI) and drought stress (DS) conditions.
Agriculture 12 00595 g003
Figure 4. Frequency distribution of predicted values of LAI and CC traits in wheat RILs at three growth stages under two water treatments. W(NI) is the value of Worrakatta under normal irrigation conditions; W(DS) is the value of Worrakatta under drought stress conditions; B(NI) is the value of Berkut under normal irrigation conditions; B(DS) is the value of Berkut under drought stress conditions.
Agriculture 12 00595 g004
Figure 5. (a) QTL mapping of LAI; (b) QTL mapping of CC. The right side of each chromosome is the molecular marker, and the left side is the genetic position of the molecular marker.
Agriculture 12 00595 g005
Table 1. Mean and standard deviation (SD) of NIR, red-edge, green, red, and blue reflectance for wheat at different growth stages under normal irrigation (NI) and drought stress (DS) conditions.
Water
Condition
BandsParametersHeadingFloweringFillingMaturity
DINIRMean0.37 0.37 0.37 0.26
SD0.030.030.030.03
Red-edgeMean0.28 0.28 0.28 0.26
SD0.030.030.030.02
GreenMean0.07 0.07 0.07 0.09
SD0.010.010.010.01
RedMean0.05 0.05 0.05 0.10
SD0.010.010.010.02
BlueMean0.04 0.04 0.04 0.04
SD0.010.010.010.01
DSNIRMean0.33 0.32 0.30 0.28
SD0.030.030.020.02
Red-edgeMean0.28 0.29 0.27 0.30
SD0.020.020.020.02
GreenMean0.08 0.09 0.10 0.11
SD0.010.020.020.01
RedMean0.07 0.08 0.11 0.14
SD0.020.020.040.03
BlueMean0.04 0.06 0.05 0.05
SD0.010.030.010.01
Table 2. Determination coefficient (R2), root-mean-square error (RMSE), and relative error (RE) of the algorithm for modeling the estimation of leaf area index (LAI) and chlorophyll content (CC) of wheat at different growth stages under normal irrigation (NI) and drought stress (DS) conditions.
TraitsGrowth StageTreatmentR2RMSERE
LAIFlowering stage (LAI1)NI0.700.360.08
DS0.780.320.10
Filling stage (LAI2)NI0.810.300.06
DS0.730.390.12
Mature stage (LAI3)NI0.840.440.11
DS0.640.520.18
CCHeading stage (CC1)NI0.880.990.01
DS0.860.970.01
Flowering stage (CC2)NI0.881.020.01
DS0.880.940.01
Filling stage
(CC3)
NI0.881.000.01
DS0.871.050.02
Table 3. Genetic variation of measured LAI and CC of wheat cultivars Worrakatta and Berkut and their progeny recombinant inbreeding lines (RILs).
TraitsGrowth StageTreatmentParentRILs
WorrakattaBerkutMeanSDRangeCV (%)h2 (%)
LAIFlowering stageNI4.574.394.210.632.66~5.8615.470
DS4.63.583.07 **0.641.62~5.082170
Filling stageNI5.324.574.390.662.79~6.2914.973
DS4.423.82.94 **0.651.31~4.6722.269
Mature stageNI4.573.953.850.772.24~6.0519.973
DS4.263.652.91 **0.821.01~5.0028.275
CCHeading stageNI53.3846.1151.632.3244.06~57.684.581
DS53.4148.950.76 **1.9942.41~55.083.975
Flowering stageNI57.6848.2853.12.3347.43~60.864.478
DS55.5447.6851.19 **2.1644.52~57.084.276
Filling stageNI54.8246.4851.312.1145.62~56.994.174
DS54.0847.0650.34 **2.0739.57~55.674.174
** p < 0.001; CV, coefficient of variation; h2, broad-sense heritability; SD, standard deviation.
Table 4. Genetic variation of predicted LAI and CC of wheat cultivars Worrakatta and Berkut and their progeny recombinant inbreeding lines (RILs).
TraitsGrowth StageTreatmentParentRIL
WorrakattaBerkutMeanSDRangeCV (%)h2 (%)
LAIFlowering stageNI5.244.414.10.471.63–5.7011.557
DS3.023.533.06 **0.441.85–4.8714.558
Filling stageNI5.255.054.40.483.31–5.8710.865
DS3.344.523.06 **0.51.71–4.8416.458
Mature stageNI4.394.364.010.630.60–5.8515.693
DS3.764.272.92 **0.620.95–4.5121.462
CCHeading stageNI53.5947.251.621.5445.31–56.33380
DS52.6948.9650.50 **1.3644.13–53.922.764
Flowering stageNI57.0654.58531.5248.61–57.412.977
DS55.2950.3250.68 **1.3943.76–55.062.864
Filling stageNI53.549.6651.441.4147.67–56.092.770
DS50.648.4650.20 **1.4341.38–53.702.867
** p < 0.001; CV, coefficient of variation; h2, broad-sense heritability; SD, standard deviation.
Table 5. Correlation analysis between measured and predicted values for leaf area index (LAI) and chlorophyll content (CC) of 309 recombinant inbreeding lines (RILs) from wheat cross Worrakatta × Berkut.
TraitsGrowth StageTreatmentPredicted ValuesMeasured ValuesCorrelation
RangeMeanRangeMean
LAIFlowering stageNI1.65–5.704.12.66–5.864.210.83 **
DS1.80–5.003.061.62–5.083.070.88 **
Filling stageNI2.63–5.874.42.79–6.294.390.90 **
DS1.69–4.843.061.31–4.672.940.85 **
Mature stageNI0.60–5.854.012.24–6.053.850.92 **
DS0.95–5.132.921.01–5.002.910.80 **
CCHeading stageNI45.31–56.3351.6244.06–57.6851.630.94 **
DS44.13–53.9250.542.41–55.0850.760.93 **
Flowering stageNI48.61–57.415347.43–60.8653.10.94 **
DS43.76–55.0650.6844.52–57.0851.190.94 **
Filling stageNI47.67–56.0951.4445.62–56.9951.310.94 **
DS41.38–53.7050.239.57–55.6750.340.93 **
** Highly significant correlation at the 0.01 level.
Table 6. Information on QTLs related to leaf area index (LAI) and chlorophyll content (CC) based on RIL population of cross Worrakatta × Berkut.
TraitsSourceGrowth StageTreatmentQTL NameChr.Marker IntervalPosition (cM)LODR2 (%)Additive
LAIPredicted valueFloweringNIQLAI.xjau-2BL-pre.12BLAX-89402509–AX-951347531015.63.10.13
FillingNIQLAI.xjau-5DL-pre5DLAX-94670615–AX-1116526491085.73.60.13
FillingDSQLAI.xjau-3BL-pre3BLAX-179558689–AX-94903264565.33.30.16
MaturityNIQLAI.xjau-5DL-pre5DLAX-94670615–AX-1116526491084.12.50.13
MaturityDSQLAI.xjau-2BL-pre.22BLAX-95631217–AX-94667571545.33.30.16
Measured valueFloweringNIQLAI.xjau-2BL.12BLAX-111757968–AX-110468087963.46.80.17
FloweringNIQLAI.xjau-5BS5BSAX-179559227–AX-1795614111274.28.20.18
MaturityNIQLAI.xjau-1BL1BLAX-111775778–AX-109367690382.87.6−0.19
MaturityDSQLAI.xjau-2BL.22BLAX-94407412–AX-111743644564.613.80.3
CCPredicted valueHeadingNIQCC.xjau-1DS-pre1DSAX-109983565–AX-89314186274.12.50.31
HeadingNIQCC.xjau-3AL-pre3ALAX-110449574–AX-1093010281033.92.5-0.3
Measured valueHeadingNIQCC.xjau-1DS1DSAX-110335177–AX-109983565262.55.80.52
FloweringNIQCC.xjau-1DS1DSAX-110335177–AX-109983565263.25.30.57
Table 7. The candidate genes for QTLs mapped with predicted and measured values of LAI and CC.
SourceTraitsQTL NameMarker IntervalPhysical Location (Mb)GeneFunction Description
Predicted valueLAIQLAI.xjau-2BL-pre.1AX-89402509–
AX-95134753
797.209401–797.210138TraesCS2B01G623600F-box family protein
LAIQLAI.xjau-2BL-pre.2AX-95631217–
AX-94667571
555.852677–555.853828TraesCS2B01G391300F-box family protein
LAIQLAI.xjau-3BL-preAX-179558689–
AX-94903264
81.813957–81.818009TraesCS3B01G115100Kelch-like protein
LAIQLAI.xjau-5DL-preAX-94670615–
AX-111652649
473.052014–473.053148TraesCS5D01G408900Peroxidase
LAIQLAI.xjau-5DL-preAX-94670615–
AX-111652649
474.813752–474.814753TraesCS5D01G411400C2H2-type zinc finger protein
CCQCC.xjau-1DS-preAX-109983565–
AX-89314186
382.257141–382.258109TraesCS1D01G284100GATA transcription factor
CCQCC.xjau-3AL-preAX-110449574–
AX-109301028
711.402978–711.407172TraesCS3A01G480600BTB/POZ domain- containing protein
Measured valueLAIQLAI.xjau-1BLAX-111775778–
AX-109367690
652.781869–652.786461TraesCS1B01G427400Wuschel homeobox protein
LAIQLAI.xjau-2BL.1AX-111757968–
AX-110468087
794.07325–794.082431TraesCS2B01G617700MYB-related transcription factor
LAIQLAI.xjau-2BL.2AX-94407412–
AX-111743644
691.187478–691.1904TraesCS2B01G493800BTB/POZ domain-containing protein
LAIQLAI.xjau-2BL.2AX-94407412–
AX-111743644
712.002368–712.004414TraesCS2B01G517100F-box family protein
LAIQLAI.xjau-5BSAX-179559227–
AX-179561411
19.455584–19.456986TraesCS5B01G019700F-box family protein
CCQCC.xjau-1DSAX-110335177–
AX-109983565
382.257141–382.258109TraesCS1D01G284100GATA transcription factor
CCQCC.xjau-1DSAX-110335177–
AX-109983565
392.69691–392.697515TraesCS1D01G293600Abscisic acid receptor
Publisher’s Note: MDPI stays neutral with regard to jurisdictional claims in published maps and institutional affiliations.

