Article

Impact of Government Policies on Research and Development (R&D) Investment, Innovation, and Productivity: Evidence from Pesticide Firms in China

1
School of Management and Economics, Beijing Institute of Technology, Beijing 100081, China
2
Yangtze Delta Region Academy, Beijing Institute of Technology, Jiaxing 314019, China
3
School of Environmental and Biological Sciences, Rutgers, The State University of New Jersey, New Brunswick, NJ 08901, USA
4
School of Humanities and Social Sciences, Beijing Institute of Technology, Beijing 100081, China
*
Author to whom correspondence should be addressed.
Submission received: 12 April 2022 / Revised: 5 May 2022 / Accepted: 8 May 2022 / Published: 17 May 2022

Abstract

:
China’s pesticide industry has played an important role in the growth of agricultural productivity in both China and worldwide, but its development is hampered by production inefficiency and the lack of innovation of active ingredients. To improve innovation and the productivity of the pesticide industry, the Chinese government has implemented a series of policies to stimulate private research and development (R&D) and firm innovation. Using the firm-level panel data of the Annual Survey of Industrial Firms (ASIF) collected by the National Bureau of Statistics in 2001–2007, this study examines the linkages between R&D investment, innovation, and productivity with a focus on the role of government policies. The results show that pesticide firms with a higher intensity of R&D investment were associated with a higher patent intensity, and more innovated firms were associated with a higher productivity. Public research, intellectual property enforcement, production subsidy, foreign direct investment (FDI), and being export oriented were positively associated with the innovation and productivity of pesticide firms.

1. Introduction

China’s pesticide industry has made an important contribution to agricultural productivity in China and plays a vital role in the global pesticide market [1]. China’s National Bureau of Statistics show that China applied 1.5 million tons of pesticide in 2018 [2], accounting for nearly 30% of total pesticide usage worldwide [3]. China also has the largest pesticide production and is the leading export country of pesticide [4,5]. China exports over one third of pesticide production to over 160 countries and regions every year, which is nearly 25% of the global pesticide exports [6]. At the same time, the use of pesticides has a negative impact on the environment. So, there are new requirements for pesticide enterprises which are designed to develop more environmentally friendly, low-toxicity pesticide products.
However, low profits, inefficient production, and a lack of research and development (R&D) investment and innovation have characterized China’s pesticide industry [7]. In 2015, the top six multinational corporations (MNCs) produced 75.5% of the global pesticide sales (USD 56.6 billion) and their net profit margin was about 15 to 20% [8]. However, over 2000 Chinese pesticide firms took 13% of the global market share and their net profit margin was as low as 2 to 3% [8]. Furthermore, Chinese pesticide firms are far from being innovative. For example, China’s pesticide industry registered about 20,000 products in 2009, but the active ingredients were only 600 [9]. Some researchers reported that in 2007, among 313 active ingredients of pesticides produced by Chinese pesticide firms, only 13 were originally patented by Chinese firms and research institutes [7].
China’s pesticide industry must become more innovative to enhance its competitiveness in the world. The world-leading pesticide MNCs, such as Bayer, BASF, etc., invest over USD 3 billion in research and investment (R&D) every year [10]. In contrast, in 2013, the top 150 leading Chinese pesticide firms had invested less than half a million (3.2 billion yuan; USD 0.46-billion-dollar equivalent) in R&D in total [11]. To make Chinese pesticide firms more innovative and to stimulate innovation transfers from public sectors and research institutes, the government has implemented a series of policies, such as financial subsidies, stronger intellectual property protection (IPR), ownership reforms, and favorable policy treatments for foreign direct investment (FDI) [12,13]. In the 1990s, the Chinese government established two key public pesticide engineering centers in the North and the South of China successively (The Northern Center was dominated by the Shenyang Chemical Research Institute and Nankai University, while the Southern Center was dominated by the Jiangsu, Hunan, Zhejiang, and Shanghai Institutes.). Several important policy documents, including five-year plans and the National 863 and 973 projects, have listed the importance of science and technology R&D in the pesticide industry [14].
Empirical studies have documented the key role of R&D subsidies, IPR protection, and other supporting policies in improving innovation in China’s manufacturing industry [15,16,17]. Given the significant variations in the innovation process for different industries [18], it is necessary to focus on a specific industry to examine the impact of government policies on innovation.
This study aims to examine the linkages between R&D investment, innovation, and productivity of Chinese pesticide firms with a focus on the role of government policies. In particular, we investigate: (1) the relationships between R&D investment, innovation, and productivity for pesticide firms; and (2) the impact of government policies on such relationships. This study emphases the following policies: public innovation, IPR protection, and production subsidies. Although we lack the data to explicitly measure the government policies that support FDI, ownership reforms, and exports, we directly measure firm-level FDI, ownership type, and exports and examine their impact on innovation and productivity at the firm level.
This study makes the following contributions to the literature. First, it expands on the previous empirical literature on innovation in the pesticide industry by adding newly available firm level data on R&D, innovation, total factor productivity, exports, and FDI, along with policy variables such as firm level production subsidies [5]. It also is an improvement as it focuses on one specific industry as innovation processes vary greatly between industries [18]. The empirical results provide a solid foundation for industry-specific policy recommendations for a much larger range of policies to officials who are attempting to modernize the pesticides industry. Second, this study employs the Crépon, Duguet, and Mairesse (CDM) model, which corrects for selectivity and the endogeneity of R&D and innovation [19], to examine the entire process of innovation and the effect of government policies on innovation and productivity. As Crespi and Zuniga point out, innovation shocks (e.g., due to unexpected technological opportunities) may stimulate firms to invest more in new technological R&D, which could overestimate the impact of R&D investment [20]. The CDM model can partly solve this problem.
The rest of this paper unfolds as follows. Section 2 provides a literature review on the government policies aiming to improve innovation in the pesticide industry and facilitate the linkage between R&D investment, innovation, and firm productivity. Section 3 describes the model and datasets employed for empirical analysis. The econometric results are presented in Section 4. Section 5 provides the conclusion.

2. Literature Review

2.1. Policies and Impacts on Firms’ Innovation in China

Due to the public good attributes of new technology and information asymmetry, firms often lack incentives to innovate [21]. The Chinese government strongly encourages firms to develop independent innovations through a series of policies, such as establishing special funds for firm innovation, promoting cooperation between firms and public research sectors and institutes, strengthening IPR protection, reforming state-owned enterprises (SOEs), and establishing R&D research institutes [22].
Public research, as an external driving force for firm innovation, reduces the cost of firm innovation by providing new ideas and tools to the private sector, or exploiting the capacity of universities and research institutes to produce advanced knowledge, scientific breakthroughs, and scientists [23,24]. Public R&D investment in China increased from 65.6 billion yuan (USD 9.37 billion) in 2001 to 397.8 billion yuan (USD 56.83 billion) in 2018 [25]. However, there has been a debate on whether public R&D investment stimulates or crowds out private R&D investment. Hu et al. showed that basic agricultural R&D investment in the public sector increased private R&D investment in China, whereas applied agricultural R&D investment curbed private R&D investment [26]. In the pesticide industry, the Chinese government established a number of R&D centers, such as the National Pesticide Creation Center in the Southern and Northern China as well as the National Biological Pesticide Engineering Technology Research Center [14]. Shi and Pray found that public R&D investment in the pesticide industry has significantly improved firm innovation in China [15].
Intellectual property rights give patent owners a temporary monopoly over their inventions, allowing them to reap the benefits of the new technologies developed [21]. China joined the World Trade Organization (WTO) in 2001 and has amended laws on patents, trademarks, and copyrights as well as regulations on software protection since the WTO accession. Research has shown a stronger enforcement of IPR-boosted patent outputs and R&D investment in China [27,28]. Shi and Pray indicated that the amendment of patent law in China positively influenced innovation in the pesticide industry [5].
Production subsidies, as a key integral part of industrial policies, could help mitigate the market failure caused by the positive externality and non-excludability of knowledge in innovation activities [29,30,31]. Mao and Xu reported that up to 70% of the 1572 Chinese publicly listed firms received production subsidies in 2013 [32]. For example, Yang showed that production subsidies improve firm innovation in China [33]. Mao and Xu found a nonlinear relationship between production subsidies and innovation—only a moderate subsidies intensity was found to significantly stimulate firms’ new product innovation, while a high subsidies intensity was found to decrease new product innovation [32].
The Chinese government has taken measures to promote the inflow of FDI [34]. Some studies have found that FDI had a positive effect on firm R&D investment and patents [35], while others did not find such a relationship [36,37]. Fan and Hu showed that FDI did not affect the R&D of Chinese firms due to the weak enforcement of IPR in China [38].
SOEs are fundamentally different from private firms in China in terms of market power, ability to obtain loans from financial institutions, technological innovation, and access to other preferential policies [39]. Studies have shown that Chinese firms received nearly 60% of loans from the biggest four state-owned banks, where most of the loan went to the SOEs [40]. In recent decades, the reform of SOEs impacted firms’ R&D investment and innovation, but the empirical results were mixed. Research based on the World Bank surveys showed that the R&D investment and innovation outputs of SOEs were significantly higher than that of private firms in China [41]. However, based on Chinese industrial firms’ databases such as Annual Survey of Industrial Firms (ASIF), some studies found that SOEs have fewer R&D activities and have a lower productivity [42,43].
Nearly half of exporting firms in China sold over 70% of their output abroad, and half of these firms are “pure” exporters (namely selling all their output abroad) [44]. Exports are expected to affect firm innovation as they could learn from international experience and related technologies during the export process and often are forced to innovate in order to be competitive in foreign markets [45]. The Chinese government has formulated a number of policies and measurements to encourage firms to export, such as tax deductions and priority access to infrastructure and land [44]. There are mixed results in the literature on the impact of exports on firm innovation in China. Qiu and Yan, for example, indicated that exports significantly increased the productivity of Chinese manufacturing firms [46]. Shi and Pray found that exports spurred the innovation of Chinese pesticide firms [5]. In contrast, some researchers found that exports had no statistical effect on innovation performance among Chinese manufacturing firms [45,47].

2.2. The Relationship between Private R&D Investment, Innovation, and Firm Productivity

The literature provides three seminal studies that investigated firm innovation. Griliches provided a pioneer seminal work on the relationship between innovation and firm performance [48]. Pakes and Griliches developed knowledge production functions for the first time to simulate the relationship between innovation input and innovation output [49]. The CDM model extended the knowledge production framework into a recursive system to investigate the relationship between innovation input, innovation output, and firm productivity [50]. Using the CDM model, many studies found a similar positive effect of firm R&D investment on innovation output and productivity for developed countries. For example, Griffith showed that R&D investment improved innovation output, and innovation output spurred firm productivity in Europe [51]. Vahter showed that product and process innovations had a positive and significant impact on labor productivity in Estonia and Slovenia [52]. However, studies for developing countries offered mixed results [20]. Benavente found no significant effect of innovation on firm productivity among Chilean firms [53]. Howell found a positive association between R&D investment and innovation as well as innovation and productivity for Chinese manufacturing industry [34]. The relationship between R&D investment, innovation, and firm productivity for Chinese pesticide industry is important, but not well explored. This study intends to fill in this gap in the literature by using panel ASIF data and employing the CDM model.

3. Methodology

3.1. Conceptual Model

According to the CDM model, the innovation process of a firm mainly consists of three stages: the firm invests in R&D, the R&D input generates innovative output, and the innovative output further improves productivity [50]. Based on the CDM framework, we propose three hypotheses:
H1. 
The efforts of the Chinese government to encourage pesticide firms to innovate could increase firms’ R&D investment and innovation output.
The costs and benefits of firms’ investments will be evaluated when deciding on R&D investments. The efforts made by the Chinese government to encourage innovation, such as promoting cooperation between firm and public research institutions and strengthening intellectual property rights protection, can solve the problems of public goods attributes and the information asymmetry of new technologies. Thus, the efforts of the Chinese government could increase R&D investment by improving the profit expectations and reducing the innovation costs. In addition, the knowledge spillover of the public sector is also conducive to firms’ innovation output [23,24].
H2. 
Firms with more R&D investment produce more innovation outputs.
Firms can generate new knowledge and promote knowledge spillover to improve their innovation ability by investing in R&D. Pakes and Griliches found that R&D investment may increase firms’ knowledge accumulation, leading to innovation output. In this study, the output of innovation investment is measured by the number of patents or the sales share of innovative products [49].
H3. 
Firms with more innovation output will be more efficiency.
According to the endogenous growth theory, technological innovation is the endogenous driving force of economic growth when other input factors remain unchanged. Once innovation outputs are produced, the production sector can use the knowledge or technology to improve efficiency. Through this efficiency, primary inputs are translated into desired goods and services, or increased value for them by users, or both.

3.2. Empirical Model

The CDM model adapted based on the data availability for this study consists of three stages: (1) estimating a firm’s decision whether and how much to invest in in R&D; (2) estimating the determinants of innovation, where the number of patents and revenue share of new product sales are used, respectively, as a proxy; and (3) estimating the impact of innovation on firm productivity measured by total factor productivity (TFP).
Let subscripts i and t indicate firm and year, respectively, such that i = 1,2, ⋯, N and t = 1, 2, ⋯, T. We assumed that R&D investment by any individual firm, denoted by R D i , t * , was guided by Equation (1a) and researchers only observed whether firms invested in R&D investment denoted by R D i , t in Equation (1b) and how much they invested denoted by R i , t in Equation (1c).
R D i , t * = α P u b _ i n n i , t 1 + θ I P R i , t 1 + γ S u b s i d y i , t 1 + λ F D I i , t + σ O w n e r s h i p i , t + β E x p o r t i , t 1 + δ X i , t + ε i , t
R D i , t = { 0   i f   R D i , t * c 1   i f   R D i , t * > c
R i , t = { 0   i f   R D i , t = 0 R i , t *   i f R D i , t = 1
Several explanatory variables were incorporated to explain the latent variable, R D i , t * , in Equation (1a). As the literature suggests, we used pesticide invention patents developed by the public sector at the previous year as a proxy for public innovation, denoted by P u b _ i n n i , t 1 . The IPR protection strength was measured by the share of non-infringed patents in the cumulative number of patents, denoted by I P R i , t 1 . S u b s i d y i , t 1 refers to the lag of production subsidies received. F D I i , t refers to the share of FDI in total capital. The ASIF data report detailed capital sources, including state-owned capital, private capital, foreign-owned capital, and Hong Kong, Macao, and Taiwan-owned capital. We created a vector of ownership variables denoted by O w n e r s h i p i , t to capture the influence of state-owned capital on firm innovation, including majority state-owned firms if at least 50% of firm capital was state-owned, minority state-owned firms if firms own state-owned capital less than 50%, and non-state-owned capital firms if firms did not own any state-owned capital. Equation (1a) also controls for firm characteristics such as gross capitals, firm size measured by number of employees, and firm age. R D i , t in Equation (1b) is a binary variable indicating whether firm i invests in R&D or not. The combination of Equations (1a) and (1b) was estimated using the conditional fixed effects logit model. Equation (1c) was estimated using a random-effect Tobit model.
The second stage of the CDM model is to estimate firm innovation:
P i , t * = φ R i , t 1 ^ + α P u b l i c _ i n n o v a t i o n i , t 1 + θ I P R i , t 1 + γ S u b s i d y i , t 1 + λ F D I i , t + σ O w n e r s h i p i , t + β E x p o r t i , t 1 + δ X i , t + v i + u i , t
P i , t = { 0   i f   P i , t * < a P i , t *   i f   P i , t * a
We assumed that technological innovation outputs denoted by P i , t * were guided by Equation (2a) and researchers only observed how many technological innovation outputs denoted by P i , t in Equation (2b), measured by patent intensity and the revenue share of new product sales. Equation (2a) incorporates the lag of the predicted value from the first stage, R i , t 1 ^ , as it is expected that R&D investment takes time to generate innovation outputs. We employed the random effects Tobit model to estimate Equations (2a) and (2b).
The third stage of the CDM model is to estimate the effects of firm innovation on firm productivity. We denoted the total factor productivity estimated by the generalized method of moments (GMM) by T F P i , t and it is written in Equation (3) below:
T F P i , t = ω P i , t 1 ^ + α P u b l i c _ i n n o v a t i o n i , t 1 + γ S u b s i d y i , t 1   + λ F D I i , t + σ O w n e r s h i p i , t   + β E x p o r t i , t 1 + δ X i , t + u i + v i , t
Equation (3) incorporates a one-year lag of the predicted firm innovation denoted by P i , t 1 ^ from the second stage. The other independent variables for public innovation, production subsidies, ownership structures, and export value are also controlled for. Equation (3) was estimated by a fixed effects panel estimation model.

3.3. Dependent Variables

According to the CDM framework, the following five dependent variables are mainly included.
Two variables are used to measure the firm’s innovation investment: (1) firm decide to invest in R&D, which is equal to 1 if firm’s R&D investment more than 0, otherwise it is equal to 0; (2) the firm’s R&D investment intensity, the proportion of R&D expenditure to total sales. If only the amount of R&D investment is considered, the impact of the firm’s sales scale is ignored. Therefore, the proportion of R&D investment is a more objective indicator of innovation effort.
Innovative outputs use two variables as proxies: patent intensity and new product intensity, which represent the ability of firms to generate new knowledge and turn new knowledge into business value. Patent intensity is the total invention patent number divided by total sales revenue. The patent here refers to the invention patent because the invention patent can better reflect the firm’s ability to invent or create new knowledge relative to other types of patents such as design or appearance. New product intensity is used as another measure of innovation output, referring to the proportion of new product sales to total sales. According to the definition of the National Bureau of Statistics, the new product refers to a new product developed or produced using the new technology principle, new design concept, or significantly improved in terms of structure, material, process, and other aspects than the original product, thereby significantly improving product performance or expanding the product’s function. Since the firm’s main goal is to make a profit, the new product intensity indicator can better measure the ability of firms to convert new technology knowledge into products of commercial value.
Productivity is measured by the firm’s total factor productivity. In order to correct the simultaneity problem in estimating the TFP process, the GMM method is used for estimation. This is a generalized moment method proposed by Blundell and Bond, which aims to solve the endogeneity problem of the model [54]. The basic idea is to solve the endogeneity problem in the model by adding tool variables.
All variables are defined in Table 1.

3.4. Data

This study employed the unbalanced panel data of the ASIF from 2001 to 2007 collected by the National Bureau of Statistics of China. The dataset includes private firms with annual sales of at least 5 million RMB (around US USD 0.71 million) and all state-owned firms. The sample firms accounted for 90% of China’s industrial output and 95% of export value [55]. The dataset consists of a total of 1452 pesticide firms, accounted for over 90% of pesticide production in China. The dataset collects information such as location, ownership, sales value, export value, sales of new products, R&D investment, and number of employees. We utilized two data sources to collect patent information. First, we merged the ASIF data with patent data from the State Intellectual Property Office (SIPO). Second, we used the Patsnap patent database to compile patents applied by public sectors in the pesticide industry (https://www.zhihuiya.com; accessed on 23 April 2020).
Following Howell, we dropped firm observations if any of the variables (total sales, total employment, province code, and capital) were either missing or reported a negative value (N = 136) as well as firms with less than eight employees (N = 117) [34]. We also dropped 156 SOEs or 829 observations with less than 5 million RMB in sales revenue to keep them comparable with non-SOEs in the ASIF data. The final data used for this study consisted of 1326 pesticide firms in 2001–2007.
This study used the 2001–2007 ASIF data due to two main reasons. First, R&D investment data were available only for 2001, 2005, 2006, 2007, and 2010. However, the statistical caliber of the database changed to some extent after 2008. Second, many scholars have pointed out that the ASIF data are less unreliable after 2007 [
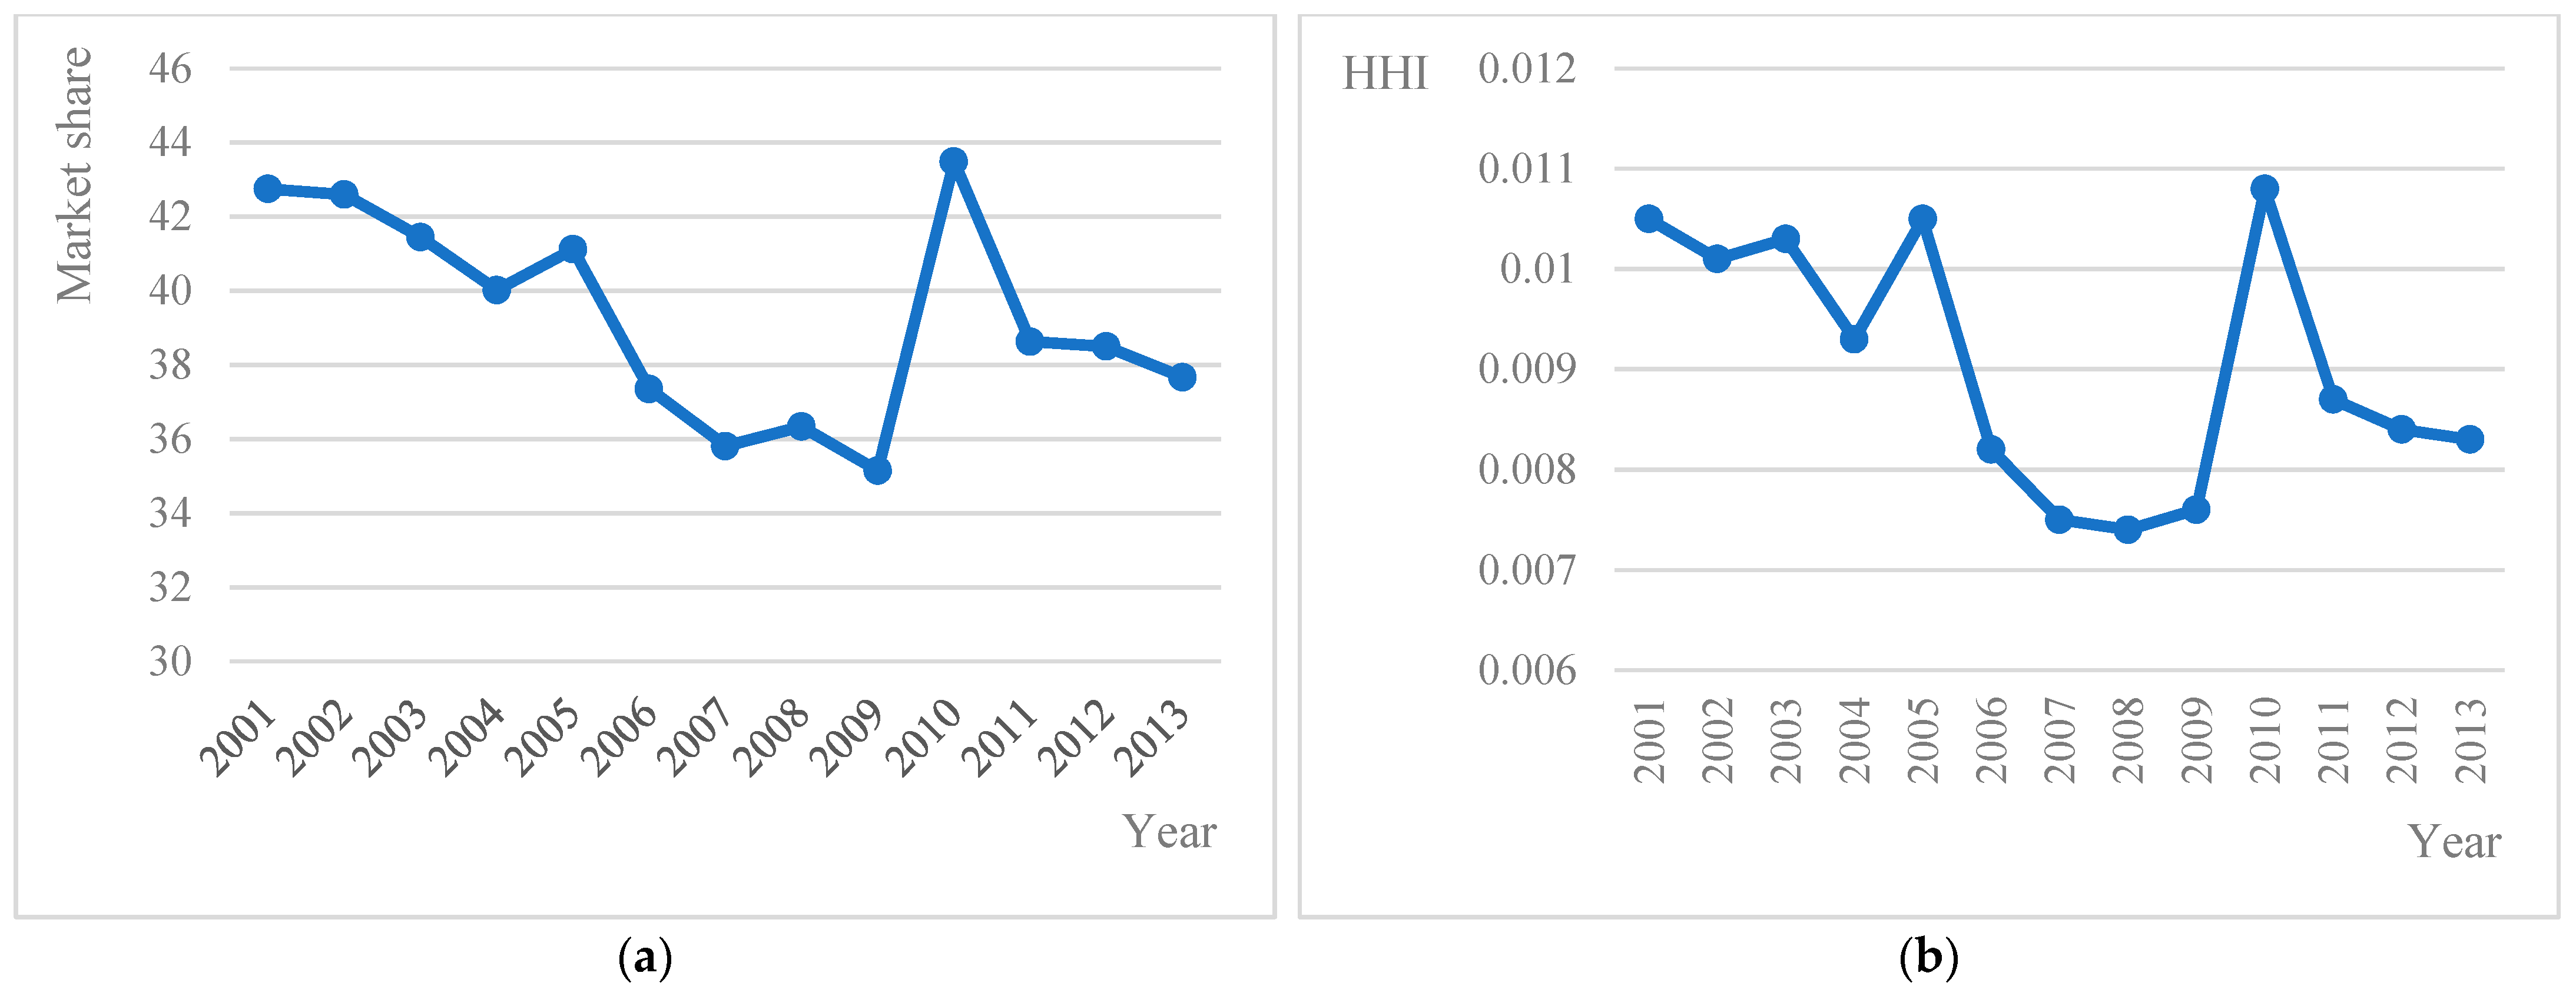
56]. The analyses based on the 2001–2007 data still provide a reasonable base to examine the relationship between R&D investment, innovation, and productivity of pesticide firms in China. First, China’s pesticide industry has not experienced significant changes recently. Take industry concentration as an example—the market share of the top 30 pesticide firms remained around 40% (Figure 1a) and the Herfindahl–Hirschman Index stayed at 0.010 (Figure 1b) from 2001 to 2013. Second, Chinese pesticide firms have faced similar challenges since the middle of 2000s, such as low industrial concentration, weak innovation, and product homogeneity. The Chinese government stated that innovation remained a driving force to make its pesticide industry more competitive in the fourteenth five-year plan. The government required further innovation from the pesticide firms. Therefore, the results of this study are still relevant to policymakers now and in the future.

4. Empirical Results

4.1. Descriptive Results

Table 2 provides summary statistics of the key variables. Howell showed that in the overall manufacturing industry, the expansion of firms in the ASIF data was because more private firms reached the threshold of sales revenue of RMB 5 million, but most of the new entrant firms did not have capacity to invest in R&D [57]. The pesticide industry was not an exception. Table 2 shows more pesticide firms in the ASIF data, increasing from 507 in 2001 to 795 in 2007 and the share of firms investing in R&D decreased from 35% in 2001 to 30% in 2007. On the other hand, the R&D investment intensity increased from 0.29% in 2001 to 0.38% in 2007. The patent intensity and the new products sales share did not change much, and firm productivity increased slightly in 2001–2007. Public innovation (patents) more than doubled, increasing from 105 in 2001 to 253 in 2007. The strength of IPR protection reached its peak in 2001, mainly because China entered the World Trade Organization (WTO) in 2001 and improved IPR protection.
The ASIF data collect government subsidies on production, but do not collect government subsidies on firms’ R&D [17]. As shown in Table 2, the share of pesticide firms that received government production subsidies decreased slightly in 2001–2007. As Table 3 shows, over 50% of firms that received government production subsidies invested in R&D, and this was almost double the firms that did not receive subsidies; firms that received production subsidies had a higher R&D investment intensity and a higher productivity than those who did not receive such subsidies.
Since China joined the WTO in 2001, the Chinese government lifted restrictions on foreign firm ownership structures. Driven by liberalization, China has rapidly become the country with the largest inflow of FDI. The share of FDI for China’s pesticide industry increased from 3.2% in 2001 to 4.7% in 2007 (see Table 2). Table 4 shows no statistical difference in R&D investment between firms with and without FDI in 2001, but firms with FDI had a higher share of firms investing in R&D, a higher revenue share of new product sales, and a higher TFP in 2007.
The ownership reforms significantly influenced the share of state-owned capital. The non-state-owned firms increased from 75.35% in 2001 to 92.96% in 2007, the share of firms owning at least 50% of state-owned capital decreased from 17.55% in 2001 to 4.40% in 2007, and the share of firms who had at most 50% state-owned capital decreased from 7% in 2001 to 2.6% in 2007. As shown in Table 5, in 2001, over 60% of the minority state-owned firms engaged in R&D, while the share decreased to nearly 48% in 2007. The proportion of non-state-owned firms with R&D investment decreased from 31% in 2001 to 28% in 2007. Although the proportion of non-state-owned firms with R&D was the lowest, the number of non-state-owned firms with R&D investment increased from 118 firms in 2001 to 210 firms in 2007. Moreover, patent intensity of non-state-owned firms was the highest, and minority state-owned firms had the highest share of new product sales in 2007.
The Chinese government carried out a variety of policies such as loan interest exemptions and tax reductions for exporting firms [58]. The share of exporting firms increased from about 60% in 2001 to nearly 65% in 2005, then fell back to 52% in 2007. As shown in Table 6, the exporting firms were more likely to have R&D investment (56% vs. 23%) and had a higher R&D investment intensity (0.6% vs. 0.3%) than non-exporting firms in 2007. The exporting firms also had a higher new production intensity and productivity.

4.2. Estimation Results

Table 7 summarizes the estimation results for the three-stage CDM model. The R&D investment decision in the first stage was estimated using the fixed-effects logit model and the estimation results are summarized in Columns (1), while the R&D investment intensity was estimated using a random-effects Tobit model and the results are presented in Column (2). The patent intensity and revenue share of new product sales were estimated by the random-effects model and presented in Columns (3) and (4), respectively. We estimated the TFP for the third stage by the fixed-effects model and summarized the results in Columns (5) and (6).
As we discussed in the estimating methodology section, we used the fixed effects logit model to estimate the R&D investment decision and a random effects Tobit model to estimate the R&D investment intensity in the first stage as well as a random effect Tobit models for patent intensity in the second stage. Since the estimated coefficients were not the same as the marginal effects in both the logit and Tobit models, we present the marginal effects of these estimations in Table 7 and their estimate results are summarized in the Table A1 in Appendix A. Based on the estimation results presented in Table 7, we present the following findings.
Firstly, we examined the H1, which is the impact of relevant policies on the innovation process of Chinese pesticide firms. Innovation in the public sector, measured by the number of patents applied by public institutes and universities, was positively and statistically significantly associated with patent application by pesticide firms, but it had no significant relationship with the R&D investment decision, the revenue share of new product sales, or firm productivity. These results suggest that innovation in public sectors could increase new technological opportunities available for private sectors to develop and commercialize, which is consistent with other studies [26,59]. Hu found that basic R&D investment by the public sector stimulated private R&D in agricultural and food sectors in China [26]. Our result implies that the Chinese government’s efforts in public pesticide research can effectively stimulate private patents by pesticide firms, consistent with the findings in previous research [5]. However, innovation in public sectors did not contribute to the development of new products measured by the revenue share of new product sales and the improvement of firm productivity.
The IPR protection was found to be positively associated with R&D investment by pesticide firms. Specifically, for every one percent point increase in the enforcement of IPR protection, R&D investment intensity would increase by 0.17. This finding is in line with Shi and Pray’s results [5,24]. Pray showed that stronger IPR enforcement often provides incentives for the private sector, especially input firms, to increase research [24]. Shi and Pray showed that the stronger enforcement of IPRs in China made pesticide firms more innovative [5].
Production subsidies were not found to be statistically associated with firms’ R&D and innovation output, but significantly improved firms’ productivity. The lack of a statistical association between government subsidies for production and firm innovation might be attributed to the following reason. Unlike subsidies in R&D, subsidies in production are used to improve yields and may not necessarily be used to overcome innovation barriers. Although sometimes one objective of production subsidies is to encourage technological upgrading, it is mainly targeted at production [17].
Table 7 also shows that FDI only had a significant and positive impact on TFP. This finding is consistent with Harrison, Love, and McMillan’s results [60]. When foreign capital flows into the host country, it often brings advanced technologies that benefit domestic firms [35] and ultimately improve firm productivity [43].
Table 7 suggests that the ownership structure based on the source of firms’ capital had no statistical association with R&D investment innovation output or productivity. In particular, no significant difference was found in innovation and productivity between state-owned firms and non-state-owned firms in China’s pesticide industry. Firms with a greater export value were more innovative, which is consistent with Shi and Pray’s results [5]. Under the strong support from the Chinese government, China’s pesticide industry has become more export-oriented, which is expected to improve innovation.
Secondly, we examined the H2 and H3, which are about the relationship between R&D investment, innovation output, and firm productivity of Chinese pesticide firms. The results show that R&D investment intensity had a significant effect on patent intensity. This is in line with some previous literature [51,57]. However, R&D investment intensity had no significant effect on the revenue share of new product sales. The findings can be partly explained by the fact that Chinese pesticide firms made great innovation efforts in developing different applications based on known active ingredients rather than developing new active ingredients [61]. The revenue share of new product sales had a statistically significant and positive association with TFP, but innovation measured by patent intensity had no statistical association with TFP. Most Chinese pesticide firms sell generic products that have passed the patent protection period or are highly homogeneous [45]. As mentioned before, only a handful of patents filed by Chinese pesticide firms were new active ingredients and the majority of patents were based on known compounds, which explains the modest impact of patents on a firm’s productivity [61]. If the Chinese pesticide firms aim to improve productivity, the focus should be on more fundamental technological development and innovation. Only this type of research and innovation could help firms launch new products, reduce process costs, increase market share, and finally increase productivity [62].

5. Conclusions and Policy Implications

Using the 2001–2007 ASIF data combined with patent applications for the Chinese pesticide industry, this study investigated the impact of government policies on R&D investment, technological innovation, and firm productivity. The emphasis of government policies focuses on public innovation, IPR protection, production subsidies, FDI, ownership structures (state-owned and non-state-owned firms), and exports. A structural CDM model was employed to quantify the relationship between R&D investment, innovation output, and firm productivity.
The results show that public innovation significantly increased firms’ patent applications but did not influence the revenue share of new product sales and firm productivities. The findings suggest that the public sector may transfer their innovation to pesticide firms, but it does not necessarily improve firm innovation in developing new products or enhance productivity.
If the main goal of government is to increase innovation which can ultimately improve farm income, agricultural productivity, and competitiveness of the pesticide industry in export markets, this analysis suggests that policies which encourage private research investment such as patent enforcement as well investments in R&D that lead to public sector patenting, can be important. Encouraging exports and increasing the sizes of firms can also stimulate innovation, but other government interventions such as encouraging foreign investment, changing industrial structure towards or away from state ownership, or providing production subsidies has no measurable and statistical impact on innovation.
If the main goal of government is to increase the productivity of pesticide firms which could help farmers through less expensive pesticides and pesticide firms be more competitive in foreign markets, this study suggests that the government should encourage firms to increase the revenue share of new product sales, provide production subsidies, and encourage FDI.
There are some limitations of this study. First of all, the data were from 2001 to 2007, which is too early and relatively short. Therefore, what we obtained was the short-term impact of relevant policies on the innovation and productivity of Chinese pesticide firms. Since the main aspects of the pesticide industry between 2001 and 2007 and late years are not distinctively different, as we discussed in the previous section, the findings can still be applied to later years. However, in the future, we would like to access more recent data. Second, this study used public sector patents as proxies for public innovation. We also lacked data on R&D investment of the public sector. Better variables are needed to measure R&D investment and innovation in the public sector.

Author Contributions

Conceptualization, C.P. and Y.J.; methodology, H.D.; software, C.Y. and H.D.; validation, R.H., C.P. and Y.J.; data curation, H.D., C.P. and Y.J.; writing—original draft preparation, C.Y. and R.H.; writing—review and editing, H.D. and Y.J.; su-pervision, R.H.; funding acquisition, R.H. and H.D. All authors have read and agreed to the published version of the manuscript.

Funding

This research was funded by the National Natural Science Foundation of China (71661147002 and 72003012).

Institutional Review Board Statement

Not applicable.

Informed Consent Statement

Not applicable.

Data Availability Statement

No new data were created or analyzed in this study. Data sharing is not applicable to this article.

Conflicts of Interest

The authors have no conflict of interest to declare.

Appendix A. The Estimation Results of the Original Coefficient

Table A1. Original coefficient of R&D investment, innovation output, and productivity models.
Decision to Invest in R&DR&D Investment IntensityPatent IntensityNew Product IntensityTFPTFP
Logit fixed-effects modelRandom-effects Tobit modelRandom-effects Tobit modelRandom-effects Tobit modelFixed-effects modelFixed-effects model
(1)(2)(3)(4)(5)(6)
R&D investment intensity 0.16 *2.23
(0.09)(6.17)
Number of patents 0.41
(37.30)
Sales share of new products 1.28 **
(0.57)
Number of patents applied by public institutes and universities−6.080.110.11 ***−4.12−2.07−2.86
(16.51)(0.07)(0.04)(2.51)(5.66)(5.62)
Strength of IPR protection−3.330.02 *0.00−0.16
(2.34)(0.01)(0.00)(0.24)
Production subsidy (million yuan)−0.050.000.000.000.02 **0.02 **
(0.03)(0.00)(0.00)(0.00)(0.01)(0.01)
Share of FDI−0.520.000.000.080.79 **0.84 **
(1.15)(0.00)(0.00)(0.14)(0.35)(0.35)
Major state-owned firm0.22−0.00−0.000.090.090.08
(0.54)(0.00)(0.00)(0.06)(0.16)(0.16)
Minority state-owned firm0.08−0.000.000.000.140.15
(0.61)(0.00)(0.00)(0.07)(0.18)(0.18)
Export value (billion yuan)3.770.000.01 **0.55 ***0.500.15
(2.37)(0.00)(0.00)(0.19)(0.44)(0.46)
Firm size0.56 **0.01 ***0.000.10 ***−0.21 ***−0.24 ***
(0.25)(0.00)(0.00)(0.04)(0.08)(0.08)
Firm age2.09 **0.00−0.00 ***0.050.590.48
(0.82)(0.00)(0.00)(0.04)(0.47)(0.46)
Gross capital−0.020.00−0.00−0.000.00 **0.00 **
(0.01)(0.00)(0.00)(0.00)(0.00)(0.00)
YEARYESYESYESYESYESYES
Constant −1.79 *−0.0214.8510.63 ***11.90 ***
(0.96)(0.34)(24.16)(1.20)(1.30)
sigma_u
_cons 0.02 ***0.01 ***0.67 ***
(0.00)(0.00)(0.04)
sigma_e
_cons 0.01 ***0.00 ***0.30 ***
(0.00)(0.00)(0.01)
N151434102328232815201520
R2 0.090.09
adj. R2 −0.57−0.56
Asterisks, ***, ** and *, represent the 1%, 5%, and 10% statistical significance levels. Numbers in parentheses are standard errors.

References

  1. Yan, D. Cost-benefit Analysis of China’s Chemical Agriculture to Ecological Agriculture Transformation. Contemp. Econ. 2018, 19, 96–98. [Google Scholar]
  2. National Bureau of Statistics of China. Pesticide Use (10,000 tons). In National Bureau of Statistics Official Website. 2018. Available online: http://www.stats.gov.cn/tjsj/ndsj/2018/indexeh.htm (accessed on 29 April 2020).
  3. Sharma, A.; Kumar, V.; Shahzad, B.; Tanveer, M.; Sidhu, G.P.S.; Handa, N.; Kohli, S.K.; Yadav, P.; Bali, A.S.; Parihar, R.D. Worldwide pesticide usage and its impacts on ecosystem. SN Appl. Sci. 2019, 1, 1446. [Google Scholar] [CrossRef] [Green Version]
  4. Chen, X.; Ma, L.; Ma, W.; Wu, Z.; Cui, Z.; Hou, Y.; Zhang, F. What has caused the use of fertilizers to skyrocket in China? Nutr. Cycl. Agroecosyst. 2018, 110, 241–255. [Google Scholar] [CrossRef]
  5. Shi, G.M.; Pray, C. Modeling agricultural innovation in a rapidly developing country: The case of Chinese pesticide industry. Agric. Econ. 2012, 43, 379–390. [Google Scholar] [CrossRef] [Green Version]
  6. FAO (Food and Agriculture Organization of the United Nations). FAOSTAT Database. 2017. Available online: http://www.fao.org/faostat/en/#data (accessed on 23 April 2020).
  7. Liu, J. Research on the development status and countermeasures of pesticide manufacturing industry in China. J. Guangdong Agric. Sci. 2012, 2, 219–222. [Google Scholar]
  8. Dextrain International. Present Status of Chinese Agriculture & Agrochemical Enterprises. 2017. Available online: http://www.dextrainternational.com/present-status-of-chinese-agriculture-agrochemical-enterprises/ (accessed on 23 April 2020).
  9. Zhang, W. The Strengthening of Monopoly of Pesticide Market in China by Multinational Corporations and the Countermeasures to Improve the Competitiveness of China’s Pesticide Industry. Pestic. Mark. Inf. 2009, 35, 13–16. [Google Scholar]
  10. Zhou, P. Research and new thinking on the development of pesticide industry under the new normal of economy. Pestic. Sci. Manag. 2016, 37, 1–14. [Google Scholar]
  11. China Industry Information Network. Analysis on the Current Situation and Future Development Trend of China’s Pesticide Industry in 2017; Beijing Zhiyan Kexin Consulting Co., LTD.: Beijng, China, 2017. [Google Scholar]
  12. Xu, L. From imitation to independent research and development: Intellectual Property is the accelerator for the rise of China’s pesticide industry. Pestic. Mark. Inf. 2019, 23, 24–26. [Google Scholar]
  13. Cai, G.; Zheng, G.; Xinxiao, M.A.; Rui, L.U. The Willingness of government to delegate power and the Reform of Mixed ownership in State-owned Enterprises. Econ. Res. 2008, 53, 99–115. [Google Scholar]
  14. Song, B.; Wu, J.; Li, X. Review and thinking of pesticide innovation research in China. Pestic. Sci. Manag. 2019, 40, 1–10. [Google Scholar]
  15. Gu, X.; Chen, Y.; Pan, S. Economic policy uncertainty and innovation—An empirical analysis based on China’s listed companies. Econ. Res. J. 2008, 605, 111–125. [Google Scholar]
  16. Yu, M.; Fan, R.; Zhong, H. China’s industrial policy and enterprise technological innovation. China Ind. Econ. 2016, 12, 7–24. [Google Scholar]
  17. Howell, A. Picking ‘winners’ in China: Do subsidies matter for indigenous innovation and firm productivity? China Econ. Rev. 2017, 44, 154–165. [Google Scholar] [CrossRef]
  18. Jirasek, M. The influence of national culture on changes in R&D expenses among agrochemical firms. Agric. Econ. -Zemed. Ekon. 2017, 63, 524–530. [Google Scholar]
  19. Lööf, H.; Mairesse, J.; Mohnen, P. CDM 20 years after. Econ. Innov. New Technol. 2017, 26, 1–5. [Google Scholar] [CrossRef]
  20. Crespi, G.; Zuniga, P. Innovation and Productivity: Evidence from Six Latin American Countries. World Dev. 2012, 40, 273–290. [Google Scholar] [CrossRef] [Green Version]
  21. Fuglie, K.; Gautam, M.; Goyal, A.; Maloney, W.F. Harvesting Prosperity: Technology and Productivity Growth in Agriculture; World Bank: Washington, DC, USA, 2020. [Google Scholar]
  22. China State Council. National Medium—And Long-Term Scientific and Technological Development Plan (2006–2020); China State Council: Beijng, China, 2005.
  23. Miao, W.; He, D.; Zhou, C. The difference of enterprise innovation behavior and the effect of government technology innovation expenditure. Econ. Res. J. 2019, 54, 87–101. [Google Scholar]
  24. Pray, C.E.; Nagarajan, L.; Naseem, A.; Anderson, J.R. Policies to Encourage Private Agribusiness to Contribute to Innovation and Agricultural Productivity in Developing Countries. In Background Paper for Harvesting Prosperity: Technology and Productivity Growth in Agriculture; World Bank: Washington, DC, USA, 2018. [Google Scholar]
  25. National Bureau of Statistics of China. Public R&D Investment (Billion Yuan). In National Bureau of Statistics Official Website. 2019. Available online: http://www.stats.gov.cn/tjsj/ndsj/2019/indexeh.htm (accessed on 29 April 2020).
  26. Hu, R.; Liang, Q.; Pray, C.; Huang, J.; Jin, Y. Privatization, Public R&D Policy, and Private R&D Investment in China’s Agriculture. J. Agric. Resour. Econ. 2011, 36, 416–432. [Google Scholar]
  27. Yin, Z.; Ye, J.; Huang, Y. Intellectual property protection and enterprise innovation: Transmission mechanism and its test. World Econ. 2013, 12, 111–129. [Google Scholar]
  28. Wu, C.; Tang, D. Law enforcement, technological innovation and enterprise performance in intellectual property protection—evidence from Chinese listed companies. Econ. Res. J. 2016, 11, 129–143. [Google Scholar]
  29. Arrow, K. Economic Welfare and the Allocation of Resources for Invention. J. Law Econ. 1962, 12, 609–626. [Google Scholar]
  30. Nelson, R.R. The Simple Economics of Basic Scientific Research. J. Political Econ. 2006, 67, 297–306. [Google Scholar] [CrossRef] [Green Version]
  31. Stiglitz, J.E. Markets, Market Failures, and Development. Am. Econ. Rev. 1989, 79, 197–203. [Google Scholar]
  32. Mao, Q.; Xu, J. The impact of government subsidies on new product innovation of enterprises—from the perspective of “moderate range” of subsidy intensity. China Ind. Econ. 2015, 6, 94–107. [Google Scholar]
  33. Yang, Y.; Wei, J.; Luo, L. Who is innovating with government subsidies?—Joint regulating effect of distortion of ownership and factor market. Manag. World 2015, 1, 83–94. [Google Scholar]
  34. Howell, A. Industry Relatedness, FDI Liberalization and the Indigenous Innovation Process in China. Reg. Stud. 2020, 54, 229–243. [Google Scholar] [CrossRef]
  35. Wang, H.; Li, D.; Feng, J. FDI and independent research and development: Empirical research based on industry data. Econ. Res. J. 2006, 2, 46–58. [Google Scholar]
  36. Fan, C.S.; Hu, Y. Foreign direct investment and indigenous technological efforts: Evidence from China. Econ. Lett. 2007, 96, 253–258. [Google Scholar] [CrossRef]
  37. Xing, F.; Zhang, J. The impact of foreign technology transfer on China’s independent R&D. Econ. Res. J. 2009, 6, 94–104. [Google Scholar]
  38. Fan, C.; Hu, Y.; Zheng, H. Theoretical and empirical research on the influence of FDI on technological innovation of domestic enterprises. Econ. Res. J. 2008, 1, 89–102. [Google Scholar]
  39. Wu, Y. Which type of ownership is the most innovative in China? World Econ. 2012, 6, 5–31. [Google Scholar]
  40. Nee, V.; Opper, S. Capitalism from Below: Markets and Institutional Change in China; Harvard University Press: Cambridge, MA, USA, 2012. [Google Scholar]
  41. Li, C.; Song, M. Innovation in Chinese manufacturing enterprises: Ownership and the role of CEO incentive. Econ. Res. J. 2010, 15, 135–137. [Google Scholar]
  42. Zhou, Y.; He, X.; Shen, Y. Research on influencing factors and output performance of independent innovation in Chinese industrial enterprises. Econ. Res. J. 2012, 47, 107–119. [Google Scholar]
  43. Wu, Y. Research on technological innovation capability of enterprises under different ownership. Ind. Econ. Res. 2014, 2, 53–64. [Google Scholar]
  44. Defever, F.; Riaño, A. Subsidies with export share requirements in China. J. Dev. Econ. 2017, 126, 33–51. [Google Scholar] [CrossRef] [Green Version]
  45. Zhang, J.; Li, Y.; Liu, Z. Do exports boost the productivity of Chinese companies? —Empirical evidence from Chinese manufacturers: 1999~2003. Manag. World 2009, 12, 18–33. [Google Scholar]
  46. Qiu, B.; Yan, Z. Heterogeneous export fixed cost, productivity and enterprise export decision. Econ. Res. J. 2015, 9, 142–155. [Google Scholar]
  47. Zhang, J.; Zheng, W. Innovation effect of Chinese local enterprises in the global value chain. Econ. Res. J. 2017, 3, 153–167. [Google Scholar]
  48. Griliches, Z. Research Costs and Social Returns: Hybrid Corn and Related Innovations. J. Political Econ. 1958, 66, 419–431. [Google Scholar] [CrossRef]
  49. Pakes, A.; Griliches, Z. Patents and R&D at the firm level: A first report. Econ. Lett. 1980, 5, 377–381. [Google Scholar]
  50. Crépon, B.; Duguet, E.; Mairessec, J. Research and development, innovation and productivity: An econometric analysis at the firm level. Econ. Innov. New Technol. 1998, 7, 115–158. [Google Scholar] [CrossRef]
  51. Griffith, R.; Huergo, E.; Mairesse, J.; Peters, B. Innovation and productivity across four European countries. Oxf. Rev. Econ. Policy 2006, 22, 483–498. [Google Scholar] [CrossRef]
  52. Vahter, P. An Econometric Study of Estonia and Slovenia: The Effect of FDI on Labour Productivity; Palgrave Macmillan: London, UK, 2006. [Google Scholar]
  53. Benavente, J.M. The role of research and innovation in promoting productivity in chile. Econ. Innov. New Technol. 2006, 15, 301–315. [Google Scholar] [CrossRef]
  54. Blundell, R.; Bond, S. Initial conditions and moment restrictions in dynamic panel data models. Econ. Pap. 1998, 87, 115–143. [Google Scholar] [CrossRef] [Green Version]
  55. Brandt, L.; Van Biesebroeck, J.; Zhang, Y. Creative accounting or creative destruction? Firm-level productivity growth in Chinese manufacturing. J. Dev. Econ. 2012, 97, 339–351. [Google Scholar] [CrossRef] [Green Version]
  56. Nie, H.; Jiang, T.; Yang, R. The current situation and potential problems of China’s industrial enterprise database. World Econ. 2012, 5, 142–158. [Google Scholar]
  57. Howell, A. Firm R&D, innovation and easing financial constraints in China: Does corporate tax reform matter? Res. Policy 2016, 45, 1996–2007. [Google Scholar]
  58. Chen, H. Encouraging the integration of export and financial subsidies. Shandong Econ. Strategy Res. 2001, 5, 36–37. [Google Scholar]
  59. Fuglie, K.; Clancy, M.; Heisey, P.; MacDonald, J. Research, productivity, and output growth in US agriculture. J. Agric. Appl. Econ. 2017, 49, 514–554. [Google Scholar] [CrossRef] [Green Version]
  60. Harrison, A.E.; Love, I.; Mcmillan, M.S. Global Capital Flows and Financing Constraints. J. Dev. Econ. 2004, 75, 269–301. [Google Scholar] [CrossRef] [Green Version]
  61. Lan, Q.; Yu, B.; Song, Y. Overview of Pesticide patent Applications in China. World Pestic. 2012, 34, 44–49. [Google Scholar]
  62. Hu, Y. Research on the Relationship between Technological Innovation Capability and Corporate Performance of High-Tech Enterprises; Jiangxi University of Finance and Economics: Nanchang, China, 2015. [Google Scholar]
Figure 1. Industry concentration of China’s pesticide industry in 2001–2013. (a) Market share of the top 30 pesticide firms in China (%). (b). HHI of pesticide firms in China.
Agriculture 12 00709 g001
Table 1. Definition of all variables.
Variable nameDefinition
R&D decisionEqual to one if a firm invested in R&D, and zero otherwise.
R&D intensityRatio of R&D expenditures in total sales revenue.
Patent intensityRatio of firm new invention patents number in total sales revenue.
New product intensityRatio of new product sales in total sales revenue.
Total factor productivity (TFP)TFP estimated by the generalized method of moments (GMM) method
Patents of public institutesNumber of pesticide patents applied by public institutes and universities by province, lag 1 year.
IPR protectionNon-infringement rate of patents in the province where a firm was located.
Production subsidies (million yuan)Production subsidies a firm received (million yuan).
FDI ShareShare of foreign capital to total capital.
Major state-owned firmEqual to one if government capital share was at least 50%, and zero otherwise.
Minority state-owned firmEqual to one if government capital share was positive but less than 50%, and zero otherwise.
Non state-owned firmEqual to one if a firm had no state-own capital, and zero otherwise.
Export (billion yuan)Firm’s export value (billion yuan).
EmployeeLog of firms’ employees.
Firm ageLog of firm’s age.
Gross capital (10 million yuan)Firm’s gross capital (10 million yuan).
Table 2. Summary statistics of key variables by year.
2001200220032004200520062007
Number of firms507515553688684740795
Dependent variables
R&D investment (1000 yuan)203.49 386.13535.18598.54
Firms investing in R&D (%)35.11 29.8230.4129.56
R&D intensity (%)0.29 0.320.410.38
Innovation output
Number of patents0.260.310.360.470.710.570.59
Patent intensity (%)0.070.070.100.120.100.090.06
Revenue share of new product sales (%)5.945.914.906.805.305.835.68
Firm’s TFP10.5610.6910.7310.5210.8911.1611.22
Independent variables
No. of public patents105175225201249253253
IPR protection (infringement rate, %)99.8899.8199.8299.8599.8799.8999.93
Having production subsidies (%)17.5519.2219.7116.2813.7415.5413.33
Production subsidies (1000 yuan)124.0087.12128.91184.61158.63279.13325.21
FDI share (%)3.203.543.384.084.084.294.68
Ownership
Majority state-owned firm (%)17.5514.1711.036.255.125.144.40
Minority state-owned firm (%)7.106.805.064.803.512.432.64
Non state-owned firm (%)75.3579.0383.9188.9591.3792.4392.96
Firms with export (%)27.2228.7425.3230.9627.4923.7819.37
Table 3. Summary statistics of key variables among firms with and without production subsidies in 2001 and 2007.
Without SubsidesWith Subsides
Year2001200720012007
No. of firm41868989106
Firms R&D investment measures
Having a positive R&D investment (%)31.1024.9653.9359.43
R&D investment intensity (%)0.270.300.420.90
Innovation output measures
Patent intensity (%)0.060.060.120.09
Revenue share of new product sales (%)5.574.677.6612.22
Firm productivity
TFP10.4111.1211.2311.87
Table 4. Summary statistics of key variables among firms with and without FDI.
Without FDIWith FDI
Year2001200720012007
Firm4757403255
Firms R&D investment measures
Having a positive R&D investment (%)35.1629.0534.3836.36
R&D investment intensity (%)0.310.360.080.56
Innovation output measures
Patent intensity (%)0.070.060.060.09
Revenue share of new product sales (%)5.955.465.828.70
Firm productivity
TFP10.4811.1611.6512.01
Table 5. Summary statistics of key variables among firms with different ownership.
Majority State-Owned FirmsMinority State-Owned FirmsNon-State-Owned Firm
Year200120072001200720012007
Firm89353621382739
Firms R&D investment measures
Share of firms having a positive R&D investment (%)39.3342.8663.8947.6231.4128.42
R&D investment intensity (%)0.200.540.470.430.300.37
Innovation output measures
Patent intensity (%)0.030.010.010.100.270.59
Revenue share of new product sales (%)10.048.864.0310.485.165.39
Firm productivity
TFP10.7811.5311.3712.2910.4311.17
Table 6. Summary statistics of key variables among firms with or without exports.
Without ExportsWith Exports
Year2001200720012007
Firm369641138154
Firms R&D investment measures
Share of firms having a positive R&D investment (%)27.6423.0955.0756.49
R&D investment intensity (%)0.280.320.340.62
Innovation output measures
Patent intensity (%)0.060.060.080.06
Revenue share of new product sales (%)4.623.819.4713.48
Firm productivity
TFP10.2510.9711.3712.26
Table 7. R&D investment, innovation output, and productivity models.
Decision to Invest in R&DR&D Investment IntensityPatent IntensityNew Product IntensityTFPTFP
(1)(2)(3)(4)(5)(6)
R&D investment intensity 2.39 *0.75
(1.28)(2.07)
Number of patents 0.41
(37.30)
Sales share of new products 1.28 **
(0.57)
Number of patents applied by public institutes and universities−1.30 × 10−231.091.66 ***−1.38−2.07−2.86
(4.27 × 10⁻²³)(0.70)(0.54)(0.84)(5.66)(5.62)
Strength of IPR protection−7.11 × 10−240.17 *0.00−0.05
(7.2010−24)(0.09)(0.05)(0.08)
Production subsidy (million yuan)−1.02 × 10−250.000.000.000.02 **0.02 **
(1.87 × 10⁻²⁵)(0.00)(0.00)(0.00)(0.01)(0.01)
Share of FDI−1.11 × 10−240.000.010.030.79 **0.84 **
(3.10 × 10⁻²⁴)(0.04)(0.03)(0.05)(0.35)(0.35)
Major state-owned firm4.66 × 10−25−0.01−0.010.030.090.08
(1.39 × 10⁻²⁴)(0.02)(0.02)(0.02)(0.16)(0.16)
Minority state-owned firm1.78 × 10−25−0.010.020.000.140.15
(1.36 × 10⁻²⁴)(0.03)(0.02)(0.02)(0.18)(0.18)
Export value (billion yuan) 8.04 × 10−240.040.08 **0.18 ***0.500.15
(1.48 × 10⁻²³)(0.04)(0.03)(0.06)(0.44)(0.46)
N151434102328232815201520
R2 0.090.09
adj. R2 −0.57−0.56
The values shown in the table are marginal effects. Asterisks, ***, ** and *, represent the 1%, 5%, and 10% statistical significance levels. Numbers in parentheses are standard errors.
Publisher’s Note: MDPI stays neutral with regard to jurisdictional claims in published maps and institutional affiliations.

