
Performance of Nigerian Rice Farms from 2010 to 2019: A Stochastic Metafrontier Approach

1
Institute of Agricultural Economics and Development, Graduate School Chinese Academy of Agricultural Sciences, 12 South Avenue, Zhongguancun, Haidian District, Beijing 100081, China
2
Smart Green Development Nigeria, Ltd., 4, Odo-Isolo Street, Ilasa Ekiti 370104, Nigeria
3
China Economics and Management Academy, Central University of Finance and Economics, 39 South College Road, Haidian District, Beijing 100081, China
*
Author to whom correspondence should be addressed.
Agriculture 2022, 12(7), 1000; https://0-doi-org.brum.beds.ac.uk/10.3390/agriculture12071000
Submission received: 26 April 2022
/
Revised: 5 July 2022
/
Accepted: 5 July 2022
/
Published: 11 July 2022
(This article belongs to the Topic New Trends in Agri-Food Sector: Environmental, Economic and Social Perspectives)
Abstract
:Rice has become the most rapidly growing staple food crop in Nigeria. Despite the country favorable rice production ecology, there is still a huge gap between domestic rice production and consumption patterns. This study uses a two-step stochastic metafrontier model to estimate the performance of rice farms from 2010 to 2019, considering the differences between the North and South rice farms. The results indicate heterogeneity in production technology across farms located in different regions, and that both regions have low technical efficiency. However, Nigeria’s South rice farms were ranked better based on managerial issues rather than technological gaps. To attain self-sufficiency in rice production as proposed in its national plan, there is room for improvement of technical efficiency and output production at current production levels in the country’s rice farms.
1. Introduction
Rice has become the most rapidly growing food crop in Nigeria [1,2,3,4]. However, the literature reflects a massive gap between domestic rice production and consumption [5,6,7]. For instance, Nigeria produced between 2.8 to 3.8 million tons of rice from 2010 to 2018 [8,9]. On the other hand, domestic demand rose by 4% to hit 6.7 million tonnes during the 2017/18 season [10,11]. This imbalance in domestic rice production has resulted in a significant rice import surplus, making the country a top rice importer [12,13,14,15].
Nigeria, however, has potential agricultural capacity with favorable ecologies for rice cultivation, virtually having all rice-growing ecosystems [16]. Thus, the country’s inability to match its domestic demand has raised several concerns in the policy circle and among researchers. One of the principal explanations for this problem in the literature is the persistently low efficiency of inputs and the lack of modern agricultural technologies [7,17,18]. Increasing domestic rice production was included in Nigeria’s Economic Recovery and Growth Plan (ERGP) of 2017 to demonstrate further the importance of efficient resource utilization in rice production [19,20]. Uninterrupted productivity growth remains a key policy objective for the country’s rice self-sufficiency goal.
Little evidence exists on the growth performance of rice farms in sub-Saharan Africa. The number of extant studies has only focused on the technical efficiency of rice farms using cross-sectional data [7,21,22,23]. These studies have shown that technical efficiency in rice farms was as high as 0.55–0.86, even though rice yields were low [7,22,23]. However, Schmidt and Sickles [24] exposed several flaws in using cross-sectional models. First, the maximum likelihood method used to estimate the parameters and inefficiency depends on noisy distribution assumptions due to heteroscedasticity [25]. Second, technical inefficiency must be independent of the regressors, which is implausible if farms maximize profit and understand inefficiency [26]. Lastly, the model allows bias to affect results and cannot measure incidence; therefore, it cannot analyze behavior over time. In other words, estimation results based on cross-sectional data may be misleading. However, the panel model can relax some of the cross-sectional model distribution assumptions, allowing us to obtain efficiency estimates with more acceptable statistical properties [25,27].
We focus on two major research questions. First, we assess rice farms’ technical efficiency and dynamics in Nigeria, the largest rice-producing country in sub-Saharan Africa [28]. The availability of long-term farm-level data provides a unique opportunity for such analysis. Second, we explore the technological differences between Nigeria’s North and South rice farms using the stochastic metafrontier framework. We compare regional productivity and heterogeneity to examine whether economic growth convergence and regional movement toward the national production frontier exist. This regional productivity comparison has important implications for agricultural development or policy framework functioning, which are not yet well understood. Oseni et al. [29] argued that apparent differences exist between North and South Nigeria’s agricultural production. For instance, the northern region of Nigeria has been the main rice area given its climate and land abundance, accounting for 70% of the country’s rice [3]. Farms located in the Southern region are substantially smaller than those in the North. No study has illustrated how this difference affects rice farms in the country, and we fill this gap in the present study.
This study contributes to the literature in two ways. First, we employ nationally representative panel data, a paucity in this literature, which helps us improve our findings in terms of external validity. Most rice farm technical efficiency studies rely on cross-sectional data collected from a few purposefully selected farms in very narrow geographical areas throughout Nigeria [7,22,23,30,31,32]. To the best of our knowledge, no study has used nationally representative panel data from Nigeria. To better understand the growth performance of rice farms in Nigeria, which have a wide range of natural resources available to farmers, high levels of human capital, and significant regional heterogeneity in geographical conditions favorable to rice production [12,33]. In contrast to previous studies, we found low technical efficiency in Nigerian rice farms.
Second, this study contributes to the growing literature on the regional differential gap in rice production by testing whether rice farms in Nigeria’s North and South regions adopt the same production technology. We employed the two-step stochastic metafrontier production (SFP) approach proposed by Huang et al. [34], which allows the statistical properties necessary to draw statistical inferences from the model. To the best of our knowledge, this study is the first to use this new approach in rice farms. Earlier production and efficiency studies on rice production in Nigeria focused on estimating technical efficiency by assuming homogenous technology across farms [7,23,32,35]. However, our estimation results show that the production techniques employed by the rice farms located in the North are significantly different from those in the South.
2. Methodology
2.1. Stochastic Metafrontier Approach
In this study, we employ stochastic frontier analysis, which has been widely used in many studies, to measure the technological gaps between the observed and potential output that each region of rice farms could produce to the most reference productive frontier [36,37]. The classic stochastic frontier analysis introduced by Aigner et al. [38] and Meeusen and van Den Broeck [39] assume homogeneous technology for all firms. However, when heterogeneous technologies are present for different groups of firms in the sample, the estimation of production technology and inefficiency can be misleading [25]. Battese et al. [40] and O’Donnell et al. [41] suggested a two-step production approach to address such challenges. The main feature of their method is that firms are first to split into different groups based on some a priori sample separation information, such as various types, ownership, and locations. Once such a classification has been made, separate analyses for each specific group are performed. Inefficiency is then estimated relative to the group-specific frontier, and the difference in technology frontiers across groups is viewed as the technology gap [25,41]. Metafrontier production analysis has been widely used in similar studies [22,34,40,42,43,44].
Rice farms are split into Northern and Southern regions of the country, given that these two regions adopt heterogeneous production technology because of regional features, such as natural resources and environmental and climatic factors [29]. As a result of these constraints, farms in particular regions would be unable to use an ideal input–output allocation that would theoretically be possible given the overall technology available in the Nigerian rice industry [41]. The first step was to estimate the group-specific stochastic frontier using the approach described by Battese et al. [40] and O’Donnell et al. [41]. We employed the Huang et al. [34] method to estimate the second step, which allows the statistical properties necessary to draw a statistical inference.
A group-specific stochastic production frontier is formulated as:
According to Equation (1), signifies the total production in kilograms for each rice farm in the group at the period, represents the explanatory variable, and represents the m × 1 unknown parameters that are common to all technologies. represents the assumed functional form of the production frontier subscripted by t and j, which denotes that individual group-specific production technology may vary across groups and time.
According to Battese and Coelli [45], the technical inefficiency and random errors , the statistical noise is assumed to be independently and identically distributed. Although many distributional assumptions have been proposed for inefficiency terms in the SFP literature, we employ the Wang [46] specification of error term distributions:
In Equation (2), represents a set of explanatory variables that may affect farm efficiency performance, and denotes the vector of parameters related to the inefficiency effects with distributions that vary with as a result, they are no longer dispersed uniformly between farms.
The maximum likelihood technique can simultaneously estimate Equations (1) and (2) [45]. After estimating the region-specific frontier using Equations (1) and (2), a farm’s technical efficiency (TE) is defined as:
where denotes the input vector of the farm in the group, denotes the observed output produced by the rice farm in the group, and is the technical efficiency of the firm in the group.
Following Huang et al. [34], the metafrontier by definition envelops all individual groups′ frontier . Given the SFP estimates of the groups in Equation (1) from the first step, the estimation error of the group-specific frontier is expressed as:
In Equation (4), the estimation error is , and the relationship between the group-specific frontiers and the metafrontier is expressed as:
where the symmetric error represents the noise that represents the deviation between and . The non-negative technology gap component is assumed to be truncatedly distributed—normal and independent of .
According to Chang et al. [42], the two-step stochastic frontier approach enables the estimated group-specific frontier to be either smaller than or equal to the metafrontier because of the error in Equation (5). The ratio of the group’s production frontier to the metafrontier can be defined as the technology gap ratio (TGR), which is estimated according to the following formula:
where are the estimated composite residuals of Equation (5). The metafrontier technical efficiency (MTE) measures how distant each farm is from the metafrontier, and is computed as the product of the two previous measures:
In summary, the method of estimating the second step was the main difference between the Huang et al. [34] two-step stochastic approach and those proposed by Battese et al. [40] and O’Donnell et al. [41]. The model by Huang et al. [34] was estimated in the second step using a stochastic metafrontier, whereas those by Battese et al. [40] and O’Donnell et al. [41] were calculated using a deterministic programming technique. The random error is allowed in the Huang et al. [34] model so that the calculated TGR in Equation (5) is separated from random shocks. Statistical inferences can also be drawn from Equation (6) estimates using the maximum likelihood technique.
2.2. Empirical Model
The metafrontier approach employed in this study determines the relationship between a consistent set of output and input variables across the two regions within the sample period from 2011 to 2018. Owing to the well-known flexibility with which they present technology, the production functions stated in Equations (1) and (2) are considered to have a translog functional form, yielding the expression described in Equation (8). In addition, a time trend and its interactions with inputs are incorporated to account for technical changes. The function is expressed as follows:
where is the total output of rice produced by household i in years = 2010, 2013, 2015, and 2019; is the vector of inputs (land, labor, capital, and seed); t is the time trend; β and are the parameter to be estimated; denotes farms; j denotes North and South rice farm plots;; and . This study follows the two-step stochastic frontier approach to estimate the metafrontier analysis proposed by Huang et al. [34].
Following prior research aimed at evaluating rice farm production functions (e.g., [7,22,43,47,48,49,50], this study defines the output variable as the total output of rice produced by the household. We used the following inputs in this study: farm size (X1), own and hired labor hours (X2), cost of capital (X3), and quantity of seed used in kilograms (X4). Rice seeds are usually broadcast in the study area [31,51], making them important for rice production. We excluded fertilizers and pesticides because most rice farms did not use them, resulting in missing values. We used the household head’s years of education and age, the total number of household members, and time as variables that affect farming household efficiency.
2.3. Data and Descriptive Statistics
This study used the General Household Survey-Panel (GHS-Panel) data from 2010 to 2019. The GHS-Panel dataset was conducted by the World Bank Living Standard Measurement Study—Integrated Surveys on Agriculture (LSMS-ISA) in partnership with the National Bureau of Statistics (NBS), which is a national, zonal, and rural/urban level representative of Nigeria. The GHS-Panel aims to improve agricultural data collection in Nigeria by disaggregating crop, plot, and household data. The survey covered over 50 crops commonly grown in Nigeria, of which cassava, maize, cowpea, sorghum, millet, yam, and rice were the major crops. The data and documentation are freely available online (For information on the LSMS-ISA project and links to the data, see https://microdata.worldbank.org/index.php/catalog/3557 (accessed 20 January 2022)).
The GHS-Panel sample is a two-stage probability sample. The first wave (2010/11) sample size consists of approximately 5000 households covering all 36 states in the country and Abuja’s Federal Capital Territory [52]. The survey implementer tracked the initial sample during the second and third waves, including those who had migrated to a known location. After three consecutive visits to the same households, a partial new GHS-Panel sample was implemented in wave 4. The new household selection consists of 3600 new households and approximately 1500 from the original 5000 GHS-Panel households since 2010.
The number of observations in the analysis is presented in Table 1. Approximately 88% of the rice farms are located in the Northern part, while the remaining 12% are in the Southern region. Hence, the Northern part accounts for the bulk of rice farming plots in the country. This result is in line with the national statistics figure, which shows that less than 30% of rice is produced in the South [3]. The sampled rice farmers used in this study were nationally representative of rice farms in Nigeria.
Table 2 presents descriptive statistics of the North and South sample data variables. During the sample period, rice farms in the South had higher productivity; on average, they produced close to twice as much rice as their North counterparts (row 1). Concerning input factors, the rice farms located in the South consume more of every input except for land. For instance, as shown in the second row, the North rice farms have a larger farm size (1.907 Ha), approximately twice larger than that of the South (0.898 Ha). These results align with other studies, which suggest that the average farm in the Northern part of Nigeria is substantially larger [29]. In other words, the average yield per hectare of the South (2415.6/0.898 = 2689.9 kg/ha) is more than three times higher than that of the North (1355.0/1.907 = 710.5 kg/ha). The average number of annual man/h in the rice farms in the South is 2702.27 man/h, which exceeds the North’s annual man/h of 1785.119 man/h.
Similarly, rice farms in the South consume more seeds than their Northern counterparts. The traditional puddled transplantation system for rice cultivation is dominant in the North. Upland rice is the most commonly grown rice variety in the South, where seed broadcasting is common [29,51]. The average household size in the North is larger than that in the South, but with less education. This result is consistent with those of previous studies [29,53].
3. Estimation Result
3.1. Production Frontier Estimate and Specification Test
We begin our empirical analysis using two tests, following Sharp and Sharp [54] and Sipiläinen et al. [55]. First, we tested the null hypothesis of no skewness of the composed error using the Coelli [56] and Schmidt and Lin [57] tests. The skewness statistic values from the Coelli [56] and Schmidt and Lin [57] tests are negative (101.94 and −9.082, respectively) with p-values less than 0.01, which validates the production function. Therefore, the null hypothesis of no skewness is rejected. In other words, there is inefficiency, and the stochastic frontier model is appropriate.
Second, we tested the null hypothesis of whether rice farms in the North and South adopt the same production technology. This test is critical because if it is true, it is unnecessary to use the two-step method to estimate the metafrontier [34]. Hence, the technical efficiency estimates of both regions can be compared directly. The likelihood ratio was 3749.952, which is significant at the 1% level with 38 degrees of freedom. Therefore, the null hypothesis that North and South rice farmers utilize the same technology is ruled out by the Kodde and Palm critical value of 60.566, with 38 degrees of freedom, at the 1% confidence level [58]. In other words, a two-step approach to estimate the metafrontier is appropriate.
Table 3 presents the estimation results for region-specific (North and South) rice farms and the metafrontier production function. The linear, quadratic, and interaction terms of the (log) input variables are included in the translog production function. The Cobb–Douglas specification was rejected in favor of a more general specification of the translog function using a likelihood ratio test of 83.21 at a 1% significant level. As expected, most metafrontier input variables are significant, as shown in Table 3, which indicates that the production function is well fitted.
According to Kumbhakar et al. [25], time (t) must appear in the inefficiency function to capture the technical changes. The estimated coefficient for the year trend is negative and significant for both regions, implying a nontechnological change effect that diminishes over time. For instance, the output declines at a 5.67% yearly rate in the South (row 26 and column 3), which results in an average change in rice production of 51% for the sample period under consideration. Returns to scale (RTS), the percentage change in output caused by a proportional increase in the utilization of all inputs, are less than 1 in both regions. This result implies that both regions exhibit decreasing returns to scale. For example, if we double the number of inputs, we would obtain less than twice as much output.
The coefficient estimate of household size in the inefficiency function is statistically significant at the 1% level in the South (lower panel, Table 3). These results imply that an increase in the number of household members increases technical efficiency in the South. However, household size’s effect on rice’s technical efficiency is mixed. Okoruwa and Ogundele [7] found a negative relationship between household size and technical efficiency. By contrast, Al-hassan [59] found a positive association between household size and technical efficiency in Ghana. The insignificant effect of the household size in the North may be due to household size’s low quality and capabilities [60].
3.2. Various Efficiency Measures
Table 4 presents the efficiency measures obtained for each region between 2010 and 2019. As shown in panel a of Table 4, the technical efficiency estimates show how close farms are to their frontiers. As shown in the first row, the average values of TE in the Southern (0.378) and Northern regions (0.418) were relatively low. These findings imply that the highest production a rice farm can produce using its inputs is, on average, only around 37.8% of the maximum output that could be achieved in the South using the same resources and technology. Our results show that, in general, Nigerian rice farms appear to have room to grow at current levels of input utilization.
Our findings contradict previous studies showing that Nigerian rice farms’ technical efficiency is very high (for example, [7,32,35]). Okoruwa and Ogundele [7] showed that the average TE of rice was as high as 90%. They indicated that there is little opportunity to increase efficiency among the rice farms despite the average country yield of 1.2 tons per hectare, far behind the 6.2 tons per hectare in China [61,62]. The low TE found in this study is expected because most Nigerian rice farmers rely heavily on traditional technology with low use of modern inputs, such as fertilizers and improved varieties [12,30,31,63].
There is a gap between each region’s production technology and the metafrontier, as shown by the TGR values in panel b of Table 4. According to the TGR, the difference between rice farms in the regions and those near the metafrontier was relatively small. On average, rice farms located in the North have a technological advantage over those in the South. For instance, rice farms in the North produce approximately 88.2% of their potential output, given the overall technology available in the Nigerian rice industry. In contrast, rice farms in the South have an average of approximately 81.6% of their potential output. The mean difference for both TGR values is statistically significant with the Kruskal–Wallis equality of populations, with a rank test chi-squared value of 28.042 with a p-value of 0.0001. This result indicates that the production techniques employed by the rice farm located in the North were superior to those in the South.
The difference between the North and the South in technology adoption is consistent with reality. As discussed in Section 3, transplanting is widely used in the North, whereas direct seeding is more common in the South. In addition, the farm size in the North is larger than in the South. Because of these considerable spatial variations in geographical, climatic, and human capital levels, Oseni et al. [29] argued that the North–South production difference should be addressed for agricultural policy formulation. This study also confirms that the estimation results based on homogenous technology across farms in Nigeria might be misleading.
As shown in panel c of Table 4, both regions achieved substantially smaller values than those calculated from their respective group-specific frontiers. However, there were no differences between the North TE and its MTE because of its high TGR. In contrast, the differences in the magnitude of region-specific average technical efficiency and the average MTE in the South closely followed the region-specific technical efficiency scores instead of the TGR. This result suggests that technology adoption and managerial issues affect the actual yield in the study area [34].
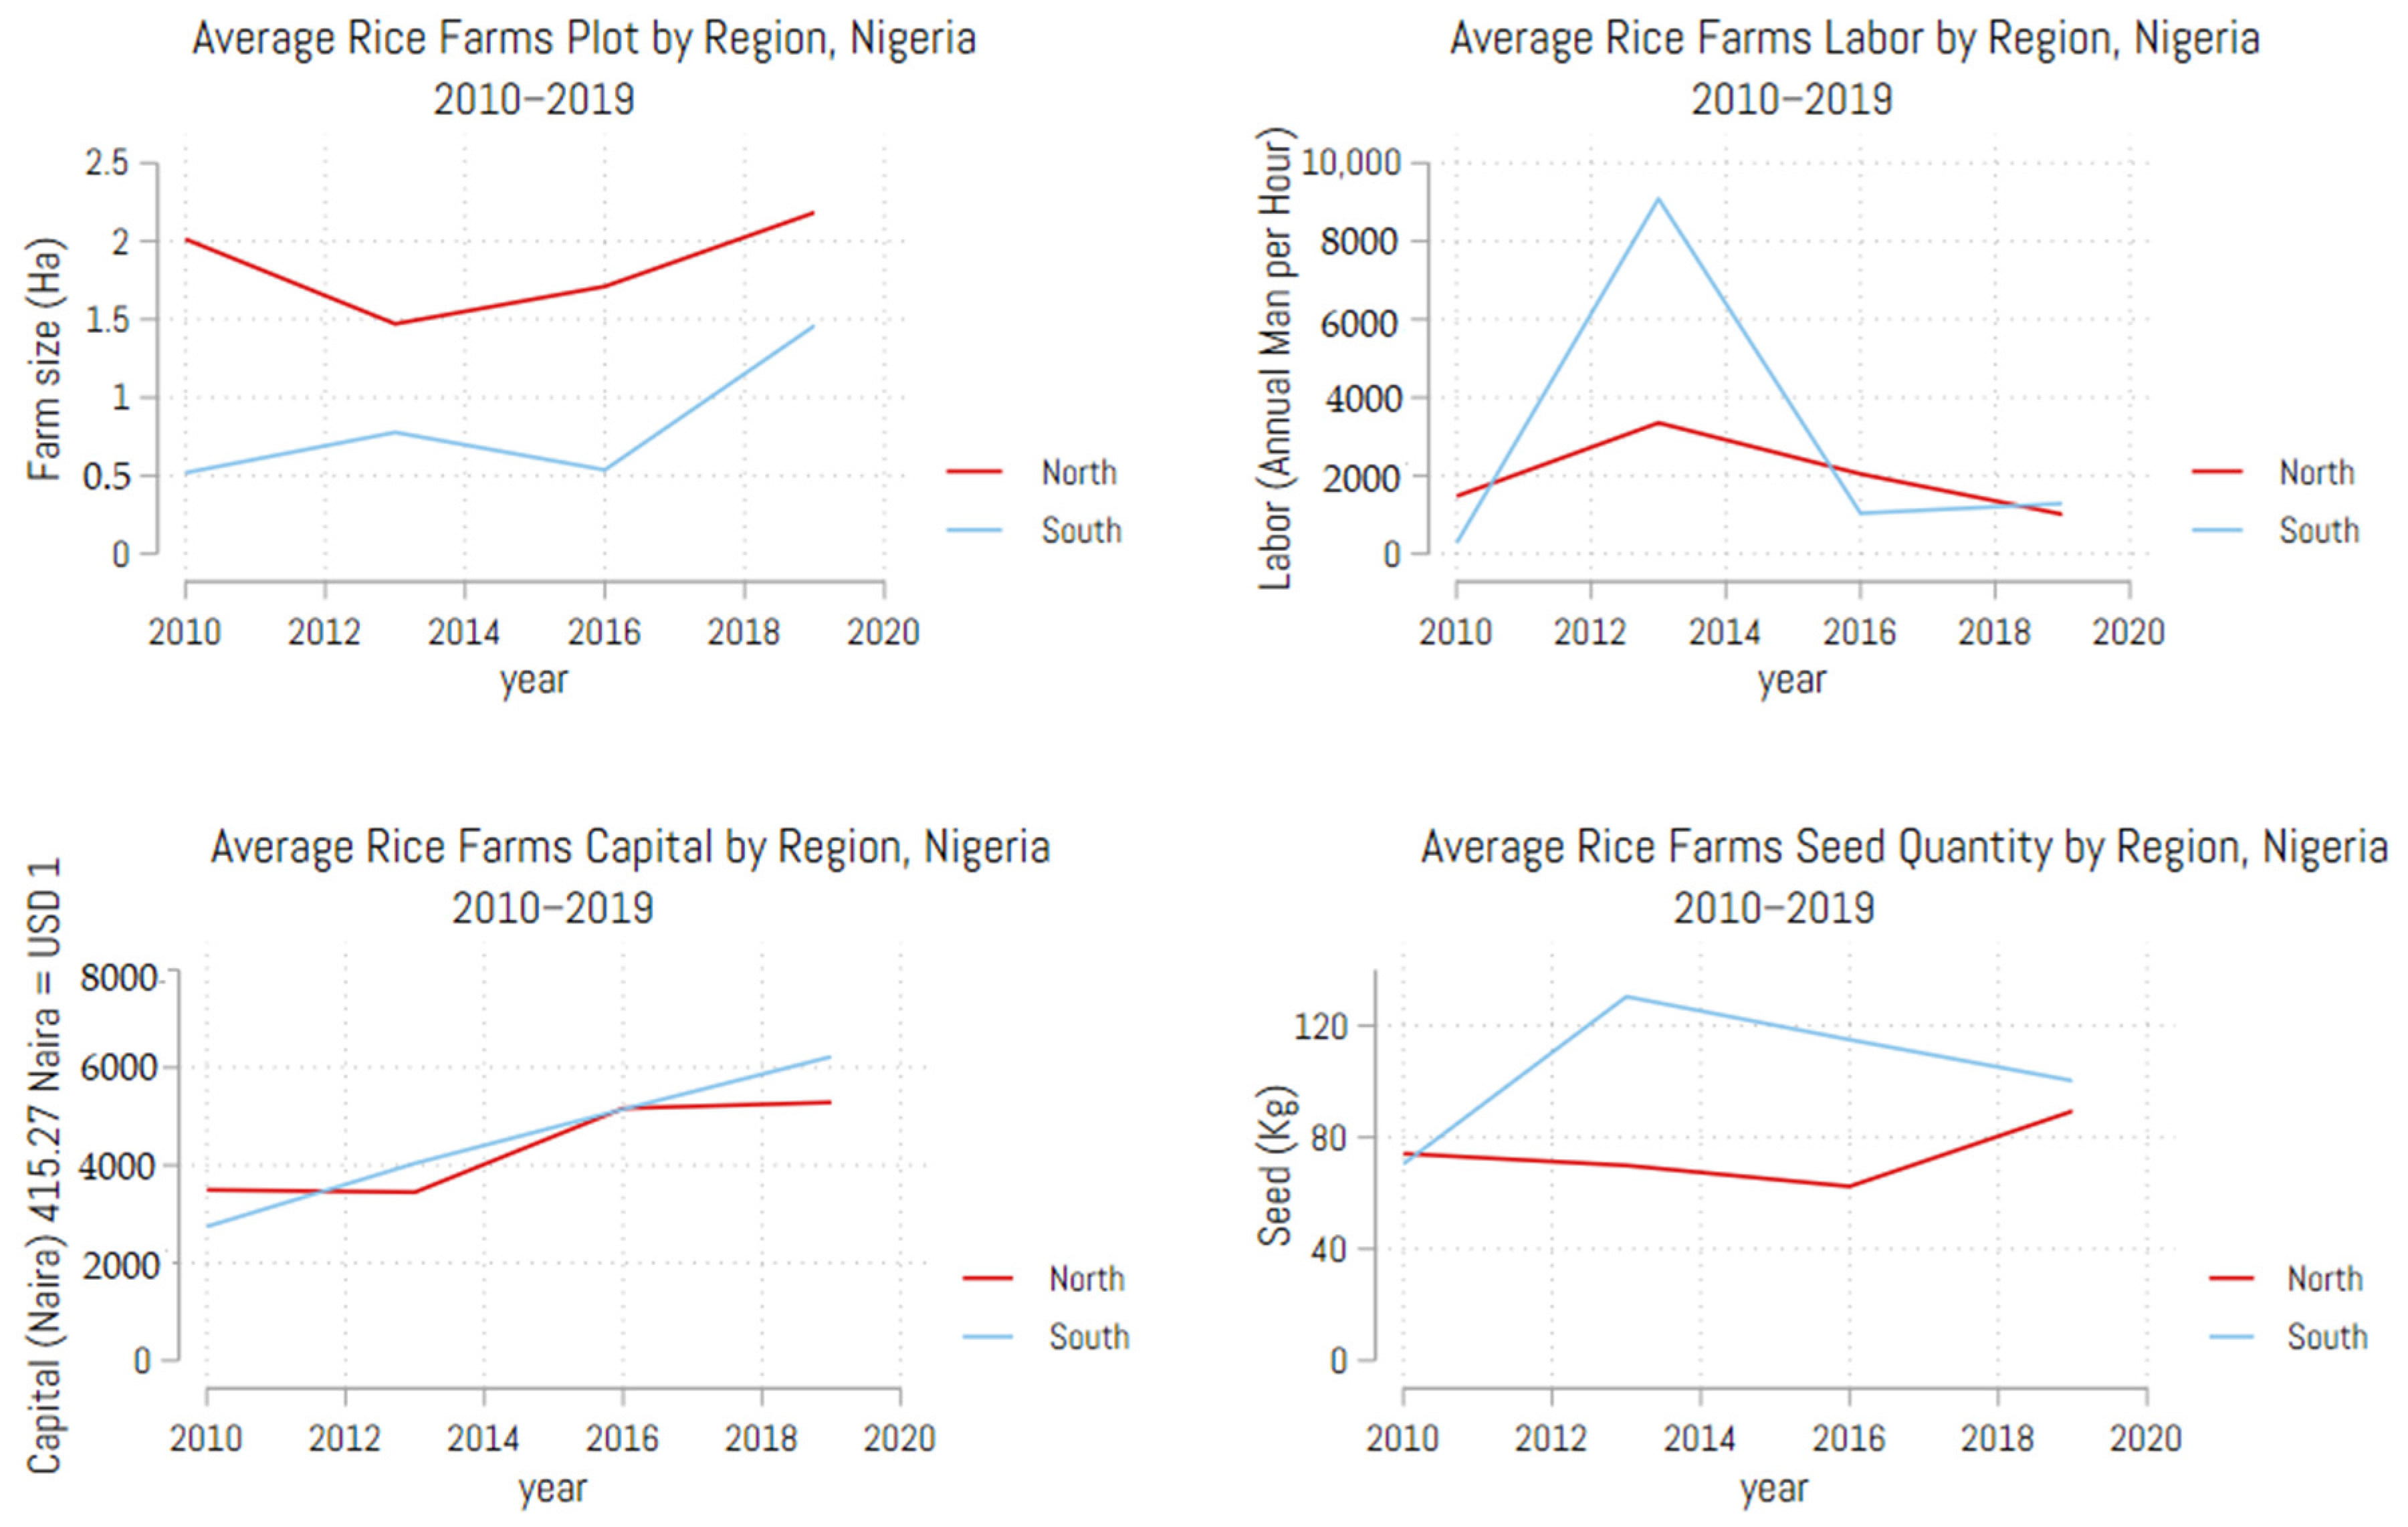
Figure 1 illustrates the mean values of region TE, TGR, and MTE in the North and South over time. Despite the steady TGR in the North, the TE declined from 2010 to 2019. This pattern may be due to the insecurity situation—Boko Haram has made farming activities in the region unstable [64,65]. In contrast, the average South efficiency score fluctuated. This diminishing trend in South rice farms’ technical efficiency follows most input trends over time, as shown in Figure 2.
Table 5 presents a detailed breakdown of the various efficiency measures by subregion within the North and South over the sample period. The average Northern subregion TE, TGR, and MTE were mostly the same. There were also no significant differences among the Southern subregions. However, the rice farms in the South East have the highest TE estimates (44.7%) and average MTE (37.5%) averaged, which is higher than the region’s overall average.
4. Conclusions and Policy Implications
Rice has become one of the major staple foods in Nigeria, but the local production is probably low due to low technical efficiency, among other factors. As a result, Nigeria has become the highest rice importer in SSA. In an attempt to reduce importation, self-sufficiency in rice production has become a priority policy. In this study, we focus on the performance of rice farms in Nigeria, comparing the difference between the Northern and Southern regions. Our national representative panel data analysis shows that rice farms in the South use more selected input variables, such as labor and seeds, than the North, whereas the North has a comparatively larger rice farm and household size. The estimation results from the stochastic metafrontier approach show that both regions exhibit low technical efficiency in relation to their respective frontiers. The metafrontier technical efficiency score demonstrated that the performances of rice farms in the North and South are relatively close, although that of the North is higher due to their superior technology. The time trends of technical efficiency score and technology provide more evidence for the accuracy of the above results. Our findings suggest that the problems in the North are managerially induced, while those in the South are more technologically induced.
Our findings have several implications. First, the metafrontier analysis shows that both regions have low TE in their respective frontiers. Additionally, region-specific technical efficiency estimates indicate that, on average, improvement in technical efficiency could increase rice production beyond the current production level in both regions. Therefore, agricultural planners and policymakers must take cognizance of the allowance for improvement in technical efficiency while considering policies for increased rice production. Second, although the significant TGR estimates indicate that both regions operate close to the given overall technology available in the Nigerian rice industry, shifting the national rice production frontier by adopting improved technologies is an important economic policy framework. Extension services targeted at rice farmers should consider improving technologies that will culminate in increased rice production while taking cognizance of the key role of economic incentives.
Our study is not without limitations. Technical fluctuations were observed in both regions throughout the study period. This influx can be ascribed to shifts in agricultural policies and unfavorable trends in agricultural commodity prices. Unfortunately, none of these are captured in our study. We recommend incorporating these factors into the performance estimation of rice production, which would be a worthwhile topic for future research. In addition, even though this study is based on national representative panel data, some unique questions about technology adoption and technical efficiency (e.g., variety of seed, number of years of planting a variety) are not recorded. If this information were available, we would be able to propose more specific policy implications.
Author Contributions
Conceptualization, T.S.O. and S.M.; methodology, T.S.O. and F.Q.; writing—original draft preparation, T.S.O., F.Q. and S.M.; software, T.S.O. and F.Q.; validation, F.Q. and S.M.; writing—reviewing and editing, T.S.O. and F.Q.; supervision, F.Q. and S.M.; fund acquisition, S.M. All authors have read and agreed to the published version of the manuscript.
Funding
The authors are grateful for the financial support provided by the Natural Science Foundation of China (NSFC), Projects of International Cooperation and Exchange (71761147005). We appreciate the support and cooperation from other team members.
Institutional Review Board Statement
Ethical review and approval were waived for this study due to its secondary data source.
Informed Consent Statement
Not applicable.
Data Availability Statement
For information on the LSMS-ISA project and links to the data, see https://microdata.worldbank.org/ (accessed on 20 January 2022).
Conflicts of Interest
The authors declare no conflict of interest.
References
- Badawi, T.A. Rice-based production systems for food security and poverty alleviation in the Near-East and North Africa: New challenges and technological opportunities. In Proceedings of the FAO Rice Conference, Rome, Italy, 24 September 2010; pp. 12–13. [Google Scholar]
- Balasubramanian, V.; Sie, M.; Hijmans, R.J.; Otsuka, K. Increasing rice production in sub-Saharan Africa: Challenges and opportunities. Adv. Agron. 2007, 94, 55–133. [Google Scholar] [CrossRef]
- Daramola, B. Government Policies and Competitiveness of Nigerian Rice Economy. In Proceedings of the Rice Policy and Food Security in Sub-Saharan Africa, Cotonou, Benin, 7–9 November 2005; p. 125. [Google Scholar]
- Seck, P.A.; Tollens, E.; Wopereis, M.C.S.; Diagne, A.; Bamba, I. Rising trends and variability of rice prices: Threats and opportunities for sub-Saharan Africa. Food Policy 2010, 35, 403–411. [Google Scholar] [CrossRef]
- Chauvin, N.D.; Mulangu, F.; Porto, G. Food Production and Consumption Trends in Sub-Saharan Africa: Prospects for the Transformation of the Agricultural Sector; UNDP Regional Bureau for Africa: New York, NY, USA, 2012; Volume 2, p. 74. [Google Scholar]
- Saito, K.; Dieng, I.; Toure, A.A.; Somado, E.A.; Wopereis, M.C.S. Rice yield growth analysis for 24 African countries over 1960–2012. Glob. Food Sec. 2015, 5, 62–69. [Google Scholar] [CrossRef]
- Okoruwa, V.O.; Ogundele, O.O. Technical efficiency differentials in rice production technologies in Nigeria. In African Economic Research Consortium Research Papers; African Economic Research Consortium: Nairobi, Kenya, 2006; p. 4. [Google Scholar]
- OECD/FAO. OECD, FAO. “Agriculture in Sub-Saharan Africa: Prospects and Challenges for the Next Decade”. OECD-FAO Agricultural Outlook, 2025, No. 181. 2016. Available online: https://www.fao.org/3/i5778e/i5778e.pdf (accessed on 10 March 2022).
- Udemezue, J.C. Analysis of rice production and consumption trends in Nigeria. J. Plant Sci. Crop Prot. 2018, 1, 305. [Google Scholar]
- Akomolafe, K.; Awoyemi, O.; Babatunde, A. Climate change and its effects on agricultural outputs in Nigeria. Asian J. Agric. Ext. Econ. Sociol. 2018, 25, 1–11. [Google Scholar] [CrossRef] [Green Version]
- Cochrane, N.; Childs, N.; Rosen, S. Haiti’s US Rice Imports; Electronic Outlook Report from the Economic Research Service, RCS-16A-01; US Department of Agriculture, Economic Research Service (ERS-NASS): Washington, DC, USA, 2016. [Google Scholar]
- Lançon, F.; David Benz, H. Rice imports in West Africa: Trade regime and food policy formulation. In Proceedings of the 106th Seminar of the EAAE Pro-Poor Development in Low-Income Countries: Food, Agriculture, Trade, and Environment, Montpellier, France, 25 October 2007; pp. 1–16. [Google Scholar]
- Nigatu, G.; Hansen, J.; Childs, N.; Seeley, R. Sub-Saharan Africa is Projected to Be the Leader in Global Rice Imports No. 1490-2017-3240; Amber Waves: The Economics of Food, Farming, Natural Resources, and Rural America; U.S. Dept. of Agriculture, Economic Research Service: Washington, DC, USA, 2017. [Google Scholar]
- Okpiaifo, G.; Durand-Morat, A.; West, G.H.; Nalley, L.L.; Nayga, R.M., Jr.; Wailes, E.J. Consumers’ preferences for sustainable rice practices in Nigeria. Glob. Food Sec. 2020, 14, 100345. [Google Scholar] [CrossRef]
- Yusuf, W.A.; Yusuf, S.A.; Adesope, A.A.; Adebayo, O.Z. Determinants of rice import demand in Nigeria. J. Appl. Sci. Env. Manag. 2020, 24, 923–931. [Google Scholar] [CrossRef]
- Longtau, S.R. Multi-Agency Partnerships in West African Agriculture: A Review and Description of Rice Production Systems in Nigeria; Eco-Systems Development Organisation: Jos, Nigeria, 2003; pp. 1–50. [Google Scholar]
- Dontsop-Nguezet, P.M.; Diagne, A.; Okoruwa, V.O.; Ojehomon, V.E.T. Impact of improved rice technology adoption (NERICA varieties) on income and poverty among rice farming households in Nigeria: A local average treatment effect (LATE) approach. Quart. J. Int. Agric. 2011, 50, 267–291. [Google Scholar]
- Seck, P.A. Can Rice Crisis Be Turned into an Opportunity for Africa? West African Rice Development Association (WARDA): Cotonou, Côte d’Ivoire, 2008; p. 15. [Google Scholar]
- Ako, R.M. Economic recovery and growth plan and nation-building in Nigeria. Int. J. Oper. Res. Manag. Soc. Sci. Educ. 2018, 4, 96–107. [Google Scholar] [CrossRef]
- Kalagbor, S.B.; Harry, D.M. Development policy, plan and economic diversification in Nigeria: Perspectives on economic recovery and growth plan. Eur. J. Dev. Stud. 2021, 1, 43–52. [Google Scholar] [CrossRef]
- Arouna, A.; Devkola, K.P.; Yergo, W.G.; Saito, K.; Frimpong, B.N.; Adegbola, P.Y.; Depieu, M.E.; Kenyi, D.M.; Ibro, G.; Fall, A.A.; et al. Assessing rice production sustainability performance indicators and their gaps in twelve sub-Saharan African countries. Field Crops Res. 2021, 271, 108263. [Google Scholar] [CrossRef] [PubMed]
- Ayinde, O.E.; Adewumi, M.O.; Ojehomon, V.E.T. Determinants of technical efficiency and varietal-gap of rice production in Nigeria: A meta-frontier model approach. In Proceedings of the International Association of Agricultural Economists Conference, Beijing, China, 16–22 August 2009; pp. 1–21. [Google Scholar]
- Tijani, A.A. Analysis of the technical efficiency of rice farms in Ijesha Land of Osun State, Nigeria. Agrekon 2006, 45, 126–135. [Google Scholar] [CrossRef]
- Schmidt, P.; Sickles, R.C. Production frontiers and panel data. J. Bus. Econ. Stat. 1984, 2, 367–374. [Google Scholar]
- Kumbhakar, S.C.; Wang, H.; Horncastle, A. A Practitioner’s Guide to Stochastic Frontier Analysis Using Stata; Cambridge University Press: Cambridge, UK, 2015. [Google Scholar]
- Mundlak, Y. Empirical production function free of management bias. J. Farm Econ. 1961, 43, 44–56. [Google Scholar] [CrossRef]
- Kumbhakar, S.C.; Lovell, C.K. Stochastic Frontier Analysis; Cambridge University Press: Cambridge, UK, 2003. [Google Scholar]
- Ayanlade, A.; Radeny, M. COVID-19 and food security in Sub-Saharan Africa: Implications of lockdown during agricultural planting seasons. NPJ Sci. Food 2020, 4, 13. [Google Scholar] [CrossRef]
- Oseni, G.; Corral, P.; Goldstein, M.; Winters, P. Explaining gender differentials in agricultural production in Nigeria. Agric. Econ. 2015, 46, 285–310. [Google Scholar] [CrossRef] [Green Version]
- Awotide, B.A.; Karimov, A.A.; Diagne, A. Agricultural technology adoption, commercialization and smallholder rice farmers’ welfare in rural Nigeria. Agric. Food Econ. 2016, 4, 3. [Google Scholar] [CrossRef]
- Liverpool-Tasie, L.S.; Barrett, C.B.; Sheahan, M.B. Understanding fertilizer use and profitability for rice production across Nigeria’s diverse agro ecological conditions. In Proceedings of the Annual Bank Conference on Africa, Paris, France, 23–24 June 2014. [Google Scholar]
- Rahji, M.A.; Omotesho, O.A. Technical inefficiency and competitiveness in production: The case of rice farmers in Niger State, Nigeria. Agrosearch 2007, 8, 67–80. [Google Scholar] [CrossRef] [Green Version]
- Van Der Ploeg, F. Natural resources: Curse or blessing? J. Econ. Lit. 2011, 49, 366–420. [Google Scholar] [CrossRef] [Green Version]
- Huang, C.J.; Huang, T.H.; Liu, N.H. A new approach to estimating the metafrontier production function based on a stochastic frontier framework. J. Product. Anal. 2014, 42, 241–254. [Google Scholar] [CrossRef]
- Ataboh, O.; Umeh, J.; Tsue, P. Determinants of technical efficiency among rice farmers in Kogi State, Nigeria. J. Agric. Sustain. 2014, 6, 39–49. [Google Scholar]
- Coelli, T.J.; Rao, D.S.P.; O’Donnell, C.J.; Battese, G.E. An Introduction to Efficiency and Productivity Analysis, 2nd ed.; Springer: Berlin/Heidelberg, Germany, 2005. [Google Scholar]
- Green, A.; Mayes, D. Technical inefficiency in manufacturing industries. Econ. J. 1991, 101, 523–538. [Google Scholar] [CrossRef]
- Meeusen, W.; Van Den Broeck, J. Efficiency estimation from Cobb-Douglas production functions with composed error. Int. Econ. Rev. 1977, 18, 435. [Google Scholar] [CrossRef]
- Aigner, D.; Lovell, C.A.K.; Schmidt, P. Formulation and estimation of stochastic frontier production function models. J. Econom. 1977, 6, 21–37. [Google Scholar] [CrossRef]
- Battese, G.E.; Prasada Rao, D.S.; O’Donnell, C.J. A metafrontier production function for estimation of technical efficiencies and technology gaps for firms operating under different technologies. J. Product. Anal. 2004, 21, 91–103. [Google Scholar] [CrossRef]
- O’Donnell, C.J.; Rao, D.S.P.; Battese, G.E. Metafrontier frameworks for the study of firm-level efficiencies and technology ratios. Empir. Econ. 2008, 34, 231–255. [Google Scholar] [CrossRef]
- Chang, B.G.; Huang, T.H.; Kuo, C.Y. A comparison of the technical efficiency of accounting firms among the US, China, and Taiwan under the framework of a stochastic metafrontier production function. J. Product. Anal. 2015, 44, 337–349. [Google Scholar] [CrossRef]
- Mariano, M.J.; Villano, R.; Fleming, E. Technical efficiency of rice farms in different agroclimatic zones in the Philippines: An application of a stochastic metafrontier model. Asian Econ. J. 2011, 25, 245–269. [Google Scholar] [CrossRef]
- Martinez Cillero, M.; Wallace, M.; Thorne, F.; Breen, J. Analyzing the impact of subsidies on beef production efficiency in selected European Union countries. A stochastic metafrontier approach. Am. J. Agric. Econ. 2021, 103, 1903–1923. [Google Scholar] [CrossRef]
- Battese, G.; Coelli, T. A model for technical inefficiency effects in a stochastic frontier production function for panel data. J. Econ. 1995, 20, 325–332. [Google Scholar] [CrossRef] [Green Version]
- Wang, H.J. Heteroscedasticity and non-monotonic efficiency effects of a stochastic frontier model. J. Product. Anal. 2002, 18, 241–253. [Google Scholar] [CrossRef]
- Chang, H.H.; Wen, F.I. Off-farm work, technical efficiency, and rice production risk in Taiwan. Agric. Econ. 2011, 42, 269–278. [Google Scholar] [CrossRef]
- Heriqbaldi, U.; Purwono, R.; Haryanto, T.; Primanthi, M.R. An analysis of technical efficiency of rice production in Indonesia. Asian Soc. Sci. 2015, 11, 91–102. [Google Scholar] [CrossRef]
- Khai, H.V.; Yabe, M. Technical efficiency analysis of rice production. Int. Soc. Southeast Asian Agric. Sci. 2011, 17, 135–146. [Google Scholar]
- Tan, S.; Heerink, N.; Kuyvenhoven, A.; Qu, F. Impact of land fragmentation on rice producers’ technical efficiency in South-East China. NJAS—Wagening. J. Life Sci. 2010, 57, 117–123. [Google Scholar] [CrossRef] [Green Version]
- Oyewole, C.I.; Ajayi, O.; Ojuekaiye, R.O. Evaluation of yields of seven upland rice (Oryzae sativa) cultivars sown by three methods in Anyigba, Kogi state, Nigeria. Afr. J. Agric. Res. 2010, 5, 2089–2096. [Google Scholar] [CrossRef]
- Osabohien, R. Contributing to agricultural mix: Analysis of the living standard measurement study–integrated survey on agriculture data set. Data Brief 2018, 20, 96–100. [Google Scholar] [CrossRef]
- Oladokun, Y.O.M.; Adenegan, K.O.; Salman, K.K.; Alawode, O.O. Level of asset ownership by women in rural North-East and South-East Nigeria. Wome. Stud. Int. Forum 2018, 70, 68–78. [Google Scholar] [CrossRef]
- Sharp, N.; Sharp, B. Technical efficiency and technological gap of New Zealand dairy farms: A stochastic meta- frontier model. J. Product. Anal. 2015, 44, 39–49. [Google Scholar] [CrossRef]
- Sipiläinen, T.; Kumbhakar, S.C.; Lien, G. Performance of dairy farms in Finland and Norway from 1991 to 2008. Eur. Rev. Agric. Econ. 2014, 41, 63–86. [Google Scholar] [CrossRef]
- Coelli, T. Estimators and hypothesis tests for a stochastic frontier function: A Monte Carlo analysis. J. Product. Anal. 1995, 6, 247–268. [Google Scholar] [CrossRef]
- Schmidt, P.; Lin, T.F. Simple tests of alternative specifications in stochastic frontier models. J. Econom. 1984, 24, 349–361. [Google Scholar] [CrossRef]
- Kodde, F.C.; Palm, D.A. Wald criteria for jointly testing equality and inequality restrictions. Econom. J. Econom. Soc. 1986, 54, 1243–1248. [Google Scholar] [CrossRef]
- Al-Hassan, S. Technical Efficiency of Rice Farmers in Northern Ghana; AERC Research Paper; African Economic Research Consortium: Nairobi, Kenya, 2008; p. 178. [Google Scholar]
- Ogundele, O.O. Technology differentials and resource-use efficiency in rice production in Kaduna State, Nigeria. Ph.D. Thesis, University of Ibadan, Ibadan, Nigeria, 2003. [Google Scholar]
- Peng, S.; Tang, Q.; Zou, Y. Current status and challenges of rice production in China. Plant Prod. Sci. 2009, 12, 3–8. [Google Scholar] [CrossRef] [Green Version]
- Yuan, L.P. Development of hybrid rice to ensure food security. Rice Sci. 2014, 21, 1–2. [Google Scholar] [CrossRef]
- Sheahan, M.; Barrett, C.B. Ten striking facts about agricultural input use in Sub-Saharan Africa. Food Policy 2017, 67, 12–25. [Google Scholar] [CrossRef] [PubMed] [Green Version]
- Adelaja, A.; George, J. Effects of conflict on agriculture: Evidence from the Boko Haram insurgency. World Dev. 2019, 117, 184–195. [Google Scholar] [CrossRef]
- Kah, H.K. ’Boko Haram is losing, but so is food production’: Conflict and food insecurity in Nigeria and Cameroon. Afr. Dev. 2017, 42, 177–196. [Google Scholar]
Figure 1.
Average various rice efficiency scores by region, 2010–2019.

Figure 2.
Average rice inputs over time.


Table 1.
Number of observations by year.
| Observations | North | South | Pool |
|---|---|---|---|
| 2018–2019 | 444 | 55 | 499 |
| 2015–2016 | 252 | 27 | 279 |
| 2012–2013 | 232 | 36 | 268 |
| 2010–2011 | 268 | 44 | 312 |
| Total | 1196 | 162 | 1358 |
Table 2.
Descriptive statistics of farm characteristics, 2010–2019.
| Notation | North | South | Pooled Sample | |
|---|---|---|---|---|
| Production frontier variables | ||||
| Total output (Kg) | Y | 1353.845 | 2415.558 | 1480.500 |
| Land (Ha) | X1 | 1.907 | 0.898 | 1.787 |
| Labor (AMH) | X2 | 1785.237 | 2702.270 | 1894.632 |
| Seed (Kg) | X3 | 76.522 | 101.323 | 79.480 |
| Capital (Naira) | X4 | 4502.601 | 4612.228 | 4515.679 |
| Technical efficiency drivers | ||||
| Household head education (years) | Z1 | 4.671 | 5.074 | 4.719 |
| Household size (number) | Z2 | 7.988 | 7.451 | 7.924 |
| Age (years) | Z3 | 46.397 | 52.377 | 47.112 |
Note: AMH means annual man per hour.
Table 3.
Parameter estimates of group-specific and metafrontier production frontier.
| Variable | North | South | Pooled | ||||
|---|---|---|---|---|---|---|---|
| Coefficient | SE | Coefficient | SE | Coefficient | SE | ||
| Production frontier drivers | |||||||
| Constant | 5.659 *** | 1.669 | 18.266 *** | 6.677 | 6.494 *** | 0.315 | |
| Land | X1 | −0.375 | 0.260 | 0.814 ** | 0.388 | −0.344 *** | 0.081 |
| Labor | X2 | 0.156 | 0.224 | −0.454 | 0.774 | 0.131 *** | 0.046 |
| Capital | X3 | 0.417 | 0.344 | −0.882 | 1.549 | 0.400 *** | 0.053 |
| Seed | X4 | −0.094 | 0.212 | −0.925 * | 0.531 | −0.228 *** | 0.061 |
| Time | t | −0.892 *** | 0.332 | −4.341 *** | 0.772 | −1.121 *** | 0.075 |
| Land2 | X11 | 0.013 | 0.018 | 0.103 ** | 0.044 | 0.035 *** | 0.010 |
| Labor2 | X22 | 0.013 | 0.014 | 0.099 ** | 0.040 | 0.017 *** | 0.003 |
| Capital2 | X33 | 0.014 | 0.022 | 0.080 | 0.108 | 0.019 *** | 0.003 |
| Seed2 | X44 | 0.043 *** | 0.016 | 0.163 *** | 0.047 | 0.053 *** | 0.005 |
| Time2 | t2 | 0.101 * | 0.055 | 0.351 *** | 0.125 | 0.115 *** | 0.008 |
| Land x labor | X12 | 0.024 | 0.024 | 0.042 | 0.040 | 0.045 *** | 0.008 |
| Land x capital | X13 | 0.012 | 0.028 | −0.200 *** | 0.050 | −0.012 | 0.012 |
| Land x seed | X14 | 0.052 ** | 0.024 | −0.044 | 0.029 | 0.028 ** | 0.013 |
| Labor x capital | X23 | −0.064 *** | 0.021 | −0.123 | 0.086 | −0.073 *** | 0.004 |
| Labor x seed | X24 | 0.018 | 0.018 | −0.009 | 0.054 | 0.016 *** | 0.005 |
| Capital x seed | X34 | −0.019 | 0.020 | −0.045 | 0.056 | −0.012 ** | 0.005 |
| Land x time | X1t | 0.012 | 0.028 | 0.260 *** | 0.050 | 0.046 *** | 0.011 |
| Labor x time | X2t | 0.037 | 0.023 | 0.047 | 0.063 | 0.050 *** | 0.005 |
| Capital x time | X3t | 0.011 | 0.024 | 0.229 ** | 0.114 | 0.012 *** | 0.005 |
| Seed x time | X4t | 0.017 | 0.020 | 0.137 *** | 0.051 | 0.024 *** | 0.005 |
| Technical efficiency drivers | |||||||
| Household head education (years) | Z1 | −0.058 | 0.068 | 0.158 | 0.169 | 0.090 | 0.116 |
| Household size (number) | Z2 | 0.127 | 0.179 | −0.650 * | 0.341 | 0.659 | 0.560 |
| Age (years) | Z3 | −0.715 | 4.691 | −15.339 | 12.772 | −1.289 | 8.880 |
| Age squared (years) | Z4 | −0.043 | 0.614 | 1.916 | 1.642 | 0.097 | 1.202 |
| Time | t | −0.477 *** | 0.110 | −0.510 *** | 0.175 | −0.462 ** | 0.193 |
| Variance | |||||||
| Household head education (years) | Z1 | 0.008 | 0.102 | 0.094 | 0.320 | 0.582 *** | 0.161 |
| Household size (number) | Z2 | −0.072 | 0.238 | 0.332 | 0.657 | −1.306 *** | 0.361 |
| Age (years) | Z3 | −22.847 ** | 10.821 | 157.182 *** | 57.265 | −1.090 | 11.453 |
| Age squared (years) | Z4 | −2.878 ** | 1.407 | −20.125 *** | 7.211 | 0.473 | 1.504 |
| Time | t | 0.315 ** | 0.145 | −2.275 *** | 0.594 | 0.617 *** | 0.103 |
| Log-likelihood | 1768.952 | 241.421 | 135.397 | ||||
Notes: Asterisks indicate significance at the 1% (***), 5% (**), and 10% (*) levels.
Table 4.
Summary statistics for the technological gap ratio (TGR) and the technical efficiencies obtained from the region-specific stochastic frontiers and the metafrontier production function.
Table 4.
Summary statistics for the technological gap ratio (TGR) and the technical efficiencies obtained from the region-specific stochastic frontiers and the metafrontier production function.
| North | South | Pooled | |
|---|---|---|---|
| a. Technical efficiency estimates | |||
| Mean | 0.378 | 0.418 | 0.383 |
| Standard dev. | 0.214 | 0.271 | 0.222 |
| Minimum | 0.009 | 0.001 | 0.009 |
| Maximum | 0.856 | 0.997 | 0.997 |
| b. Technological gap ratio estimates | |||
| Mean | 0.882 | 0.816 | 0.874 |
| Standard dev. | 0.044 | 0.138 | 0.067 |
| Minimum | 0.558 | 0.303 | 0.303 |
| Maximum | 0.968 | 0.988 | 0.988 |
| c. Metafrontier technical efficiency estimates | |||
| Mean | 0.333 | 0.339 | 0.333 |
| Standard dev. | 0.188 | 0.231 | 0.231 |
| Minimum | 0.007 | 0.001 | 0.001 |
| Maximum | 0.817 | 0.924 | 0.924 |
Table 5.
Subregional sample average TE, TGR, and MTE.
| TE | TGR | MTE | Observations | |
|---|---|---|---|---|
| North subregion | ||||
| North Central | 0.347 | 0.883 | 0.305 | 201 |
| North East | 0.383 | 0.884 | 0.337 | 240 |
| North West | 0.402 | 0.878 | 0.353 | 121 |
| South subregion | ||||
| South East | 0.447 | 0.843 | 0.375 | 113 |
| South South | 0.356 | 0.732 | 0.250 | 38 |
| South West | 0.327 | 0.824 | 0.279 | 11 |
Publisher’s Note: MDPI stays neutral with regard to jurisdictional claims in published maps and institutional affiliations. |
© 2022 by the authors. Licensee MDPI, Basel, Switzerland. This article is an open access article distributed under the terms and conditions of the Creative Commons Attribution (CC BY) license (https://creativecommons.org/licenses/by/4.0/).
Share and Cite
MDPI and ACS Style
Olasehinde, T.S.; Qiao, F.; Mao, S. Performance of Nigerian Rice Farms from 2010 to 2019: A Stochastic Metafrontier Approach. Agriculture 2022, 12, 1000. https://0-doi-org.brum.beds.ac.uk/10.3390/agriculture12071000
AMA Style
Olasehinde TS, Qiao F, Mao S. Performance of Nigerian Rice Farms from 2010 to 2019: A Stochastic Metafrontier Approach. Agriculture. 2022; 12(7):1000. https://0-doi-org.brum.beds.ac.uk/10.3390/agriculture12071000
Chicago/Turabian StyleOlasehinde, Toba Stephen, Fangbin Qiao, and Shiping Mao. 2022. "Performance of Nigerian Rice Farms from 2010 to 2019: A Stochastic Metafrontier Approach" Agriculture 12, no. 7: 1000. https://0-doi-org.brum.beds.ac.uk/10.3390/agriculture12071000
Note that from the first issue of 2016, this journal uses article numbers instead of page numbers. See further details here.