Article

Growth Performance, Meat Quality, and Fecal Microbial Population in Limousin Bulls Supplemented with Hydrolyzable Tannins

by
Andrej Mergeduš
1,
Marjan Janžekovič
1,
Dejan Škorjanc
2,
Tadeja Kraner Šumenjak
3 and
Maksimiljan Brus
1,*
1
Faculty of Agriculture and Life Sciences, University of Maribor, Chair of Livestock Breeding and Nutrition, Pivola 10, 2311 Hoče, Slovenia
2
Faculty of Agriculture and Life Sciences, University of Maribor, Chair of Animal Sciences, Pivola 10, 2311 Hoče, Slovenia
3
Faculty of Agriculture and Life Sciences, University of Maribor, Chair of Mathematical Methods, Informatics and Statistics in Agriculture, Pivola 10, 2311 Hoče, Slovenia
*
Author to whom correspondence should be addressed.
Submission received: 19 February 2022 / Revised: 12 May 2022 / Accepted: 24 June 2022 / Published: 28 June 2022
(This article belongs to the Special Issue Safety and Efficacy of Feed Additives in Animal Production)

Abstract

:
The objective of this study was to investigate the effects of supplementation of hydrolyzable tannins (HT) from sweet chestnut wood extract (Castanea sativa Mill.) to the diet of Limousin bulls on growth rate, carcass and meat quality traits, and fecal Clostridia strain levels in a 7-month feeding trial. Thirty-two bulls were randomly assigned to four treatment groups (CON (without addition of HT); TAN 1 (1 g HT kg−1 DM); TAN 2 (1.5 g HT kg−1 DM); and TAN 3 (1.5 g HT kg−1 DM with a nominally lower dose of concentrate). Compared with the CON group, supplementation with HT significantly (p < 0.050) increased bull growth rate during 4–7 months, whereas carcass and meat quality traits were unaffected during the last three months of fattening. Supplementation of HT significantly reduced meat drip loss (p = 0.000) compared with the CON group. No effects were observed on the total number of fecal Clostridia strains; however, the concentration of Clostridium perfringens was significantly lower (p = 0.004) in TAN 1 than that in the CON group. The results obtained in fattening bulls indicate that the addition of HT is justified in practice to improve growth performance and feed efficiency without adverse effects on the carcass and meat quality.

1. Introduction

The use of plant extracts has increased significantly in recent years, especially after the ban on the use of nutritive antibiotics in animal production in Europe in 2006 [1]. The emergence of resistance in pathogenic microorganisms mainly originating from the digestive tract of animals has caused public concern and led breeders to reflect on the necessary changes and immediate measures in the practical conditions of breeding. The relatively positive effects of various feed supplements of plant origin, such as essential oils, tannins, and others, was quickly discovered in non-ruminant breeding, which is not identical to the effect in ruminants [2]. A digestive tract adapted to the voluminous nature of the ration, with foregut-specific microbiota, is an additional obstacle to the rapid and effortless transfer of the norms of nutritional supplements of another animal groups.
Because of the voluminous nature of the diet, cattle can already absorb many of the above-mentioned amounts of active ingredients in a varied ration. Nevertheless, in intensive beef production, it is essential to control the microbial population in the foregut and reduce opportunistic pathogenic microbes of the normal intestinal microflora. Such properties are also possessed by plant secondary metabolites and are referred to as phytochemicals, phytogenes, or phytobiotics and could be a very suitable substitute for antibiotics in animal nutrition [3,4,5,6]. Tannins from higher plant species are proving to be very promising [7].
Tannins are found in different plant species and different plant parts, including bark, fruits, leaves, and roots, resulting in different physical and chemical properties [8,9]. Therefore, the bioactive properties of tannins depend on their chemical structure, which is even more important than their concentration [10,11]. Plants produce them as secondary metabolites for their own protection against consumption by herbivores [11]. The group of tannins is very diverse and can be divided into four groups based on their chemical structure: (i) condensed tannins or proanthocyanidins; (ii) HT; (iii) florotanins from brown algae; and (iv) complex tannins conjugated with metals or proteins [12]. In the literature, they are usually classified into two broad groups: HT gallic acid and glucose and condensed tannins consisting of flavonoids [13,14], both of which are found in small amounts in forage ingredients < 450 µg g−1 DM, [15]. HT is divided into two subgroups, gallotannins and ellagitannins [16]. Hydrolyzable tannins are a group of water-soluble polyphenolic compounds that possess antimicrobial, anti-inflammatory, antiviral, antioxidant, and antiparasitic activities [17,18].
Feed additives according to (EC) No. 1831/2003 [19] are divided into four categories: technological additives, sensory additives, nutritional additives, and zootechnical additives. According to current knowledge, HT from sweet chestnut is classified in the second category, sensory additives, and in the subcategory (b) flavoring agents with the active substance level [20]. Therefore, our research aims to elucidate and expand the knowledge of the activity of HT beyond the bureaucratically limited framework that describes only the definition of potential effects.
In the scientific and professional literature, we often find a general use of the term food supplement, which does not necessarily correspond to the definition and categorization of the EU standards for plant extracts. Some studies on tannins intended for transfer to ruminants have been performed in vitro [21], on cannulated or fistulated animals, on small ruminants, and in individual small laboratory tests. Mostly, these tests examine the effective concentration (fattening lambs—20.8 g HT kg−1 DM and sheep—34.0 g HT kg−1 [22], higher concentrations (generally >50 g kg−1 DM [23]) on rumen microflora, mechanism and efficiency of bypass proteins [24,25,26], growth of animals, meat quality [18,27,28], health problems caused (kidney and liver damage [8]), and antimicrobial activity (mechanism [29] on microbes in feces (Escherichia coli, Staphylococcus aureus, Pseudomonas aeruginosa, Aspergillus niger and Candida albicans [30], Clostridium perfringens [31], and Clostridia [30,31]). However, a variety of plant materials with unclear composition and varying tannin content have been used in research [21,23,25,32,33].
In the available literature, we found no study in which bulls were fattened under commercial fattening conditions at modest feed rations with a small amount HT of known composition. Therefore, the objective of this study was to determine the effects of adding chestnut (Castanea sativa Mill.) tannin extracts with a high HT content at low concentrations of 1.0 to 1.5 g kg−1 DM to the diets of fattening bulls. We investigated their effect on growth and fattening traits, carcass quality and meat quality of bulls. In addition, the effect of HT on the microbiological condition (Clostridia) of bull feces was estimated.

2. Materials and Methods

The animal procedure was conducted at an experimental farm located in NE Slovenia (46°5′ N, 15°8′ E), followed the Slovenian Law on Animal Protection, and approved feed additives were used (European Union Register of Feed Additives, 2013) [34]. The ethics committee’s approval was not required.

2.1. Animals, Housing and Diets

Thirty-two Limousin bulls were included in the 7-month trial to evaluate the effect of various levels of supplementation of hydrolyzable tannin (chestnut tannin: C. sativa Mill.) on growth, carcass and meat quality traits, and fecal Clostridia strains.
At an average body weight (BW) of 432 ± 43 kg, thirty-two bulls were randomly assigned to one of four treatment groups (a completely randomized design). The bulls were housed in collective pens (eight animals per pen), where they were kept for the duration of the trial. All identical pens located in the same barn consisted of a standard slatted concrete floor area 6 × 4 m, equipped with identical water troughs. Equal feeding conditions were ensured for all bulls and individual bulls served as experimental units.
Animal BWs were equalized at the beginning as much as possible, both within and between individual groups. Highly homogeneous groups facilitated a viable experiment and comparison of groups during the trial.
Animals were fed a total mixed ration (TMR). The composition of the basal diet is presented in Table 1. Diets were prepared daily, and rations were formulated to meet the requirements of medium-frame finishing bulls [35]. During the feeding trial, the feed ratios for bulls were optimized twice according to BW to meet their nutritional requirements.
Commercially available Farmatan-D®, wood extract rich in HT, was obtained from Tanin d.d. Sevnica (Sevnica, Slovenia); the supplement originating from sweet chestnut wood (Castanea sativa Mill.). All wood extracts were in powder form before use. Suitable quantities of wood extracts were mixed into feed rations on the DM bases. The chemical compositions of the wood extracts rich with hydrolyzable tannins: major components (%) of Farmatan-D (hydrolyzable tannins 74.3, vescalin 0.9, castalin 1.7, roburin A 0.2, gallic acid 2.4, roburin B/C 2.1, grandinin 0.9, roburin D 1.0, vescalagin 4.7, roburin E 1.5, castalagin 4.1, ellagic acid 0.8.). The supplement was used in the three groups and compared with the control group.
The four trial groups were comprised of thirty-two animals, eight per group:
The control group (CON)—no tannin additive in the diet. The first treatment group (TAN 1)—10 g of mixture (HT + soy protein additive) per animal added to the TMR diet (1.0 g kg−1 DM). The second treatment group (TAN 2)—15 g of HT additive per animal added to the TMR diet (1.5 g kg−1 DM).The third treatment group (TAN 3)—15 g of HT additive per animal added to the TMR diet (1.5 g kg−1 DM) with reduced quantity of concentrate in nominal value of the HT additive (Table 1).
Feed rations were prepared daily for all treatment groups. The bulls were fed their respective diets once a day (07:00 h), following a 20 d diet adaptation period. During the adaptation period, the diets were not supplemented with tannin extract. Access to feed and water was provided ad libitum. Ration components for complete feed rations, and refusal samples were collected monthly at the beginning and during fattening period, and were sent to the laboratory for chemical analyses (LKS-Landwirtschaftliche Kommunikations-, und Servicegesellschaft mbH, Germany). The mill was washed after preparation of each diet to prevent cross-contamination with tannins. The ratio was adjusted on a weekly basis. During the feeding trial, the feed rations and feed refusals were recorded on a daily basis for each treatment group. In the 7-month feeding trial, a total of 852 offered rations and 852 residual feeds were precisely measured. From the data, we calculated the dry matter intake (DMI).

2.2. Recording of Dry Matter Intake

Feed and feed refusals were collected and recorded daily for DM analysis and calculation of DMI. To calculate the monthly average DMI, the average of all daily feed and feed refusals for each pen (each group) were calculated. The results are presented as monthly average DMI per pen, as descriptive statistics.

2.3. Recording of Body Weight

Following a 20 d diet adaptation period, bulls were weighed and started the 213-day experimental period. During the experimental period, bulls were weighed at the beginning and at 30-day intervals thereafter. At the end of the experiment, the bulls were weighed 24 h before slaughter and on the day of slaughter. Body mass data were recorded using a digital walk-through scale (EC 2000 Tru-test). The average daily gain (ADG) was calculated between the monthly recordings and throughout the experiment. At each weighing, body parameters were also recorded: height at withers (measured from the highest point of the shoulder blade to the ground) and hip height (measured from the highest point of the hip bones to the ground).

2.4. Carcass Classification

At the end of the experiment, the bulls were transported by truck to a local commercial abattoir. At the end of the slaughter line, warm carcass weight (CW) was recorded, and carcass classification, i.e., evaluation of conformation and fatness, was performed by an accredited classification body using the European Union beef carcass classification system (EUROP). For the statistical analysis, scores of the conformation (E, U, R, O, and P) and fatness (1–5) scale were transformed into numerical classification units on a 15-point scale. Age at slaughter (AS) was calculated as the difference between the date of birth and the date of slaughter. The dressing percentage (DP) was calculated as the ratio of CW to its live weight at slaughter (LWS). A measuring tape was used to record the carcass length and chest depth as described by Campion, Keane, Kenny and Berry [36].

2.5. Measurements of Meat Quality Traits

A day after slaughter, samples of Longissimus dorsi (LD) were taken from the left carcass at the level of the last rib to measure meat quality traits. The muscle was cut into two 5 cm-wide large sections. One part was used for analysis of fresh meat, whereas the other was weighed, vacuum-packed, and subjected to vacuum aging for 14 days at 4 °C (matured sample). Fresh samples were used to measure pH value; color parameters (L*, a*, and b*) chemical composition by NIR; marbling; water-holding capacity (WHC); and tenderness.
The pH value was measured at the center of the LD muscles at 24 and 48 h post-mortem using an MP120 Mettler Toledo pH meter fitted with a combined glass electrode InLab427 (Mettler-Toledo, GmbH; 8603 Schwarzenbach, Switzerland). The samples were evaluated in two replicates at two different sites [37].
To evaluate meat color, a Minolta L*a*b* colorimeter was used. Analysis was performed on a freshly cut surface of LD exposed for 60 min to bloom [38]. Measurements were taken in triplicate using a Minolta Chroma Meter CR-300 (Minolta Co., Ltd., Osaka, Japan). Color stability measurements were performed 24 h after slaughter.
Determination of moisture, intramuscular fat (IMF), and protein content (chemical composition) were determined by near-infrared spectroscopy (NIR Systems 6500 Monochromator; Foss NIR System, Silver Spring, MD, USA), as described previously by Prevolnik et al. [39].
Water-holding capacity (WHC) was determined by three different methods: drip loss, cooking loss, and thawing loss. Drip loss was determined using the EZ-DripLoss method as described by Christensen [40]. Two cylindrical pieces (2.5 cm) were cut from the central area of the LD. The samples were weighed and sealed in plastic sealable cups (Sarstedt AG & Co., Nümbrecht, Deutschland meat extract collector), and weight loss was recorded after 24 and 168 h of storage [41].
Samples for determining cooking loss were first weighed and then cooked in a thermostatic water bath (ONE 7-45), until the interior of the sample reached 72 °C. After cooking, the samples were dried with paper towels and reweighed to obtain data on water loss during cooking.
To determine thawing loss, samples were weighed, vacuum packed, and frozen at −20 °C. Samples were then thawed overnight at 4 °C, gently dried with a paper towel, and reweighed [42].
After cooking, the samples were left to cool and objective determination of tenderness was performed by determining the shear force (N) with a TA Plus texture analyzer (Ametek Lloyd Instruments Ltd., Fareham, UK). The same procedure was repeated for the aged samples.
To assess marbling, cross-sections of LD were visually compared using a reference standard scale ranging from 1 (devoid of marbling) to 10 (abundantly marbled). Two operators independently evaluated each sample, and an average of the two scores was obtained [43].

2.6. Fecal Clostridia Analysis

The fecal samples were collected (using individual plastic sleeves) from each animal on the day before the start of the trial and on the day of slaughter. The first fecal samples were obtained on a scale by catching feces of individual animals into a clean plastic bucket. At the end of the fattening trial, colon fecal samples were collected from the slaughterhouse. The fecal samples were stored at 4 °C until freezing (–72 °C). Samples were then sent by express mail in controlled conditions to the laboratory for further analysis (Miprolab GmbH, Göttingen, Germany).
Two methods were applied for the analysis of Clostridia. With the “Most Probable Number” (MPN), the total number of sulfite-reducing Clostridia was determined (pathogenic and non-pathogenic species) to get an overall count of all viable Clostridia. Selective Clostridia enrichment and counting analyses allowed for the detection, identification, and semi-quantitative counting of the relevant pathogenic Clostridia species.

2.6.1. Total Number of Clostridia

The total number of viable sulfite-reducing Clostridia was determined using the MPN adhering to the principles of EN 26461-1 in a miniaturized design. Briefly, 50 g of each sample was added to 100 mL of differential reinforced Clostridial medium (DRCM, Heipha, Germany) and homogenized using two cycles of 30 s in a paddle blender (Stomacher 400, Seward, UK). From each homogenized sample, 1 mL was pipetted into 9 mL of DRCM and thoroughly mixed. Further dilutions were performed in 96-well plates with a transfer volume of 25 µL and a total volume of 250 µL per well. Each sample was tested in five replicates. The plates were covered and incubated at 37 °C for 14 days. The incubation atmosphere consisted of 85% N2, 10% CO2, and 5% H2 generated with an Anoxomat (Mart, The Netherlands). All black wells were counted as positive for the growth of sulfite-reducing Clostridia, and the total number was calculated using the MPN table taking into account the initial dilution. Clostridia counts are given as bacteria per gram of sample.

2.6.2. Selective Clostridia Enrichment and Counting Analysis

To selectively identify and count relevant pathogenic bacteria (C. perfringens and Clostridium sporogenes), samples were spread on egg yolk lactose agar (Heipha, Germany). Aliquots of the homogenized fecal samples were heated at 80 °C for 10 min to activate the spores and to reduce the interfering accompanying flora. Plates were incubated for 48 h at 37 °C in an anaerobic atmosphere as described above. The incubation time was extended to 72 h in the case of insufficient growth. Bacterial colonies were identified by colony properties, including lipase and lecithinase activity. Colonies of the same type, appearance, and macromorphology were randomly selected for confirmation by Remel RapID ANA (Thermo Fisher Scientific, Lenexa, KS, USA) and Gram strain. C. perfringens was additionally tested by PCR. Colonies of the various species were counted semi-quantitatively on the plates, and the results were grouped into four classes (Number 0 = no growth; Number 1 = 1–10 colonies; number 2 = 11–50 colonies; number 3 = >50 colonies) between treatments. A quantitative counting of the colonies was not performed, because plate cultures were obtained from pre-enriched cultures and were only able to provide a semi-quantitative assessment of the distribution of the individual bacterial species. However, the pre-enrichment process still reflected the initial concentration ranges. The range for the semi-quantitative data was calculated as follows: 0, no growth; range 1, 1–10 colonies; range 2, 11–50 colonies; range 3, >50 colonies. All four ranges reflect the initial concentrations in the samples.

2.7. Statistical Analysis

Statistical analyses were performed using IBM SPSS Statistics 25. Means and standard errors of the means were computed for all parameters separately for each treatment. To determine the differences in growth performance, carcass, and meat quality parameters for all treatments, we applied one-way analysis of variance (ANOVA). The statistical model used was as follows:
Y i j k = μ + T i j + e i j k
where Yijk is k- investigated the characteristics of j- bull within i-treatment, μ is total mean, Tij is the j-bull of i-treatment (CON, TAN 1, TAN 2, TAN 3), and eijk is error component.
The assumptions of normality and homoscedasticity were verified using Shapiro–Wilk’s and Levene’s tests. In case of finding significant results in an ANOVA, post hoc analysis using the Duncan method was performed.
One-way ANOVA was applied to examine the differences in the total number of Clostridia (MPN) at the beginning and the end of the feeding trial. In the case of selected Clostridium, the non-parametric Kruskal–Wallis test was used and pairwise comparisons were performed using the Dunn–Bonferroni post hoc test. If the p-value was lower than 0.05, the results were considered significant.

3. Results

3.1. Growth Performance and Carcass Characteristics

The monthly average dry matter intake (DMI) data are presented in Table 2. In the CON group, we detected the smallest DMI in almost all months (with an exception between 4–5 months) of the feeding trial.
The growth performance results are listed in Table 3. The final BW was not affected (p = 0.273) by treatment, and there were no statistical differences between the groups, nevertheless, we found a 10–40 kg difference. Significant differences in average daily gain (ADG) (measured monthly) were observed in the last months of the trial in ADG 4–5 (p = 0.012), ADG 5–6 (p = 0.049), and ADG 6–7 (p = 0.041), with the lowest growth rate noted in the control group. However, the ADG calculated for the entire experimental period was not significantly different between the treatment groups, indicating no effect of dietary tannins (p = 0.142).
There were no significant differences in carcass weight (p = 0.289) (Table 4), conformation score (p = 0.086), fatness score (p = 0.130), dressing percentage (p = 0.090), and additional body measurements (depth of chest and length of carcass).

3.2. Meat Quality

A statistically significant difference was obtained for drip loss measured after 48 h of storage (p = 0.000) (Table 5), which was higher in the CON group than in the tannin-supplemented group. In the two-week old samples, all tannin-supplemented groups showed significantly higher thawing loss than the CON group (p = 0.008). Additionally, the lowest cooking loss of aged meat was observed in the CON group.

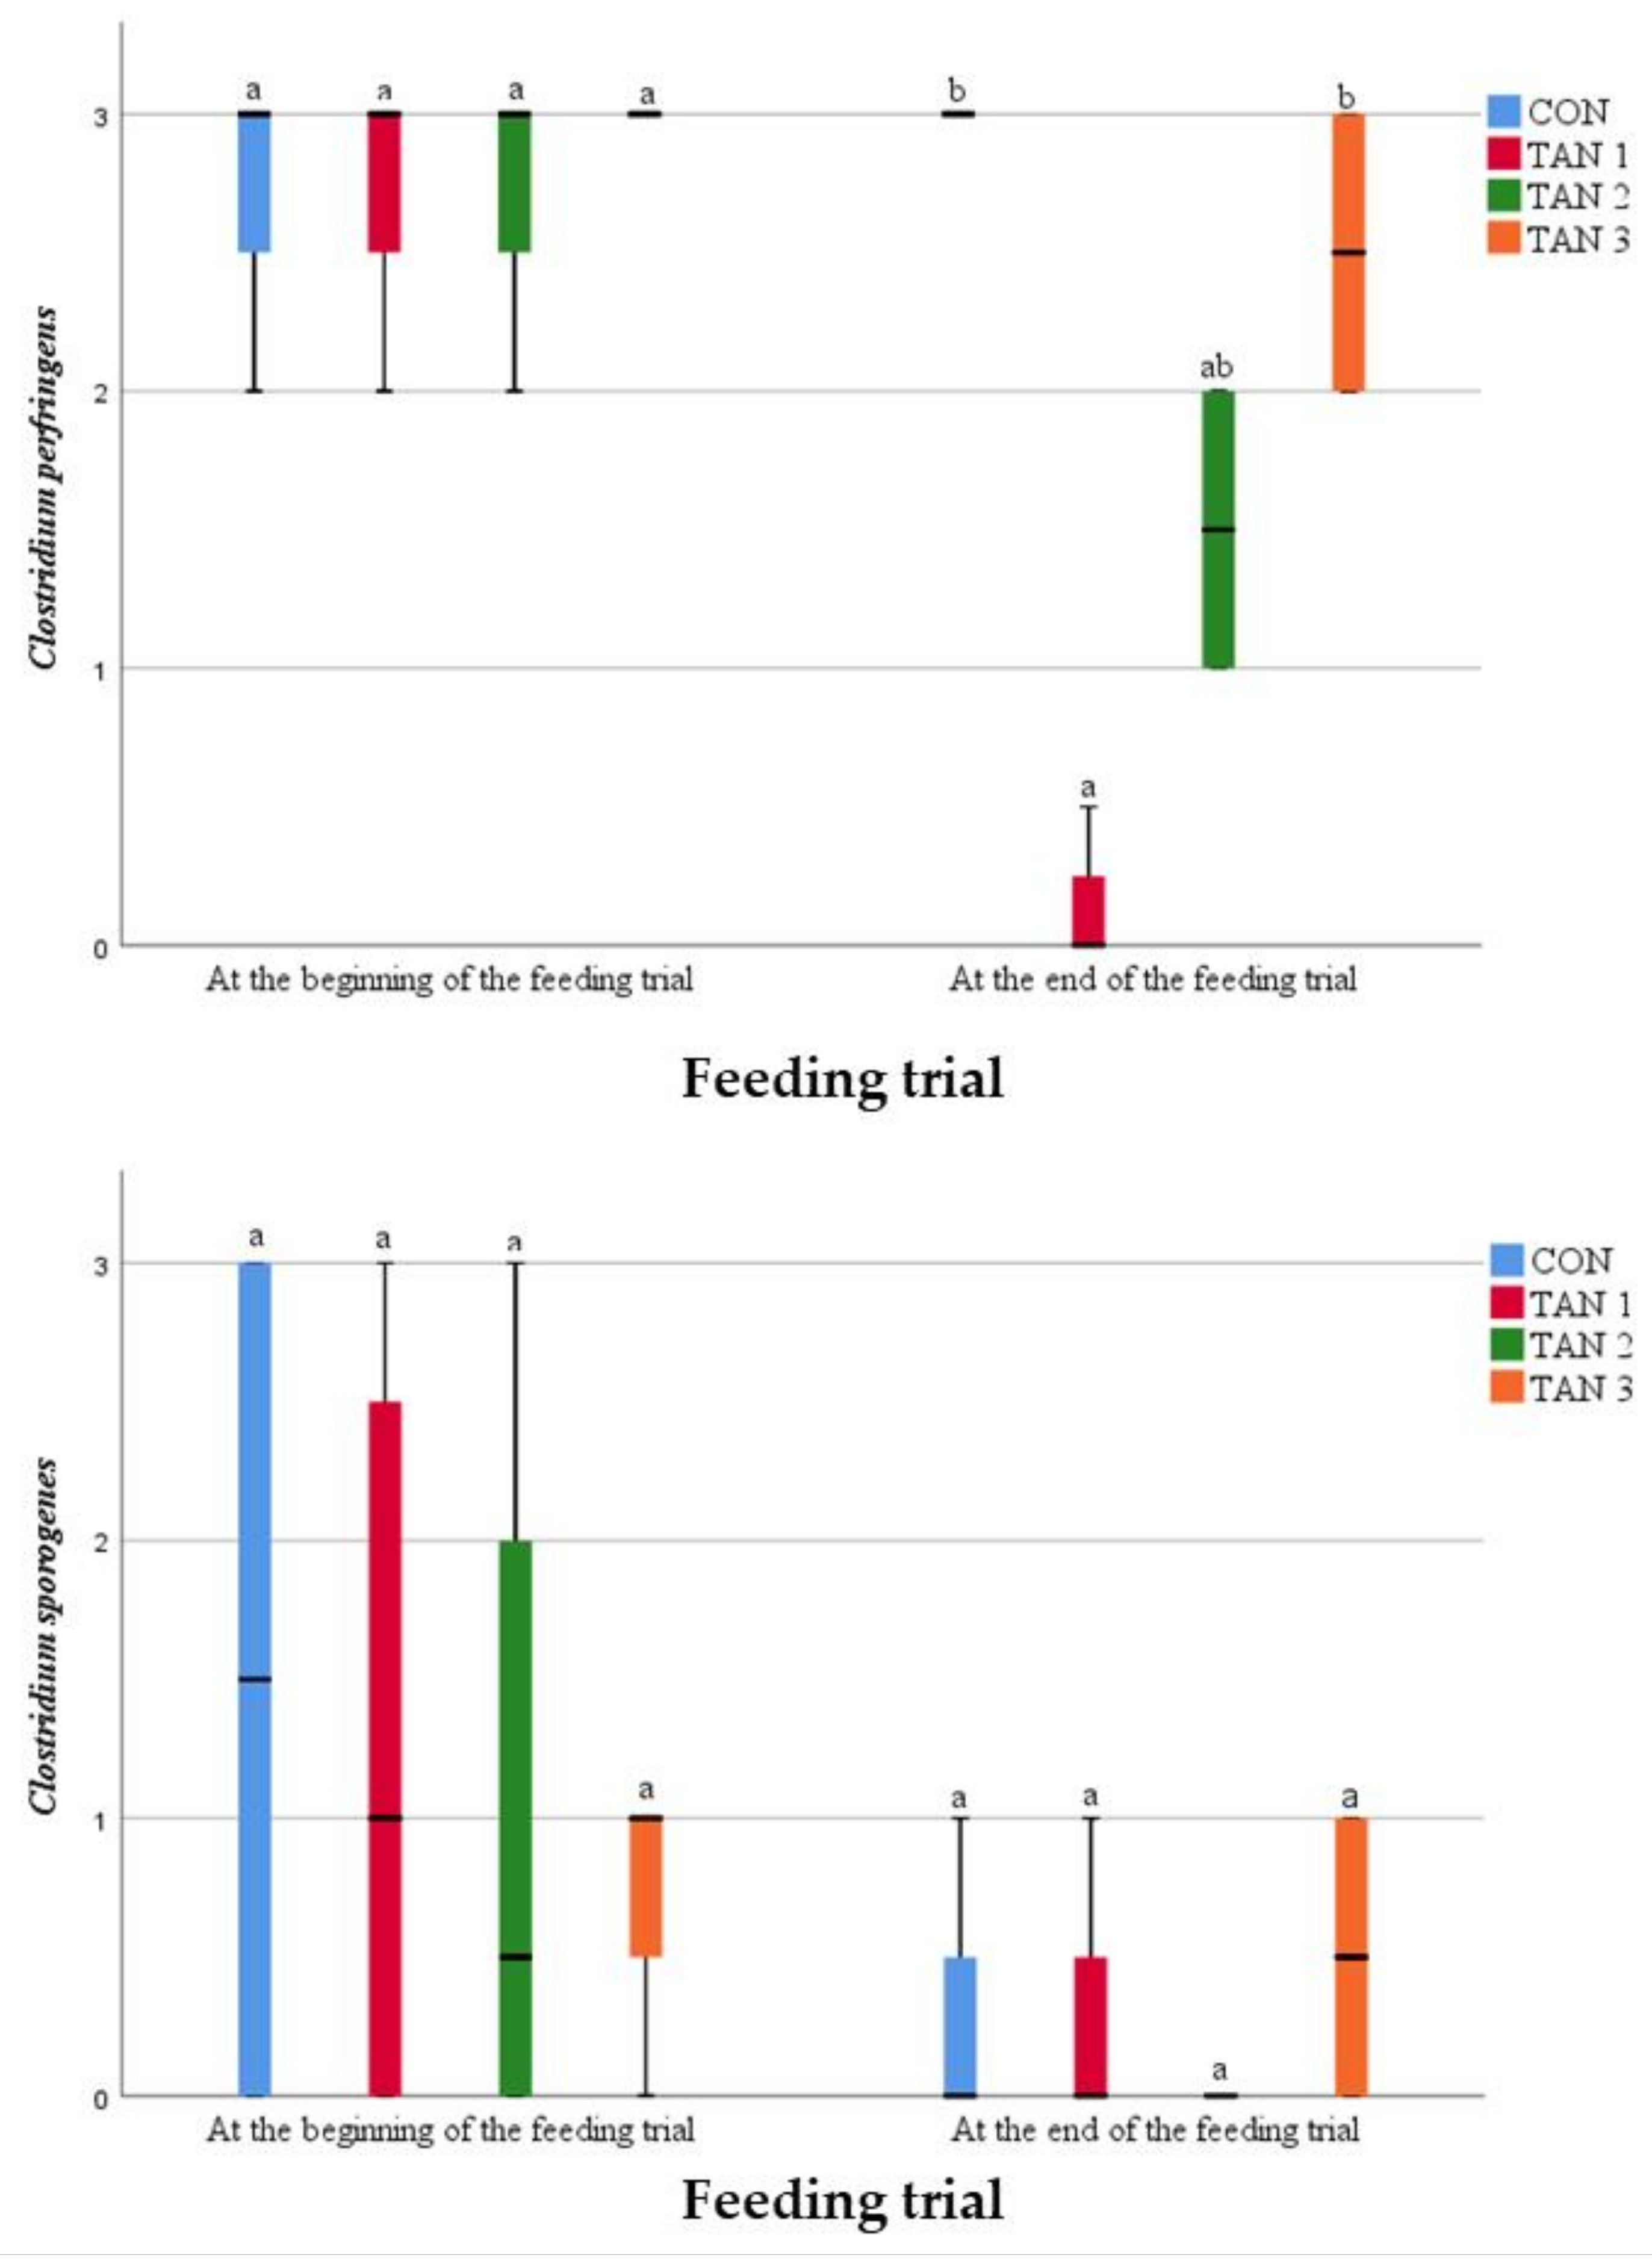
3.3. Clostridia Counts

The total number of Clostridia was determined by the MPN method. No significant difference was found among groups in the total number of Clostridia before (p = 0.173) and after (p = 0.582) the feeding trial (Figure 1).
The concentrations of individual Clostridium species (C. perfringens and C. sporogenes) were analyzed with selective Clostridia enrichment and counting analysis. The results were counted and ranged within four concentration classes (Figure 2). All four ranges reflect the initial concentrations in the samples.
No significant differences between the treatments were observed at the beginning of the feeding trial for C. perfringens (p = 0.764) and C. sporogenes (p = 0.979). At the end of the feeding trial, there were no differences in the C. sporogenes concentrations between the groups. Differences in concentrations of C. perfringens were detected (p = 0.004) between treatments. The lowest concentration was determined for the TAN 1 group.

4. Discussion

When discussing tannins, it must be noted that there are many published studies with different, even contradictory results, which report positive, negative or no effect of tannin supplementation on the growth performance of bulls. In this context, Patra and Saxena [10] reported that the growth performance was associated with various responses to tannin supplementation using different chemical structures and concentrations of tannins used in studies, different animals, and basal diet used in feeding trials. Different effects are often attributed to condensed tannins, compared with hydrolyzable tannins. Although research on these two types of tannins is important, and previous studies have reported similar effects [44,45,46], generalizations should be carefully considered [47]. In the present study, we focused on hydrolyzable tannins and their effect on ruminants. However, some comparisons are discussed, as many more studies associated with the effects of tannins are conducted with condensed tannins [9].

4.1. Effects of Tannins on Growth Performance of Bulls

As previously mentioned, tannins can improve the ratio of bypass proteins, which can lead to improved intestinal absorption of amino acids and thus have a positive effect on daily gain. Our results show that supplementation of the diet with HT affected the growth of bulls, and significant differences were detected in the last three months of our trial when the bulls reached 538 ± 20.3 kg BW until the slaughter maturity (677 ± 19.2 kg). In the present study, there were no differences in final ADG and BW between the groups. Furthermore, no reduction in the daily DMI was detected. This is in agreement with the feeding study of Aboagye et al. [48]. They studied the effects of feeding chestnut (HT) extract and a combination (50:50) of HT and quebracho (CT) extracts in a powdered form at different concentrations of dietary DM for three months on steers. There were no effects of treatment on DMI, BW, ADG in both HT groups, or a combination of both tannins and both concentrations. In the current study, total ADG and BW were not affected, although we observed a higher ADG at the end of the trial. Tabke et al. [49] supplemented tannic acid (HT) into steam-flaked corn-based finishing diets of steers. Overall, no effects were observed for ADG, carcass characteristics, hot carcass weight, longissimus muscle area, fat thickness, and yield grade during the study in any treatment. The study by Krueger et al. [44] used commercially available mimosa (CT) and chestnut (HT) extracts and added them to a high-grain diet to fatten crossbred steers. Including tannins in the diet resulted in similar DMI for steers in the control and both tannin-treatment groups. Tannin supplementation had no effect on animal performance or carcass, except for HCW. We conclude that the absence of an effect of tannins on animal performance observed in this study could be due to the conservative dose of tannins.
We recorded differences in ADG during the last three months of the feeding trial. The positive impacts of tannin supplementation during the last feeding period were also observed by Brus et al. [50]. Commercial HT additives in powder form were used in the diet of Simmental bulls. After month 8 of the study, ADG was significantly higher in the group with tannin wood extract and lower in the control group. The higher measured ADG in the last period of the feeding trial is in agreement with our findings. Tannin supplementation in the finishing feeding phase of Holstein steers was studied by Rivera-Mendez et al. [46]. Supplementation with tannins increased average daily gain (ADG, 6.8%) and dry matter intake (DMI, 4.0%) in the finishing feeding phase. The authors concluded that the mechanism responsible for the higher ADG has not been fully understood and explained.
A possible explanation for the achievement of significantly higher ADGs in the final phase of bull fattening in the present study is the nature of nutrient metabolism of ruminants and the specific effect of hydrolyzable tannins. The extent and composition of daily gain in the final phase of fattening depends on the available energy and proteins in the animal’s diet, which is above the maintenance requirement [51]. In this context, ruminants can take advantage of the symbiotic effect of digestion with microorganisms in the rumen, which decompose the nutrients by using their own digestive enzymes. Microbes can form ideal nutrients for ruminants from the decomposition products. Ruminants meet their metabolic protein needs from two sources: true microbial proteins from microbial synthesis and proteins from feed (bypass proteins) [52]. The addition of HT influenced the microbial metabolic process of nutrient synthesis in the rumen, which may lead to better feed efficiency and a higher growth rate of fattening bulls. The chemical composition of the tested feed mixtures is the same in terms of energy content, thus, differences in ADG size are not due to energy alone, as the authors claim [53]. The possible explanation for the differences in ADG can be attributed to the different amounts of crude protein in the TMR. In the present study, all groups with HT had significantly higher ADG than the control group. Therefore, we hypothesized that HT influenced the ruminal digestion of rumen degradable and undegradable dietary proteins. Consequently, increased protein production in the rumen from both sources resulted in greater availability of enzymatically degradable proteins in the small intestine. It can be assume that the addition of HT increased the availability of amino acid absorption, which could pass into the amino acid pool.

4.2. Effect of Tannin Supplement on Meat Quality

In this study, meat quality traits such as meat color, IMF, protein content, marbling, and tenderness were not affected by HT plant extract. Similar results regarding meat quality traits were observed in a study by Joo et al. [54]. The objective of this study was to examine the effects of dietary fermented chestnuts on growth performance, carcass, and meat quality parameters (cold carcass weight, back fat thickness, longissimus muscle area, marbling score, and fat color) in the late fattening period of Hanwoo steers. No effects on growth performance or carcass traits were observed. Moreover, differences were observed in physicochemical characteristics (cooking loss, water-holding, shear force), except meat pH. Beef meat quality in relation to added tannins was also studied by Larraín et al. [55]. They observed an effect on meat color and lipid oxidation in beef longissimus lumborum (LL) and gluteus medius (GM) muscles. They found that supplementation with a diet of high-tannin sorghum increased the rate of color change during aerobic oxygenation and modulated lipid oxidation in two ways: it reduced oxidation before aerobic storage and accelerated oxidation during aerobic display of the tissue.
In other species, supplementation with tannins or feeding tannin-rich feeds had little or no effect on meat quality, as seen when supplementing a natural extract of chestnut wood to rabbits [56] or pigs [57]. Similarly, de Jesús et al. [58], who studied the effect of feeding dried chestnuts (15% and 25% of the formulation), found no effect on the physiochemical properties (color parameters, water holding capacity, and shear force) of Longissimus dorsi muscle.
Our research has shown that adding tannins to a bull’s diet significantly reduces drip loss in fresh meat. However, after two weeks, meat from bulls that received tannin supplementation exhibited significantly higher meat thaw loss. Similar conclusions were also reported by Joo et al. [59]. They reported that adding chestnut meal at 30 g kg−1 resulted in lower drip loss in pigs. Drip loss is a method of evaluating water holding capacity, which is an essential quality parameter for both the industry and the consumer and is related to the status of proteins that bind the water that is mainly affected by post-mortem conversion of muscle to meat (pH decline) and the rate of carcass refrigeration (especially deep muscles) [60].

4.3. Effect of Supplement on Fecal Clostridia Concentration

In the present study a notable reduction was observed when the concentration of individual Clostridium species was compared. Differences in the concentration of C. perfringens (p = 0.004) were observed between groups at the end of the feeding trial. The results of our study are in good agreement with previous studies. Redondo et al. 2015 [61] found that C. perfringens isolated from bovine feces had difficulty forming resistance to hydrolyzable tannins. The study of Elizondo et al. [62] confirmed bacteriostatic and bactericidal activities in vitro experiments with C. perfringens. The bacteriostatic activity of quebracho and chestnut tannins was tested on selected C. perfringens strains of toxin types A, C, D, and E. The concentrations of quebracho required to inhibit the growth of C. perfringens were 7–85 times higher than those of chestnut tannin (0.6–1.2 mg/mL vs. 0.003–0.15 mg/mL). The bactericidal effect of quebracho occurs within 5 h of administration and, in the case of chestnut tannin, virtually immediately in 5 min. Our results are in agreement with the previous study on steers, in which an antimicrobial effect of hydrolyzable tannins on E. coli and coliform bacteria was observed [63]. The effect was limited to the rumen, whereas in present study to the entire digestive tract.

5. Conclusions

This study provides new information about the effect of HT supplements in the diet of bulls on growth pattern, carcass and meat quality, and reduction of pathogenic strains of Clostridia in feces. It demonstrated that tannins had a significant effect on increasing growth rate when bulls averaged 538 kg BW to slaughter maturity. In addition, tannin supplementation decreased meat drip losses and was very effective in reducing C. perfringens in the selective test. Therefore, given the same energy content in the diet of fattening bulls, the addition of HT can affect protein synthesis in the rumen, thereby increasing the availability of amino acids in the amino acid pool for body protein synthesis and consequently ADG. Our research on large ruminants under practical breeding conditions allowed us to approach a statistically balanced experiment. In practice, a cheaper meal with a lower protein content together with the addition of hydrolyzable tannins can increase nutrient utilization efficiency, improve growth intensity, and effectively reduce Clostridial pathogens in bulls without adverse effects on carcass and meat quality. Our results suggest that the addition of hydrolyzable tannins is justified in practice because their activity is effective against pathogenic bacteria and could be very promising in controlling ruminant diseases, reducing antibiotic use, and improving overall welfare of domestic animals. Further research should elucidate the response of the microbiome and the methane reduction potential in bull fattening.

Author Contributions

Conceptualization, M.J., M.B. and A.M.; methodology, M.B., M.J., T.K.Š., D.Š. and A.M.; data curation, M.B., T.K.Š. and A.M.; funding acquisition M.J. and M.B.; investigation, A.M., M.J. and M.B.; project administration, M.J. and M.B.; supervision, M.J. and M.B.; writing—original draft A.M., writing—review and ending D.Š., M.B. and M.J. All authors have read and agreed to the published version of the manuscript.

Funding

This work was funded by Tanin Sevnica d.d. The authors also would like to thank the SLOVENIAN RESEARCH AGENCY for financial support through research grants from the Research Group for Food Safety and Health Assurance, grant number: P1-0164.

Institutional Review Board Statement

Feed additives were used in this study (European Union Register of Feed Additives, 2013). No animal procedures were performed, which would require ethics approval according to Directive 2010/63/EU of the European Parliament and of the Council on the protection of animals used for scientific purposes.

Informed Consent Statement

Not applicable.

Data Availability Statement

The data presented in this study are available within the article.

Acknowledgments

The authors are grateful for the technical support at the farm level. The authors gratefully acknowledge the full support. Meta Čandek-Potokar and Andreja Žabjek for their practical and professional research assistance.

Conflicts of Interest

The authors declare no conflict of interest. The funders had no role in the study design; in the collection, analyses, or interpretation of data; in the writing of the manuscript; or in the decision to publish the results.

References

  1. Hooge, D.M.; Mathis, G.F.; Lumpkins, B.; Ponebšek, J.; Moran, D. Dose-responses of broiler chicks, given live coccidia vaccine on day of hatch, to diets supplemented with various levels of Farmatan® (sweet chestnut wood tannins) or BMD®/Stafac® in a 42-day pen trial on built-up litter. Int. J. Poult. Sci. 2012, 11, 474–481. [Google Scholar] [CrossRef] [Green Version]
  2. Cheeke, P.R.; Dierenfeld, E.S. Comparative Animal Nutrition and Metabolism; CABI: Wallingford, UK, 2010. [Google Scholar]
  3. Sugiharto, S. Role of nutraceuticals in gut health and growth performance of poultry. J. Saudi Soc. Agric. Sci. 2016, 15, 99–111. [Google Scholar] [CrossRef] [Green Version]
  4. Paraskeuas, V.; Fegeros, K.; Palamidi, I.; Hunger, C.; Mountzouris, K.C. Growth performance, nutrient digestibility, antioxidant capacity, blood biochemical biomarkers and cytokines expression in broiler chickens fed different phytogenic levels. Anim. Nutr. 2017, 3, 114–120. [Google Scholar] [CrossRef] [PubMed]
  5. Valenzuela-Grijalva, N.V.; Pinelli-Saavedra, A.; Muhlia-Almazan, A.; Domínguez-Díaz, D.; González-Ríos, H. Dietary inclusion effects of phytochemicals as growth promoters in animal production. J. Anim. Sci. Technol. 2017, 59, 1–17. [Google Scholar] [CrossRef] [PubMed] [Green Version]
  6. Suresh, G.; Das, R.K.; Kaur Brar, S.; Rouissi, T.; Avalos Ramirez, A.; Chorfi, Y.; Godbout, S. Alternatives to antibiotics in poultry feed: Molecular perspectives. Crit. Rev. Microbiol. 2018, 44, 318–335. [Google Scholar] [CrossRef] [PubMed]
  7. Brus, M.; Gradišnik, L.; Trapečar, M.; Škorjanc, D.; Frangež, R. Beneficial effects of water-soluble chestnut (Castanea sativa Mill.) tannin extract on chicken small intestinal epithelial cell culture. Poult. Sci. 2018, 97, 1271–1282. [Google Scholar] [CrossRef]
  8. Mueller-Harvey, I. Unravelling the conundrum of tannins in animal nutrition and health. J. Sci. Food Agric. 2006, 86, 2010–2037. [Google Scholar] [CrossRef]
  9. Naumann, H.D.; Tedeschi, L.O.; Zeller, W.E.; Huntley, N.F. The role of condensed tannins in ruminant animal production: Advances, limitations and future directions. Rev. Bras. Zootec. 2017, 46, 929–949. [Google Scholar] [CrossRef] [Green Version]
  10. Patra, A.K.; Saxena, J. Exploitation of dietary tannins to improve rumen metabolism and ruminant nutrition. J. Sci. Food Agric. 2011, 91, 24–37. [Google Scholar] [CrossRef] [PubMed]
  11. Bunglavan, S.J.; Dutta, N. Use of tannins as organic protectants of proteins in digestion of ruminants. Livest. Sci. 2013, 4, 67–77. [Google Scholar]
  12. War, A.R.; Paulraj, M.G.; Ahmad, T.; Buhroo, A.A.; Hussain, B.; Ignacimuthu, S.; Sharma, H.C. Mechanisms of plant defense against insect herbivores. Plant Signal. Behav. 2012, 7, 1306–1320. [Google Scholar] [CrossRef] [PubMed] [Green Version]
  13. Khanbabaee, K.; Van Ree, T. Tannins: Classification and definition. Nat. Prod. Rep. 2001, 18, 641–649. [Google Scholar]
  14. Mangan, J.L. Nutritional effects of tannins in animal feeds. Nutr. Res. Rev. 1988, 1, 209–231. [Google Scholar] [CrossRef] [PubMed]
  15. Kristl, J.; Urbanek Krajnc, A.; Brus, M.; Skorjanc, D. The content of tannins in feed components and in feeds for growing pigs. In Proceedings of the 21th International Scientific Symposium on Nutrition of Farm Animals ‘Zadravec-Erjavec Days’, Murska Sobota, Slovenia, 8–9 November 2012. [Google Scholar]
  16. Smeriglio, A.; Barreca, D.; Bellocco, E.; Trombetta, D. Proanthocyanidins and hydrolysable tannins: Occurrence, dietary intake and pharmacological effects. Br. J. Pharmacol. 2017, 174, 1244–1262. [Google Scholar] [CrossRef] [PubMed] [Green Version]
  17. Cipriano-Salazar, M.; Rojas-Hernández, S.; Olivares-Pérez, J.; Jiménez-Guillén, R.; Cruz-Lagunas, B.; Camacho-Díaz, L.M.; Ugbogu, A.E. Antibacterial activities of tannic acid against isolated ruminal bacteria from sheep. Microb. Pathog. 2018, 117, 255–258. [Google Scholar] [CrossRef] [PubMed]
  18. Yang, B.; Liu, P. Composition and biological activities of hydrolyzable tannins of fruits of Phyllanthus emblica. J. Agric. Food Chem. 2014, 62, 529–541. [Google Scholar] [CrossRef] [PubMed]
  19. Regulation (EC) No 1831/2003 of the European Parliament and of the Council of 22 September 2003. Available online: https://eur-lex.europa.eu/legal-content/EN/TXT/?uri=CELEX%3A32003R1831 (accessed on 10 April 2022).
  20. European Union Register of Feed Additives Pursuant to Regulation (EC) No 1831/2003_Released date 21.09.2021. Available online: https://ec.europa.eu/food/safety/animalfeed/feed-additives/eu-register_en (accessed on 10 April 2022).
  21. Doce, R.R.; Hervas, G.; Belenguer, A.; Toral, P.G.; Giraldez, F.J.; Frutos, P. Effect of the administration of young oak (Quercus pyrenaica) leaves to cattle on ruminal fermentation. Anim. Feed. Sci. Technol. 2009, 150, 75–85. [Google Scholar] [CrossRef] [Green Version]
  22. Frutos, P.; Raso, M.; Hervas, G.; Mantecon, A.R.; Perez, V.; Giraldez, F.J. Is there any detrimental effect when a chestnut hydrolysable tannin extract is included in the diet of finishing lambs? Anim. Res. 2004, 53, 127–136. [Google Scholar] [CrossRef] [Green Version]
  23. Waghorn, G.C.; Shelton, I.D.; McNabb, W.C.; McCutcheon, S.N. Effects of condensed tannins in Lotus pedunculatus on its nutritive value for sheep. 2. Nitrogenous aspects. J. Agric. Sci. 1994, 123, 109–119. [Google Scholar] [CrossRef]
  24. Menci, R.; Coppa, M.; Torrent, A.; Natalello, A.; Valenti, B.; Luciano, G.; Priolo, A.; Niderkorn, V. Effects of two tannin extracts at different doses in interaction with a green or dry forage substrate on rumen fermentation and biohydrogenation—An in vitro study. Anim. Feed. Sci. Technol. 2021, 278, 114977. [Google Scholar] [CrossRef]
  25. Waghorn, G.C.; Shelton, I.D. Effect of condensed tannins in Lotus corniculatus on the nutritive value of pasture for sheep. J. Agric. Sci. 1997, 128, 365–372. [Google Scholar] [CrossRef]
  26. Makkar, H.P.; Siddhuraju, P.; Becker, K. Tannins. In Plant Secondary Metabolites; Humana Press: Totowa, NJ, USA, 2007; pp. 67–81. [Google Scholar]
  27. Echegaray, N.; Gómez, B.; Barba, F.J.; Franco, D.; Estévez, M.; Carballo, J.; Lorenzo, J.M. Chestnuts and by-products as source of natural antioxidants in meat and meat products: A review. Trends. Food Sci. Technol. 2018, 82, 110–121. [Google Scholar] [CrossRef]
  28. Velasco, V.; Williams, P. Improving meat quality through natural antioxidants. Chil. J. Agric. Res. 2011, 71, 313. [Google Scholar] [CrossRef] [Green Version]
  29. Huang, Q.; Liu, X.; Zhao, G.; Hu, T.; Wang, Y. Potential and challenges of tannins as an alternative to in-feed antibiotics for farm animal production. Anim. Nutr. 2018, 4, 137–150. [Google Scholar] [CrossRef] [PubMed]
  30. Mailoa, M.N.; Mahendradatta, M.; Laga, A.; Djide, N. Antimicrobial activities of tannins extract from guava leaves (Psidium Guajava L.) on pathogens microbial. Int. J. Sci. Technol. Res. 2014, 3, 236–241. [Google Scholar]
  31. Sotohy, S.A.; Sayed, A.N.; Ahmed, M.M. Effect of tannin-rich plant (Acacia nilotica) on some nutritional and bacteriological parameters in goats. DTW. Dtsch Tierarztl Wochenschr. 1997, 104, 432–435. [Google Scholar]
  32. Theodoridou, K.; Aufrère, J.; Andueza, D.; Pourrat, J.; Le Morvan, A.; Stringano, E.; Baumont, R. Effects of condensed tannins in fresh sainfoin (Onobrychis viciifolia) on in vivo and in situ digestion in sheep. Anim. Feed Sci. Technol. 2010, 160, 23–38. [Google Scholar] [CrossRef]
  33. McSweeney, C.S.; Kennedy, P.M.; John, A. Effect of ingestion of hydrolysable tannins in Terminalia oblongata on digestion in sheep fed Stylosanthes hamata. Aust. J. Agri. Res. 1988, 39, 235–244. [Google Scholar] [CrossRef]
  34. European Union Register of Feed Additives. Available online: http://ec.europa.eu/food/safety/animal-feed/feed-additives/eu-register_en (accessed on 8 October 2016).
  35. LfL Grub (Bavarian State Research Center for Agriculture). Gruber Tabelle zur Fütterung in der Rindermast, Fresser Bullen Mastfärsen Mastkühe Ochsen [Gruber Feed Value Tables Feeding in Beef Fattening, Bulls, Heifers, Fattening Cows and Oxen], 39th ed; Bayerische Landesanstalt für Landwirtschaft: Freising Weihenstephan, Germany, 2016. [Google Scholar]
  36. Campion, B.; Keane, M.G.; Kenny, D.A.; Berry, D.P. Evaluation of estimated genetic merit for carcass weight in beef cattle: Live weights, feed intake, body measurements, skeletal and muscular scores, and carcass characteristics. Livest. Sci. 2009, 126, 87–99. [Google Scholar] [CrossRef]
  37. Prevolnik Povše, M.; Čandek-Potokar, M.; Gispert, M.; Lebret, B. pH value and water-holding capacity. In A Handbook of Reference Methods for Meat Quality Assessment; Cost Action FA1102: Brussels, Belgium, 2015; pp. 22–32. [Google Scholar]
  38. Škrlep, M.; Čandek-Potokar, M.; Segula, B.; Žabjek, A.; Horvat, A.; Batorek, N.; Prevolnik, M.; Repič, M.; Janžekovic, M. Merjenje Lastnosti Kakovosti Mesa Pri Govedu; Kmetijski Inštitut Slovenije: Slovenije, Slovenia, 2013; p. 20. [Google Scholar]
  39. Prevolnik, M.; Čandek-Potokar, M.; Škorjanc, D.; Velikonja-Bolta, S.; Škrlep, M.; Znidarsic, T.; Babnik, D. Predicting intramuscular fat content in pork and beef by near infrared spectroscopy. J. Near Infrared Spectrosc. 2005, 13, 77–85. [Google Scholar] [CrossRef]
  40. Christensen, L.B. Drip loss sampling in porcine m. longissimus dorsi. Meat Sci. 2003, 63, 469–477. [Google Scholar] [CrossRef]
  41. Prevolnik, M.; Čandek-Potokar, M.; Škorjanc, D. Predicting pork water-holding capacity with NIR spectroscopy in relation to different reference methods. J. Food Eng. 2010, 98, 347–352. [Google Scholar] [CrossRef]
  42. Tomažin, U.; Batorek-Lukač, N.; Škrlep, M.; Prevolnik-Povše, M.; Čandek-Potokar, M. Meat and fat quality of Krško polje pigs reared in conventional and organic production systems. Animal 2019, 13, 1103–1110. [Google Scholar] [CrossRef] [PubMed]
  43. Silva, S.R.; Teixeira, A.; Font-i-Furnols, M. Intramuscular fat and marbling. In A Handbook of Reference Methods for Meat Quality Assessment; European Cooperation in Science and Technology (COST): Brussels, Belgium, 2015; pp. 12–21. [Google Scholar]
  44. Krueger, W.K.; Gutierrez-Bañuelos, H.; Carstens, G.E.; Min, B.R.; Pinchak, W.E.; Gomez, R.R.; Anderson, R.C.; Krueer, N.A.; Forbes, T.D.A. Effects of dietary tannin source on performance, feed efficiency, ruminal fermentation, and carcass and non-carcass traits in steers fed a high-grain diet. Anim. Feed. Sci. Technol. 2010, 159, 1–9. [Google Scholar] [CrossRef]
  45. Min, B.R.; Hernandez, K.; Pinchak, W.E.; Anderson, R.C.; Miller, J.E.; Valencia, E. Effects of plant tannin extracts supplementation on animal performance and gastrointestinal parasites infestation in steers grazing winter wheat. Open J. Anim. Sci. 2015, 5, 343. [Google Scholar] [CrossRef] [Green Version]
  46. Rivera-Mendez, C.R.; Plascencia, A.; Torrentera, N.; Zinn, R.A. Influence of tannins supplementation on growth performance, dietary net energy and carcass characteristics of yearling steers fed finishing diet containing dried distillers grains with solubles. J. Anim. Sci. 2016, 86, 108–111. [Google Scholar]
  47. Mueller-Harvey, I.; Bee, G.; Dohme-Meier, F.; Hoste, H.; Karonen, M.; Kölliker, R.; Waghorn, G. Benefits of condensed tannins in forages fed to ruminants: Importance of structure, concentration and diet. Crop Sci. 2019, 59, 1–25. [Google Scholar] [CrossRef] [Green Version]
  48. Aboagye, I.A.; Oba, M.; Castillo, A.R.; Koenig, K.M.; Iwaasa, A.D.; Beauchemin, K.A. Effects of hydrolyzable tannin with or without condensed tannin on methane emissions, nitrogen use, and performance of beef cattle fed a high-forage diet. J. Anim. Sci. 2018, 96, 5276–5286. [Google Scholar] [CrossRef]
  49. Tabke, M.C.; Sarturi, J.O.; Galyean, M.L.; Trojan, S.J.; Brooks, J.C.; Johnson, B.J.; Baggerman, J.; Thompson, A.J. Effects of tannic acid on growth performance, carcass characteristics, digestibility, nitrogen volatilization, and meat lipid oxidation of steers fed steam-flaked corn–based finishing diets. J. Anim. Sci. 2017, 95, 5124–5136. [Google Scholar] [CrossRef] [Green Version]
  50. Brus, M.; Mergeduš, A.; Prevolnik Povše, M.; Janzekovič, M. Better Tolerance against Dietary Mycotoxins in Fattening Bulls when Supplemented with Farmatan-D. Agric. Conspec. Sci. 2017, 82, 303–306. [Google Scholar]
  51. Lotfi, R. A commentary on methodological aspects of hydrolysable tannins metabolism in ruminant: A perspective view. Lett. Appl. Microbiol. 2020, 71, 466–478. [Google Scholar] [CrossRef] [PubMed]
  52. Hynd, P. Animal Nutrition: From Theory to Practice; Csiro Publishing: Clayton South, Australia, 2019; pp. 93–94. [Google Scholar]
  53. Cole, N.A.; Defoor, P.J.; Galyean, M.L.; Duff, G.C.; Gleghorn, J.F. Effects of phase-feeding of crude protein on performance, carcass characteristics, serum urea nitrogen concentrations, and manure nitrogen of finishing beef steers. J. Anim. Sci. 2006, 84, 3421–3432. [Google Scholar] [CrossRef] [Green Version]
  54. Joo, Y.H.; Kim, D.H.; Lee, H.J.; Choi, I.H.; Lee, H.S.; Paradhipta, D.H.V.; Kim, S.C. Assessing the effect of fermented chestnuts on growth performance, carcass traits, and meat quality in hanwoo steers during the late fattening period. Adv. Anim. Vet. Sci. 2019, 7, 770–775. [Google Scholar] [CrossRef]
  55. Larraín, R.E.; Schaefer, D.M.; Richards, M.P.; Reed, J.D. Finishing steers with diets based on corn, high-tannin sorghum or a mix of both: Color and lipid oxidation in beef. Meat Sci. 2008, 79, 656–665. [Google Scholar] [CrossRef] [PubMed]
  56. Liu, H.W.; Gai, F.; Gasco, L.; Brugiapaglia, A.; Lussiana, C.; Guo, K.J.; Zoccarato, I. Effects of chestnut tannins on carcass characteristics, meat quality, lipid oxidation and fatty acid composition of rabbits. Meat Sci. 2009, 83, 678–683. [Google Scholar] [CrossRef] [PubMed]
  57. Prevolnik, M.; Škrlep, M.; Brus, M.; Pugliese, C.; Čandek-Potokar, M.; Škorjanc, D. Supplementing pig diet with 0.2% sweet chestnut (Castanea sativa Mill.) wood extract had no effect on growth, carcass or meat quality. Acta Agric. Slov. 2012, 3, 83–88. [Google Scholar]
  58. de Jesus, C.; Domínguez, R.; Cantalapiedra, J.; Iglesias, A.; Lorenzo, J.M. Effect of chestnuts level in the formulation of the commercial feed on carcass characteristics and meat quality of Celta pig breed. Span. J. Agric. Res. 2016, 14, 7. [Google Scholar] [CrossRef] [Green Version]
  59. Joo, Y.H.; Choi, I.H.; Kim, D.H.; Lee, H.J.; Amanullah, S.M.; Yang, H.S.; Kim, S.C. Effects of chestnut (Castanea sativa) meal supplementation on growth performance, carcass characteristics, and meat quality of pigs. Rev. Bras. Zootec. 2018, 47. [Google Scholar] [CrossRef] [Green Version]
  60. Barbera, S. WHC trend, an up-to-date method to measure water holding capacity in meat. Meat Sci. 2019, 152, 134–140. [Google Scholar] [CrossRef]
  61. Redondo, L.M.; Dominguez, J.E.; Rabinovitz, B.C.; Redondo, E.A.; Fernández Miyakawa, M.E. Hydrolyzable and condensed tannins resistance in Clostridium perfringens. Anaerobe 2015, 34, 139–145. [Google Scholar] [CrossRef]
  62. Elizondo, A.M.; Mercado, E.C.; Rabinovitz, B.C.; Fernandez-Miyakawa, M.E. Effect of tannins on the in vitro growth of Clostridium perfringens. Vet. Microbiol. 2010, 145, 308–314. [Google Scholar] [CrossRef] [PubMed]
  63. Gutierrez-Banuelos, H.; Pinchak, W.E.; Min, B.R.; Carstens, G.E.; Anderson, R.C.; Tedeschi, L.O.; Krueger, W.K.; Krueger, N.; Lancaster, P.A.; Gomez, R.R. Effects of feed-supplementation and hide-spray application of two sources of tannins on enteric and hide bacteria of feedlot cattle. J. Environ. Sci. Health B 2011, 46, 360–365. [Google Scholar] [CrossRef] [PubMed]
Figure 1. Total number of Clostridia in fecal samples before and after tannin supplementation determined by the most probable number method. No tannin additive in the diet (CON); 10 g of mixture (HT + soy protein additive) per animal—1.0 g kg−1 DM (TAN 1); 15 g of HT additive per animal —1.5 g kg−1 DM (TAN 2); and 15 g of HT additive per animal added to the TMR diet with reduced quantity of concentrate in nominal value—1.5 g kg−1 DM (TAN 3).
Agriculture 12 00939 g001
Figure 2. Concentration of selected Clostridia in 1 g of fecal samples before and after tannin supplementation. No tannin additive in the diet (CON); 10 g of mixture (HT + soy protein additive) per animal—1.0 g kg−1 DM (TAN 1); 15 g of HT additive per animal—1.5 g kg−1 DM (TAN 2); and 15 g of HT additive per animal added to the TMR diet with reduced quantity of concentrate in nominal value—1.5 g kg−1 DM (TAN 3). Number 0 = no growth; number 1 = 1–10 colonies; number 2 = 11–50 colonies; number 3 => 50 colonies; a, b different superscript letters indicate differences (Dunn–Bonferroni post hoc test; p < 0.05) between treatments.
Agriculture 12 00939 g002
Table 1. Ingredients and chemical composition of total mixed ration (g kg−1 DM).
IngredientsTreatment Rations
CONTAN 1TAN 2TAN 3
Corn maize silage126.8126.6126.6132.7
Wheat straw158.4158.3158.2165.9
Sodium bicarbonate10.510.510.511.0
Concentrate568.5567.9567.6546.5
Corn maize135.8135.7135.6142.0
Tanin additive/1.01.51.5
Nutrient content
DM737.9737.7738.2732.8
Crude ash48.547.147.447.2
Crude protein158.1156.6159.7149.2
Crude fibre54.446.150.456.2
Ether extract42.240.042.141.7
Sugar33.530.535.630.7
Starch510.2529.4537.8534.9
Calcium8.56.88.76.3
Phosphorus5.65.85.85.5
Sodium4.03.34.34.5
Magnesium2.11.51.92.1
Potassium7.76.38.07.7
ADF94.495.486.391.2
NDF198.5186.0180.6188.4
ADL18.215.115.115.2
ME (MJ kg−1)12.612.612.612.6
No tannin additive in the diet (CON); 10 g of mixture (HT + soy protein additive) per animal—1.0 g kg−1 DM (TAN 1); 15 g of HT additive per animal—1.5 g kg−1 DM (TAN 2); and 15 g of HT additive per animal added to the TMR diet with reduced quantity of concentrate in nominal value—1.5 g kg−1 DM (TAN 3). Dry matter (DM); acid detergent fiber (ADF); neutral detergent fiber (NDF); acid detergent lignin (ADL); metabolizable energy (ME).
Table 2. Monthly average dry matter intake per pen.
MonthTreatment Groupsp-Value
CONTAN 1TAN 2TAN 3
18.1 ± 0.28.3 ± 0.28.2 ± 0.18.3 ± 0.30.072
28.1 ± 0.18.3 ± 0.18.2 ± 0.28.2 ± 0.30.087
38.0 ± 0.28.2 ± 0.28.2 ± 0.18.3 ± 0.10.079
48.5 ± 0.18.6 ± 0.28.4 ± 0.28.7 ± 0.20.120
58.6 ± 0.29.0 ± 0.48.6 ± 0.28.8 ± 0.20.089
68.8 ± 0.29.0 ± 0.28.9 ± 0.19.1 ± 0.30.101
79.3 ± 0.19.4 ± 0.19.3 ± 0.29.4 ± 0.20.077
No tannin additive in the diet (CON); 10 g of mixture (HT + soy protein additive) per animal—1.0 g kg−1 DM (TAN 1); 15 g of HT additive per animal—1.5 g kg−1 DM (TAN 2); and 15 g of HT additive per animal added to the TMR diet with reduced quantity of concentrate in nominal value—1.5 g kg−1 DM (TAN 3). p-value lower than 0.05, the result is considered significant.
Table 3. Effect of supplemented hydrolyzable tannins on growth performance of Limousin bulls.
ItemsTreatment Groupsp-Value
CONTAN 1TAN 2TAN 3
Feeding trialBody weight, kg
Initial411 ± 11.3429 ± 18.9416 ± 14.0426 ± 11.80.092
Final659 ± 13.2695 ± 22.8669 ± 13.2684 ± 19.20.273
MonthAverage daily gain, g/day
11361 ± 73.91073 ± 143.41261 ± 131.31193 ± 45.20.440
21176 ± 54.51440 ± 106.41336 ± 128.11214 ± 44.40.201
31352 ± 53.81368 ± 45.11412 ± 85.91282 ± 58.00.532
41402 ± 38.11330 ± 16.01322 ± 39.51456 ± 52.10.074
51124 ± 58.1 a1429 ± 74.5 b1217 ± 53.8 b1290 ± 50.2 b0.012
6979 ± 52.3 a1198 ± 26.0 b1031 ± 76.2 b1123 ± 46.3 b0.049
7857 ± 37.5 a985 ± 58.4 b916 ± 97.7 b964 ± 73.1 b0.041
1–71172 ± 22.21260 ± 30.21214 ± 56.21217 ± 27.10.142
No tannin additive in the diet (CON); 10 g of mixture (HT + soy protein additive) per animal—1.0 g kg−1 DM (TAN 1); 15 g of HT additive per animal—1.5 g kg−1 DM (TAN 2); and 15 g of HT additive per animal added to the TMR diet with reduced quantity of concentrate in nominal value—1.5 g kg−1 DM (TAN 3). a,b Mean values in the same row with different letters are significantly different (Duncan, p < 0.05), ± standard error of the mean.
Table 4. Effect of supplemented hydrolyzable tannins on carcass quality of Limousin bulls during a 213-day trial.
ItemsTreatment Groupsp-Value
CONTAN 1TAN 2TAN 3
Carcass weight (kg)418.0 ± 10.0434.0± 8.6422.0 ± 18.6429.0 ± 16.70.289
Conformation score *11.8 ± 0.512.5 ± 0.612.1 ± 0.710.8 ± 0.70.086
Fatness score **7.7 ± 0.68.1 ± 0.36.5 ± 0.67.0 ± 0.40.130
Dressing percentage, %60.4 ± 0.560.1 ± 0.862.1 ± 0.760.5 ± 0.70.090
Depth of chest, cm42.3 ± 0.644.3 ± 0.543.1 ± 0.643.8 ± 0.50.070
Length of carcass, cm137.0 ± 1.4139.0 ± 1.7139.0 ± 1.3141.0 ± 0.90.084
LD muscle area, cm2117.0 ± 4.3118.0 ± 4.0122.0 ± 4.3112.0 ± 2.50.321
LD fat area, cm215.2 ± 1.915.1 ± 1.511.8 ± 1.712.2 ± 1.20.295
No tannin additive in the diet (CON); 10 g of mixture (HT + soy protein additive) per animal—1.0 g kg−1 DM (TAN 1); 15 g of HT additive per animal—1.5 g kg−1 DM (TAN 2); and 15 g of HT additive per animal added to the TMR diet with reduced quantity of concentrate in nominal value—1.5 g kg−1 DM (TAN 3). * Carcass classification system (EUROP) evaluating the conformation—scale 1 (poorest) to 15 (best). ** Carcass classification system (EUROP) evaluating the fatness-scale 1 (least) to 15 (fattest). p-value lower than 0.05, the result is considered significant.
Table 5. Effect of supplemented hydrolyzable tannins on meat quality parameters of Limosin bull muscles.
ItemsTreatment Groupsp-Value
CONTAN 1TAN 2TAN 3
Fresh meat samples
pH 24 h5.7 ± 0.15.5 ± 0.15.5 ± 0.15.5 ± 0.10.266
pH 48 h5.8 ± 0.05.5 ± 0.15.5 ± 0.15.6 ± 0.00.254
L* (lightness), 24 h35.4 ± 1.236.2 ± 1.137.6 ± 1.034.9 ± 1.10.324
a* (redness), 24 h17.4 ± 0.719.9 ± 1.319.8 ± 1.018.4 ± 1.10.303
b* (yellowness), 24 h5.6 ± 0.47.1 ± 0.87.2 ± 0.56.3 ± 0.60.171
L* 48 h36.4 ± 1.338.0 ± 1.137.5 ± 1.136.7 ± 1.00.750
a* 48 h19.1 ± 0.921.7 ± 1.419.3 ± 0.720.2 ± 0.90.265
b* 48 h5.7 ± 0.57.6 ± 0.66.1 ± 0.56.4 ± 0.50.143
Drip loss h, %1.4 ± 0.3 b0.8 ± 0.1 a0.6 ± 0.0 a0.8 ± 0.1 a0.000
Thawing loss, %5.3 ± 0.76.8 ± 0.47.4 ± 0.66.3 ± 0.50.067
Cooking loss, %25.1 ± 2.229.7 ± 1.027.1 ± 1.526.9 ± 1.00.207
Marbling12.8 ± 0.62.2 ± 0.41.4 ± 0.12.0 ± 0.30.088
IMF, %2.8 ± 0.32.9 ± 0.42.1 ± 0.22.5 ± 0.30.201
Protein, %22.2 ± 0.222.3 ± 0.222.5 ± 0.222.4 ± 0.20.617
Water, %74.1 ± 0.573.7 ± 0.374.3 ± 0.274.1 ± 0.30.591
Protein to water ratio3.4 ± 0.13.3 ± 0.13.3 ± 0.13.3 ± 0.10.818
WBSF fresh, N77.5 ± 3.365.1 ± 3.664.5 ± 5.566.7 ± 3.40.126
WBSF cooked, N221.4 ± 37.0222.7 ± 34.0287.1 ± 25.0275.7 ± 26.00.297
Aged meat samples—2 weeks
L*38.5 ± 1.538.2 ± 1.240.5 ± 1.038.4 ± 1.30.640
a*22.1 ± 1.123.3 ± 1.324.3 ± 0.923.2 ± 1.10.476
b*8.4 ± 0.99.5 ± 0.910.3 ± 0.79.8 ± 0.90.465
pH5.7 ± 0.15.6 ± 0.15.5 ± 0.05.7 ± 0.10.491
Vacuum loss, %2.1± 0.32.1 ± 0.52.4 ± 0.32.9 ± 0.50.414
Thawing loss, %3.9 ± 0.4 a4.8 ± 0.8 b4.9 ± 0.3 b5.2 ± 0.5 b0.008
Cooking loss, %19.9 ± 2.428.6 ± 1.124.3 ± 1.223.9 ± 1.40.080
WBSF fresh, N72.9 ± 6.255.8 ± 8.062.2 ± 5.364.2 ± 4.90.310
WBSF cooked, N147.3 ± 17.6133.8 ± 4.9111.6 ± 10.8141.4 ± 11.60.183
No tannin additive in the diet (CON); 10 g of mixture (HT + soy protein additive) per animal—1.0 g kg−1 DM (TAN 1); 15 g of HT additive per animal—1.5 g kg−1 DM (TAN 2); and 15 g of HT additive per animal added to the TMR diet with reduced quantity of concentrate in nominal value—1.5 g kg−1 DM (TAN 3). a,b Mean values in the same row with a different letter are significantly different (p < 0.05) ± standard error of the mean. L* = lightness; a* = redness; b* = yellowness; marbling 1 = visually assessed on a freshly cut Longissimus dorsi (LD) using a scale from 1 (extremely lean) to 10 (extremely marbled sample); WBSF, Warner–Bratzler shear force; IMF, intramuscular fat.
Publisher’s Note: MDPI stays neutral with regard to jurisdictional claims in published maps and institutional affiliations.

