
Research on Polygon Pest-Infected Leaf Region Detection Based on YOLOv8

1
Key Laboratory of Computing Power Network and Information Security, Ministry of Education, Shandong Computer Science Center (National Supercomputer Center in Jinan), Qilu University of Technology (Shandong Academy of Sciences), Jinan 250014, China
2
Shandong Provincial Key Laboratory of Computer Networks, Shandong Fundamental Research Center for Computer Science, Jinan 250014, China
3
Faculty of Data Science, City University of Macau, Macau 999078, China
4
Communication College, Qingdao Agricultural University, Qingdao 266109, China
*
Author to whom correspondence should be addressed.
Agriculture 2023, 13(12), 2253; https://0-doi-org.brum.beds.ac.uk/10.3390/agriculture13122253
Submission received: 12 November 2023
/
Revised: 3 December 2023
/
Accepted: 6 December 2023
/
Published: 8 December 2023
(This article belongs to the Section Crop Protection, Diseases, Pests and Weeds)
Abstract
:Object detection in deep learning provides a viable solution for detecting crop-pest-infected regions. However, existing rectangle-based object detection methods are insufficient to accurately detect the shape of pest-infected regions. In addition, the method based on instance segmentation has a weak ability to detect the pest-infected regions at the edge of the leaves, resulting in unsatisfactory detection results. To solve these problems, we constructed a new polygon annotation dataset called PolyCorn, designed specifically for detecting corn leaf pest-infected regions. This was made to address the scarcity of polygon object detection datasets. Building upon this, we proposed a novel object detection model named Poly-YOLOv8, which can accurately and efficiently detect corn leaf pest-infected regions. Furthermore, we designed a loss calculation algorithm that is insensitive to ordering, thereby enhancing the robustness of the model. Simultaneously, we introduced a loss scaling factor based on the perimeter of the polygon, improving the detection ability for small objects. We constructed comparative experiments, and the results demonstrate that Poly-YOLOv8 outperformed other models in detecting irregularly shaped pest-infected regions, achieving 67.26% in mean average precision under threshold () and 128.5 in frames per second (FPS).
1. Introduction
Corn is an essential crop for humans, widely used in biomass energy, the chemical industry, pharmaceuticals, and more, playing a significant role in human societal development. However, Spodoptera frugiperda and Mythimna separata (to simplify the writing, we use the name “pest” to represent both Spodoptera frugiperda and Mythimna separata in this paper) often lead to missed optimal prevention and treatment periods due to the low efficiency of manual diagnosis and rapid pest spread. Thus, it is essential to detect corn pests early and control pest infection. The timely detection of corn pests and adoption of appropriate measures can effectively reduce the impact of pests on corn yield, ensuring the safety of corn quality and economic benefits.
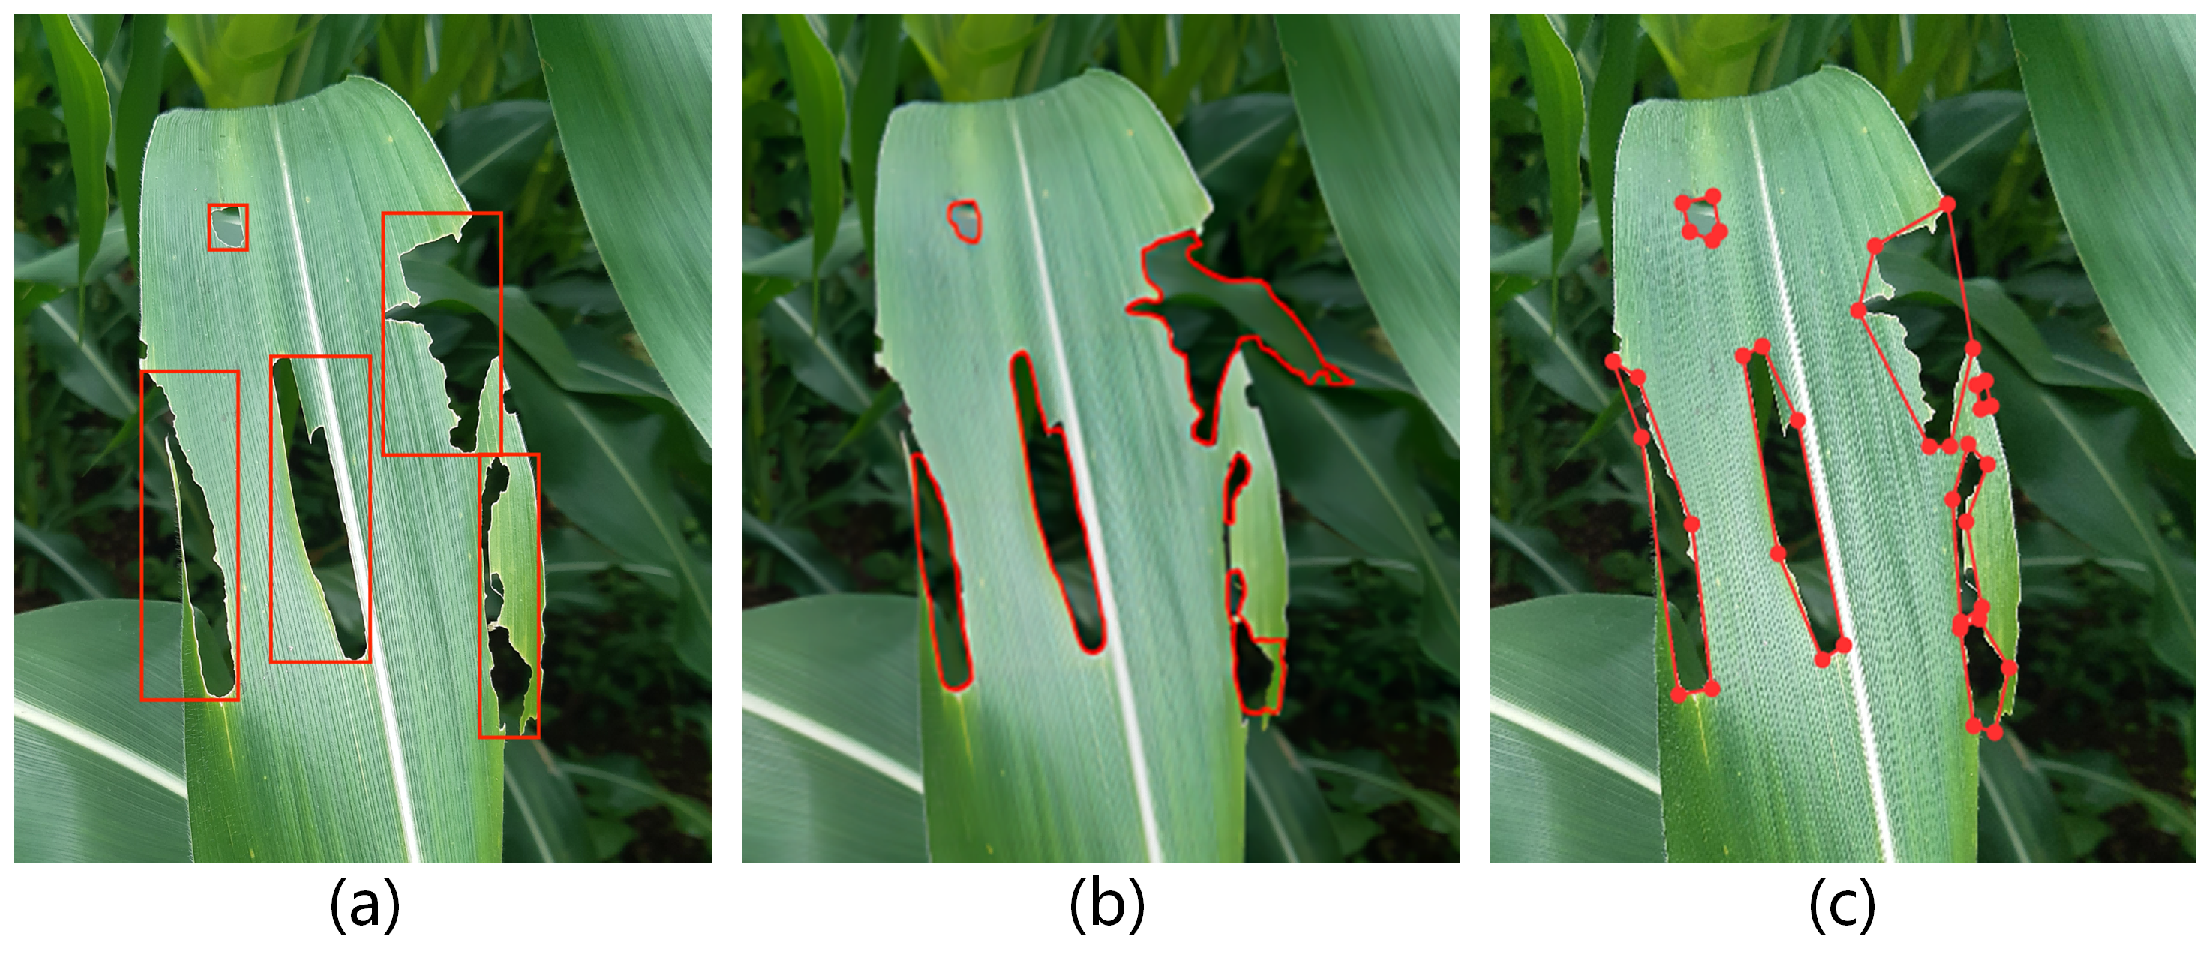
In recent years, deep learning has achieved tremendous success in computer vision, spawning a variety of computer vision technologies, including object detection [1], image classification [2], instance segmentation [3], etc. The realm of agricultural applications has also seen a surge in research endeavors leveraging computer vision technology, encompassing tasks such as crop maturity detection and pest disease classification. However, the current research on deep learning in agriculture is unbalanced, with relatively less research and application in the pest-infected region detection domain. Moreover, the existing pest research work was relatively simple, and they had certain limitations when dealing with complex-shaped, overlapping pest-infected regions. For example, existing object detection methods usually use rectangular boxes for detection, as shown in part (a) of Figure 1. However, these boxes include redundancy background information, leading to inaccurately describing the shape of pest-infected regions. Additionally, using pixel-level processing, instance segmentation is insufficient to handle pest-infected regions with unclear backgrounds and ambiguous edges, as shown in part (b) of Figure 1. Especially near leaf edges, the segmented regions will spread outward, leading to the ineffective detection of pest-infected regions.
The current object detection algorithms are mainly two types: two-stage and single-stage object detection algorithms. Two-stage object detectors generate potential object bounding boxes through a region proposal algorithm (such as selective search or region proposal network, etc.) then perform object detection by eliminating redundant proposals. Compared with two-stage object detection, the single-stage object detection methods have no region proposal; hence, they have superior detection speed. Among them, YOLO (You Only Look Once) was a representative single-stage detector proposed by Redmon et al. [4]. Then, researchers proposed various variants [5], including YOLOv8. Despite maintaining high detection accuracy and speed, the traditional YOLOv8 used rectangular anchor boxes for object detection, which included unnecessary background and limited its ability to detect polygon pest-infected regions.
Therefore, this paper aims to propose a new method for detecting pest-infected regions using polygons. This method is designed to balance speed and accuracy in detecting these regions. The implementation process involved annotating corn leaf images of pest-infected regions with polygons and creating a PolyCorn dataset. We annotated pest-infected images using Labelme, an annotating tool linked at https://github.com/wkentaro/labelme and accessed on 8 April 2018. During the labeling process, we annotated points in both clockwise and counterclockwise directions. Concurrently, we adjusted the polygon bounding box to closely follow the shape of the pest-infected regions. Addressing the issues of unnecessary background in traditional rectangular prediction boxes and the limitations of instance segmentation when detecting edges, we proposed an innovative polygon pest-infected region detection model named Poly-YOLOv8, incorporating YOLOv8 and a new polygon detection head. Furthermore, we devised an algorithm that reduces overfitting in regression loss caused by coordinate order, called an order-insensitive algorithm. This algorithm enhanced the model’s emphasis on detecting pest-infected region shapes. Specifically, we introduced a scaling factor derived from the perimeter of the polygon. This factor balanced the various scales of pest-infected regions’s loss, enhancing the model’s ability to detect small regions. Experiments showed that the Poly-YOLOv8 is effective in detecting pest-infected regions.
The following are the main contributions of our work:
- We have constructed a PolyCorn dataset of corn pest-infected regions annotated with polygons, providing a dataset for detecting polygon pest-infected regions domain.
- We have proposed a novel polygon-based object detection model that effectively balances detection accuracy and speed. This model outperforms other baseline models in detecting corn pest-infected regions.
2. Related Work
With the rapid development of deep learning, scholars have increasingly focused on object detection in recent years. Deep learning offers the benefits of high precision and rapid efficiency in object detection, outperforming traditional object detection techniques.
2.1. Two-Stage Detectors
Object detection models are categorized into two-stage and single-stage detectors based on their structural design. The R-CNN [6], Fast R-CNN [7], Faster R-CNN [8], and Mask R-CNN [9] are representative two-stage algorithms. Jiao et al. [10] developed a multi-class pest detection method with CNN (Convolutional Neural Network) as a core module, introducing adaptive feature fusion to extract richer pest features and realize pest detection in complex scenarios. Rahman et al. [11] proposed a lightweight CNN algorithm based on two-stage training, which improved the detection effect of rice diseases and pests. Selvaraj et al. [12] used DCNN (Deep Convolutional Neural Networks) and transfer learning for detecting banana pests. Later, Wang et al. [13] adopted Faster R-CNN for tomato disease detection and Mask R-CNN for segmenting disease regions. Xie et al. [14] improved grape leaf disease detection with their Faster DR-IACNN model. They integrated Inception-v1, Inception-ResNet-v2, and SE-block into the Faster R-CNN algorithm. Experiments showed its higher object detection ability.
2.2. Single-Stage Detectors
Generally, single-stage detectors have better speed advantages than two-stage detectors. Representative single-stage algorithms included the YOLO series, SSD [15], etc. Liu et al. [16] optimized the YOLOv3 model by introducing a multi-scale feature pyramid, which improved the accuracy and speed of the YOLOv3 model in tomato pest detection. Liu et al. [17] improved the MobileNetv2-YOLOv3 model using the (Generalized Intersection over Union) loss function for boundary regression. This modification improved accuracy in detecting tomato gray spot disease. Ganesan et al. [18] employed a hybrid model combining the ResNet and YOLO classifier with K-means for detecting rice leaf disease. Leng et al. [19] proposed a lightweight model for object detection based on YOLOv5 to detect corn leaf blight in complex scenarios. Li et al. [20] proposed an algorithm for vegetable disease detection by employing the CSP, FPN, and NMS (Non-Maximum Suppression) modules in YOLOv5-s. The improved algorithm enhanced the multi-scale feature extraction ability. Afterward, Qi et al. [21] introduced a visual attention mechanism into the SE-YOLOv5 network model, which realized key feature extraction in tomato disease detection. Khan et al. [22] adopted multiple YOLO models to detect diseases of corn, proving the effectiveness of YOLO models in pest detection. However, the mentioned works above mainly detect diseases or pests on leaves, ignoring the pest-infected regions detection of the leaf. Moreover, traditional object detection adopted rectangular boxes, which easily contain background information and ignore the advantages of the polygon in detecting pest-infected regions.
2.3. Polygon Object Detectors
Polygon object detection is a branch of object detection research. Hurtik et al. [23] proposed Poly-YOLO, a model that is based on YOLOv3 and employs a high-resolution single output layer. Poly-YOLO was designed to enhance the performance of polygon object detection. Furthermore, the CenterPoly [24] and CenterPolyV2 [25] were designed for road user detection in dense urban environments, employing vertex prediction heads and multiple types of losses to optimize model performance. However, these models have a poor ability to detect pest-infected regions because the overfitting vertex order information leads to ignoring shape features. Employing polar coordinates, Zheng et al. [26] proposed a new DPPD (Deformable Polar Polygon Object Detection) model, which decoded the regression vector into valid polygons and resampled sparse polygons into dense polygons. However, this model can only predict a polygon detection box with a fixed number of vertices. Moreover, the polygon detection models mentioned above need improvement because detecting pest-infected regions demands high detection speed.
2.4. Image Classification and Instance Segmentation Detectors
Image classification and instance segmentation are additional methods for detecting pests and diseases. Padilla et al. [27] used CNN and OpenMP to classify blight, rust, and spot in corn leaf. Singh et al. [28] proposed an MCNN (Multi-layer Convolutional Neural Network) for classifying mango leaves infected with anthracnose. Furthermore, Tang et al. [29] proposed a classification model with 13 kinds of plant diseases. However, as a coarse-grained detection method, image classification categorizes the entire image, ignoring the specific pest-infected regions on leaves. Compared with image classification, fine-grained instance segmentation had some advantages in disease and pest-infected detection. Stewart et al. [30] used the Mask R-CNN to detect and measure the severity of corn leaf blight. This model could accurately detect and segment single lesions. Lin et al. [31] proposed a segmentation model based on CNN, which segmented powdery mildew on cucumber leaf images at the pixel level. Wang et al. [32] designed a novel attention module to improve D2Det. They trained it using super-resolution, enhancing performance in instance segmentation for pest detection. In addition, Li et al. [33] proposed an integrated framework that combines instance segmentation, classification, and semantic segmentation models. This framework enabled the accurate segmentation and detection of potato leaf diseases. However, instance segmentation mainly aims at pest-infected regions with apparent boundaries, which is less effective when addressing leaf pest-infected regions with blurred boundaries [34]. Therefore, the pest-infected region detection domain needs more effective detection methods.
2.5. Our Work
In this work, we addressed the issue in traditional object detection methods where the use of rectangular bounding boxes captures excessive background information. Hence, we employed polygons for pest region detection. Using order-insensitive loss, we proposed Poly-YOLOv8, which can solve the overfitting problem on vertex order information in existing polygon detection models. It enhanced the performance and speed of pest-infected region detection.
3. Model
Given an image of corn pests, our model aims to accurately and quickly detect the polygon pest-infected regions on the corn leaves. We have annotated a dataset of polygon pest-infected regions based on corn images. To effectively extract features, we chose the YOLOv8 as the backbone network. Specially, we designed a new polygon detection head to detect pest-infected regions on corn leaves efficiently.
3.1. Data Loading
We established a Polygon Corn Leaf Pest-infected Region Dataset (PolyCorn) by labeling the polygon pest-infected regions with a points range of 3 to 6, as shown in part (c) of Figure 1. The annotation details are discussed in Section 4.1. We employed coordinate padding for regions with fewer than 6 points to maintain consistency of the feature matrix and preserve the object region’s shape. The coordinate point information is , where represents the horizontal and vertical coordinates of the point. Additionally, we set up true existence labels to distinguish between ground truth points and padding points, where indicates whether the point is a ground truth point. Furthermore, we used Mosaic data augmentation to enhance the robustness of pest-infected region detection, including random scaling, cropping, and arrangement.
3.2. Backbone Network
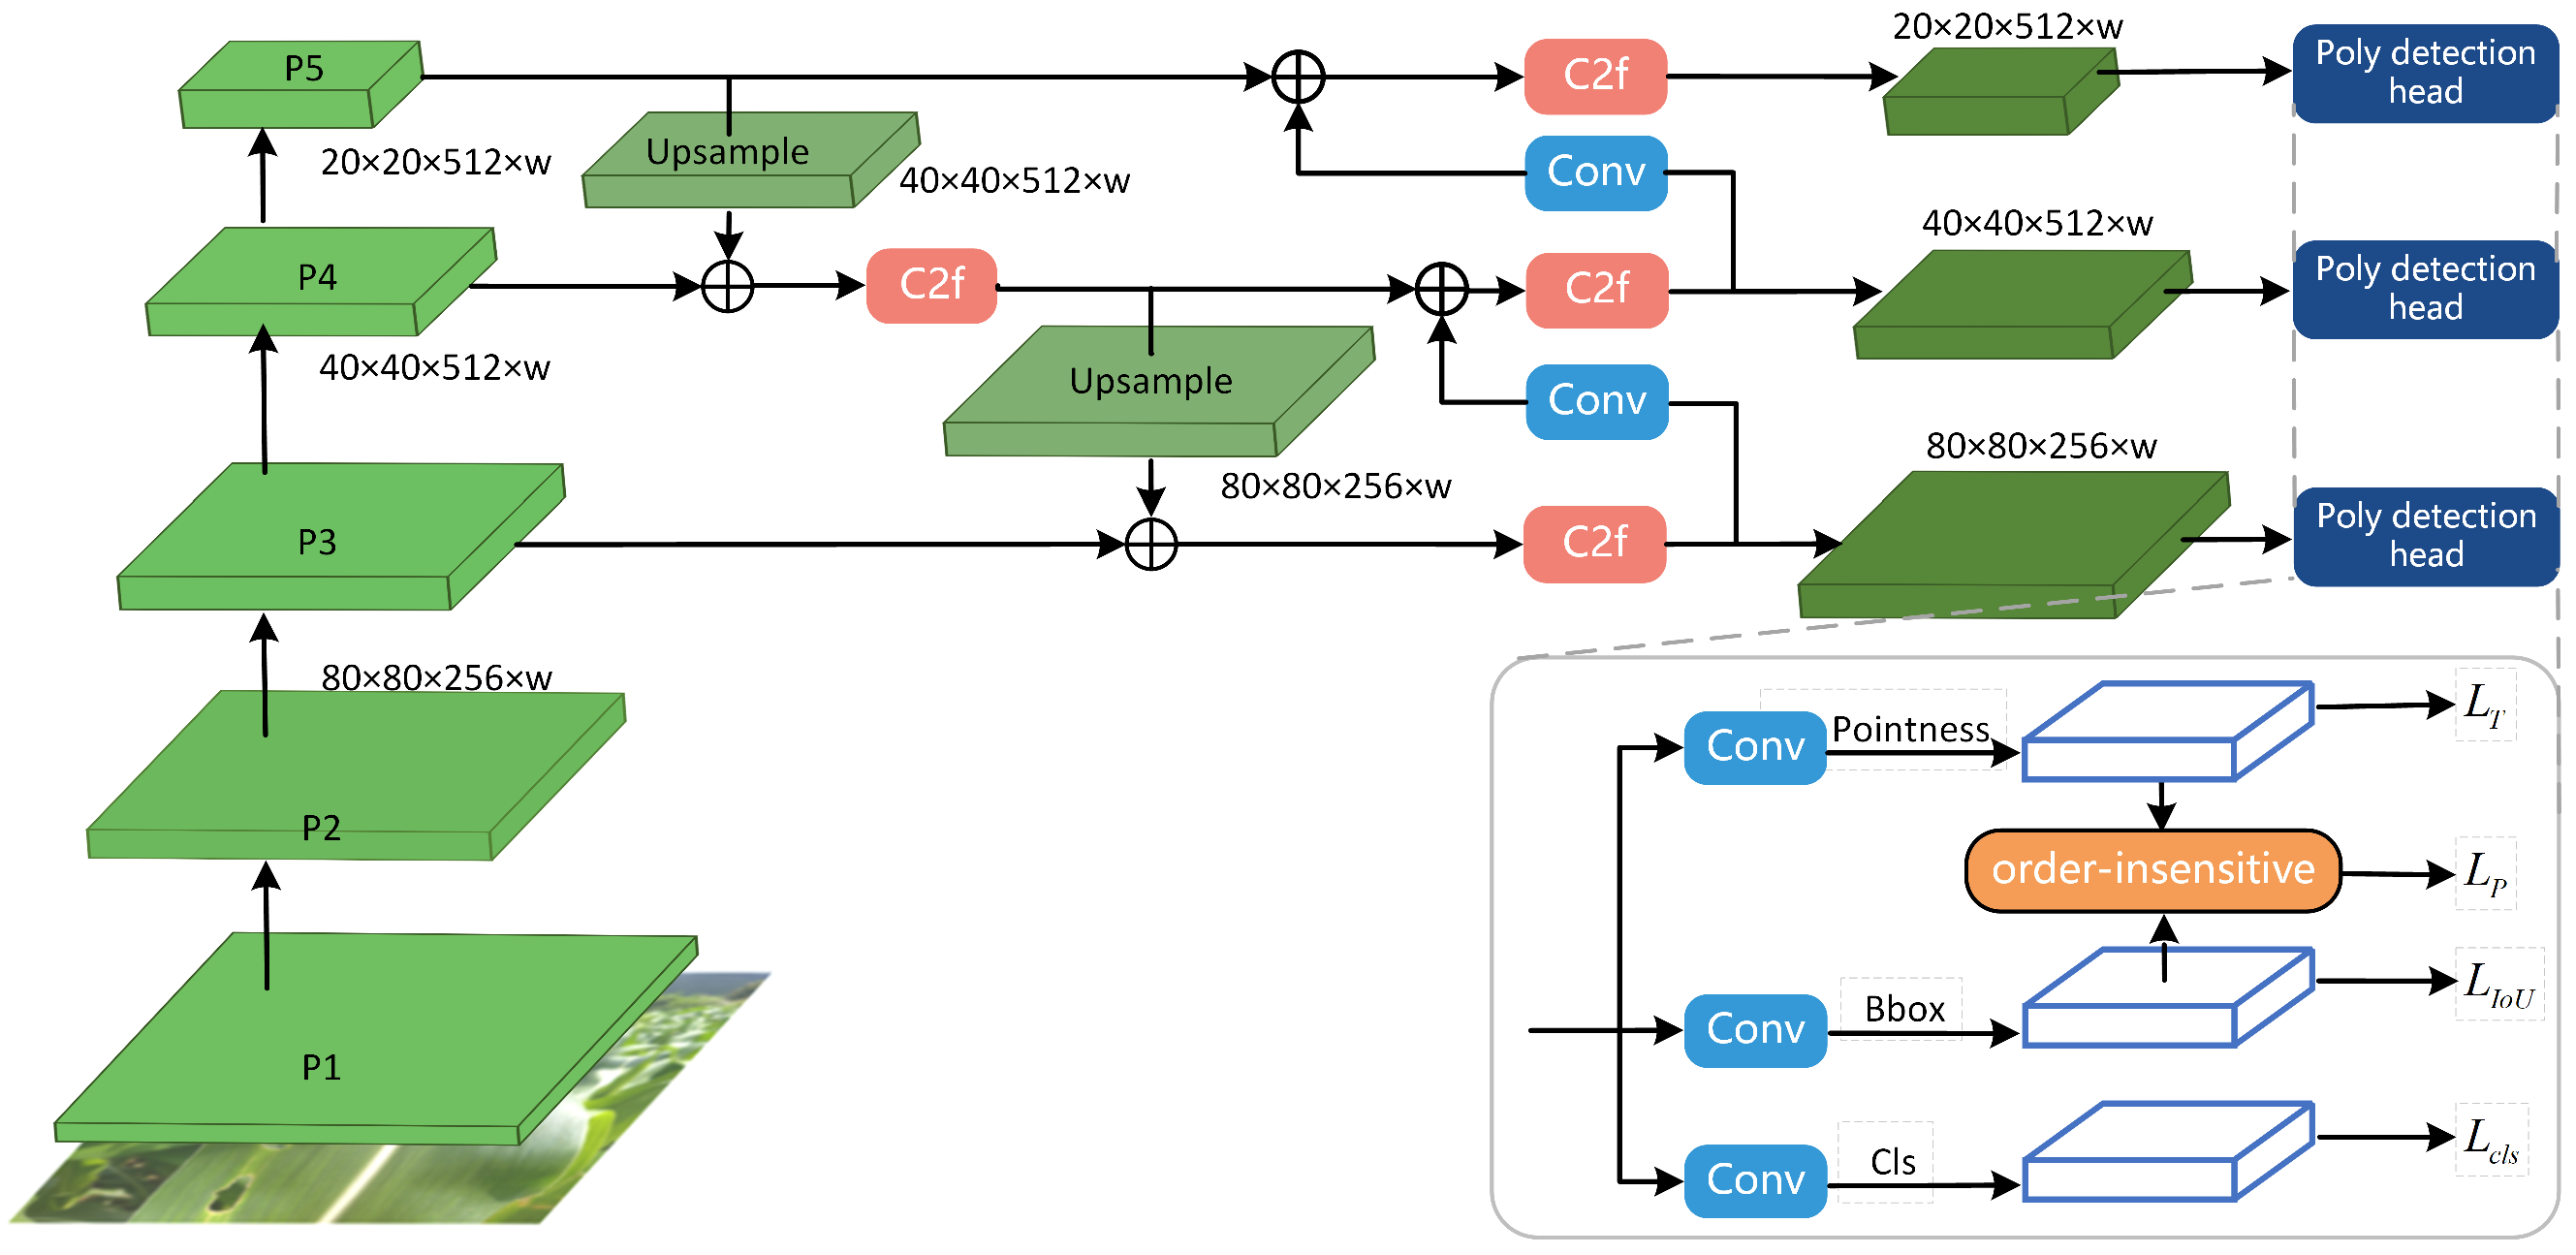
The structure of Poly-YOLOv8 proposed in this paper is shown in Figure 2. The Poly-YOLOv8 backbone network relies on multiple C2f (Coarse-to-fine) modules. These modules address the problem of repetitive gradient information in large-scale CNN frameworks, reducing model parameters and improving detection speed. Moreover, pest-infected region feature representation is extracted by pooling and fusing multiple scale feature maps, which express rich features (such as shape and texture features) of those regions, thereby improving detection accuracy.
During the feature extraction process of the backbone network, five different scale features (P1–P5) were produced. We employed top-down and bottom-up feature fusion methods to fuse P3, P4, and P5 information and enhance the semantic representation. Furthermore, we defined the feature outputs of the backbone network at three different scales as , , and , respectively, where w is an adjustment factor used to adapt different parameter volume of the detection model.
3.3. Improved Polygon Detection Head
To efficiently detect pest-infected regions, we designed a new polygon detection head. As shown in Figure 2, the detection head designed with a decoupled structure can achieve better expressive ability. It mainly consists of three branches: The pointness branch predicts whether each point belongs to a pest-infected region. The bbox branch predicts the bounding box coordinates of the pest-infected region, while the cls branch classifies the type of those regions. Additionally, we designed an order-insensitive module to compute the coordinate regression loss.
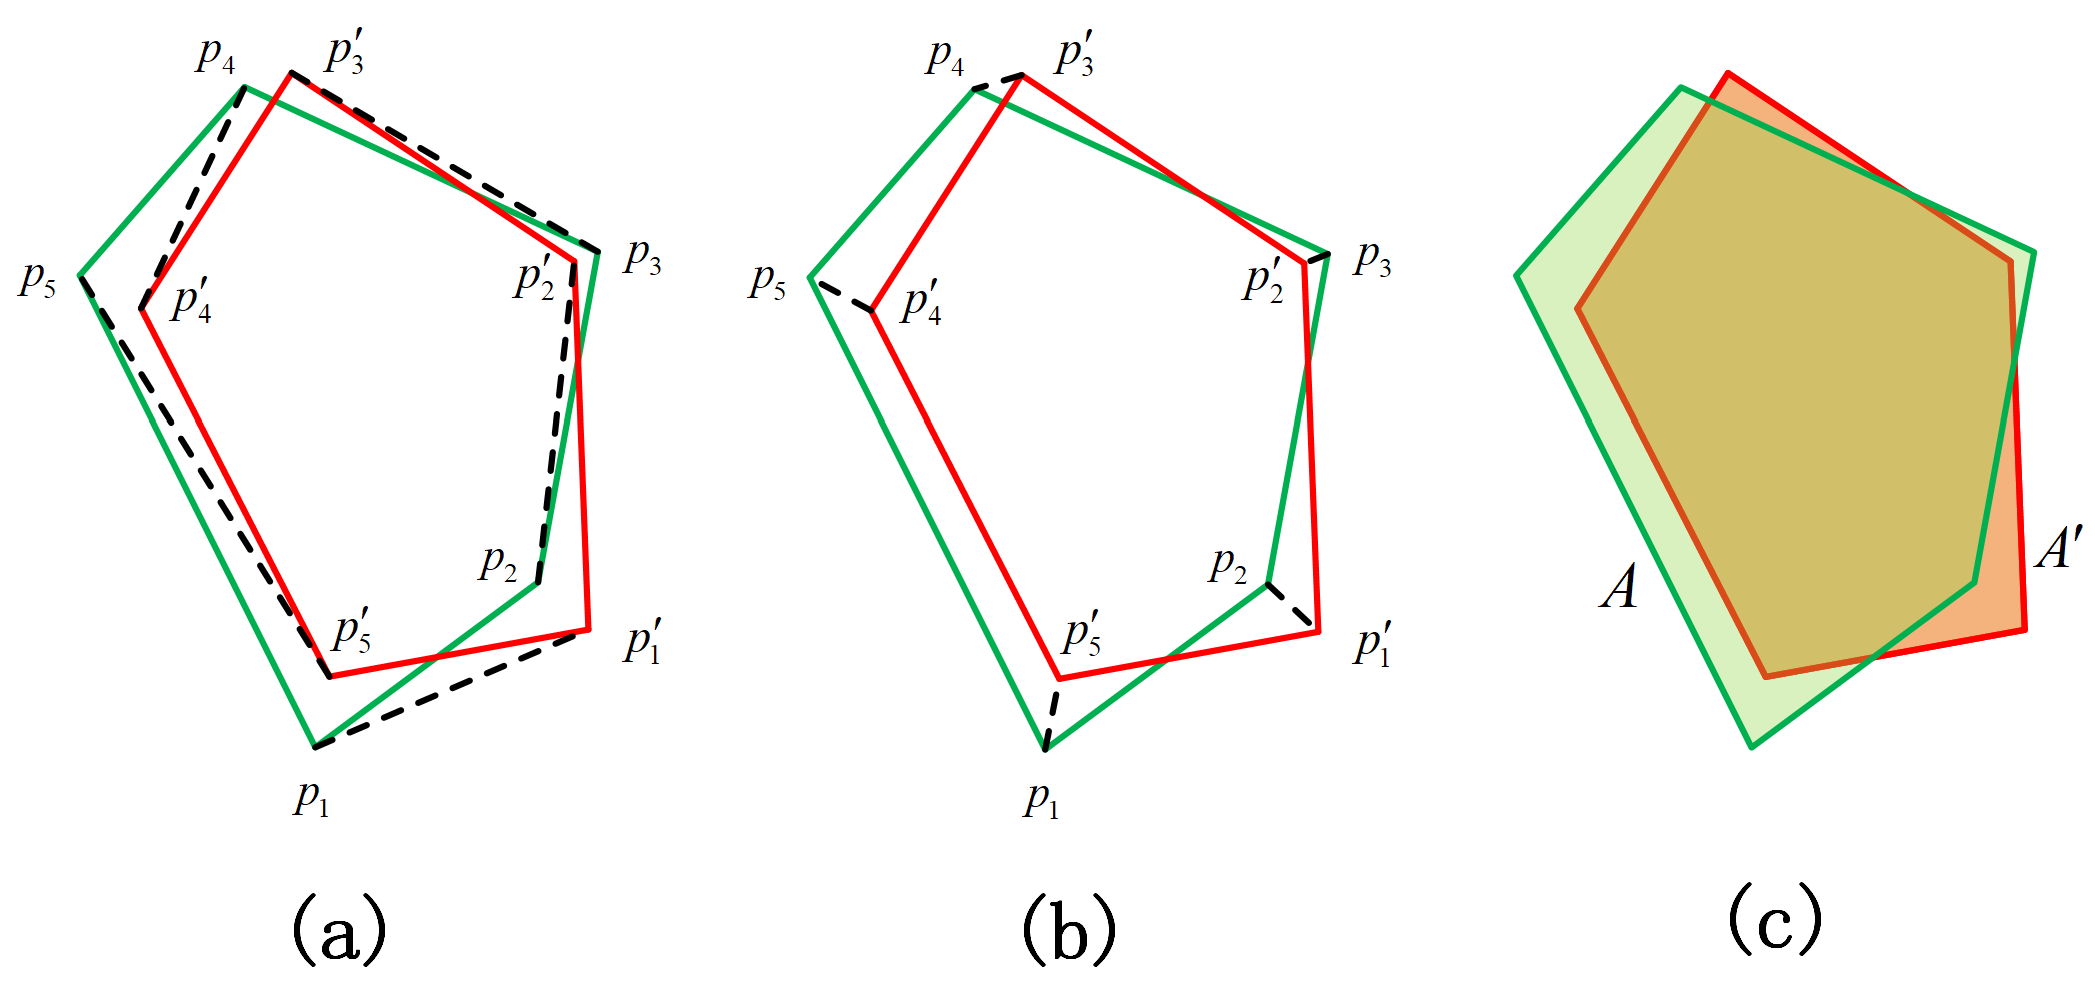
We used the decoupled head to predict polygon object information for the three scale feature map from the network. In the bbox branch, we used the convolutions module with kernel to process three different scales feature maps and predict the coordinate information , where represents the predicted coordinate point. As shown in part (a) of Figure 3, traditional polygon calculation predicts coordinate points and regression loss, giving excessive consideration to fitting the prediction object point order to the model. Observing part (b) of Figure 3, we found that the prediction box was already close to the ground truth bounding box for object detection in the real world. However, the displacement of the prediction point order will cause excessive regression loss when calculating regression loss, which neglects the importance of detection shape for object detection, causing disturbances in the model convergence process. Simultaneously, overfitting to point order reduced the overall robustness of the model, a phenomenon that we referred to as coordinate order sensitivity loss. To solve this problem, we proposed an order-insensitive regression loss calculation algorithm. Hence, we introduced the pointness branch to extract the true existence information of coordinate points, which adopted a convolution module with kernel. The extraction formula is defined as follows:
where is the output of the pointness branch. In our work, the pointness branch aims to learn whether the corresponding coordinate point truly exists (a true value of 1 indicates existence, and 0 indicates non-existence). Therefore, to approximate the function value as closely as possible to the binary value [0,1] and ensure function continuity for back-propagation, we designed an approximation function f, defined as , where k is the approximation coefficient with a value of 256. Simultaneously, we adopted a gradient regularization truncation mechanism to prevent a gradient explosion during approximation. For inference, we will maintain points in that the confidence is greater than , using them as the predicted coordinate points for the polygon detection box.
Afterward, we selected the points closest to the true value coordinate points from the predicted value coordinate point subset by Algorithm 1. The algorithm iterated through each ground truth point and calculated its distance from each predicted point using the Euclidean distance. It selected the predicted point with the minimum distance from the ground truth point. Then, it updated the index of the selected predicted point z and the probability of existence v. We repeated the process until all ground truth points have been traversed. As a result, the algorithm constructed a tuple, which contains a ground truth point and a selected predicted point with its existence probability. Finally, these tuples were added in a set E. We removed the prediction selected point from the set of to avoid duplicate calculations. Subsequently, we calculated the coordinate regression loss of each prediction box as follows:
where is the number of elements in set E; e is a element in set E; represents the existence probability of the prediction box in this ; and , respectively, represent the x-coordinate and y-coordinate of the ground truth box in this ; and and , respectively, represent the x-coordinate and y-coordinate of the predicted box in this . To enhance the detection ability for small pest-infected regions, we introduced scaling factor a based on the perimeter of the polygon for harmony MSE (Mean Square Error), where , C and , respectively, represent the perimeters of the ground truth box and the predicted box. Afterward, we calculated the coordinate existence loss as follows:
We defined the coordinate regression loss .
Additionally, we used polygon loss to constrain the shape of the object box, as shown in part (c) of Figure 3. Since it involved non-convex polygon computation, we obtained the pixel areas covered by the ground truth object box and predicted object box, respectively. Then, we calculated by computing the intersection and union pixel of the images. The loss is formulated as follows:
where A is the pixel area covered by ground truth box, and is the pixel area covered by predicted box.
| Algorithm 1 Order-insensitive algorithm |
|
In the cls branch, we adopted a convolution module with kernels to predict the probability of the object categories. The prediction process is formulated as follows:
We used NMS to filter out redundant boxes and the binary cross-entropy loss function to calculate the object classification loss. The calculation formula is defined as follows:
where y and represent the ground truth label probability and the predicted box probability, respectively. Combining the three types of losses, we calculated the overall loss L as follows:
where N is the number of samples in the training set and j represents the sample index.
We developed the Poly-YOLOv8 using the PyTorch framework, which automatically computes gradients for model parameters through loss and automatic adjustment of parameters via gradient descent. Our model employed an improved polygon detection head that effectively detects pest-infected regions with varying shapes. Additionally, we designed an order-insensitive loss calculation method to solve the overfitting of vertex ordering features on the model’s learning. This enabled the model to focus on learning the intrinsic shape features of pest-infected areas.
4. Experiments
4.1. Data Processing
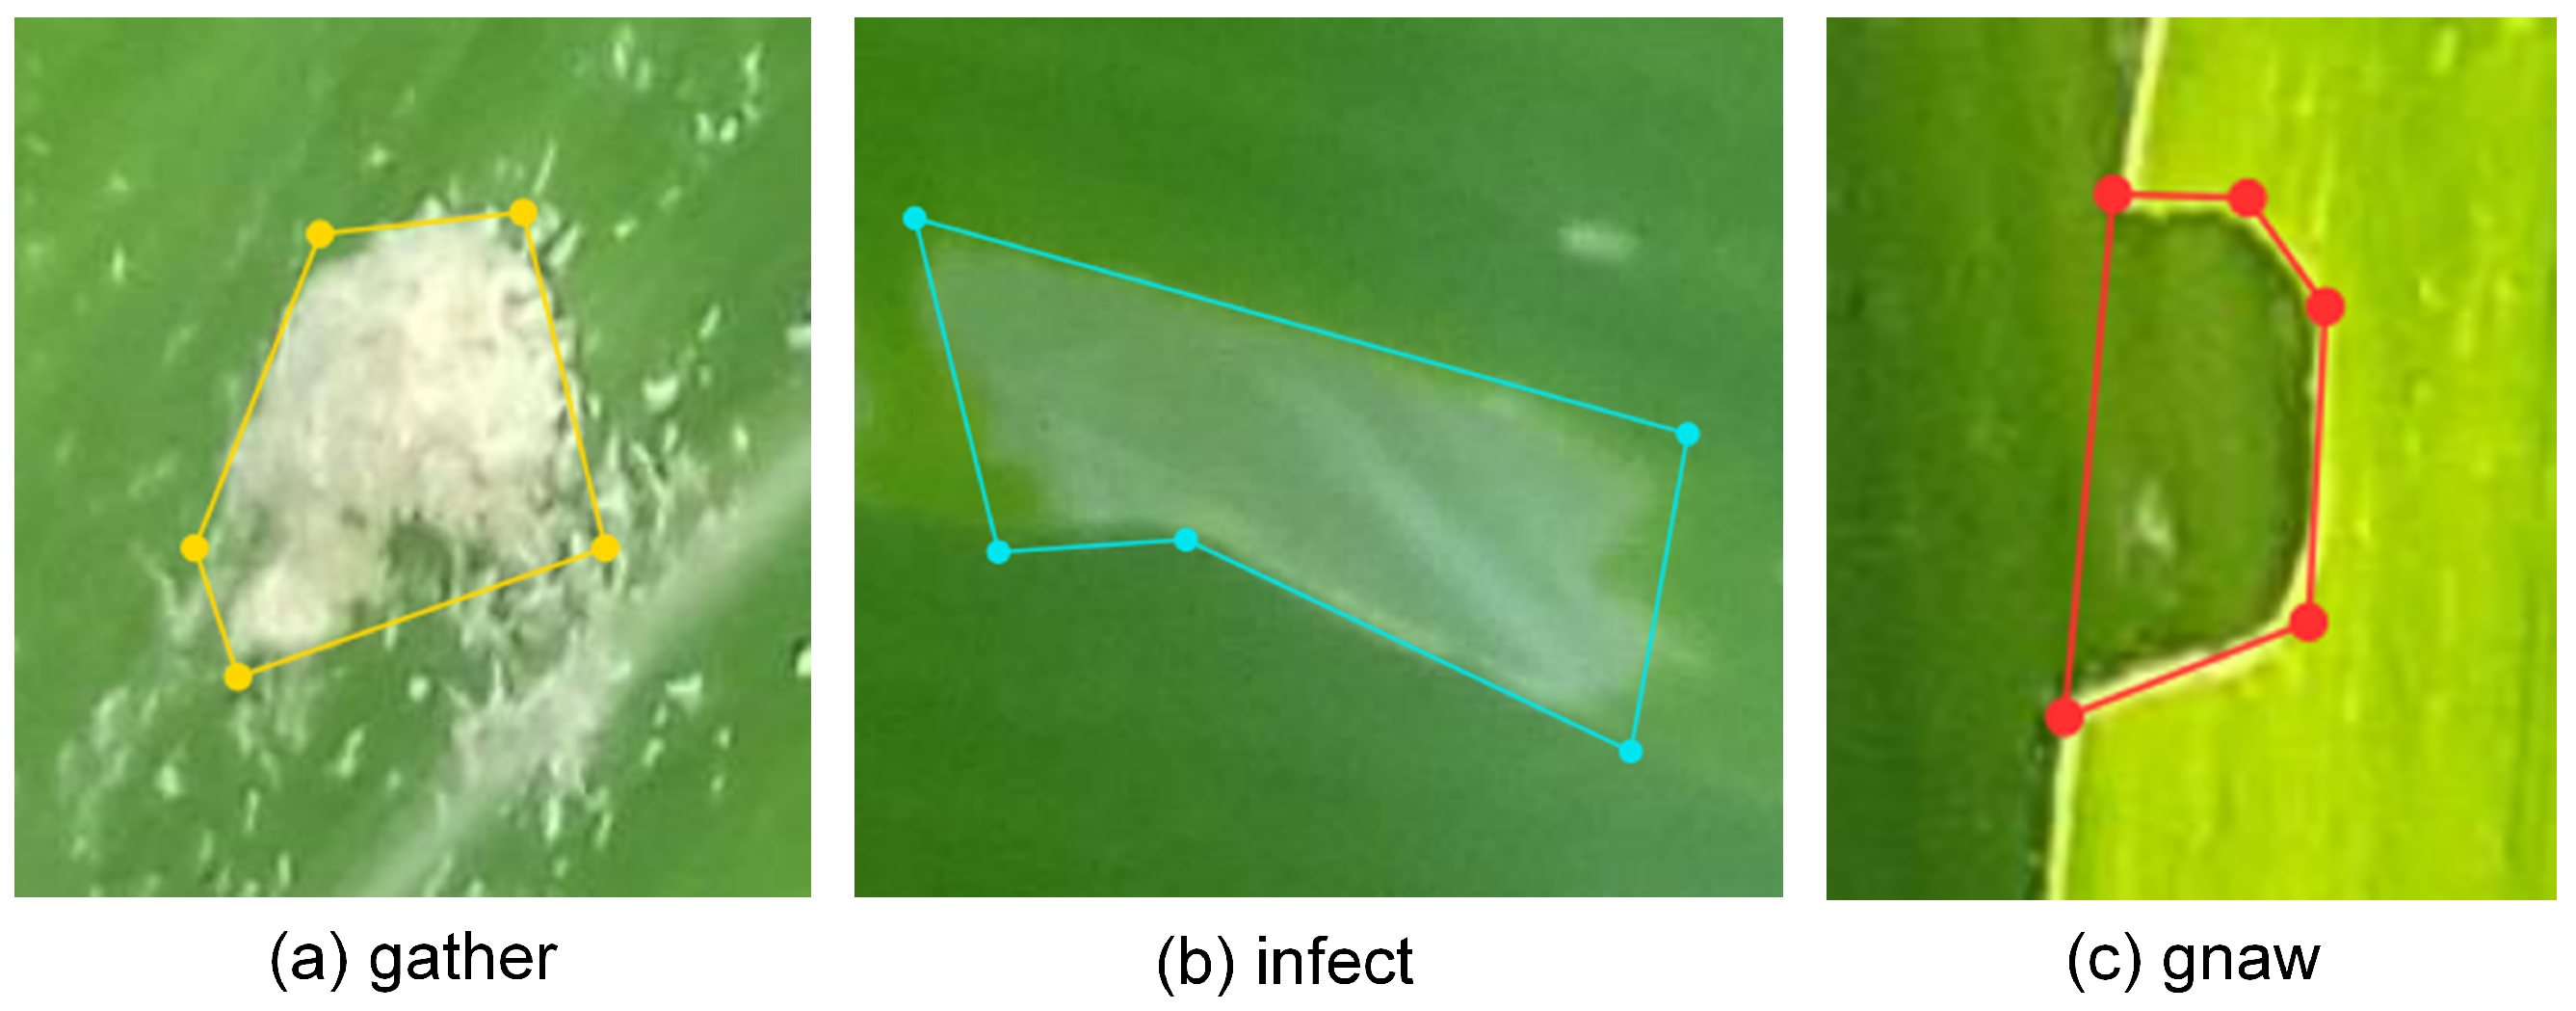
In this paper, we focus on the detection of pest-infected regions in corn. Hence, we used the PolyCorn dataset in experiments. The raw dataset selected in this paper was taken from the Kaggle repository (Acharya, 2020) Corn Leaf Infection Dataset, labeled as healthy and infected. The dataset contains 4225 images, with the number of healthy and infected being 2000 and 2225, respectively. Since we only detected pest-infected regions, we selected 2225 infected images as the annotation subject. Those images are infected by two types of pests: Spodoptera frugiperda and Mythimna separata. Additionally, these corn images cover three different stages of corn growth, namely, the seeding stage, the tillering stage, and the flowering and grain-filling stage. During the annotation, we found that a polygon with 6 points could cover most pest-infected regions. Furthermore, we aim to detect the degree of damage on corn leaves rather than the specific type of pest. Therefore, we categorized the pest-infected regions into three different stages for annotation purposes, namely, gather (the pest gathering region), infect (the infected pest region), and gnaw (the gnawed pest region) respectively. That constructed the PolyCorn dataset, which was open-sourced at https://github.com/meizi-eng/PolyCorn-Dataset and accessed on 23 July 2023. We split the training and test datasets with 70% and 30% proportions, respectively. The images of the three categories are shown in Figure 4.
4.2. Evaluation Metrics
We expected the model to balance detection accuracy and speed in object detection. To comprehensively evaluate the abilities of the model in these two aspects, we employed the mainstream evaluation metrics P (Precision), R (Recall), and mAP (mean Average Precision) under different thresholds (In object detection, there may be redundant predicted bounding boxes. The is employed to evaluate the degree of overlap between predicted and ground truth regions. In mAP, only predicted bounding boxes greater than the threshold will be retained). Those metrics are commonly used to evaluate detection accuracy in the object detection domain. Meanwhile, the FPS (Frames Per Second) was adopted to evaluate the detection speed of the model. The values of these metrics were positively correlated with the effectiveness of the detection model.
4.3. Parameter Settings
We developed the model based on the Pytorch framework and completed the model training on 2 GPUs (NVIDIA A100 40 G, Santa Clara, CA, USA). The hyper-parameter settings during the training process are shown in Table 1. The number of training epochs was set to 300. The large image sizes will provide more features for model learning, but they also increase computational complexity and training time. We set image size as , which balances model performance and computational efficiency. A large batch size can increase training speed because it enables the model to process more samples simultaneously. However, this may compromise stability during training. Conversely, a small batch size can promote training stability at a slow training speed. To balance between these factors, we set the batch size as 16.
We used the SGD optimizer to optimize model parameters. We set the momentum parameter as 0.937, which was used to accelerate the convergence of SGD and stabilize its update direction. A weight decay coefficient of was employed to mitigate overfitting and enhance generalization.The initial learning rate and the learning rate decay mechanism can impact the model’s training speed and performance. A higher initial learning rate accelerates training but raises instability, while a lower learning rate increases stability at slow training speed. In this paper, we set the initial learning rate to and employed a learning rate decay mechanism, resulting in a final learning rate of . Those settings will balance learning speed and stability. The model was saved every 10 epochs for selecting the optimal model. Additionally, we employed data augmentation methods, including image scaling, left-right image flipping, mosaic application, and image translation. The probabilities that occurred during training were 0.5, 0.5, 1.0, and 0.1, respectively. The threshold for non-maximum suppression was set to 0.7. We defined several parameter scaling factors: n, s, m, l, and x, with the number of parameters increasing sequentially. Furthermore, the adjustment factor w was set as 0.25, 0.5, 0.75, 1.0, and 1.25 under the parameter scaling factor n, s, m, l, and x, respectively. The adjustment factor w is shown in Figure 2. It multiplies the hidden layer dimension to control the scale of model parameters.
4.4. Baseline Models
To comprehensively compare our proposed model, we conducted comparative experiments with the Poly-YOLOv8 and five advanced baseline models. Specifically, it included Mask R-CNN, Poly-YOLO, DPPD, CenterPoly, and CenterPolyV2. The information for the baseline models is shown in Table 2. We compared our proposed model with baseline models in terms of detection accuracy and speed for pest-infected regions. The original Mask R-CNN is a rectangular bounding box detector. To facilitate the adaptation of the model to polygon object detection, we employed the polygon detection head proposed in this paper to replace the detection head of Mask R-CNN while maintaining the rest of the network architecture unchanged. Hence, the replaced Mask R-CNN retained its original detection capabilities. Additionally, the YOLOv8 series contains five scaling models, marking different scale models based on parameter scaling factors n/s/m/l/x. We used Poly-YOLOv8 series models with the same scaling factors as YOLOv8.
4.5. Comparative Experiment Analysis
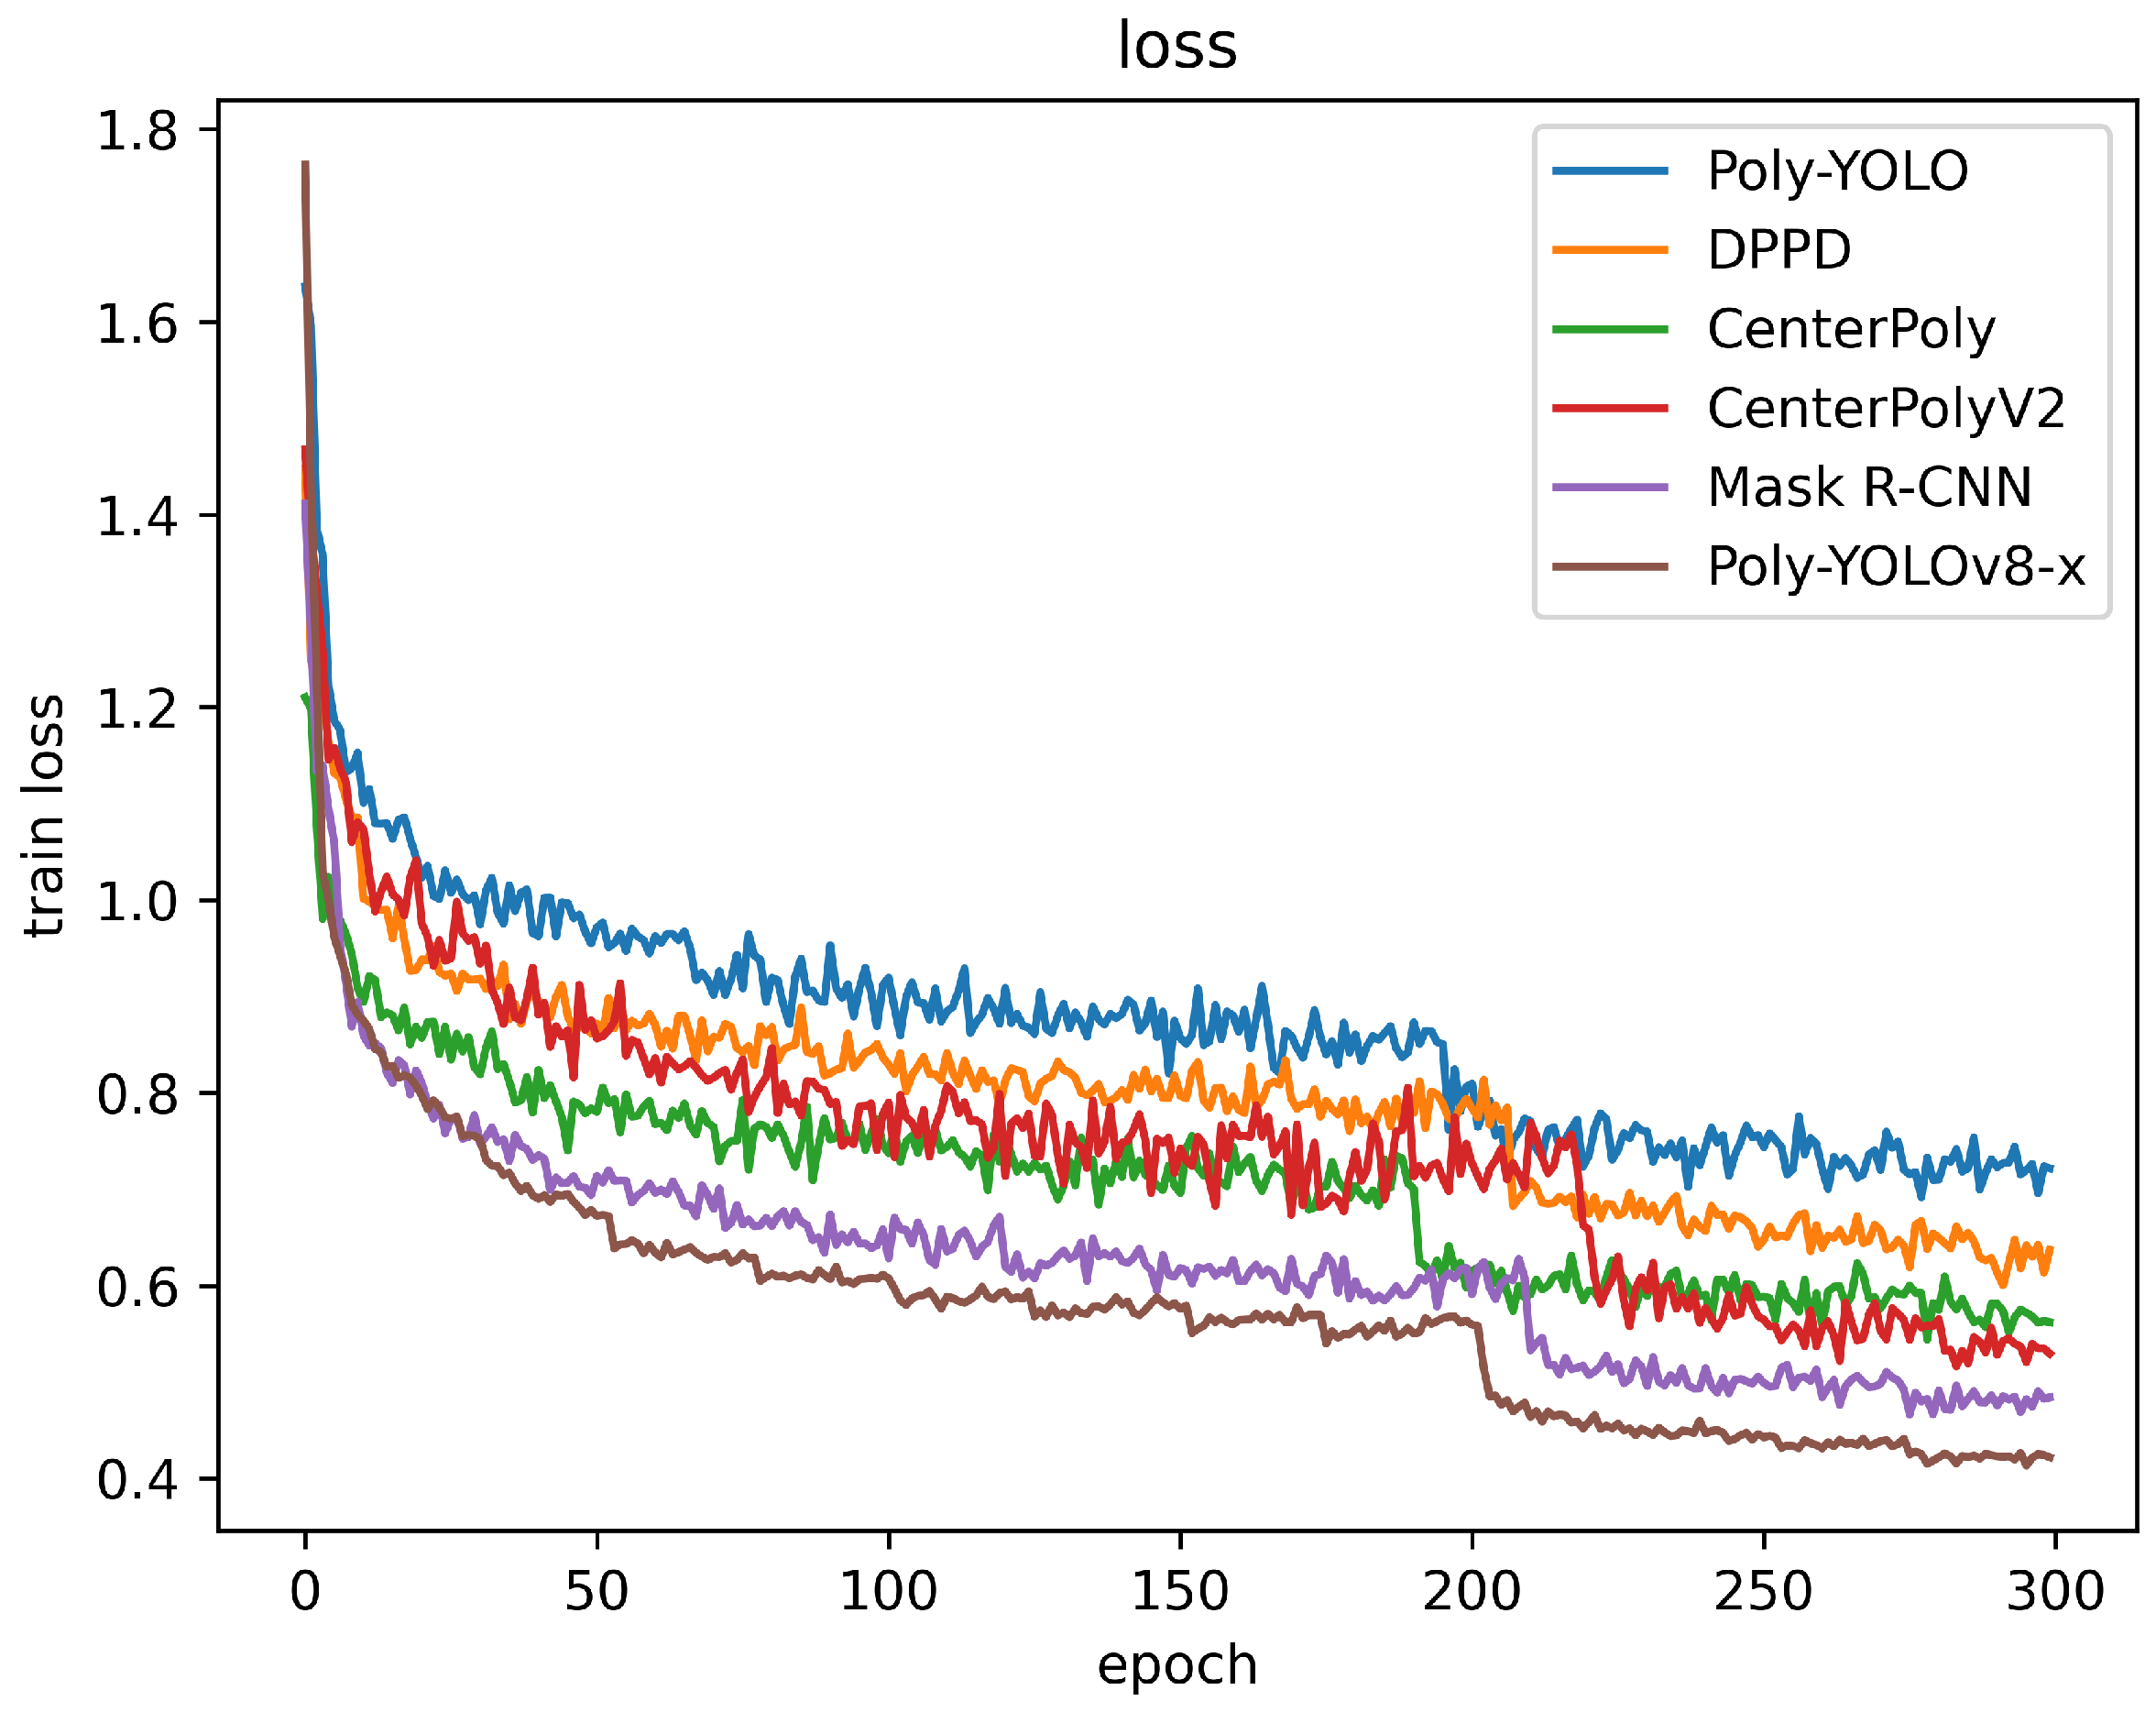
Table 3 lists the experiment results of the Poly-YOLOv8-x and the baseline models, including the P (Precision), R (Recall), and mAP. Meanwhile, a comparative analysis was conducted in the loss functions of the six models, and the corresponding change curves were plotted, as shown in Figure 5. Comprehensively considering Table 3 and Figure 5, the comparison results of each model are analyzed as follows:
- As seen in Table 3, the detection performance of the model gradually increased from Poly-YOLO to Poly-YOLOv8-x. Compared with Mask R-CNN, the various metrics of Poly-YOLOv8-x were improved by 5.54%, 2.67%, 1.57%, and 3.93%, respectively, reflecting that the Poly-YOLOv8-x model is more powerful in detecting pest-infected regions. It suggested that the Poly-YOLOv8-x can better extract the shape features of those regions than the baseline models.
- Compared with traditional polygon object detection models (Poly-YOLO, DPPD, CenterPoly, CenterPolyV2), Poly-YOLOv8-x had an advantage in accuracy, which suggested that the new polygon detection head was effective in predicting pest-infected regions. Compared to CenterPoly and CenterPolyV2, the improved loss calculation method enhanced the model’s ability to learn the shape features of pest-infected regions rather than only fitting the order coordinates of region vertices. Overall, the evaluation metrics of the Poly-YOLOv8-x were higher than the baseline models. The improved Poly-YOLOv8-x had more robust polygon object detection abilities, achieving higher and more stable detection performance in complex scenarios.
- As can be seen from Figure 5, the improved Poly-YOLOv8-x fluctuates less when converging. This indicated that our model had better robustness and faster convergence. Simultaneously, our improved loss calculation method effectively focuses on the shape features of pest-infected regions. In summary, compared with baseline models, the Poly-YOLOv8-x had better detection performance on the corn leaves.
We designed experiments to compare the five different scale models of the Poly-YOLOv8 series, and the results are shown in Table 4. Analyzing Table 4, we found that the parameter scale limited the Poly-YOLOv8-n model, which had weaker detection abilities. Meanwhile, compared with other baseline models in Table 3, Poly-YOLOv8-n had no advantage in the accuracy of pest-infected region detection. Additionally, the Poly-YOLOv8-s and Poly-YOLOv8-m balanced the amount of parameters and detection effects, thereby achieving competitive performance with the baseline models. The and metrics of Poly-YOLOv8-l were slightly higher than those of Poly-YOLOv8-m, but the parameters increased by nearly 70%. The speed and parameter volume of the Poly-YOLOv8-x model further increased, but the mAP improvement was limited. The overall trend showed that the parameter volume of the model was positively correlated with the accuracy, where Poly-YOLOv8-x had the best detection effect.
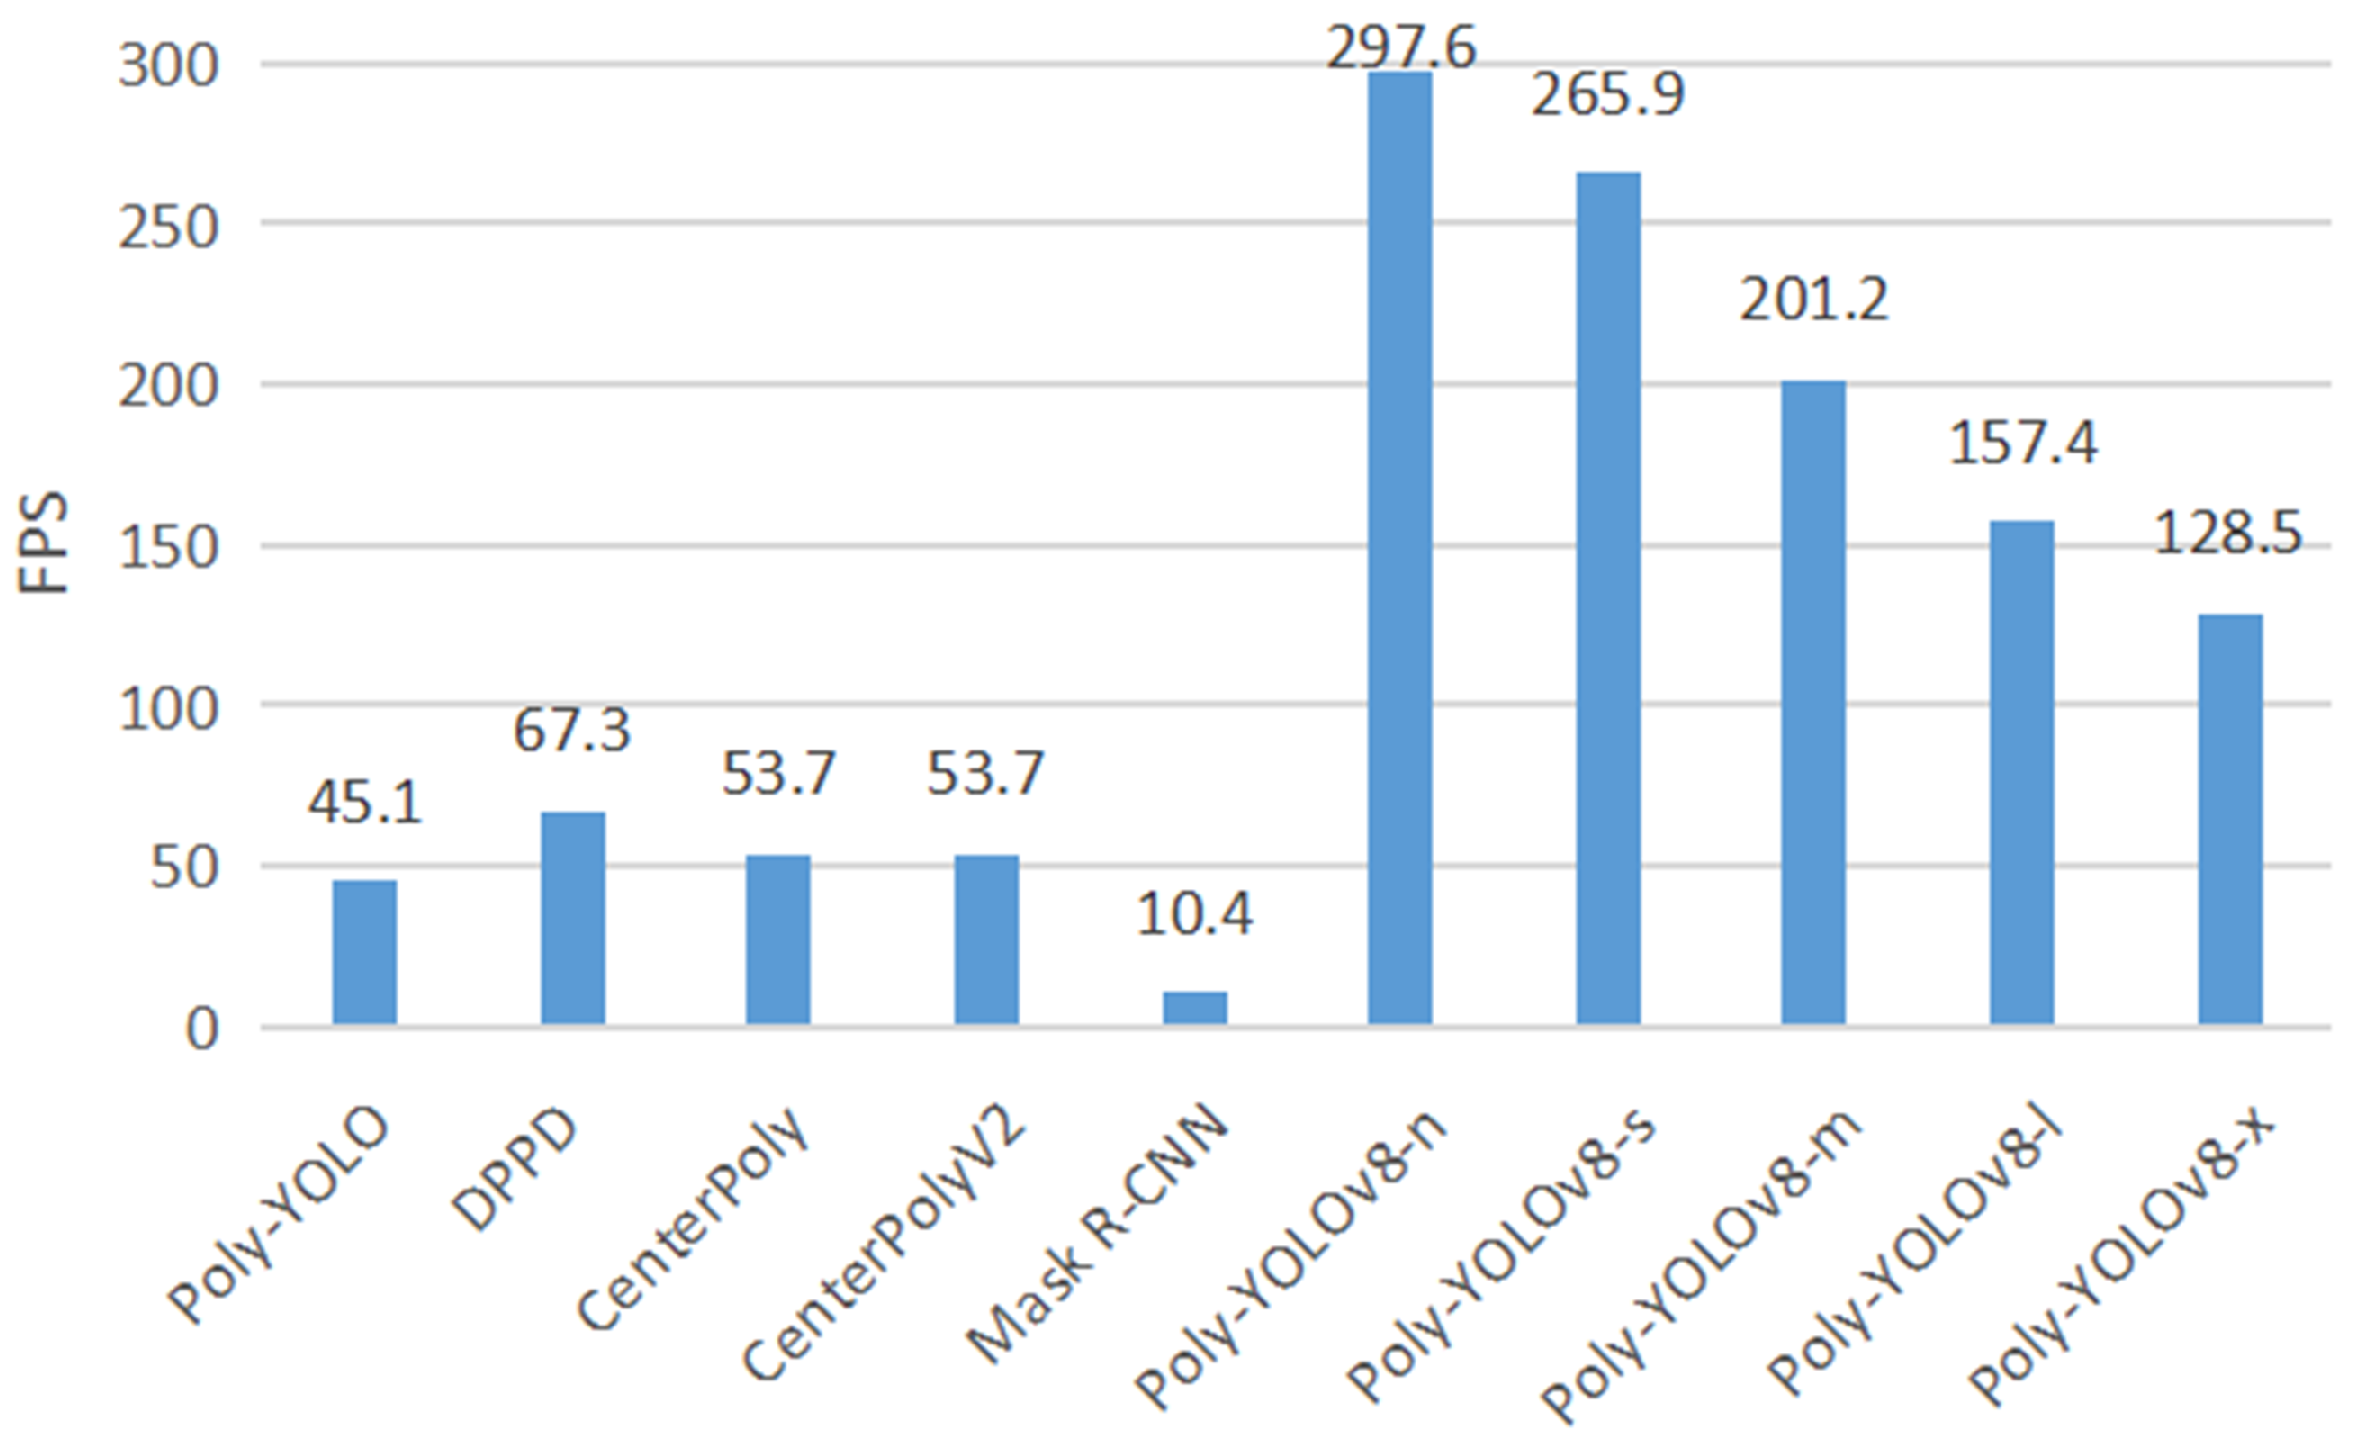
The FPS is the number of images processed per second, which can intuitively reflect the speed of a model and is a key metric to measure inference speed. The comparison between the FPS metric of different models is shown in Figure 6. The FPS of the Mask R-CNN model was less than 15, making it unsuitable as a real-time detection solution. Although the FPS of Poly-YOLO, DPPD, CenterPoly, and CenterPolyV2 satisfied real-time requirements, their speed was insufficient to detect complex real-time detection. The improved Poly-YOLOv8 series models had an obvious advantage in detection speed. Especially the model with the largest number of parameters, Poly-YOLOv8-x, could also reach 128.5 FPS. This showed that the improved Poly-YOLOv8 series models effectively balanced accuracy and detection speed, making them suitable for complex real-time detection.
4.6. Ablation Experiment
To comprehensively evaluate the impact of order-insensitive loss on model performance, we conducted ablation experiments on Poly-YOLOv8 at different parameter scales. The results of the experiment are shown in Table 5. By analyzing Table 5, we found that in all models of different parameter volumes, both increased and after introducing the improved loss calculation method. This proved that order-insensitive loss could enhance the ability of models to extract features from the pest-infected regions. Using order-insensitive loss, the improvement in the was more significant, which suggested that order-insensitive loss allows the model to focus on learning object shape features rather than coordinate point order features. Especially on large-scale models Poly-YOLOv8-l and Poly-YOLOv8-x, the improvement was significant, at 2.01% and 1.9%, respectively. The results suggested that the order-insensitive loss has better gain effects on Poly-YOLOv8 with larger parameter scales and stronger feature extraction capabilities.
4.7. Overall Experimental Analysis
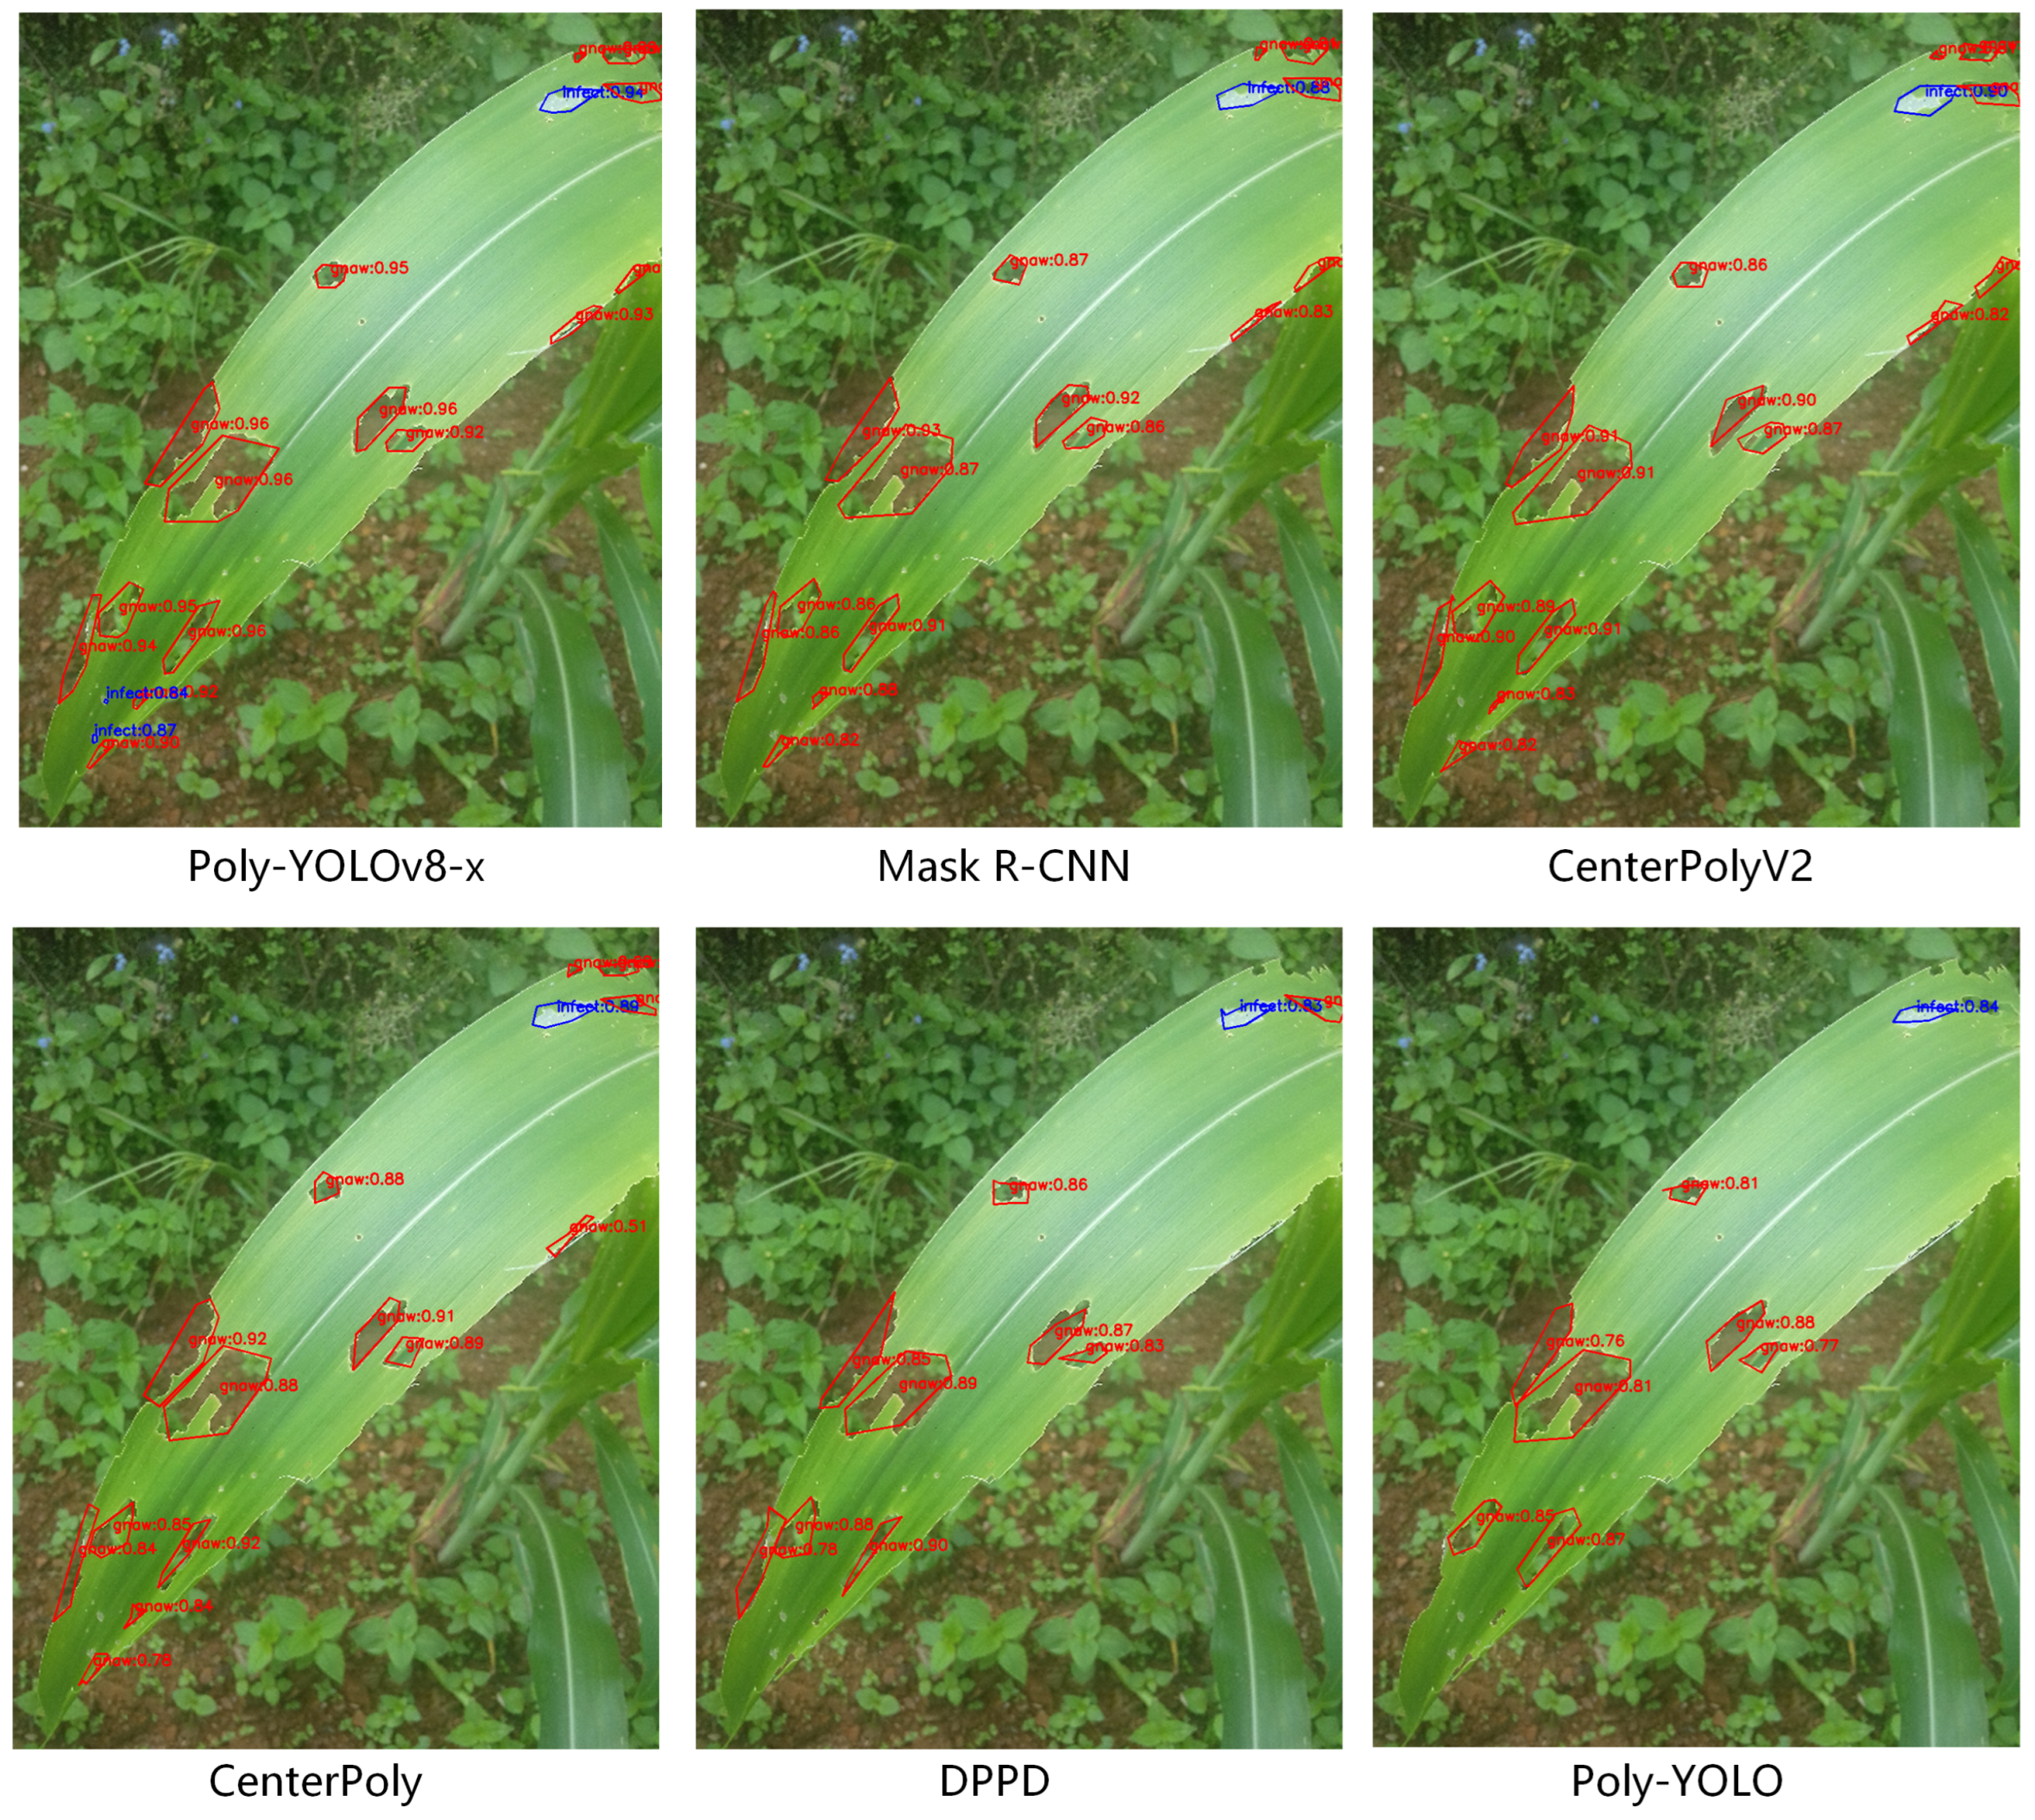
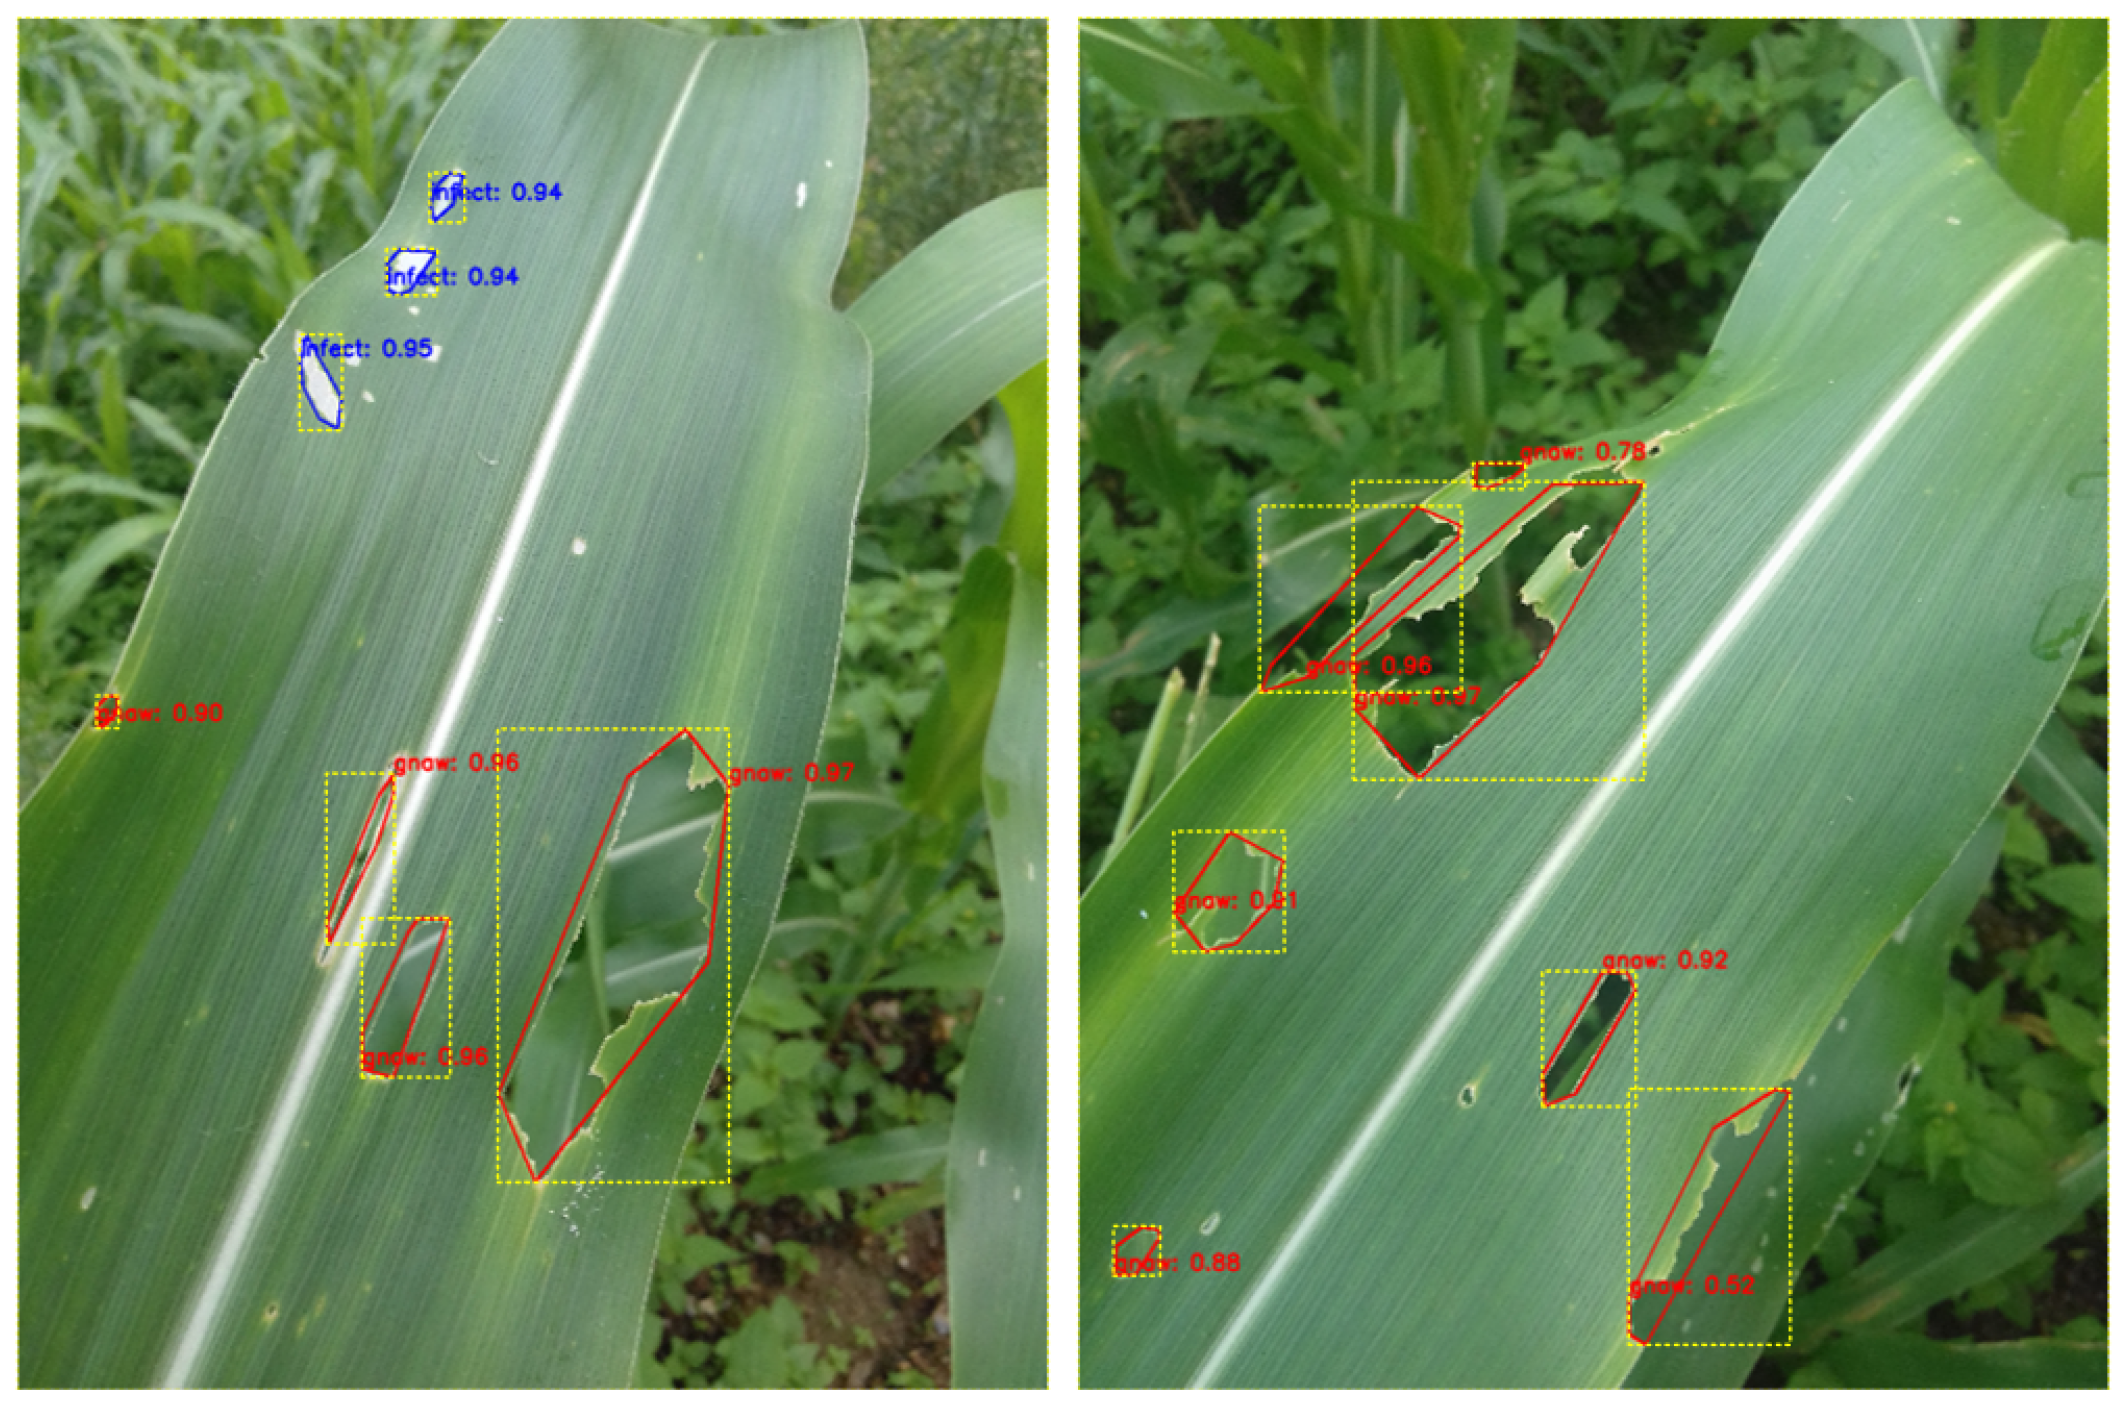
To visually compare the detection ability of different models, we show the detection results in Figure 7. It can be seen from the fig that Poly-YOLOv8-x could detect small pest-infected regions, which suggested that the detection performance of Poly-YOLOv8-x was better than baseline models for small pest-infected regions. The experiment results reflected that using a perimeter-based scaling factor helps adjust the weight of large and small objects in the overall loss. This prevents the overemphasis on the loss from large objects, which could cause the model to focus on learning from large pest-infected regions while disregarding small pest-infected regions. Meanwhile, the Poly-YOLOv8-x accurately detected the pest-infected regions on the leaf edge, indicating that the improved loss calculation method effectively enhanced the detection ability for object boxes. Additionally, regarding the confidence of detected pest-infected regions, Poly-YOLOv8-x had an obvious advantage over baseline models.
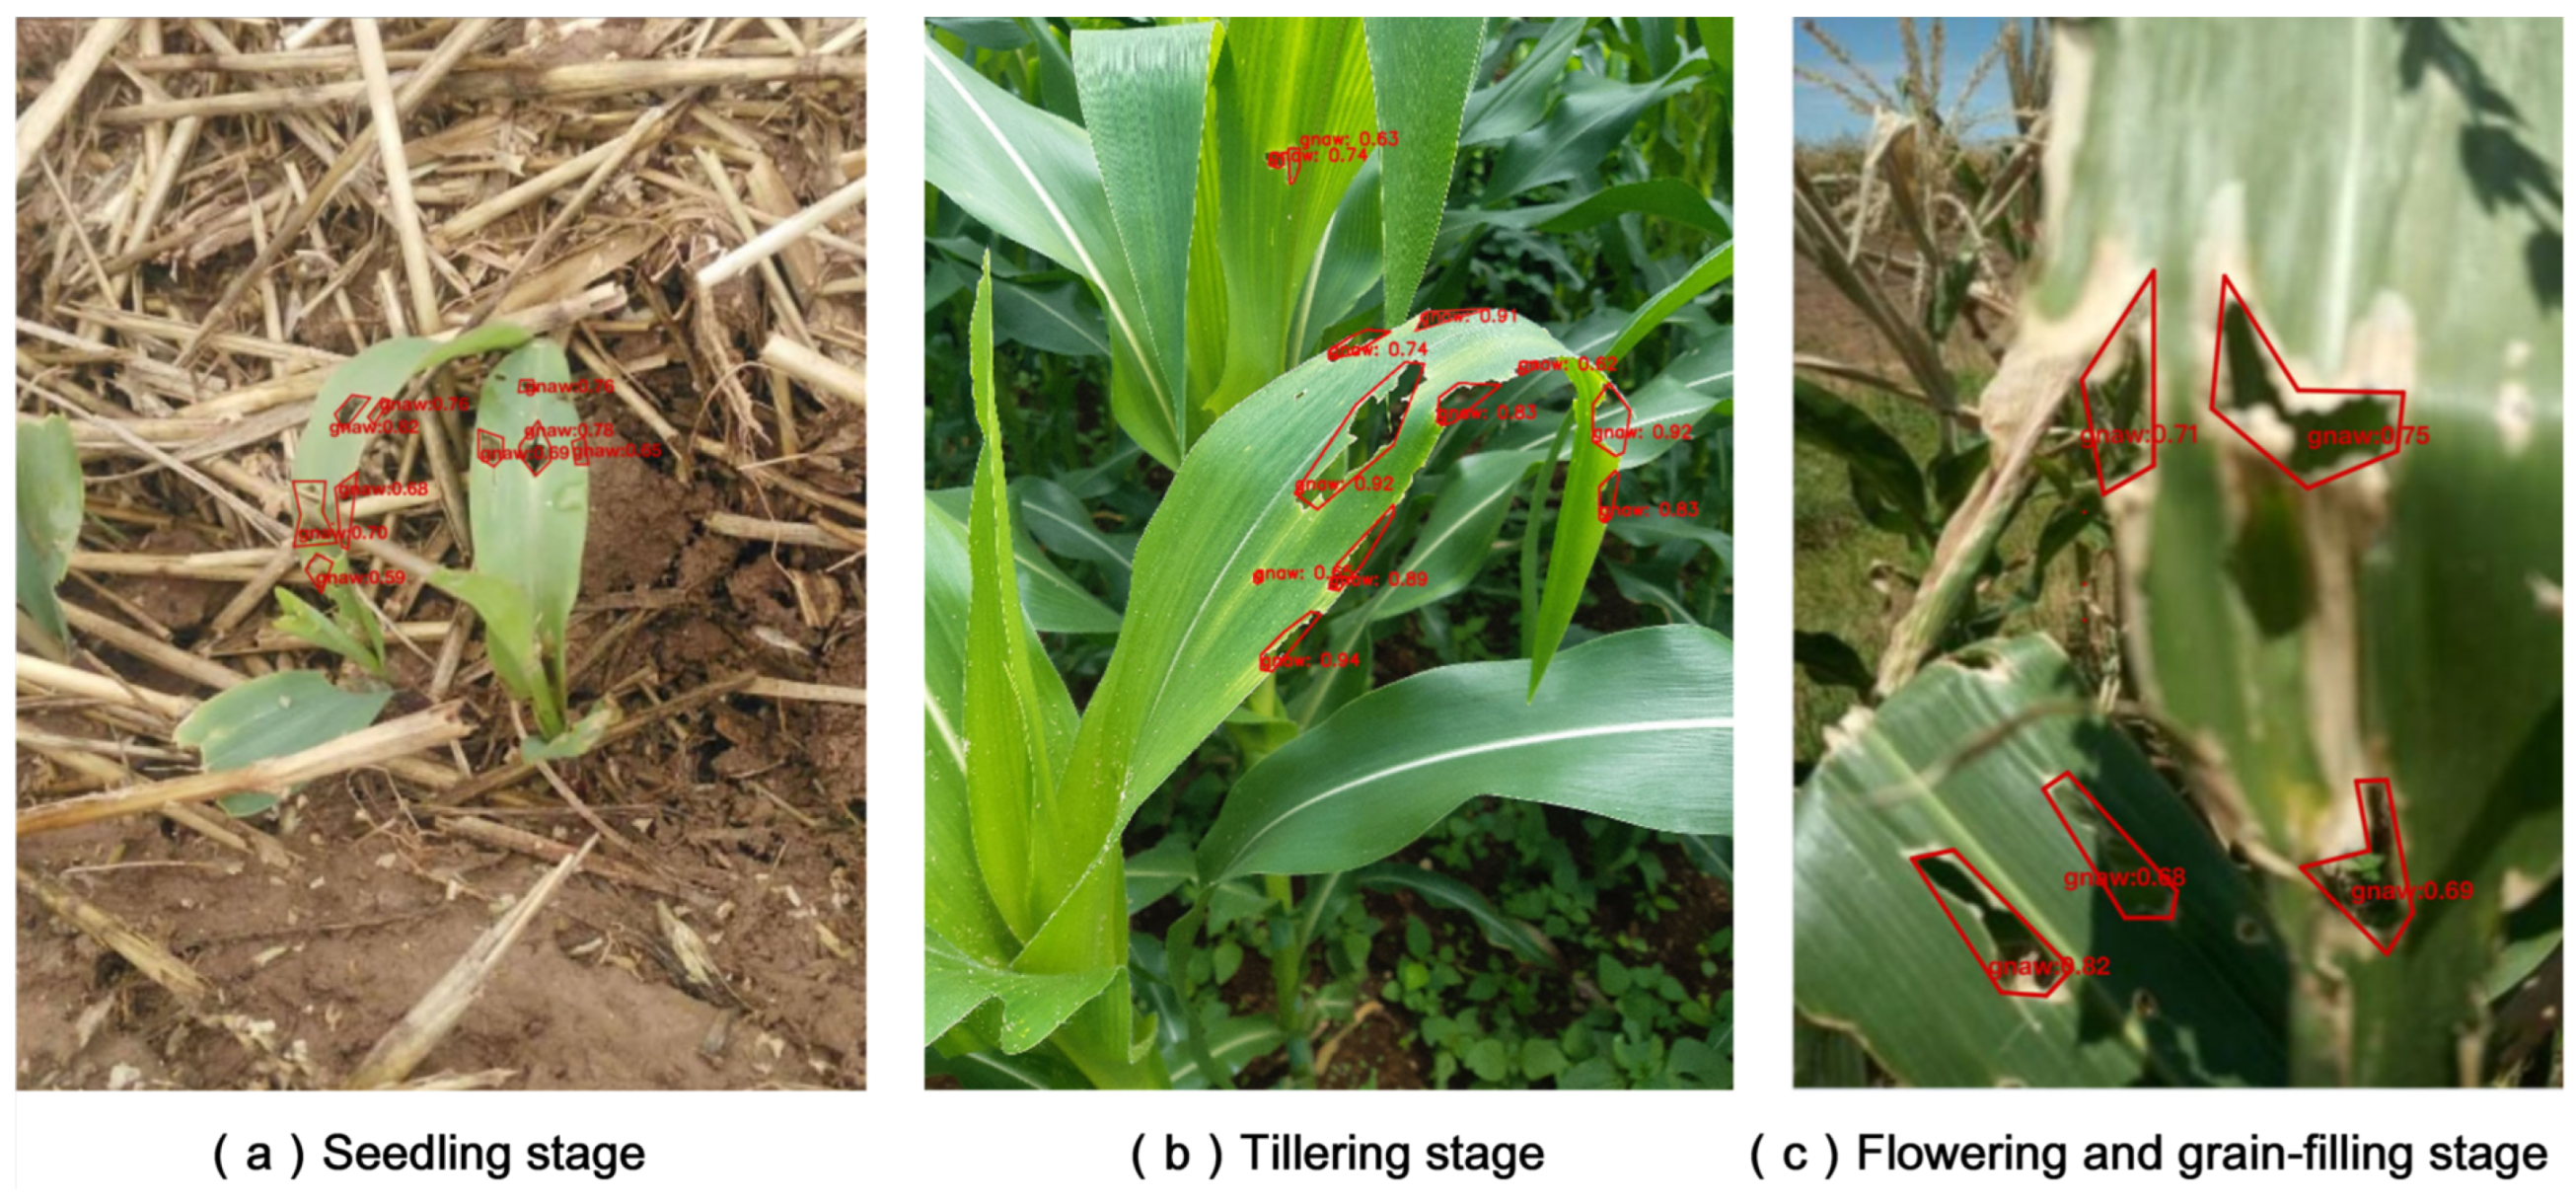
Moreover, to evaluate the detection capability of Poly-YOLOv8 in different corn growth stages, we divided the corn growth cycle into three stages: the seeding stage, the tillering stage, and the flowering and grain-filling stage. The detection results are shown in Figure 8. The results indicated that Poly-YOLOv8 can effectively detect pest-infected regions in three stages of corn growth. It does not specifically rely on a particular growth stage of corn. Moreover, our images were sourced from two types of pest infection (Spodoptera frugiperda and Mythimna separata). The purpose of Poly-YOLOv8 is to detect the degree of damage on the corn leaves. Therefore, Poly-YOLOv8 has the ability to detect pest-infected regions when damage caused by other pests is similar to regions labeled as the infect and gnaw in the PolyCorn. However, considering the varying larval forms of different pests, the effectiveness of our model may be compromised when detecting the gather regions. This will be a key focus of our future research.
Additionally, we showed the results of polygon detection and rectangular detection in Figure 9. We found that the traditional rectangular bounding box contains many healthy corn leaf regions, especially for elongated pest-infected regions. When detecting dense regions, rectangular bounding boxes were easy to overlap, making it ineffective to detect and evaluate true pest-infected regions. Compared to rectangular bounding boxes, polygon bounding boxes were more closely related to true pest-infected regions. Even in dense regions, it could effectively detect pest-infected regions and significantly reduce overlapping problems.
Through the above analysis, the Poly-YOLOv8-x was powerful in detecting pest-infected regions. The experiment results showed that the polygon detection head could effectively extract features of the detection object. Additionally, the improved loss calculation method enhanced the extraction ability of small object features. A comparative analysis of Table 4 and Figure 6 indicates that baseline models have an imbalance between detection accuracy and speed. In baseline models, Mask R-CNN demonstrates high detection precision (the is ) but has low detection speed (the is 10.4). Conversely, the DPPD within the baseline model shows higher detection speed (the is 67.3) but lacks detection accuracy (the is ). Compared with baseline models, our proposed model achieved superior detection accuracy and speed performance. In conclusion, the improved Poly-YOLOv8-x could maintain high detection accuracy and speed in pest-infected regions, satisfying the real-time detection requirements.
These experimental results are insightful for future research and practical applications in pest-infected region detection. We should consider balancing the detection accuracy and speed in practical applications of pest-infected regions. Therefore, future studies could focus on optimizing both aspects concurrently. Enabling timely intervention through accurate and fast detection, a well-balanced model can enhance overall pest management strategies, thereby mitigating losses associated with corn pests.
5. Conclusions
To improve the ability of polygon pest-infected region detection, we proposed a novel object detection model based on YOLOv8, namely, Poly-YOLOv8. Firstly, to detect the corn leaf pest-infected region, we constructed a dataset annotated with polygons, PolyCorn. Secondly, we improved the polygon object detection method by designing a new order-insensitive regression loss calculation algorithm, which solves the problem of over-consideration point order in calculating the polygon regression loss. This improvement enhanced the feature extraction ability and overall robustness. Additionally, to improve the detection performance in small objects, we employed loss scaling with the perimeter factor to balance the losses of different scale objects. Finally, the experiment results demonstrated the effectiveness of the Poly-YOLOv8 series models in pest-infected regions detection, and the result of Poly-YOLOv8-x was superior to baseline models.
In future work, we will continue to explore the research of polygon object detection in agriculture. To enhance the classification ability of pest-infected regions, we will introduce graph neural networks to aggregate feature information and spatial information of the predicted points, thereby improving the model’s capability in classifying the predicted regions.
Author Contributions
Conceptualization, R.Z. and F.H.; methodology, R.Z.; software, R.Z.; validation, R.Z.; formal analysis, R.Z., F.H. and D.M.; investigation, R.Z.; resources, F.H.; data curation, R.Z.; writing—original draft preparation, R.Z.; writing—review and editing, R.Z. and F.H.; visualization, R.Z. and F.H.; supervision, F.H. and D.M.; project administration, F.H. and D.M.; funding acquisition, F.H. and D.M. All authors have read and agreed to the published version of the manuscript.
Funding
This work was supported by the Innovation Capability Improvement Project for Small and Medium-Sized Scientific and Technological Enterprises in Shandong Province (No. 2023TSGC0111 and No. 2023TSGC0587) and the Major Technological Innovation Project of Shandong Province (No. 2019JZZY020603).
Institutional Review Board Statement
Not applicable.
Data Availability Statement
The data presented in this study are available at https://github.com/meizi-eng/PolyCorn-Dataset and accessed on 23 July 2023.
Acknowledgments
The authors are very thankful to the editor and referees for their valuable comments and suggestions for improving the paper.
Conflicts of Interest
The authors declare no conflict of interest.
References
- Zaidi, S.S.A.; Ansari, M.S.; Aslam, A.; Kanwal, N.; Asghar, M.; Lee, B. A survey of modern deep learning based object detection models. Digit. Signal Process. 2022, 126, 103514. [Google Scholar] [CrossRef]
- Daneshwari, A.N.; Basavaraju, D.R. Corn leaf image classification based on machine learning techniques for accurate leaf disease detection. Int. J. Electr. Comput. Eng. 2022, 12, 2509. [Google Scholar]
- Gu, W.; Bai, S.; Kong, L. A review on 2D instance segmentation based on deep neural networks. Image Vis. Comput. 2022, 120, 104401. [Google Scholar] [CrossRef]
- Redmon, J.; Divvala, S.; Girshick, R.; Farhadi, A. You only look once: Unified, real-time object detection. In Proceedings of the IEEE Conference on Computer Vision and Pattern Recognition, Las Vegas, NV, USA, 27–30 June 2016; pp. 779–788. [Google Scholar]
- Diwan, T.; Anirudh, G.; Tembhurne, J.V. Object detection using YOLO: Challenges, architectural successors, datasets and applications. Multimed. Tools Appl. 2023, 82, 9243–9275. [Google Scholar] [CrossRef] [PubMed]
- Girshick, R.; Donahue, J.; Darrell, T.; Malik, J. Rich feature hierarchies for accurate object detection and semantic segmentation. In Proceedings of the IEEE Conference on Computer Vision and Pattern Recognition, Columbus, OH, USA, 23–28 June 2014; pp. 580–587. [Google Scholar]
- Girshick, R. Fast r-cnn. In Proceedings of the IEEE International Conference on Computer Vision, Santiago, Chile, 7–13 December 2015; pp. 1440–1448. [Google Scholar]
- Ren, S.; He, K.; Girshick, R.; Sun, J. Faster r-cnn: Towards real-time object detection with region proposal networks. Adv. Neural Inf. Process. Syst. 2015, 28. [Google Scholar] [CrossRef] [PubMed]
- He, K.; Gkioxari, G.; Dollár, P.; Girshick, R. Mask r-cnn. In Proceedings of the IEEE International Conference on Computer Vision, Venice, Italy, 22–29 October 2017; pp. 2961–2969. [Google Scholar]
- Jiao, L.; Xie, C.; Chen, P.; Du, J.; Li, R.; Zhang, J. Adaptive feature fusion pyramid network for multi-classes agricultural pest detection. Comput. Electron. Agric. 2022, 195, 106827. [Google Scholar] [CrossRef]
- Rahman, C.R.; Arko, P.S.; Ali, M.E.; Khan, M.A.I.; Apon, S.H.; Nowrin, F.; Wasif, A. Identification and recognition of rice diseases and pests using convolutional neural networks. Biosyst. Eng. 2020, 194, 112–120. [Google Scholar] [CrossRef]
- Selvaraj, M.G.; Vergara, A.; Ruiz, H.; Safari, N.; Elayabalan, S.; Ocimati, W.; Blomme, G. AI-powered banana diseases and pest detection. Plant Methods 2019, 15, 1–11. [Google Scholar] [CrossRef]
- Wang, Q.; Qi, F.; Sun, M.; Qu, J.; Xue, J. Identification of tomato disease types and detection of infected areas based on deep convolutional neural networks and object detection techniques. Comput. Intell. Neurosci. 2019, 2019, 9142753. [Google Scholar] [CrossRef]
- Xie, X.; Ma, Y.; Liu, B.; He, J.; Li, S.; Wang, H. A deep-learning-based real-time detector for grape leaf diseases using improved convolutional neural networks. Front. Plant Sci. 2020, 11, 751. [Google Scholar] [CrossRef]
- Liu, W.; Anguelov, D.; Erhan, D.; Szegedy, C.; Reed, S.; Fu, C.Y.; Berg, A.C. Ssd: Single shot multibox detector. In Proceedings of the Computer Vision–ECCV 2016: 14th European Conference, Amsterdam, The Netherlands, 11–14 October 2016; Proceedings, Part I 14. Springer: Berlin/Heidelberg, Germany, 2016; pp. 21–37. [Google Scholar]
- Liu, J.; Wang, X. Tomato diseases and pests detection based on improved Yolo V3 convolutional neural network. Front. Plant Sci. 2020, 11, 898. [Google Scholar] [CrossRef]
- Liu, J.; Wang, X. Early recognition of tomato gray leaf spot disease based on MobileNetv2-YOLOv3 model. Plant Methods 2020, 16, 1–16. [Google Scholar] [CrossRef]
- Ganesan, G.; Chinnappan, J. Hybridization of ResNet with YOLO classifier for automated paddy leaf disease recognition: An optimized model. J. Field Robot. 2022, 39, 1085–1109. [Google Scholar] [CrossRef]
- Leng, S.; Musha, Y.; Yang, Y.; Feng, G. CEMLB-YOLO: Efficient Detection Model of Maize Leaf Blight in Complex Field Environments. Appl. Sci. 2023, 13, 9285. [Google Scholar] [CrossRef]
- Li, J.; Qiao, Y.; Liu, S.; Zhang, J.; Yang, Z.; Wang, M. An improved YOLOv5-based vegetable disease detection method. Comput. Electron. Agric. 2022, 202, 107345. [Google Scholar] [CrossRef]
- Qi, J.; Liu, X.; Liu, K.; Xu, F.; Guo, H.; Tian, X.; Li, M.; Bao, Z.; Li, Y. An improved YOLOv5 model based on visual attention mechanism: Application to recognition of tomato virus disease. Comput. Electron. Agric. 2022, 194, 106780. [Google Scholar] [CrossRef]
- Khan, F.; Zafar, N.; Tahir, M.N.; Aqib, M.; Waheed, H.; Haroon, Z. A mobile-based system for maize plant leaf disease detection and classification using deep learning. Front. Plant Sci. 2023, 14, 1079366. [Google Scholar] [CrossRef]
- Hurtik, P.; Molek, V.; Hula, J.; Vajgl, M.; Vlasanek, P.; Nejezchleba, T. Poly-YOLO: Higher speed, more precise detection and instance segmentation for YOLOv3. Neural Comput. Appl. 2022, 34, 8275–8290. [Google Scholar] [CrossRef]
- Perreault, H.; Bilodeau, G.A.; Saunier, N.; Héritier, M. Centerpoly: Real-time instance segmentation using bounding polygons. In Proceedings of the IEEE/CVF International Conference on Computer Vision, Montreal, BC, Canada, 11–17 October 2021; pp. 2982–2991. [Google Scholar]
- Jodogne-Del Litto, K.; Bilodeau, G.A. Real-time instance segmentation with polygons using an Intersection-over-Union loss. arXiv 2023, arXiv:2305.05490. [Google Scholar]
- Zheng, Y.; Andrienko, O.; Zhao, Y.; Park, M.; Pham, T. DPPD: Deformable Polar Polygon Object Detection. In Proceedings of the IEEE/CVF Conference on Computer Vision and Pattern Recognition, Vancouver, BC, Canada, 17–24 June 2023; pp. 78–87. [Google Scholar]
- Padilla, D.A.; Pajes, R.A.I.; De Guzman, J.T. Detection of corn leaf diseases using convolutional neural network with openmp implementation. In Proceedings of the 2020 IEEE 12th International Conference on Humanoid, Nanotechnology, Information Technology, Communication and Control, Environment, and Management (HNICEM), Manila, Philippines, 3–7 December 2020; pp. 1–6. [Google Scholar]
- Singh, U.P.; Chouhan, S.S.; Jain, S.; Jain, S. Multilayer convolution neural network for the classification of mango leaves infected by anthracnose disease. IEEE Access 2019, 7, 43721–43729. [Google Scholar] [CrossRef]
- Tang, Z.; Yang, J.; Li, Z.; Qi, F. Grape disease image classification based on lightweight convolution neural networks and channelwise attention. Comput. Electron. Agric. 2020, 178, 105735. [Google Scholar] [CrossRef]
- Stewart, E.L.; Wiesner-Hanks, T.; Kaczmar, N.; DeChant, C.; Wu, H.; Lipson, H.; Nelson, R.J.; Gore, M.A. Quantitative phenotyping of northern leaf blight in UAV images using deep learning. Remote Sens. 2019, 11, 2209. [Google Scholar] [CrossRef]
- Lin, K.; Gong, L.; Huang, Y.; Liu, C.; Pan, J. Deep learning-based segmentation and quantification of cucumber powdery mildew using convolutional neural network. Front. Plant Sci. 2019, 10, 155. [Google Scholar] [CrossRef] [PubMed]
- Wang, H.; Li, Y.; Dang, L.M.; Moon, H. An efficient attention module for instance segmentation network in pest monitoring. Comput. Electron. Agric. 2022, 195, 106853. [Google Scholar] [CrossRef]
- Li, X.; Zhou, Y.; Liu, J.; Wang, L.; Zhang, J.; Fan, X. The detection method of potato foliage diseases in complex background based on instance segmentation and semantic segmentation. Front. Plant Sci. 2022, 13, 899754. [Google Scholar] [CrossRef]
- Da Silva Vieira, G.; Rocha, B.M.; Fonseca, A.U.; de Sousa, N.M.; Ferreira, J.C.; Cabacinha, C.D.; Soares, F. Automatic detection of insect predation through the segmentation of damaged leaves. Smart Agric. Technol. 2022, 2, 100056. [Google Scholar] [CrossRef]
- Lin, T.Y.; Maire, M.; Belongie, S.; Hays, J.; Perona, P.; Ramanan, D.; Dollár, P.; Zitnick, C.L. Microsoft coco: Common objects in context. In Proceedings of the Computer Vision–ECCV 2014: 13th European Conference, Zurich, Switzerland, 6–12 September 2014; Proceedings, Part V 13. Springer: Berlin/Heidelberg, Germany, 2014; pp. 740–755. [Google Scholar]
- Cordts, M.; Omran, M.; Ramos, S.; Rehfeld, T.; Enzweiler, M.; Benenson, R.; Franke, U.; Roth, S.; Schiele, B. The cityscapes dataset for semantic urban scene understanding. In Proceedings of the IEEE Conference on Computer Vision and Pattern Recognition, Las Vegas, NV, USA, 27–30 June 2016; pp. 3213–3223. [Google Scholar]
- Varma, G.; Subramanian, A.; Namboodiri, A.; Chandraker, M.; Jawahar, C. IDD: A dataset for exploring problems of autonomous navigation in unconstrained environments. In Proceedings of the 2019 IEEE Winter Conference on Applications of Computer Vision (WACV), Waikoloa, HI, USA, 7–11 January 2019; pp. 1743–1751. [Google Scholar]
Figure 1.
Part (a) shows examples of traditional object annotations, and part (b) shows ineffective instance segmentation of pest-infected regions. Specially, part (c) illustrates our polygon object annotations.
Figure 1.
Part (a) shows examples of traditional object annotations, and part (b) shows ineffective instance segmentation of pest-infected regions. Specially, part (c) illustrates our polygon object annotations.

Figure 2.
The structure of the Poly-YOLOv8 model.

Figure 3.
Part (a) shows that the traditional polygon calculation of regression loss overly considers the influence of the predicted object point order on the model. Therefore, we proposed an order-insensitive regression loss calculation algorithm in part (b). Additionally, part (c) shows the (Intersection over Union) of images.

Figure 4.
Images of the three categories of pest-infected regions on corn leaves.

Figure 5.
The loss curve of models.

Figure 6.
FPS metrics among different models.

Figure 7.
The detection results for Poly-YOLOv8-x and baseline models.

Figure 8.
The detection results for different corn growth stages.

Figure 9.
Comparison of polygon detection and rectangular detection results.


Table 1.
Hyper-parameter settings table.
| Parameters | Setup |
|---|---|
| Epochs | 300 |
| Batch Size | 16 |
| Image Size | |
| Optimizer | SGD |
| Momentum | 0.937 |
| Weight Decay | |
| Initial Learning Rate | |
| Final Learning Rate | |
| Save Period | 10 |
| Image Scale | 0.5 |
| Image Flip Left-Right | 0.5 |
| Mosaic | 1.0 |
| Image Translation | 0.1 |
| NMS IoU | 0.7 |
| w |
Table 2.
Baseline models information.
| Ref. | Models | Datasets |
| [9] | Mask R-CNN | COCO [35] |
| [23] | Poly-YOLO | Simulator, Cityscapes [36], and IDD [37] |
| [26] | DPPD | Cityscapes and Crosswalk |
| [24] | CenterPoly | Cityscapes, KITTI, and IDD |
| [25] | CenterPolyV2 | Cityscapes and IDD |
| Ref. | Contributions | Remarks |
| [9] | Using mask mechanism | Slow training and detection |
| [23] | Using YOLOv3 for detection | Poor performance and slow detection |
| [26] | Using the deformable polygon detection | Detection with a fixed number of vertices |
| [24] | Using central polygon method | Relies on a pre-defined center key point |
| [25] | Using the improved regression loss | Overfitting the coordinate order loss |
Table 3.
Comparison results of models.
| Model | P | R | ||
|---|---|---|---|---|
| Poly-YOLO | 60.64% | 52.36% | 54.46% | 31.85% |
| DPPD | 64.23% | 56.54% | 60.38% | 38.46% |
| CenterPoly | 66.67% | 58.61% | 62.35% | 40.58% |
| CenterPolyV2 | 67.57% | 59.36% | 63.82% | 42.64% |
| Mask R-CNN | 69.34% | 62.16% | 65.69% | 44.21% |
| Poly-YOLOv8-x | 74.88% | 64.83% | 67.26% | 48.14% |
Table 4.
Comparison results of YOLOv8 series models.
| Model | Parameters | ||
|---|---|---|---|
| Poly-YOLOv8-n | 60.74% | 37.90% | 3.25 M |
| Poly-YOLOv8-s | 64.36% | 42.15% | 11.78 M |
| Poly-YOLOv8-m | 66.02% | 45.76% | 27.22 M |
| Poly-YOLOv8-l | 66.75% | 46.43% | 45.91 M |
| Poly-YOLOv8-x | 67.26% | 48.14% | 71.72 M |
Table 5.
The results of the ablation experiment.
| Model | Order-Insensitive Loss | ||
|---|---|---|---|
| Poly-YOLOv8-n | ✘ | 59.96% | 36.04% |
| Poly-YOLOv8-s | ✘ | 63.89% | 40.48% |
| Poly-YOLOv8-m | ✘ | 65.61% | 43.91% |
| Poly-YOLOv8-l | ✘ | 65.93% | 44.42% |
| Poly-YOLOv8-x | ✘ | 66.48% | 46.24% |
| Poly-YOLOv8-n | ✔ | 60.74% | 37.90% |
| Poly-YOLOv8-s | ✔ | 64.36% | 42.15% |
| Poly-YOLOv8-m | ✔ | 66.02% | 45.76% |
| Poly-YOLOv8-l | ✔ | 66.75% | 46.43% |
| Poly-YOLOv8-x | ✔ | 67.26% | 48.14% |
Disclaimer/Publisher’s Note: The statements, opinions and data contained in all publications are solely those of the individual author(s) and contributor(s) and not of MDPI and/or the editor(s). MDPI and/or the editor(s) disclaim responsibility for any injury to people or property resulting from any ideas, methods, instructions or products referred to in the content. |
© 2023 by the authors. Licensee MDPI, Basel, Switzerland. This article is an open access article distributed under the terms and conditions of the Creative Commons Attribution (CC BY) license (https://creativecommons.org/licenses/by/4.0/).
Share and Cite
MDPI and ACS Style
Zhu, R.; Hao, F.; Ma, D. Research on Polygon Pest-Infected Leaf Region Detection Based on YOLOv8. Agriculture 2023, 13, 2253. https://0-doi-org.brum.beds.ac.uk/10.3390/agriculture13122253
AMA Style
Zhu R, Hao F, Ma D. Research on Polygon Pest-Infected Leaf Region Detection Based on YOLOv8. Agriculture. 2023; 13(12):2253. https://0-doi-org.brum.beds.ac.uk/10.3390/agriculture13122253
Chicago/Turabian StyleZhu, Ruixue, Fengqi Hao, and Dexin Ma. 2023. "Research on Polygon Pest-Infected Leaf Region Detection Based on YOLOv8" Agriculture 13, no. 12: 2253. https://0-doi-org.brum.beds.ac.uk/10.3390/agriculture13122253
Note that from the first issue of 2016, this journal uses article numbers instead of page numbers. See further details here.